abstract title of thesis: the use of vision in …
TRANSCRIPT

ABSTRACT
Title of thesis: THE USE OF VISION IN CHILDREN’S POSTURAL CONTROL
Stephen J. Kim, Master of Arts, 2004 Thesis directed by: Professor Jane E. Clark Department of Kinesiology
The purpose of the current thesis was to characterize age-related changes in
postural control with variations in the properties of a dynamic visual stimulus. In the first
study, seven 4-year-olds, seven 6-year-olds, and seven adults were presented with a
visual stimulus that oscillated at 0.1, 0.3, and 0.5 Hz. Results showed the postural
response amplitude and timing depended upon stimulus frequency and a reduction in the
amplitude response variability indicated increased response precision with age. In the
second study, ten 4-year-olds, ten 6-year-olds, and ten adults were presented with a visual
stimulus that oscillated at 0.3 Hz, with amplitudes of 0, 2, 5, and 8 mm. The results
characterized the response as a utilization of sensory information for postural control,
with increased response precision with age. These findings indicate that the visuomotor
coordination needed for postural control shows age-related improvements, consistent
with the notion of a response tuning.

The Use of Vision in Children’s Postural Control
by
Stephen J. Kim
Thesis submitted to the Faculty of the Graduate School of the University of Maryland, College Park in partial fulfillment
of the requirements for the degree of Master of Arts
2004
Advisory Committee: Professor Jane E. Clark, Advisor Assistant Professor José L. Contreras-Vidal Associate Professor John J. Jeka

Copyright by
Stephen J. Kim
2004

ii
ACKNOWLEDGMENTS
I would like to thank the many people who have helped me along the way:
• All the children, their parents and adult participants for contributing their
time and effort to this study.
• Jane E. Clark for being my advisor and friend, who is always on my side.
• Li-Chiou Chen, Kaleb McDowell, Jason Metcalfe, and Kelvin Oie for
their invaluable contributions in every aspect of this study.
• Woei-Nan Bair, Jin Bo, Tzy-Yun Chang, and Jane Jung-Potter who have
always been helpful and dependable.
• John J. Jeka and José L. Contreras-Vidal for serving on my advisory
committee.
• Chris Avon, Jason Grubb and Jill Mann who have contributed their time
for data collection.
• Especially, my parents, for always supporting me and for the sushi lunch
during the thesis defense.

iii
TABLE OF CONTENTS
LIST OF FIGURES............................................................................................................. v
CHAPTER I: Introduction ................................................................................................. 1
CHAPTER II: Liturature Review....................................................................................... 4
Postural Control....................................................................................................... 4 The Influence of Vision on Posture......................................................................... 6
Eyes open vs. Eyes closed........................................................................... 6 Dynamic Visual Stimulus............................................................................ 7
The Development of Posture: The Effects of Tuning to Visual Information........ 10 Summary ............................................................................................................... 14
CHAPTER III: Age-Related Changes in the Use of Vision for Postural Control: The
Effects of Varying Frequency ........................................................................................... 15
Introduction ........................................................................................................... 15 Method .................................................................................................................. 18
Participants ................................................................................................ 18 Experimental Set-Up................................................................................. 19 Procedure................................................................................................... 20 Analysis..................................................................................................... 21
Measures........................................................................................ 21 Statistical Analysis ........................................................................ 23
Results ................................................................................................................... 24 Stimulus Response .................................................................................... 24
Amplitude...................................................................................... 24 Timing ........................................................................................... 26
Variability of the Response ....................................................................... 27 Amplitude variability .................................................................... 27 Sway variability............................................................................. 31
Discussion ............................................................................................................. 32 Response to the dynamic visual stimulus.................................................. 33 Prospective control .................................................................................... 35 Postural response tuning............................................................................ 36 Summary ................................................................................................... 37
CHAPTER IV: Age-Related Changes in the Use of Vision for Postural Control: The
Effects of Varying Amplitude ........................................................................................... 39
Introduction ........................................................................................................... 39 Method .................................................................................................................. 43
Participants ................................................................................................ 43 Experimental Set-Up................................................................................. 44 Experimental Design ................................................................................. 46 Procedure................................................................................................... 46 Data Analysis ............................................................................................ 47
Measures........................................................................................ 47

iv
Statistical Analysis ........................................................................ 50 Results ................................................................................................................... 50
The moving room response: Is it real? ...................................................... 50 Amplitude response....................................................................... 50 Timing response ............................................................................ 55
Perception/action tuning............................................................................ 57 Amplitude variability .................................................................... 57 Timing variability.......................................................................... 60 Sway variability............................................................................. 62
Discussion ............................................................................................................. 63 Moving Room Response: Is It Real?......................................................... 64 Sensory Information: How is it being used? ............................................. 65 Tuning of the postural response ................................................................ 68 Summary ................................................................................................... 69
Chapter V: General Discussion ...................................................................................... 70
Chapter VI: Future Studies............................................................................................. 72
APPENDIX A: Consent Forms (Experiment 1) .............................................................. 75
APPENDIX B: Consent Forms (Experiment 2)............................................................... 78
APPENDIX C: Summary of Data (Experiment 1) .......................................................... 81
APPENDIX D: Summary of Data (Experiment 2) .......................................................... 88
Reference List……………………………………………………………………………97

v
LIST OF FIGURES
Experiment 1
1. Experimental Setup………………………………………………………………24 2. Gain vs. Frequency
a. Head……………………………………………………………………...30 b. CoM……………………………………………………………………...30
3. Phase vs. Frequency a. Head……………………………………………………………………...31 b. CoM……………………………………………………………………...32
4. Gain Variability vs. Frequency a. Head……………………………………………………………………...33 b. CoM……………………………………………………………………...34
5. Phase Variability vs. Frequency a. Head……………………………………………………………………...35 b. CoM……………………………………………………………………...35
6. residsway vs. Frequency a. Head……………………………………………………………………...36 b. CoM……………………………………………………………………...37
Experiment 2
1. Experimental Setup………………………………………………………………50 2. Gain vs. Amplitude
a. Head……………………………………………………………………...57 b. CoM……………………………………………………………………...57
3. SFSA vs. Amplitude a. Head……………………………………………………………………...59 b. CoM……………………………………………………………………...60
4. Phase vs. Amplitude a. Head……………………………………………………………………...61 b. CoM……………………………………………………………………...61
5. Gain Variability vs. Amplitude a. Head……………………………………………………………………...62 b. CoM……………………………………………………………………...63
6. SFSA Variability vs. Amplitude a. Head……………………………………………………………………...64 b. CoM……………………………………………………………………...64
7. Phase Variability vs. Amplitude a. Head……………………………………………………………………...66 b. CoM……………………………………………………………………...66
8. residsway vs. Amplitude a. Head……………………………………………………………………...67 b. CoM……………………………………………………………………...68

1
CHAPTER I
INTRODUCTION
All movements such as sitting, crawling, walking and reaching are embedded
within a support structure provided by postural control. Postural control utilizes sensory
information from visual, vestibular and somatosensory inputs in an integrated fashion to
maintain a stable relationship between the body itself and the environment (Horak &
Macpherson, 1996). Researchers have conceptualized motor skill development as an
increased stabilization or coordination of this perception action relationship (Barela, Jeka,
& Clark, 2003; Bertenthal, Rose, & Bai, 1997; Metcalfe & Clark, 2000) and have
assessed this relationship by observing the effects of varying sensory input on movement
responses. One experimental paradigm that has been employed to characterize this
relationship is the “moving room” paradigm in which the effects of dynamic visual
stimulation on postural responses are studied.
In the moving room paradigm, a participant stands on a stationary floor where the
visual environment translates with respect to the floor. Movement of the room towards
the participant gives visual information suggesting forward sway, which elicits
compensatory sway in the direction of the room’s movement (Lishman & Lee, 1973).
Infants and even neonates have shown some directionally appropriate postural responses
to a dynamic visual stimulus, suggesting that they perceive optic flow information and
their sways are influenced by it (Delorme, Frigon, & Lagace, 1989; Foster, Sveistrup, &
Woollacott, 1996; Jouen, 1988; Butterworth & Hicks, 1977). Bertenthal et al. (1997)
showed improvements in the response to an oscillating visual stimulus with experience
and suggested that these changes lie within the ability to scale sensory information to the

2
motor response. These changes were evident in the increased precision to the dynamic
stimulus, described as “response tuning”. However, previous studies have focused on the
changes occurring during infancy and have not addressed early childhood, where a
transition period in the use of sensory information for the control of posture has been
hypothesized (Shumway-Cook & Woollacott, 1985). This hypothesis suggests that early
in the transition period vision dominates postural control whereas later, multiple sensory
inputs are integrated to maintain balance. An examination of the developmental changes
in the response tuning to a single dynamic visual stimulus may provide a first window to
explore this hypothetical transition period in postural control development. Therefore, to
better understand the development of vision’s role in postural control, previous work
needs to be extended to examine the moving room response in young children.
The goal of the current thesis, therefore, is to characterize the age-related changes
in the use of vision for postural control in children four and six years of age by examining
the variations in their responses to a dynamic visual stimulus. Manipulations of the
frequency and amplitude of the stimulus were used to analyze its effect on the postural
response amplitude and timing, along with the stability of these parameters.
The thesis is organized into six chapters. This introduction chapter is the first.
The second chapter presents a literature review related to vision’s role in the development
of postural control. The third chapter describes the first experiment in which the
participants were presented with a visual stimulus that oscillated at frequencies of 0.1,
0.3, and 0.5 Hz. The fourth chapter describes the second experiment in which the visual
stimulus frequency was kept constant at 0.3 Hz, while stimulus amplitudes varied from
static, 2, 5, and 8 mm. Both of these chapters include the rationale, methods, results, and

3
discussions for each experiment. The last two chapters offer a general discussion of the
experimental findings and suggestions for further research.

4
CHAPTER II
REVIEW OF LITERATURE
The purpose of this chapter is to review the literature related to the development
of vision’s influence on postural control. This chapter is divided into three main sections.
The first section discusses upright postural control, the second section reviews the use of
vision for postural control, and the final section discusses the development of visuomotor
responses in posture.
Postural Control
The successful execution of a motor task demands postural control of the body’s
center of mass to maintain a desired limb position. Posture is defined as the position of
the body segments in space and against gravity, a definition that includes equilibrium and
orientation (Horak & McPherson, 1996). A state of postural equilibrium is achieved when
all forces acting on the body are balanced in a manner so that a desired static or dynamic
position and orientation is allowed. Postural orientation is the relative position of the
body segments with respect to themselves and the environment (Horak & McPherson,
1996). In order to achieve the equilibrium and orientation goals, it is hypothesized that
the postural control system creates a representation or estimation of the body’s spatial
bearings relative to the environment, and makes corrective forces based upon this
representation to achieve a desired position (Gurfinkel, Levik, Semetanin, & Popov,
1988; Massion, 1998). The utilization of a spatial orientation representation is consistent
with conceptions of the postural control system (Jeka, Oie, & Kiemel, 2000). This
representation requires information provided by the integration of information from three
sensory systems: visual, somatosensory, vestibular.

5
The visual, somatosensory, and vestibular systems have often been studied with
respect to their roles in the control of posture. These redundant inputs code information
pertaining to the relationship between the body with itself and the environment, where
each sensory modality operates within a specific range of frequency and amplitude of
sway (Johansson & Magnusson, 1991). While each input conveys specific types of
information, the fusion between the sensory systems creates a redundancy that allows for
the clarification of ambiguous signals (Jeka et al., 2000). For example, an image moving
across the retina can either be perceived as self-motion or motion of the environment.
This ambiguity could be solved by using information from the vestibular system
responding to a linear acceleration of the head, indicating self-motion rather than motion
of the visual environment. This process describes a sensory re-weighting process, where
the postural control system dynamically re-weights multiple sensory inputs to maintain
upright stance as the sensory environment changes (Peterka, 2002). This process along
with the redundant nature of the three inputs allows for the elucidation of an ambiguous
piece of sensory information.
In certain situations the redundancy in the information given by the sensory
systems also allows for the maintenance of stance even when one modality is distorted or
taken away. It is this relationship between the manipulated or removed sensory
information and the postural response that allows for the behavior of posture to be used
as a model for the use of sensory information, where the effect of varying sensory input
on postural sway may lead to a better understanding of the role sensory information plays
in postural control. One method used to characterize the use of vision in the control of
posture has been to observe quiet standing with and without vision.

6
The Influence of Vision on Posture
Eyes open vs. Eyes closed
In adults, when quiet stance is compared with and without vision, quiet stance
with eyes closed is slightly destabilized relative to quiet stance with eyes open (Riley,
Wong, Mitra, & Turvey, 1997; Riley & Turvey, 2002; Ashmead & McCarty, 1991).
Although this result is widely found in the adults, the findings in children and infants are
conflicting. Ashmead & McCarty (1991) have found that infants generally did not sway
more in the dark than in the light, illustrating possible developmental differences in the
use of vision for postural control. However, the children’s literature on this issue is
characterized with inconsistent results, making it difficult to come to a strong conclusion
on vision’s role in quiet stance control. Where some have reported a stabilizing effect of
vision on children’s quiet stance (Riach & Starkes, 1989; Riach & Starkes, 1994), others
have reported that vision does not have the same stabilizing effect as in adults (Riach &
Hayes, 1987; Portfors-Yeomans & Riach, 1995). These conflicting findings have resulted
in no definitive characterizations of the effect of eye closure on quiet stance sway in
children and may be an indicator of a variable relationship between vision and postural
control in children. An alternative explanation may come from the differing visual
stimuli used across these studies. Visual influences on sway are known to depend on
visual stimulus quality, for example, decreases in the size of a fixation point have been
shown to increase sway (Paulus, Straube, & Brandt, 1984). It is possible that the
variability found in these studies may be due to the differences in the stimulus quality
across studies. Further research needs to be done with a standardized visual stimulus to
determine whether these results indicate a difference between children and adults in their

7
use of vision for postural control, or if these results reflect the differences in the visual
stimulus presented.
While the eyes open vs. eyes closed comparison can give us some insight into the
development of vision’s influence on sway, such large changes in sensory function
should be considered a small part of the description (Oie et al., 2002). Individuals are
more likely to encounter dynamic sensory changes in the environment rather than abrupt
removal of sensory information. One method used to observe the effect of dynamic
changes in the visual environment on postural sway is to vary the visual environment in
an experimental paradigm that has been called the “moving room”.
Dynamic Visual Stimulus
In the moving room paradigm, a participant stands on a stationary floor where the
visual environment translates with respect to the stationary floor either by physically
moving the walls and ceiling, or by the movement of a computer generated image relative
to the stationary floor. Movement of the visual environment has been shown to elicit
postural responses from the participant standing within the moving room (Stoffregen,
1985; Berthoz, Lacour, Soechting, & Vidal, 1979; Lishman et al., 1973; Stoffregen,
1985; Guerraz, Gianna, Burchill, Gresty, & Bronstein, 2001). As the visual environment
is translated toward the participant, the visual flow information presented is one that
suggests forward sway eliciting compensatory sway in the direction of the translation
movement. When the visual environment is oscillating at low frequencies, the
participant’s postural sway adopts the frequency of the oscillation of the visual
environment, where this coupling response is dependent upon the spatio-temporal aspects
of the visual stimulus (Lestienne, Soechting, & Berthoz, 1977; Masson, Mestre, &

8
Pailhous, 1995; Jeka et al., 2000). The moving room allows the exploration of the
relationship between vision and posture and differences in this relationship
developmentally could be characterized by differences in the postural response to the
moving room.
Lee and Aronson (1974) were the first to observe the infant’s postural response to
the moving room. Infants 13-16 months of age, who where just beginning to stand, were
placed in the moving room and found to respond by swaying or sometimes falling in the
direction of the room movement, showing a directionally appropriate response (Lee &
Aronson, 1974). These findings were extended to infants who can sit but not yet stand,
where the results showed the younger age group would lean in the appropriate direction
while seated within the moving room (Butterworth et al., 1977). This suggests that visual
perception of self-motion is present before upright locomotor experience, where these
improvements have been shown with experience (Anderson et al., 2001). Bertenthal and
Bai (1989) replicated these findings by observing 5-, 7-, and 9-month-olds supported on a
bicycle seat with measurements of forces taken under the seat. The results showed the 7-
and 9-month-olds showed directionally appropriate sway, while the 5-month-olds did not.
One interpretation may be that 5-month-olds could not utilize optic flow information and
therefore did not show a sway response, or the infants did perceive the optic flow, but
lacked the muscle strength and coordination to control a postural response(Bertenthal &
Bai, 1989). To further investigate this issue, further studies where done and found that
younger infants and even neonates showed directionally appropriate responses within the
moving room (Jouen, 1984; Jouen, 1988; Jouen, Lepecq, Gapenne, & Bertenthal, 2000).

9
Taken together, these studies suggest that infants younger than 5 months, while
lacking the muscle strength and coordination to control posture, are able to perceive optic
flow as information pertaining to self-motion. While these results are compelling, it
should be noted that many of these studies utilize room movements of large amplitude
(<10 cm), distances that when compared to the mechanics of the infant may be seen as a
visual perturbation, where these results may be interpreted as compensations to abrupt
sensory changes rather than a coupled visuomotor response. Therefore, a full
characterization of the response to a dynamic visual stimulus would require the inclusion
of small amplitude stimuli.
Schmuckler (1997) looked to characterize the postural response of 3 to 6-yr-old
children to a moving room at varying speeds of motion to investigate the developmental
changes in the use of visual information for the control of posture in children. The author
presents a hypothesis where frequency, amplitude and timing may be parameters that are
each associated with different developmental trajectories. Results showed that children
responded to oscillating visual information ranging from 0.2 – 0.8 Hz, and that the
frequency, amplitude and timing parameters of the postural response to the visual
stimulus revealed a mixture of adultlike and nonadultlike control. Again, these results
are limited as the visual stimuli presented to the participants contained large amplitudes.
If the postural response in children depends upon the spatio-temporal aspects of the
stimulus, as they do in adults, we may observe different results with smaller stimulus
amplitudes. Furthermore the results showed with respect to the timing parameter, that as
the frequency of the stimulus increased, the time lag between the visual stimulus and the
postural response increased, as in adults (Dijkstra et al. 1994; Jeka et al, 2000). With

10
respect to the amplitude of the children’s response, it was found that as the frequency
increased, the mean sway amplitude increased. The authors conclude that the children
responded to the entire stimulus frequencies presented, but the amount of response at
each frequency, with respect to the visual stimulus, is in question, as it was not directly
measured. One way the amount of response to the visual stimulus could be characterized
is with the measure of gain. If the postural response to the visual stimulus is composed of
adult-like and non-adultlike control as the author suggests, linear systems analysis may
reveal differences in the gain and phase responses between the children and adults,
characterizing the developmental trajectories of the amplitude and timing of the response.
The Development of Posture: The Effects of Tuning to Visual Information
Taken together, these findings suggest that the development of the postural
response to a dynamic visual stimulus lies within the ability to scale or “map” the sensory
information to the motor response (Bertenthal et al., 1997; Bertenthal & von Hofsten,
1998). Improvements in the “mapping” of the sensory input to motor action are
demonstrated with increased spatial and temporal precision of the postural response to the
dynamic stimulus, consistent with the notion of a response “tuning”. Tuning in this
context is representative of an increase in the coordination between the sensory input and
the motor response. One way to quantify this tuning response across age would be to
observe a decrease in the variability of the postural response to the moving room. This
decrease in the variability would be associated with increased precision in the amplitude
and timing of the response along with a reduction of sway not associated with the
movement of the stimulus. Bertenthal et al. (1997) observed 5, 7, 9, and 13 month olds
while seated within a moving room and found that the infants scaled their postural sway

11
to the frequency and amplitude manipulations of the visual stimulus, where this
entrainment to the stimulus showed an age-related improvement with sitting experience.
The timing of the response also improved with age as indicated by a decrease in the time
lag between the postural sway and the movement of the room. These findings illustrate
an increased precision of responding to the visual stimulus with development that could
be characterized as postural response tuning. It is important to again note that these are
findings from an experiment that utilized large amplitude visual stimuli that may be seen
as a perturbation to the infant participants and may not represent the small sensory
changes seen in everyday interaction with the environment. Nevertheless, this tuning
conceptualization is useful for the understanding of postural control development and
will require further study with small amplitude stimuli to extend the previous work.
What is the underlying changes occurring in the postural control system that
results in these tuning effects in postural sway with age? Some insight into this question
may come from a closed-loop feedback control model of upright stance. Peterka (2000)
utilizes a model consisting of a body represented by an inverted pendulum with torques
applied to the ankles to describe sway trajectories. This model detects an error signal
(desired vs. actual postural state) generated by information from the sensory inputs to
create these corrective torques. These compensatory movements are scaled based upon
position and velocity information received from the sensory inputs. A simulation of this
model with varying weights for the position and velocity parameters produced a number
of sway profiles, some that resemble adult sway (Peterka, 2000). However, it also
produced sway profiles with large amounts of variability, similar to children’s sway.
Based upon this simulation, one hypothesis is that the process of postural response tuning

12
may lie within the selection of optimal tuning of the sensory weights with age. This
tuning process must also take into account the changes in the mechanical system from
infancy to adulthood (McCollum & Leen, 1989). This would be represented as changing
parameters of the inverted pendulum in the feedback control model, requiring changes in
the sensory weights as they need to be based upon the most current properties of the
mechanical system. Therefore, changes in the mechanics must be accounted for in the
selection of the sensory weights to produce stable postural control.
Jeka et al. (2000) characterizes the adult postural response to an oscillating visual
stimulus by examining the effect of varying spatio-temporal parameters of the visual
stimulus on the postural response. Linear systems analysis is used to quantify the
response to the visual stimulus in the frequency domain, where measures of gain and
phase are calculated. Gain is defined as the amplitude of the postural response, at the
stimulus frequency, divided by the stimulus amplitude at that frequency. If the postural
sway component at the stimulus frequency is similar in amplitude to that of the visual
stimulus, the gain values should be close to one. Phase can be described as a normalized
representation of the time delay between the stimulus and the postural sway, where a
phase lead suggests body sway that is ahead of the stimulus, while a phase lag represents
body sway behind the stimulus. When a visual stimulus is presented with parameters that
are close to the natural frequency of sway in adults, an in-phase relationship is shown
with gain responses close to one (Dijkstra, Schöner, Giese, & Gielen, 1994; Dijkstra,
Schöner, & Gielen, 1994). When a visual stimulus is presented at a frequency below
0.2Hz, a decreased gain response is shown, with a phase lead relationship. When a visual
stimulus is presented with a frequency above 0.2Hz, a decreased gain relationship is

13
shown with a phase lag. These differing responses to varying stimulus parameters
illustrate the dependency of the postural response on the spatio-temporal aspects of the
visual stimulus.
Peterka & Benolken (1995) also have shown this dependence with changes in the
postural responses to varying amplitudes of visual stimuli, where stimulus frequency was
kept constant. Results showed a saturation effect where past a threshold level, the
increase in visual stimulus amplitude did not evoke increases in sway amplitude. This
saturation level was also found to be dependent upon the frequency of stimulus
oscillation. Furthermore, in a comparison between normal participants and bilateral
vestibular patients it was found that normals showed a saturation effect while the
vestibular patients did not (Peterka & Benolken, 1995). In other words, for vestibular
patients increases in visual stimulus amplitude elicited increases in sway until falling.
This implies that the sensory cues that create this saturation phenomenon are of vestibular
origin. Furthermore, the sway response of both the normal and vestibular patients were
similar until the saturation point was reached, suggesting a threshold where the reliance
on visual inputs are downgraded and veridical vestibular inputs are utilized.
This saturation phenomenon suggests a sensory re-weighting process, where the
postural control system dynamically re-weights multiple sensory inputs to maintain
upright stance as sensory conditions change (Forssberg & Nashner, 1982; Oie, Kiemel, &
Jeka, 2002). Sometimes these changes in sensory conditions can cause ambiguity that the
control system must resolve using this sensory re-weighting process. In other words,
flexible balance control requires an increase in weights to some inputs and a decrease in
weights to others (Horak & McPherson, 1996). Results from Peterka & Benolken (1995)

14
may indicate that the control system sees large amplitude movements as non-veridical
and downplays visual information, causing the saturation of the response. This view
assumes a categorization scheme used by the control system where small amplitude
stimuli indicates self-motion and large amplitude motion indicates object motion
(Schöner et al., 1998). Categorization of inputs as object motion rather than self-motion
would result in setting that weight low or to zero, a process that helps maintain balance in
a dynamic sensory environment.
Summary
The use of visual information as an indicator of self-motion seems to be present
early in life, even before postural abilities are attained. When postural milestones are
achieved, the influence of vision is seen in sway responses to dynamic visual
environments. This relationship between vision and posture is said to show improvement
within the first years of life, marked by an increased precision to the dynamic stimulus, or
a tuning of the postural response (Bertenthal et al., 1997). However, previous studies in
infants and children have utilized large amplitude movements, akin to a visual
perturbation rather than a demonstration of continuous visuomotor control. Furthermore,
the adult’s response has been shown to depend upon visual stimulus amplitude, where a
saturation point is seen at a threshold amplitude level. Therefore, further characterization
of the tuning response will require examination of the postural response to small
amplitude stimuli to extend previous findings.

15
CHAPTER III
AGE-RELATED CHANGES IN THE USE OF VISION FOR POSTURAL CONTROL: THE EFFECTS OF VARYING FREQUENCY
Introduction
Stable perception-action relationships are required so that our movements can
adapt to the changing demands of the environment. It has been thought that these
relationships exist from the beginning of life, and at no point in development are they
uncoupled (Thelen, 2000). However, researchers have hypothesized that one of the
underlying factors in the development of motor skills is an improvement in the
coordination between perception and action (Bertenthal, Boker, & Xu, 2000; Bertenthal
et al., 1997). In other words, the development of skilled actions can be conceptualized, in
part, as a stabilization of the perception-action relationship. Based on this hypothesis, an
understanding of the relationship between sensory information and motor action is
important to our understanding of motor skill development.
There are many approaches to study the development of perception-action
relations. A paradigm, referred to as the “moving room” paradigm, has been used to
study the postural response to changing visual stimuli. In this paradigm, the participant
stands on a stationary floor surrounded by a moving visual environment created by either
a computer generated image or by physically moving the walls and ceiling relative to the
stationary floor. A discrete linear movement of the visual environment toward an adult
participant creates visual flow information that suggests forward sway, eliciting
compensatory sway in the direction of the movement of the room, with a more
exaggerated sway response in young children (Lishman & Lee, 1974).

16
Jeka et al. (2000) characterized the adult postural response to an oscillatory visual
stimulus and found that adults will consistently entrain their sway with the motion of the
stimulus. In other words, a stabilized or coordinated perception-action system (i.e., adult)
will respond with a distinct and consistent sway response that corresponds with the
amplitude and frequency of stimulus oscillation. The postural response also was found to
adopt a particular temporal relationship with the stimulus such that sway leads the
stimulus at lower frequencies (<~0.25Hz) and lags behind the stimulus at faster
frequency oscillations (>~0.3Hz).
To examine the effect of a dynamic visual stimulus on the postural response as it
occurs early in development, Bertenthal et al. (1997) observed 5-, 7-, 9-, and 13-month-
olds while seated within a moving room. The authors found that the infants scaled their
postural sway to the frequency and amplitude manipulations of the visual environment
and that this entrainment to the stimulus showed an age-related improvement with sitting
experience. The timing of the response also improved with age as indicated by a decrease
in the time lag between the postural sway and the movement of the room. Since the
infants showed this scaling response before they could sit unsupported, the authors
concluded that the visual control of sitting is not rate-limited by the perception of the
visual stimulus. This suggests that the development of the postural response to a dynamic
visual stimulus lies within the infant’s ability to scale or “map” the sensory information
to the motor response. Improvements in the “mapping” of the sensory input to motor
action is demonstrated with increased spatial and temporal precision of the postural
response to the dynamic stimulus, consistent with the notion of a response “tuning”.
Tuning in this context is representative of an increase in the coordination between the

17
sensory input and the motor response. One way to quantify this tuning response across
age would be to observe a decrease in the variability of the postural response to the
moving room. This decrease in the variability would be associated with increased
precision in the amplitude and timing of the response along with a reduction of sway not
associated with the movement of the stimulus.
The changes in the tuning of the postural response to a dynamic visual stimulus
between children and adults may also indicate age-related differences in the use of vision
for the control of posture. Schumway-Cook and Woollacott (1985) suggested a transition
period between 4 to 6 years of age in the use of sensory information for the control of
posture. According to the authors, vision is the primary source of information used to
control posture early in the transition period. By the end of this period, the child is able to
integrate inputs from the visual, somatosensory and vestibular systems in an adult-like
manner. If this age range truly represents a transition period, then the 4-year-olds postural
response will demonstrate dependence on the visual stimuli showing clear age-related
differences when compared to 6-year-olds and adults. In other words, this transition
period would represent a change in the use of sensory information for postural control.
This change in the nature of the perception-action relationship will lead to changes in
tuning of the postural response. This hypothesized transition period also suggests that
children 6 years and older should show an adult-like tuning of the postural response.
To investigate this hypothetical transition period in the use of sensory information
for children’s postural control, Schmuckler (1997) looked to characterize the postural
response of 3- to 6-yr-old children to a moving room and found that children in this age
range responded to oscillating visual information ranging from 0.2 – 0.8 Hz, where the

18
frequency response appeared non-adultlike, and the timing measures revealed an adult-
like response. From these results, the authors concluded that the children’s response to
the visual stimulus revealed a mixture of adultlike and nonadultlike control (Schmuckler,
1997). These results are difficult to interpret, however, because of the large visual
stimulus amplitudes (10-12cm) presented to the participants. Large amplitude visual
stimuli may act as a sensory perturbation to the child, where the postural response would
reflect compensatory control as opposed to continuous sensory motor coupling.
The purpose of the present study, therefore, is to examine the postural response to
a dynamic visual stimulus in children by characterizing the amplitude and timing
responses to varying frequencies of oscillation where the stimulus amplitudes are much
smaller than those used by previous investigators. If a tuning response occurs across age
it will be characterized by increased precision in the amplitude and timing parameters of
posture at the driving frequency, with decreased sway not associated with the visual
stimulus. Furthermore, a comparison of the postural response to varying frequency
conditions across age 4-6 will test for the possible existence of a transition in the use of
vision for the control of posture during this age period. If this transition does exist then
the 4-year-old’s postural response should be different from the 6-year-olds and adults.
Method
Participants
Participants in the study where seven 4-year-old children (M = 4.43, SD = 0.35
years) and seven 6-year-old children (M = 6.4, SD = 0.7 years) and seven adults (M =
23.2, SD = 2.6 years) All children were healthy, normally developing. All participants

19
had normal or corrected vision. Participants where recruited from an area in and
surrounding the University of Maryland, College Park. Each child’s parent or guardian
and adult participants gave written informed consent prior to participation according to
procedures approved by the Institutional Review Board at the University of Maryland at
College Park (see appendix A for a copy of the consent form).
Experimental Set-Up
Figure 1 illustrates the simulated moving room, where the visual stimulus
consisted of an image of randomly scattered small white triangles on a black background
(0.2 degrees X 0.2 degrees) that was back-projected onto a translucent screen (2.5m x
Figure 1. Illustration of the Experimental Setup

20
1.0m) from a mounted projector (Electrohome™). All points in the visual array moved
synchronously in the medio-lateral (ML) direction at the same velocity creating simple
horizontal flow at frequencies of 0.1, 0.3, and 0.5 Hz (i.e., stimulus conditions) with
amplitudes of 1.5, 0.6, and 0.3 cm respectively and a constant velocity of 0.65 cm/s.
To measure the mediolateral postural response to the visual stimulus, an
ultrasound tracking system (Logitech, Inc.™) was used to measure 3D-body sway. The
system consisted of a control unit, a triangular ultrasonic transmitter (25x25x25cm) and
two small triangular ultrasonic receivers (7x7x7cm). The participants wore a headband on
which one of the ultrasonic receivers was attached to measure the displacement of the
head, and the second receiver was affixed to the participant’s waistband to measure the
displacement at the approximate center of mass. The ultrasonic transmitter was mounted
on a tripod positioned approximately one meter behind the participant during the
experimental session. All signals from the tracking system and the visual stimulus were
collected at 50.33 Hz via a National Instruments A/D board (SB-MI06) on a PC
(Gateway G6-200) workstation using a custom LabView data acquisition program.
Procedure
Once acclimated to the laboratory environment, the participants where asked to
stand quietly in a modified tandem stance (toe touching medial side of heel) 40cm from
the screen where the stimulus conditions (i.e., frequencies) were presented in a random
fashion. The participants wore goggles to limit the field of view approximately 100
degrees high by 120 degrees wide, so that the edges of the screen were not visible. At the
beginning of a trial, the stimulus appeared along with a small image of a clock. The clock
then disappeared at the start of the trial when the stimulus began oscillating. When the

21
trial was over, the clock reappeared and disappeared again when the next trial started.
The participant was asked to attend to the screen and report when the clock disappeared
and reappeared, in effect keeping the child on task. The total experimental session
consisted of three trials of each condition presented in random order, for a total of nine
trials, each lasting 60-90 seconds depending upon the condition (to be able to include the
same amount of cycles), for a total of approximately 1.5 hrs, including breaks when the
participant received prize incentives. All trials where videotaped to ensure that the
participants adhered to the task constraints during the entire session.
Analysis
Measures
Using a linear systems analysis in the frequency domain, three measures were
used to examine the position data collected from the head and approximate center of mass
(CoM): gain, phase and residsway. Fourier transforms of the postural displacements and
the stimulus position were computed, where the transform of the postural displacements
at the driving frequency was divided by the transform of the stimulus position, also at the
driving frequency, creating the transfer function or the frequency-response function from
where the measures of gain and phase where recovered.
Gain is defined as the ratio between the body sway amplitude spectrum and the
visual stimulus amplitude spectrum at the driving frequency. Gain values of close to 1
represent body sway amplitude that is similar to the visual stimulus amplitude at the
driving frequency. Values lower than 1 represents body sway amplitude that is less than
the visual stimulus amplitude, and values greater than 1 represent body sway amplitude
that is greater than the visual stimulus amplitude. Gain represents the strength of the

22
postural response relative to the stimulus and comes from the absolute value of the
transfer function. If a transition period exists in the use of sensory information for
postural control between 4 and 6 years of age from visual dominance to the integration of
sensory inputs, changes in the gain response will be evident. Based on this hypothesis, 4-
year-olds (visually dominant) will show a constant gain across frequency. This would
represent a linear amplitude response with respect to changes in the amplitude properties
of the stimulus. In other words, if the 4-year-old is truly visually dominant, the sway
response will be strongly influenced by the driving visual stimulus no matter what
parameters are set as we expect changes in the amplitude of the stimulus to be reflected in
the sway response amplitude at a constant ratio. Furthermore, the 6-year-olds
(multisensory capable) will show a gain response that is dependent upon stimulus
frequency based upon previous work with adults (Jeka et al., 2000). This response will
be an indication that the 6-year-old’s response will not be visually dominant, but based
upon the spatio-temporal structure of the stimulus. If response tuning occurs with
development, we expect a decrease in gain variability with age, suggesting an increased
precision of the amplitude response.
Phase is the normalized representation of the delay between the body sway and
the visual stimulus, recovered as the complex value of the transfer function. A phase
value of zero represents no time delay between the response and the stimulus. Phase
values greater than zero represents body sway leading the stimulus, while negative phase
values represent body sway lagging behind the stimulus. We expect the 4-year-olds,
based upon the hypothesized transition period, to show a constant phase response across
stimulus frequency. This will demonstrate the visual dominance hypothesized where the

23
timing relationship will be determined by the frequency of the stimulus, where changes in
this stimulus parameter will show proportional changes in the sway response timing. The
6-year-old’s timing response will be similar to the adult’s response. Previous work in
adults (Dijkstra et al., 1994) shows a timing response where we would expect a phase
lead relationship at the 0.1 Hz condition, with increasing phase lags at the 0.3 and 0.5 Hz
conditions. If a tuning response occurs with development, an increased precision of the
timing response will be shown with decreased phase variability across age.
The residsway is defined as the standard deviation of the residual sway contained
in the frequencies above and below the stimulus frequency and represents the sway that
does not contribute to the amplitude and timing measures (gain and phase). The
residsway was estimated by first detrending the postural sway trajectory. The postural
sway component due to the visual stimulus was removed by subtracting the sinusoid
corresponding to the Fourier transform of the trajectory at the visual stimulus frequency.
The residsway is the standard deviation of the resultant trajectory. If a tuning response
exists with development, the residsway is expected to decrease with increasing age,
indicating an increased precision in the postural response with development.
Statistical Analysis
Utilizing a mixed model (Proc Mixed, SAS, version 8.2), six separate 3x3
ANOVAs (age and frequency) for the head and center of mass for each measure, with
repeated measures on frequency were utilized to evaluate the effects of age (4, 6 and
adult) and the three visual stimuli frequencies (0.1, 0.3, 0.5Hz). The dependent measures
where gain, phase and residsway. Significant effects were followed by LSD post-hoc
procedures.

24
Results
The results are divided into two sections. The first section characterizes the
postural response amplitude and timing with the measures of gain and phase respectively.
The second section describes the amplitude and timing variability, along with the amount
of sway not associated with the stimulus frequency, to analyze the postural response
tuning. This section includes the standard deviations of the gain and phase with the
measure of residsway.
Stimulus Response
Amplitude
Repeated measures ANOVA for head gain (Figure 2) revealed a significant main
effect for age (F(2,36)=3.62, p<0.05) and condition (F(2,12)=14.87, p<0.05), but
revealed no interaction. Post-hoc analysis of the condition effect revealed all groups’
responses at the 0.1 Hz condition were significantly lower than their responses at 0.3 and
0.5 Hz stimuli. For the age main effect, the 4-year-olds had higher gain values across
conditions than the adults, but were not different from the 6-year-olds who did not differ
from the adults.
Repeated measures ANOVA for CoM gain (Figure 3) also revealed a significant
main effect for age (F(2,36)=9.97, p<0.001) and condition (F(2,12)=7.47, p<0.001), and
no interaction. As with the head response, the condition effect for CoM revealed gain at
the 0.1 Hz condition to be significantly lower than the other frequencies which did not
differ from each other. CoM gain for both the 4- and 6-year-olds were greater than the
gain seen in adults, but did not differ from each other.

25
Figure 2. Mean Gain Values and the Standard Error of the Mean for the Head Across Frequency
Figure 3. Mean Gain Values and the Standard Error of the Mean for the Head Across Frequency

26
Timing
To assess the temporal structure of the response relative to the stimulus, repeated
measures ANOVA for the head’s phase (Figure 4) revealed a condition effect
(F(2,18)=36.06, p<0.05) with no age effect or interaction. Post-hoc analysis of the
condition effect revealed significant differences across all 3 conditions, with the largest
phase values at the 0.1 Hz condition, followed by the 0.3 Hz condition, with the lowest
gain values at the 0.5 Hz condition.
Repeated measures ANOVA for the CoM phase (Figure 5) revealed a condition
effect (F(2,18)=9.94, p<0.05) with no age effects or interaction. Post-hoc analysis of the
condition effect revealed positive phase values at the 0.1 Hz condition indicating a phase
lead response with negative phase responses at the 0.3 and 0.5 Hz conditions which did
not differ from each other, indicating a phase lag.
Figure 4. Mean Phase Values and the Standard Error of the Mean for the Head Across Frequency

27
Variability of the Response
Amplitude variability
The stability of the amplitude response was measured as the standard deviation of
the mean gain values. Repeated measures ANOVA for the head variability (Figure 6)
revealed age effects (F(2,36)=4.85, p<0.05) and condition effects (F(2,12)=4.49, p<0.05)
but revealed no interaction. Post-hoc analysis of the condition effect showed the largest
variability at the 0.3 Hz condition with similar responses at the 0.1 and 0.5 Hz conditions.
The age effect showed the 4-year-olds where more variable than the adults, while the
comparison between the 6-year-olds and the adults approached significance (p = 0.052).
Figure 5. Mean Phase Values and the Standard Error of the Mean for the CoM Across Frequency

28
Repeated measures ANOVA for the variability of CoM (Figure 7) revealed an age
effect (F(2,36)=6.14, p<0.05) with no condition effect and no interaction. Post-hoc
analysis of the age effect revealed the 4- and 6-year-olds were similar and had higher
variability than the adults.
Figure 6. Standard Deviation of the Head Gain Across Frequency
Head Gain Variability
0.00
0.20
0.40
0.60
0.80
1.00
1.20
0.1 Hz 0.3 Hz 0.5 Hz
Frequency Condition
Gai
n St
anda
rd D
evia
tion
4yrolds6yroldsadults

29
Timing variability
Phase variability (Figure 8) was assessed to describe the stability of the timing
response to the driving stimulus. Repeated measures ANOVA for the head revealed no
significant main effects. A similar result was found for the CoM (Figure 9).
Figure 7. Standard Deviation of the CoM Gain Across Frequency
CoM Gain Variability
0.00
0.10
0.20
0.30
0.40
0.50
0.60
0.1 Hz 0.3 Hz 0.5 Hz
Frequency Condition
Gai
n Va
riabi
lity
4yrolds6yroldsadults

30
Figure 9. Standard Deviation of the Head Phase Across Frequency
Figure 8. Standard Deviation of the CoM Phase Across Frequency
Head Phase Variability
0.00
10.00
20.00
30.00
40.00
50.00
60.00
0.1 Hz 0.3 Hz 0.5 Hz
Frequency Condition
Pha
se S
tand
ard
Dev
iatio
n
4yrolds6yroldsadults
CoM Phase Variability
0.00
10.00
20.00
30.00
40.00
50.00
60.00
0.1 Hz 0.3 Hz 0.5 Hz
Frequency Condition
Phas
e St
anda
rd D
evat
ion
4yrolds6yroldsadults

31
Sway variability
Repeated measures ANOVA for the residsway for the head (Figure 10) revealed
an age effect (F(2,36)=25.76, p<0.05) and condition effect (F(2,12)=20.44, p<0.05) but
showed no interaction. Post-hoc analysis of the condition effect found the lowest
residsway response at the 0.1 Hz condition which was significantly different from the
other two frequencies which did not differ from each other. Post-hoc analysis of the age
effect revealed the 4-year-olds had the greatest residsway response, followed by the 6-
year-olds, where the adults showed the lowest residsway response.
Repeated measures ANOVA for the residsway of the CoM (Figure 11) revealed
an age effect (F(2,36)=26.48, p<0.05) along with a condition effect (F(2,12)=11.89,
p<0.05) and no interaction. As seen in the head, condition effect showed the lowest
residsway response at the 0.1 Hz condition, while the age effect revealed a decrease in
residsway across age as each age group was significantly different from each other.
Figure 10. Mean residsway Values and the Standard Error of the Mean for the Head Across Frequency

32
Discussion
The goal of the present study was to characterize the effect of varying visual
stimulus frequency on the postural response in children. For all participants, results
showed the amplitude gain to be the lowest at the 0.1 Hz condition, with larger gain
responses at the 0.3 and the 0.5 Hz condition. Gain values indicate that the response
from the head at the 0.1 Hz condition approached unity, where the amplitude of the
response closely matched the stimulus amplitude, while the response at the 0.3 and 0.5
Hz conditions showed larger gain representing an amplitude response greater than the
stimulus. The gain response pattern across frequency was shown to be the same for all
age groups, where the developmental differences were seen in the decreased gain
magnitude with age. With respect to the response timing, a phase lead was found at the
Figure 11. Mean residsway Values and the Standard Error or the Mean for the CoM Across Frequency

33
0.1 Hz condition, indicating that the response was temporally ahead of the visual
stimulus. A slight phase lag was found at the 0.3 Hz condition, with an increased phase
lag at the 0.5 Hz condition, both showing the response to be temporally behind the visual
stimulus. Analysis of the phase response revealed no differences between the age groups
indicating similar timing responses across the ages of 4, 6, and adult. Furthermore gain
variability, along with residsway, was found to decrease with age demonstrating an
increased stability in the amplitude response. These results show similar amplitude and
timing response patterns between 4-, 6-year-olds and adults, where the developmental
differences were seen in the decrease of the gain magnitude and variability, along with a
decrease in the residsway. The similarities across age suggest a comparable use of vision
for postural control between children and adults, where the children show a more variable
response that decreases with age, illustrating changes in the response precision that may
be an indication of response tuning.
Response to the dynamic visual stimulus
In a similar study, Schmuckler (1997) presents a hypothesis in which frequency,
amplitude, and timing are response parameters that follow different developmental
trajectories. The author concludes that the children’s response to a dynamic visual
stimulus consists of a nonadultlike frequency response and adultlike timing control.
Based on this hypothesis the gain response pattern would be expected to change across
age corresponding to nonadultlike frequency response. Furthermore, the phase response
would be expected to be similar across age groups. Results from the current study show
that the response amplitude and timing were similar across age and all show a similar
dependence upon the stimulus frequency, suggesting adultlike frequency, amplitude, and

34
timing response patterns. However, comparisons between the current results with
Schmuckler (1997) are difficult because of the differences in the stimulus amplitudes
used. Schmuckler (1997) utilizes large amplitude movements representing a visual
perturbation to the participants whereas the goal of the current study was to characterize
responses to small sensory changes individuals experience when interacting with the
environment. Due to these differences, an alternative explanation of the current study’s
results is needed.
Schumway-Cook & Woollacott (1985) hypothesizes a developmental transition
period in the use of sensory information for postural control. This hypothesis states that
visual inputs dominate postural control early in childhood, from around 4 years of age,
whereas at approximately 6 years of age children are able to integrate multiple sensory
inputs for postural control. Based upon this hypothesis, the gain and phase response in
the present study were expected to be constant across frequency conditions in the visually
dominant 4-year-olds, demonstrating a tight coupling to the visual stimulus no matter the
variations in the frequency, amplitude and timing. Contrary to these expected findings,
the 4-year-old’s gain and phase response differed depending upon the stimulus frequency
and did not show a constant response across conditions. These discrepancies warrant an
alternative explanation of the gain and phase response across frequency.
Both gain and phase profiles found in the present study are qualitatively similar to
previous work done with adults in a visual moving room paradigm (Jek
a et al. 2000) and interestingly, similar to responses found in a haptic moving room where
an oscillating somatosensory stimulus was used (Jeka, Oie, Schöner, Dijkstra, & Henson,
1998; Barela et al., 2003). Model fits performed on the gain and phase values found in

35
Jeka et al. (1998) suggested that the adults coupled to the position and velocity of the
somatosensory stimulus. Although fitting the data in the present study to the model is not
possible due to the length of the trials collected (longer trials are necessary to produce
reliable model parameters), the similarities in the gain and phase values suggest the
possibility that the participants utilized the position and velocity information from the
visual stimulus, much like the interpretation of the results found with the somatosensory
stimulus. This hypothesis suggests that children as young as age four utilize position and
velocity information from the stimulus and changes seen across development may be due
to changes in the use of appropriate aspects of sensory information rather than a transition
from visual dominance to multisensory integration. Due to the limitations of fitting the
data to the model these statements remain speculative and necessitate further work in
order to explore this hypothesis.
Prospective control
The positive phase values found in the 0.1 Hz condition was of interest as it
indicates a phase lead relationship where the postural response was temporally ahead of
the stimulus, demonstrating a prospective aspect of control based upon the frequency of
the stimulus. Even the 4- and 6-year-old children in the current study seem to show this
prospective control due to the similarities in the children’s timing response with the
adults. In many situations the postural control system needs to be able to anticipate
future actions in order to compensate for factors such as the inertia of the limbs and the
neural time lags in order to produce skillful movement (Bertenthal & Clifton, 1998).
This leads to the question of how does the control system anticipate the consequence of
actions to execute prospective control? One hypothesis could be the control system,

36
through learning, develops an understanding of the physics of the body relative to the
environment and is able to calculate based upon sensory information the consequence of
movement (Massion, 1998). Another less complicated explanation may be the control
systems utilization of the appropriate aspect of the sensory information based upon the
relationship between position and velocity. Velocity is defined as the rate of change of
position. This relationship dictates that for certain kinds of motion, at peak position, the
velocity is at minimum. Furthermore, when velocity is at maximum, position is halfway
between peak amplitudes. Therefore maximum velocity must occur before maximum
position. Since velocity is based upon position and leads position, it is possible that the
utilization of the velocity aspects of sensory information may fulfill the requirements
necessary to execute anticipatory actions relative to position information. If this
hypothesis were true, the similarities in the timing response across age would indicate
that the children may be using velocity information similar to adults in postural control.
Postural response tuning
Bertenthal (1997) describes the changes in the visuomotor control of posture as an
increased precision of the stimulus response. In the present study, this response tuning
was hypothesized to decrease with age in gain and phase variability, along with a
decrease in residual sway not associated with the stimulus frequency. Results showed
that both gain variability and residual sway decreased with age demonstrating a more
stabilized amplitude response with development. While these results indicate amplitude
tuning, the phase variability did not show a change with age. In other words, there is no
evidence to support the tuning of the temporal aspects of the postural response. A
variable phase response suggests a weak temporal coupling, because the response to the

37
stimulus must be defined in terms of both amplitude and timing. This unexpected finding
calls into question the interpretation of postural sway in the moving room paradigm as a
continuous use of sensory information.
These findings may be alternatively explained as a consequence of normal sway
in front of a stimulus rather than a response to a specific dynamic stimulus. For example,
if the results from the present study where due to a consequence of normal quiet standing
regardless of the stimulus and not in response to a particular dynamic visual environment,
then the gain response pattern across frequency may be due to the changes in the
frequency of the stimulus and not because of changes in the sway response. Furthermore
the decrease in gain variability and the magnitude of amplitude response may be related
to the decrease in residual sway rather than a change in response precision. Due to this
confound, it is clear that frequency manipulations alone cannot distinguish between the
two possible explanations of these results. One possible approach that may resolve this
issue may be to present a stimulus where the frequency is held constant with an
amplitude manipulation. Changes in the amplitude of the sway response across
variations in stimulus amplitude would indicate that the stimulus influenced the sway
response. This clarification is needed in order to interpret the response to the moving
room as a utilization of sensory information. Indeed, the second experiment (Chapter IV)
addresses this issue.
Summary
This initial experiment characterized the effect of varying visual stimulus
frequency on children’s postural response. The results showed the children’s response to
be similar to that of the adults but with larger variability. The findings from the present

38
study did not support the hypothesis presented by Schumway-Cook & Woollacott (1985)
of a transition period in the development of the postural control system in which children
progress from being visually dominant to multisensory capable. Similarities in the
child’s postural response with the adults suggest an alternative explanation where
postural control development may be in part attributed to the ability to utilize appropriate
aspects of available sensory information. Furthermore, some evidence for the
development of response tuning was shown in an increased precision of the amplitude
response. However, this was not seen in the timing of the response allowing two possible
explanations of the response to the dynamic visual stimulus as either a coupling of sway
and visual information or the age-related changes in quiet stance regardless of a stimulus.
Frequency manipulations alone are not enough evidence to distinguish between the two
explanations, requiring an extension of the present findings utilizing a stimulus amplitude
manipulation to resolve this issue.

39
CHAPTER IV
AGE-RELATED CHANGES IN THE USE OF VISION FOR POSTURAL CONTROL: THE EFFECTS OF VARYING AMPLITUDE
Introduction
The development of motor actions can be conceptualized, in part, as an increased
stabilization or coordination of perception-action relations. An approach commonly used
to assess the perception-action system is to characterize the influence of varying sensory
inputs on consequent movement responses. For example, quiet standing adults presented
with an oscillating visual field will consistently entrain their sway with the motion of the
stimulus. That is, a coordinated perception-action system will respond with a distinct and
consistent sway response that corresponds with the amplitude and frequency of the
visually oscillating stimulus. Furthermore, an adult’s postural response will adopt a
temporal relationship with the visual stimulus such that sway leads the stimulus at slower
frequency oscillations (< ~0.25Hz) and lags behind the stimulus at faster frequency
oscillations (> ~ 0.3Hz) (Dijkstra et al. 1994a, b; Jeka et al. 2000). In an analogous task,
4- and 6-yr-old children demonstrate adult-like average amplitude and timing responses,
although they have larger within-subject variability than is typically seen in adults
(Chapter III). In addition, the amplitude of the frequency components surrounding the
stimulus frequency was reduced in these children, illustrating a decrease in the
components of sway thought unrelated to the stimulus drive. This reduction of sway,
along with the age-related differences in the amplitude and timing of the postural
response to a dynamic visual stimulus, are consistent with the notion of response “tuning”
across development (Bertenthal et. al. 1997). That is, across development the postural

40
response appears to reflect an increasing precision to dynamic visual stimuli. In this
context, “tuning” is described as an improvement in the coordination between the sensory
inputs and the motor response as demonstrated by consistent amplitude and timing
responses, with reduced sway not associated with the driving stimulus.
In addition to the age-related tuning of the postural response to a dynamic
stimulus, developmental differences have been observed in the control of upright stance
in the absence of sensory manipulations. For instance, a decrease in the overall variability
of the sway trajectory of quiet upright stance has been observed as children age into
adulthood (Newell, 1998; Riach et al., 1987) Riach & Hays (1987) characterized the
sway trajectory of quiet standing children from two to fourteen years of age and showed
that the youngest children demonstrated a broad sway response across the frequency
range of 0.05 to 2Hz, with a majority of sway amplitude accounted for within this
bandwidth. With increasing age, the children showed less sway at higher frequencies (0.8
to 2Hz) and increased sway at the lower frequencies (>0.8Hz). This result suggests an
age-related tendency towards a narrowing and shifting of the frequency bandwidth that
accounts for the majority of observed sway variability.
These age-related changes in unperturbed postural control suggest a potential
confound to the thesis that age-related changes in quiet stance control are due to a tuning
of the perception-action relationship. The observation in both the quiet stance and
dynamic stimulus experiments that sway amplitude in the frequency components greater
than 0.8Hz are reduced suggests that the reduction of sway in the dynamic stimulus
condition may reflect, at least in part, the reduction of unperturbed sway independent of
the sensory manipulation. The age-related similarities between experimental tasks in the

41
frequency components less than 0.8Hz also calls into question the interpretation that
children have adult-like amplitude responses to visually perturbed stimuli. That is, the
amplitude of the response to the sensory cues may be characteristic of normal upright
stance relative to the stimulus rather than a reflection of the sensory manipulation. In this
scenario, the variability of the amplitude measures would be attributed to general quiet
stance postural control rather than the response to the stimulus. While these findings
illustrate the lack of clarity in understanding the effects of dynamic visual stimuli on the
postural response of developing children, the similarity between the mean timing
measures of the child and adult postural responses suggest that visual inputs do influence
children’s upright stance. Additionally, decreases in the variability of the timing response
across development support the notion that the tuning of the postural response is a
reflection of the changes occurring in the response to the stimulus (Chapter III). These
conflicting interpretations call for experimental clarification to resolve the issue.
One approach to clarify the interpretation is to study the effect of a dynamic
stimulus on the postural response by systematically manipulating the amplitude of the
stimulus and comparing the response across conditions to see if the changes in the
stimulus are reflected in the response. If the sway amplitude is shown to increase above
baseline levels with increasing stimulus amplitude, it would suggest that the stimulus had
an influence on the sway response. For example, Peterka and Benolken (1995) recorded
postural sway in adults who where presented with a dynamic visual stimulus where the
frequency of oscillation was kept constant while amplitude was varied from 0.2 to 10
degrees. The results of this study indicated that the adult’s sway amplitude increased and
eventually reached a saturation level as stimulus amplitude increased, demonstrating

42
vision’s influence on postural sway. If a similar comparison with developing children
were to find increases in sway amplitude, it would suggest, as it did in adults that
stimulus amplitude influenced the postural sway. However, if the sway amplitude
showed no change across stimulus amplitude, it would indicate the stimulus had no effect
on the sway response and the children’s results may simply reflect normal quiet standing.
Therefore, an amplitude manipulation with children would clarify whether the changes in
the response to a dynamic visual stimulus are due to changes in quiet stance control or
changes in the response to the dynamic visual stimulus. This same inference cannot be
made with frequency manipulations alone due to observed differences in the response
attributed to stimulus frequency. Thus, a systematic manipulation of the stimulus
amplitude would clarify questions regarding the tuning of the perception-action
relationship.
Age-related differences in the postural response to varying stimulus amplitudes
between children and adults may indicate age-related differences in the use of vision for
the control of posture. Schumway-Cook & Woollacott (1985) suggested a transition
period between 4 to 6 years of age in the use of sensory information for the control of
posture. According to the authors, vision is the primary source of information used to
control posture early in the transition period. By the end of this period, the child is able
to integrate inputs from the visual, somatosensory and vestibular systems in an adult-like
manner (Shumway-Cook & Woollacott, 1985). If this age range truly represents a
transition period, then the 4-year-olds’ postural responses will demonstrate a dependence
on the visual stimuli showing clear age-related differences when compared to children 6

43
years and older. Furthermore, children 6 years and older should show adult-like postural
responses according to the hypothesized transition period.
The purpose of the present study is to further examine the tuning of the postural
response to a dynamic stimulus and to clarify its relationship with the developmental
changes occurring in normal upright stance by comparing the sway response across
varying stimulus amplitudes with quiet stance sway relative to a stationary stimulus. We
suggest that these changes occurring in normal stance are inherently linked to the postural
responses in the dynamic sensory condition and we propose an experiment which will
tease apart the postural response due to changes in quiet stance control with those due to
changes in the tuning of the perception-action system. An examination of the postural
response to varying amplitude conditions will a) test for the possible existence of
transition periods in the use of vision for the control of posture as indicated by
differences between 4- and 6-year-old children; and, b) clarify whether the changes in the
amplitude measures are due to changes in the response to the dynamic stimulus or due to
the changes in the sway characteristics of quiet stance. This clarification must be made if
the findings from the dynamic stimulus literature are to be used in conjunction with the
quiet stance literature to form conclusions about the development of vision’s influence on
postural control.
Method
Participants
Thirty participants were included in this study: ten 4-year-olds (M = 4.6, SD = 0.3
years), ten 6-year-olds (M = 6.3, SD = 0.5 years), and ten adults (M = 21.8, SD = 2.1

44
years). All participants were healthy and normally developing, with normal or corrected
vision. Participants were recruited from the University of Maryland community and the
surrounding area. Each participant, or in the child’s case a parent or guardian, provided
written informed consent prior to participation according to procedures approved by the
Institutional Review Board at the University of Maryland at College Park (see appendix
B for a copy of the consent form).
Experimental Set-Up
Figure 12 illustrates the simulated moving room used to manipulate visual
information via computer generated visual display. The static visual display consists of
an image of 100 randomly scattered small white triangles on a black background (0.2
degrees X 0.2 degrees). The dynamic visual display was created from this same image,
where all points in the visual array moved synchronously in the medio-lateral (ML)
direction at the same velocity creating simple horizontal flow. The visual stimulus was
generated by a Windows NT workstation (Intergraph TDZ-2000) and back projected onto
a translucent screen (2.5m x 1.0m) from a mounted Electrohome™ projector (ECP 4500).
The participants wore goggles to limit the field of view to approximately 100 degrees
high by 120 degrees wide so that the edges of the screen were not visible.

45
To measure the postural response to the visual stimulus in the ML direction, an
ultrasonic tracking system (Logitech, Inc.™) was used to measure body sway in 3
dimensions. The system consists of a control unit, a triangular ultrasonic transmitter
(25x25x25cm) and two small triangular receivers (7x7x7cm). The participants wore a
headband on which one of the receivers was attached to measure the displacement of the
head, with the other receiver affixed to a waistband at approximately the 4th or 5th lumbar
Figure 12. Illustration of the Experimental Setup

46
vertebra to measure body displacement at the approximate center of mass. The
transmitter was mounted on a tripod positioned approximately one meter behind the
participant and at a height midway between the two receivers during the experimental
session. All signals were sampled at 50.33Hz in real time using a National Instruments
A/D board (BNC-2090) using a custom LabView data acquisition program.
Experimental Design
The experimental design consisted of 3 dynamic and 1 static visual stimuli
conditions. In the dynamic conditions, the visual stimuli moved as a whole laterally with
amplitudes of 2, 5 and 8 mm at a constant frequency of 0.3Hz. In the static condition the
visual stimulus remained stationary for the duration of the trial. The stimulus conditions
were presented in randomized blocks of trials across subjects where each block consisted
of one trial from each of the 4 conditions. Three 60s trials were collected in each of the
conditions for a total of 12 trials (4 conditions x 3 trials). The total time for an
experimental session was 1.5 hours including breaks.
Procedure
Once acclimated to the laboratory environment, the participants were asked to
stand quietly in a modified tandem stance (with the toe touching the medial side of the
heel) 40cm from the screen. At the beginning of a trial, the stimulus appeared along with
a small image of a clock. The clock image then disappeared at the start of the trial when
the stimulus began oscillating. When the trial was over, the clock reappeared and
disappeared again when the next trial started. The participant was asked to attend to the
screen and report when the clock disappeared and reappeared to keep the participant on

47
task. A break was given between trials and at the end of the testing session the participant
received a prize.
Data Analysis
ML sway data and the position of the visual stimulus were first detrended by
subtracting the mean of each signal to remove DC offset and filtered with a recursive 4th
order 5Hz lowpass Butterworth filter. The transfer function (frequency-response
function) for each data segment was calculated by taking the cross power spectrum of the
stimulus and the sway and dividing it by the power spectrum of the stimulus. This
computation of the transfer function is theoretically equivalent to the Fourier transform of
the sway divided by the Fourier transform of the stimulus. For each data segment in the
dynamic condition, four measures were recovered for both the head and approximate
center of mass (CoM): gain, phase, residual power spectral density (residsway) and
stimulus frequency sway amplitude (SFSA). For the static condition, only the residsway
and SFSA for each segment were calculated.
Measures
Gain is defined as the ratio between the body sway amplitude and the visual
stimulus amplitude at the driving frequency (0.3Hz). Gain represents the strength of the
postural response relative to the stimulus and will be calculated as the absolute value of
the transfer function at the stimulus frequency. Gain values of close to 1 represent body
sway amplitude that is approximately equal to the visual stimulus amplitude at the
driving frequency. Values lower than 1 represent a body sway amplitude that is less than
the stimulus amplitude, and values greater than 1 represent a body sway amplitude that is
greater than the stimulus amplitude. We hypothesize that the mean gain values will be

48
dependent upon the amplitude condition presented based upon the work done by Peterka
and Benolken (1995) showing a decreased response with increasing amplitude.
Furthermore, decreased gain variability across age will indicate a response tuning
demonstrating an increased amplitude response precision. Based upon the hypothesized
transition period the gain response in the 4-year-olds would be expected to remain
constant across amplitude conditions, indicating a tight amplitude coupling regardless of
stimulus amplitude. This type of linear response reflects proportional changes in the
sway response relative to the changes in the amplitude of the stimulus. This result would
indicate that the 4-year-olds were visually dominant in the amplitude parameters of the
postural response to the dynamic stimulus.
Phase is the normalized representation of the timing between the body sway and
the visual stimulus, recovered as the complex value of the transfer function at the
stimulus frequency. A phase value of zero represents no time delay between the response
and the stimulus. Phase values greater than zero represents body sway leading the
stimulus, with phase values below zero representing body sway lagging behind the
stimulus. We hypothesize the phase values to be constant across amplitude conditions
because stimulus frequency is held constant, while a decrease in phase variability with
age will indicate an increased temporal precision to the dynamic stimulus. Based upon
Shumway-Cook and Woollacott’s notion of a transition period between 4 and 6 years of
age, we would also expect 4-year-olds to exhibit constant phase across all amplitude
conditions. However, proponents of this hypothesis would also suggest a similar phase
response to any stimulus frequency based upon the notion that early in the transition

49
period shows a visual dominance where the sway will show changes proportional to the
changes in the stimulus.
The stimulus frequency sway amplitude (SFSA) is the point on the sway response
power spectrum corresponding to the frequency of the stimulus (0.3Hz). The SFSA
represents the average power of the component of sway at the stimulus frequency and is
represented in the gain ratio as the numerator. The SFSA was calculated for both the
dynamic and static conditions. We predict that if the postural sway in the dynamic
conditions reflects a utilization of the stimulus, the SFSA response in the amplitude
conditions should all differ from the static condition. Conversely, if the postural sway in
the dynamic condition is not in response to the stimulus, the SFSA response in the static
condition should not differ from the amplitude conditions. Once the SFSA response is
assessed, the gain response can be interpreted to reflect either a response to the stimulus
or simply a consequence of general postural sway. Across age, SFSA variability is
expected to decrease with age, indicating an increased stabilization of the amplitude
response characteristic of amplitude response tuning.
ResidualPSD quantifies the amount of sway which lies in the frequency
components surrounding the frequency of the stimulus (0.3Hz). ResidualPSD is
calculated by combining the power in the bandwidths below and above the stimulus
frequency, in effect filtering out the 0.3Hz component of sway. ResidualPSD represents
body sway with the influence of the visual drive removed and was calculated for both the
dynamic and static conditions. A decrease in residsway with age would indicate a
response tuning, showing increased response precision to the visual stimulus.

50
Statistical Analysis
For the measures of SFSA and residsway, individual 3x4 MANOVA (age and
condition) with repeated measures on condition was utilized as a test of significance with
age (4, 6 and adult) and the four stimuli conditions (2, 4, 8mm and static). Univariate
repeated measures ANOVAs were used to follow up significant effects. For each of the
dependent measures of gain and phase, a 3x3 MANOVA (age and amplitude) for the
three amplitudes (2, 4, 8mm) was utilized, followed by appropriate univariate repeated
measures ANOVA. Data from both the head and CoM was included in each MANOVA.
Significant effects were followed by LSD post-hoc procedures. Level of significance was
set at 0.05 for all main effects and interactions.
Results
The results are divided into two sections. The first section addresses the question
of whether the changes in the response to the dynamic visual stimulus were due to the
tuning of the response, or a consequence of normal quiet stance development. This
section includes the analysis of the amplitude (gain, SFSA and timing (phase) of the
response. The second section contains results characterizing the tuning of the response
across age, which includes the amplitude response variability (gain STD SFSA STD),
timing variability (phase std), and residual sway power (residsway).
The moving room response: Is it real?
Amplitude response
The first analysis tested gain in order to assess the response amplitude as a
function of visual stimulus amplitude (2, 5, and 8mm) and age (4-yr, 6-yr, and adult).

51
Repeated measures MANOVA revealed a significant main effect for both head and CoM
for amplitude (F(4,24)=13.28, p<0.05), age (F(4,52)=3.10, p<0.05), and an amplitude by
age interaction (F(8,50)=4.36, p<0.05) which shows that the gain response across
amplitude conditions depended upon age. Follow up univariate analysis for the head
(Figure 13) revealed an amplitude effect (F(2,54)=24.38, p<0.05), and an amplitude by
age interaction (F(4,54)=5.3, p<0.05) and the CoM (Figure 14) revealed an amplitude
(F(2,54)=39.28, p<0.05) and an age by amplitude interaction (F(4,54)=12.98, p<0.05)
Post-hoc analysis for both the head and center of mass showed 4-year-olds responding
differently than the 6-year-olds and the adults when comparing changes in gain between
the 2mm and the 5mm conditions, and between the 2mm and the 8mm conditions. All
age groups responded similarly in the comparison between the 5mm with the 8mm
condition. Further post-hoc comparisons of the amplitude effects within age for the head
revealed: the 4-year-olds gain in the 2mm condition was significantly greater than the 5
and 8mm conditions; the 6-year-olds gain in the 8mm condition was significantly lower
than the other two conditions; and the adults gain showed a significant decrease when
comparing the 2mm and the 8mm condition. Gain from the CoM showed similar results,
except the 6-year-olds showed significant differences only in the comparison between the
2mm and the 8mm condition.

52
Figure 13. Mean Gain Values and the Standard Error of the Mean for the Head Across Amplitude
Figure 14. Mean Gain Values and the Standard Error of the Mean for the CoM Across Amplitude

53
In order to interpret the gain response as either a utilization of the visual stimulus,
or a consequence of normal sway relative to the stimulus, SFSA was assessed for each
age group and amplitude condition, including the static condition. Repeated measures
MANOVA revealed a significant main effect for amplitude (F(6,22)=33.52, p<0.05) for
age (F(4,52)=2.64, p<0.05) and a amplitude by age interaction (F(12,46)=6.47, p<0.05).
The age by amplitude interaction revealed the SFSA response across amplitude to be
dependent upon age. Follow up univariate analysis of the head (Figure 15) revealed an
amplitude (F(3,81)=89.52, p<0.05) and an age by amplitude interaction (F(6,81)=5.55,
p<0.05), while the CoM (Figure 16) also revealed an amplitude (F(3,81)=67.63, p<0.05)
and an age by amplitude interaction (F(6,81)=6.74, p<0.05). Post-hoc analysis of the
interaction for the head and center of mass revealed that all age groups responded
similarly in the comparison between the static and the 2mm condition. Furthermore, the
4-year-olds where shown to have responded differently from the other age groups in the
comparison between the static and the 5mm condition, and between the static condition
and the 8mm condition. Further comparisons of the 4-year-olds SFSA response from the
head revealed no significant differences between the static condition and the 2mm
condition, with an increase across the 2, 5, and 8mm amplitude conditions. Post-hoc
analysis of the CoM showed a SFSA response that was significantly greater in the 8mm
than the other conditions. The 6-year-olds head SFSA showed no difference between the
static and the 2mm condition, with an increase in SFSA from the 2mm to the 5mm
condition, and no significant differences between the 5mm and the 8mm conditions. The
CoM also showed no difference between the static and the 2mm condition, with an
increase in SFSA as a function of stimulus amplitude. The adult’s SFSA response from

54
the head increased across all conditions, where the CoM showed a similar increase,
except no significant difference was found in the comparison between the 5mm and the
8mm conditions.
Figure 15. Mean SFSA Values and the Standard Error of the Mean for the Head SFSA Across Amplitude

55
T
Timing response
To assess the timing of the postural response relative to the stimulus, phase was
calculated for each age group and amplitude. Repeated measures MANOVA revealed a
significant main effect for amplitude (F(4,24)=5.38, p<0.05) and an amplitude by age
interaction (F(8,50)=4.12, p<0.05). Follow up univariate analysis showed a condition
effect for the CoM (Figure 18) (F(2,81)=4.87, p<0.05) with no interaction, and an age
effect for the head (Figure 17) (F(2,81)=3.94, p<0.05) with no interaction. Post hoc
comparisons for the CoM showed that the 2mm condition was significantly lower than
the other conditions indicating a phase lag response, while the age comparisons for the
head showed 4-year-olds had a reduced phase lag response compared to the other ages.
Figure 16. Mean Values and the Standard Error of the Mean for the CoM SFSA Across Amplitude

56
Figure 18. Mean Phase Values and the Standard Error of the Mean for the Head Across Amplitude
Figure 17. Mean Phase Values and the Standard Error of the Mean for the CoM Across Amplitude

57
Perception/action tuning
Amplitude variability
The next analysis evaluated gain variability (Figure 19 and Figure 20) as it
reflects the tuning of the response to the visual stimulus. A significant main effect for age
(F(4,52)=6.175, p<0.05) was found in gain’s standard deviations of the mean. Post hoc
analysis revealed that the 4- and 6-year-olds responded similarly, but differed from the
adults, with the children showing larger gain variability than the adults.
Figure 19. Standard Deviation of the Head Gain Across Amplitude
Head Gain Variability
0.00
0.50
1.00
1.50
2.00
2.50
2mm 5mm 8mm
Amplitude Condition
Gai
n St
anda
rd D
evia
tion
4yrolds6yroldsadults

58
Similar to gain variability, the measurements of SFSA variability are of interest as
it pertains to the tuning of the postural response (Figure 21 and Figure 22). MANOVA
revealed a significant main effect for age (F(4,52)=7.50, p<0.05) in the SFSA’s standard
deviations of the mean. Post hoc analysis shows that in both the head and CoM the 4- and
6-year-olds responded similarly and both had larger variability than adults.
Figure 20. Standard Deviation of the CoM Gain Across Amplitude
CoM Gain Variability
0.00
0.50
1.00
1.50
2.00
2.50
2mm 5mm 8mm
Amplitude Condition
Gai
n St
anda
rd D
evia
tion
4yrolds6yroldsadults

59
Figure 22. Standard Deviation of the Head SFSA Across Amplitude
Figure 21. Standard Deviation of the CoM SFSA Across Amplitude
Head SFSA Variability
0.00
0.05
0.10
0.15
0.20
0.25
0.30
0.35
0.40
static 2mm 5mm 8mm
Amplitude Condition
SFSA
Sta
ndar
d D
evia
tion
4yrolds6yroldsadults
CoM SFSA Variability
0.00
0.02
0.04
0.06
0.08
0.10
0.12
0.14
0.16
0.18
0.20
static 2mm 5mm 8mm
Amplitude Condition
SFSA
Sta
ndar
d D
evia
tion
4yrolds6yroldsadults

60
Timing variability
The next analysis assessed phase variability to characterize the stability of the
response timing. A significant main effect for age (F(4,54)=6.06, p<0.05), amplitude
(F(4,24)=7.38, p<0.05), and a amplitude by age interaction (F(8,50)=3.83, p<0.05) was
found. Follow up univariate analysis for the head (Figure 23) shows an age effect
(F(2,27)=12.96, p<0.05), amplitude effect (F(2,54)=9.56, p<0.05), with no age by
amplitude interaction. Analysis of the CoM (Figure 24) also shows an effect for age
(F(2,27)=16.97, p<0.05), condition (F(2,54)=6.90, p<0.05), with no interaction. Post-hoc
comparisons for the head with respect to condition shows the 2mm condition was
significantly larger variability than the other two amplitudes, while the age comparisons
for the head revealed the 4-year-olds were significantly more variable than the other age
groups. The comparisons for the CoM resulted in similar findings.

61
Head Phase Variability
0.00
10.00
20.00
30.00
40.00
50.00
60.00
70.00
80.00
2mm 5mm 8mm
Amplitude Condition
Phas
e St
anda
rd D
evia
tion
4yrolds6yroldsadults
Figure 24. Standard Deviation of the Head Phase Across Amplitude
CoM Phase Variability
0.00
10.00
20.00
30.00
40.00
50.00
60.00
70.00
80.00
2mm 5mm 8mm
Amplitude Condition
Phas
e St
anda
rd D
evia
tion
4yrolds6yroldsadults
Figure 23. Standard Deviation of the CoM Phase Across Amplitude

62
Sway variability
To further characterize the response tuning, residsway was calculated for each
condition and age group (Figure 25 and Figure 26). Repeated measures MANOVA
revealed a significant main effect for age (F(4,52)=10.15, p<0.05), but not for amplitude
(F(6,22)=1.85, p>0.05). The age by amplitude interaction was not significant. The age
main effect shows a decrease in residsway with increasing age, revealing a decrease in
sway not associated with the visual drive, consistent with the notion of a response tuning
across development.
Figure 25. Mean residsway Values and the Standard Error of the Mean for the Head Across Amplitude

63
Discussion
The present study examined the effect of varying visual stimulus amplitude on the
postural response in children to determine if the changes in the moving room response are
due to a response tuning, or a consequence of normal quiet stance development. Results
showed the amplitude of the postural response increased as a function of increasing
visual stimulus amplitude, elevating to levels above baseline sway. This finding suggest
that the visual stimulus influenced the postural sway and that the moving room response
is not purely the coincidence of normal stance sway in front of a stimulus, but rather a
utilization of sensory information. Further examination of the amplitude response reveals
a non-linearity in the sway response with increasing stimulus amplitude that differed
Figure 26. Mean residsway Values and the Standard Error of the Mean for the CoM Across Amplitude

64
depending upon age. Lastly, decreases in both the amplitude and timing variability along
with the decrease in sway not associated with the stimulus frequency, show increased
response precision with age. This finding illustrates the changes in the stability of the
response across age, describing the postural response tuning. Each of these issues are
discussed below.
Moving Room Response: Is It Real?
The results of the SFSA analysis indicated that as the visual stimulus amplitude
was increased, the amplitude of the postural response increased for all age groups,
suggesting that the stimulus influenced postural sway. Furthermore, the trajectory of the
SFSA response as a function of amplitude differed for each age group as indicated by the
interaction between the two variables. For example, both the 4- and the 6-year-olds
showed no significant differences between the static condition and the 2mm condition,
whereas the adults showed an increase across the two conditions. One possible
explanation for this may come from the fact that the younger 4- and 6-year-olds generally
showed larger amounts of baseline sway than the adults did, that may have masked the
small 2mm amplitude stimulus. In other words, the 2mm amplitude condition may not
have been large enough relative to the children’s sway to have been detected with the
SFSA measure.
This may also in part explain the timing response at the 2mm condition. Phase
showed the largest variability at the 2mm condition, making it difficult to interpret the
amplitude response at that condition because the response must be defined in terms of
frequency, amplitude and timing. If the timing relationship is variable, the response

65
amplitude could be explained as coincidence rather than responding to the stimulus. In
spite of this finding, phase at the 5mm and 8mm conditions was shown to have been
more stable, and indicated that the participants adopted the same temporal patterns across
the two amplitudes, which was expected because the stimulus frequency was kept
constant throughout the experiment. This type of stable phase response supports the
notion that the amplitude response was due to the changing visual stimulus, and not
coincident, within the 5mm and 8mm conditions.
Sensory Information: How is it being used?
Results of the current study found the gain values to be dependent upon amplitude
condition. This gain profile indicated a non-linear response, where sway amplitude did
not increase in proportion to the increases in stimulus amplitude, resulting in different
gain values for each condition (Oie, Kiemel, & Jeka, 2001). This finding is contrary to
the hypothesized transition period of visual dominance to multisensory capability, rather
this non-linear response may be an indication of a sensory re-weighting, where the
postural control system dynamically re-weights multiple sensory inputs to maintain
upright stance as sensory conditions change (Horak & Macpherson, 1996). This appears
to be present even in the 4-year-olds and casts further doubt on the hypothesized
transition period. The postural control system must be flexible as individuals interact
with the environment as they encounter many small changes in sensory conditions, which
in some cases cause ambiguity if changes in one sensory input are not detected in other
sensory systems. For example, standing on a street corner, a change from a red to a green
light will cause objects in the environment (cars) to create a large visual flow. The control
system may interpret this visual information as self-motion, whereas somatosensory and

66
vestibular inputs do not reflect this visual information. To maintain balance, the control
system may need to minimize the visual information and maximize the other inputs as
valid information (Collins & De Luca, 1995). In other words flexible balance control
requires the ability to adjust the weights to different inputs based upon changes in the
sensory environment. The non-linear gain response found in the current study may be a
result of the control system recognizing the large amplitude stimulus as non-veridical and
re-weights the visual input, causing an amplitude response that was not as large in
proportion to the stimulus as the other smaller conditions.
The re-weighting hypothesis implies a scheme to determine the optimal shifts in
sensory weights. Schöner et al. (1998) suggested a categorization scheme where the
nervous system labels small amplitude stimuli as self-motion, whereas large amplitude
motion is seen as object motion within the environment. An input viewed as being object
motion would result in setting that weight low because it is a less reliable indicator of self
motion (Schöner, Dijkstra, & Jeka, 1998). One example of how this process can be
achieved comes from previous work in adults that has shown a saturation effect such that
an increase in stimulus amplitude past a certain threshold level did not evoke increases in
postural sway (van Asten, Gielen, & Denier van der Gon JJ, 1988; Lestienne et al., 1977).
Peterka & Benolken (1995) did one such study in a comparison between normal
participants and bilateral vestibular patients and found that the normals showed the
saturation effect, while the vestibular patients did not. With increases in stimulus
amplitude, the vestibular patients where found to increase there sway until falling. This
suggests that the sensory cues that caused this saturation where of vestibular origin.
Furthermore, both groups performed similarly until the stimulus amplitude reached the

67
saturation point, suggesting a threshold where visual and vestibular inputs are re-
weighted in order to maintain balance. It is possible that this saturation effect is a
reflection of the re-weighting process between the visual and vestibular inputs as a
function of visual stimulus amplitude (Nashner, Black, & Wall, III, 1982).
In the current study, a saturation effect was not seen in the measure of SFSA. One
possible reason could be that the amplitudes used were not large enough to surpass the
vestibular threshold. The largest amplitude used in this study was 8mm, well within the
bounds of stability for both the children and adults. Hypothetically if the current study
included larger stimulus amplitudes, saturation would be expected. One other factor may
have been the frequency of the stimulus. Peterka & Benolken (1995) showed the
saturation point to be depended upon the stimulus frequency, where increases in
frequency decreased the saturation point. The combination of frequency and amplitudes
used in the current study may not have been optimal for creating sway saturation.
It is also interesting to note here that both amplitude measures (gain, SFSA)
showed different responses across amplitude conditions as indicated by the interaction.
Although the responses qualitatively looked similar, differences were seen. With regards
to the re-weighing hypothesis discussed above, one explanation may be that the
mechanisms for sensory re-weighting may not be fully developed in the younger children
(Shumway-Cook & Woollacott, 1995). Schumway-Cook & Woollacott (1985) suggested
a transition period between 4 to 6 years of age in the use of sensory information for the
control of posture. According to the authors, vision is the primary source of information
used to control posture early in the transition period. By the end of this period the child is
able to integrate inputs from the visual, somatosensory and vestibular systems in an adult-

68
like manner. According to this hypothesis, the re-weighting process may not be able to
available until after the transition period when the child is able to use sensory information
in an integrated fashion.
Tuning of the postural response
Bertenthal et al (1997) describes the changes in the visuomotor control of posture
as an increased precision of the coupling between perception and action, a tuning of the
postural response across age. The results of the study showed this response tuning to the
visual stimulus as a decrease in the amplitude and timing variability, with a decrease in
sway not associated with the drive. How does the control system change to create these
tuning effects in postural sway with age? Some insight into this question may come from
a feedback control model of upright stance.
Peterka (2000) utilizes a model consisting of an inverted pendulum with
corrective torques applied to the ankle to describe sway. This model uses an error signal
(desired state-actual state) detected by sensory inputs to create these torques. These
torques are scaled with a proportional, integral, derivative controller (PID) based upon
feedback information on position, velocity, and integral of sway. Simulations of this
model with varying weights for the position, velocity and integral parameters produced a
number of sway profiles some that resemble healthy adults and some that contained large
amounts of variability, similar to what is seen in children’s sway. Based upon these
findings, it may be possible that the tuning process may lie within the optimal selection of
the sensory weights with age. Added complexities to this sensory tuning process include
the changes in the mechanical system being controlled. This tuning process must take
into account the growth and change of body proportions occurring in development

69
(McCollum et al., 1989). This would be akin to changing the parameters of the inverted
pendulum in the model discussed above. Changes in the sensory weights need to be based
upon the current properties of the mechanical system, therefore if the mechanical system
changes, the sensory weights need to change as well. Both need to be accounted for to
produce stable postural control.
Summary
The results from the present study indicate that the postural response to a dynamic
visual stimulus may be characterized as a visuomotor response that with development
appears to show improvements in the precision of the response amplitude and the timing.
These findings did not support the hypothetical transition period proposed by Schumway-
Cook & Woollacott (1985) where postural control development is seen as going from
visual dominance to multisensory capable. Rather the results suggest that age-related
tuning changes may be in part due to the ability to utilize appropriate aspects of the
sensory information provided.

70
Chapter V
General Discussion
When presented with a visual stimulus oscillating at varying frequencies,
children’s responses depend upon the frequency of the stimulus as shown in similar
studies with adults. Furthermore, the gain variability and residual sway decreased with
increasing age showing an increased response precision with age. When the frequency of
oscillation was held constant and the amplitude was manipulated, the children’s postural
response increased with increasing stimulus amplitude to levels above baseline sway,
demonstrating vision’s influence on sway. The response variability decreased with
increasing age, again showing the increased response precision with development.
Taken together, the findings from these two studies lead to several
generalizations. The first is that the response to the dynamic visual stimuli (i.e., moving
room) is a reflection of the use of visual information for postural control, and is not
simply a consequence of normal postural sway in children. Our findings confirm this
interpretation, which allows for an explanation of the effects stimulus frequency and
amplitude manipulations had on sway in terms of sensorimotor control.
The second generalization is that the coordination between vision and the motor
response appear to show improvements with development. This was evident in our
findings as an increased stabilization of the amplitude and timing parameters of the
response, along with a decrease in residual sway with age, indicating a postural response
tuning. This tuning process indicates a change in the use of visual information for
postural control with development.

71
Lastly, the children’s response amplitude and timing in both the frequency and
amplitude manipulations do not support Shumway-Cook & Woollacott’s hypothesis
(1985) that characterizes 4-year-olds as visually dominant while 6-year-olds are
considered multisensory capable in terms of the use of sensory information for postural
control. The children’s amplitude and timing responses to a dynamic visual stimulus,
along with the age-related tuning changes observed suggest that the events occurring
during this period of development may not be a transition from visual dominance to
multisensory integration capabilities, but rather learning to utilize the appropriate aspects
of the sensory information available.

72
Chapter VI
Recommendations for Future Studies
In the current study we found the children’s response to dynamic visual stimuli
can be characterized as a utilization of visual information for postural control, rather than
a coincidence of normal quiet stance in front of the oscillating stimulus. Furthermore,
age-related improvements in the response precision were found to be consistent with the
notion of a response tuning with development. In this last chapter we discuss further
studies on vision’s influence on postural control based upon the preceding findings to
extend our knowledge of postural control development.
When observing the effects of varying stimulus frequency on postural sway, we
were limited in the number of stimulus frequencies presented due to the number of trials
that could be collected within a reasonable length of time for the children before fatigue,
boredom, and inattentiveness become factors. Although the frequencies used did provide
an initial understanding of its effects on postural sway, it did not allow us to observe the
response beyond this frequency range and were limited to hypotheses based on
qualitative interpolations. Based upon previous work (Jeka et al, 2000), we expect that if
higher frequencies were used we would see gain values decrease with increasing
frequency. Deviations from this trend (e.g. consistent or increased gain across
frequencies) would suggest changes in the use of visual information with respect to the
response amplitude with development. Furthermore, we would expect phase to show an
increased phase lag with increasing frequency. Deviations from this hypothesized result
would again indicate changes in the temporal structure of the response with development.

73
The characterization of the stimulus amplitude effects were also limited in the
number of amplitudes presented to the children again owing to fatigue, inattentiveness,
and boredom concerns. Although the amplitude range used demonstrated vision’s
influence on the sway response, we did not observe a saturation of sway amplitude as
seen in previous work. Based upon Peterka & Benolken (1995), we would expect that if
larger amplitudes were used, we would see a saturation point in the sway response. If
children are shown to have a different saturation point when compared to adults, it would
imply changes in the use of sensory information for postural control across development.
One other influential factor may be the frequency at which the amplitude manipulation is
performed. Peterka & Benolken (1995) showed that the saturation point depended upon
frequency, therefore, further studies utilizing varying frequency and amplitude
manipulations combined may uncover developmental changes in the optimal parameters
necessary to elicit the saturation phenomenon.
The trial lengths in the current study were constrained to limit fatigue, boredom,
and attention issues in the child participants. Unfortunately, this restricts any modeling
efforts where longer trials are needed for this to be a valid tool. In chapter four’s
discussion, we introduced a PID control model as a possible descriptor of the changes in
sensory information use and its effect on sway. It may be beneficial to conduct future
studies with a smaller number of longer, continuous trials in order to utilize this model
for the further investigation of the underlying mechanisms of this tuning response.
Qualitative and quantitative model predictions could be compared to the collected sway
trajectories. If the manipulated parameters of the PID model produced changes in the

74
simulated sway trajectories that mimic what is seen in development it could inform our
understanding of vision’s role in postural control development.
In summary, the goal for future studies should include a broader range of stimulus
manipulations to further characterize the children’s responses to dynamic visual stimuli.
If the children’s responses to these extended stimulus variations show differences when
compared to adults, there may be an indication of further developmental changes in the
use of vision for postural control. Future studies should also incorporate modeling
techniques to further investigate the tuning response seen with development. While we
were able to observe the postural response tuning, the underlying mechanisms that caused
these changes are still in need of further study. The PID control model introduced in
Peterka (2000) is a possible candidate for this analysis based upon the hypothesis that the
development of the response tuning are due to changes in the use of various properties of
the sensory stimulus. These goals must be met in order to extend the knowledge base
concerning the development of postural control.

75
APPENDIX A
PARTICIPANT CONSENT FORMS EXPERIMENT 1

76
Project Statement of Subject’s Age Purpose Procedure Risks Confidentiality Benefits: Freedom to Withdraw and Ask Questions Where Medical Care is Available (as applicable) Name, Address and Phone of Principal Investigator
PARENTAL CONSENT FORM
The Effects of Vision on Postural Control in Children. I state that I am 18 years of age and that I allow my child to participate in a program of research being conducted by Dr. Jane E. Clark, University of Maryland at College Park, Department of Kinesiology. I understand that the purpose of this research is to examine how the information from vision influences postural control in 6-year-old children. The procedure involves my child, initially, to be submitted to a test of motor performance called the Movement Assessment Battery for Children, adequate for his/her age, which will last for approximately 25 minutes and that will cause little or no physical or mental stress. On a different day, to be scheduled in agreement with the parent, the child will come to the Cognitive Motor Behavior Laboratory where an experimental session will be held. He/she will stand quietly on an elevated platform while looking to a screen where moving dots or non-moving dots will be displayed. A small plastic triangle, which constitutes an ultrasound tracker, will be attached to the child’s lower back and to a band on the head so that the movement of the head and body can be measured. Eight to ten trials will be collected. Each trial will last one minute. The whole experimental session will last one hour. The entire testing session will be videotaped to monitor the postural behavior during the experimental session. I understand that as a result of my child's participation in this study, he/she may experience muscle fatigue but there are no other known risks and no long-term effect associated with participation in this study. All information about the children is confidential and the child's name will not be identified any time. All videotape material will be secured in locked cabinets in the laboratory, were only the principal investigator and lab assistants will have access to them. The tapes will be destroyed after the completion of the study. I understand that this experiment is not designed to help my child, but that the investigation seeks to learn more about postural control in children. I understand that I am free to ask questions or to withdraw my child from participation at any time without penalty. I understand that I must have signed copy of this consent form given to me and that the investigators will provide me the results from the study. In the event of child’s physical injury resulting from participation in this study, I understand that immediate medical treatment is available nearby at Washington Adventist Hospital in Takoma Park. However, I understand that the University of Maryland does not provide any medical or hospital insurance coverage for the participants in the research study nor will the University of Maryland provide compensation for any injury sustained as a result of participation in this research study except as required by law. Jane E. Clark Department of Kinesiology, College of Health and Human Performance, UM at College Park (301) 405-2474 (office) (301) 405-2574 (lab) --------------------------------------------------- ----------------------------- Name of child Birthday
--------------------------------------------------- ------------------------------ Signature of parent Date

77
Project Statement of Subject’s Age Purpose Procedure Risks Confidentiality Benefits: Freedom to Withdraw and Ask Questions Where Medical Care is Available (as applicable) Name, Address and Phone of Principal Investigator
CONSENT FORM
The Effects of Vision on Postural Control in Children. I state that I am 18 years of age and that I wish to participate in a program of research being conducted by Dr. Jane E. Clark, University of Maryland at College Park, Department of Kinesiology. I understand that the purpose of this research is to examine how the information from vision influences postural control in adults to compare to children. The procedure involves me to come to the Cognitive Motor Behavior Laboratory where the experimental session will be held. I will stand quietly barefoot in a heel-to-toe stance while looking to a screen where moving dots will be displayed while wearing goggles. A small plastic triangle, which constitutes an ultrasound tracker, will be attached to my lower back and to a band on the head so that the movement of the head and body can be measured.Eight to ten trials will be collected. Each trial will last one minute. The whole experimental session will last one hour. The entire testing session will be videotaped to monitor the postural behavior during the experimental session. I understand that as a result of my participation in this study, I may experience muscle fatigue but there are no other known risks and no long-term effect associated with participation in this study. All information about my participation is confidential and my name will not be identified any time. All videotape material will be secured in locked cabinets in the laboratory, were only the principal investigator and lab assistants will have access to them. The tapes will be destroyed after the completion of the study. I understand that this experiment is not designed to help me personally, but that the investigation seeks to learn more about postural control in children. I understand that I am free to ask questions or to withdraw from participation at any time without penalty. I understand that I must have signed copy of this consent form given to me and that the investigators will provide me the results from the study. In the event of physical injury resulting from participation in this study, I understand that immediate medical treatment is available nearby at Washington Adventist Hospital in Takoma Park. However, I understand that the University of Maryland does not provide any medical or hospital insurance coverage for the participants in the research study nor will the University of Maryland provide compensation for any injury sustained as a result of participation in this research study except as required by law. Jane E. Clark Department of Kinesiology, College of Health and Human Performance, UM at College Park (301) 405-2474 (office) (301) 405-2574 (lab) --------------------------------------------------- ----------------------------- Name of participant Birthday
--------------------------------------------------- ------------------------------ Signature of participant Date

78
APPENDIX B
PARTICIPANT CONSENT FORMS FOR EXPERIMENT 2

79
Project Statement of Subject’s Age Purpose Procedure Risks Confidentiality Benefits: Freedom to Withdraw and Ask Questions Where Medical Care is Available (as applicable) Name, Address and Phone of Principal Investigator
PARENTAL CONSENT FORM
The Effects of Vision on Postural Control in Children. I state that I am 18 years of age and that I wish my child to participate in a program of research being conducted by Dr. Jane E. Clark, University of Maryland at College Park, Department of Kinesiology. I understand that the purpose of this research is to examine how the information from vision influences postural control in children. The procedure involves my child to come to the Cognitive Motor Behavior Laboratory where the experimental session will be held. He/she will stand quietly, barefoot in a heel-to-toe stance on an elevated platform while looking to a screen where moving dots or non-moving dots will be displayed while wearing goggles. A small plastic triangle, which constitutes an ultrasound tracker, will be attached to the child’s lower back and to a band on the head so that the movement of the head and body can be measured. Twelve 60 second trials will be collectedThe whole experimental session will last approximately one and a half hours. At the end of the experimental session my child will receive stickers and a small toy. I understand that as a result of my child’s participation in this study, he/she may experience muscle fatigue but there are no other known risks and no long-term effect associated with participation in this study. All information about the children is confidential and the child’s name will not be identified any time. All participant material will be secured in locked cabinets in the laboratory, were only the principal investigator and lab assistants will have access to them. I understand that this experiment is not designed to help my child, but that the investigation seeks to learn more about postural control in children. I understand that I am free to ask questions or to withdraw my child from participation at any time without penalty. I understand that I must have signed copy of this consent form given to me and that the investigators will provide me the results from the study. The University of Maryland does not provide any medical or hospital insurance coverage for the participants in the research study nor will the University of Maryland provide compensation for any injury sustained as a result of participation in this research study except as required by law. Jane E. Clark Department of Kinesiology, College of Health and Human Performance, UM at College Park (301) 405-2474 (office) (301) 405-2574 (lab) If you have any questions about your rights or those of your child as a research subject you may contact: Marc Rogers, Chair HSRC Dept. of Kinesiology 301-405-2484 email: [email protected] --------------------------------------------------- ----------------------------- Name of child Birthday --------------------------------------------------- Name of Parent
--------------------------------------------------- ------------------------------ Signature of Parent Date

80
Project Statement of Subject’s Age Purpose Procedure Risks Confidentiality Benefits: Freedom to Withdraw and Ask Questions Where Medical Care is Available (as applicable) Name, Address and Phone of Principal Investigator
CONSENT FORM The Effects of Vision on Postural Control in Children. I state that I am 18 years of age and that I wish to participate in a program of research being conducted by Dr. Jane E. Clark, University of Maryland at College Park, Department of Kinesiology. I understand that the purpose of this research is to examine how the information from vision influences postural control in adults to compare to children. The procedure involves me to come to the Cognitive Motor Behavior Laboratory where the experimental session will be held. I will stand quietly barefoot in a heel-to-toe stance while looking to a screen where moving dots or non-moving dots will be displayed while wearing goggles. A small plastic triangle, which constitutes an ultrasound tracker, will be attached to my lower back and to a band on the head so that the movement of the head and body can be measured. Twelve 60 second trials will be collected. The whole experimental session will last approximately one and a half hours. I understand that as a result of my participation in this study, I may experience muscle fatigue but there are no other known risks and no long-term effect associated with participation in this study. All information about my participation is confidential and my name will not be identified any time. All participant material will be secured in locked cabinets in the laboratory, were only the principal investigator and lab assistants will have access to them. I understand that this experiment is not designed to help me personally, but that the investigation seeks to learn more about postural control in children. I understand that I am free to ask questions or to withdraw from participation at any time without penalty. I understand that I must have signed copy of this consent form given to me and that the investigators will provide me the results from the study. The University of Maryland does not provide any medical or hospital insurance coverage for the participants in the research study nor will the University of Maryland provide compensation for any injury sustained as a result of participation in this research study except as required by law. Jane E. Clark Department of Kinesiology, College of Health and Human Performance, UM at College Park (301) 405-2474 (office) (301) 405-2574 (lab) If you have any questions about your rights as a research subject you may contact: Marc Rogers, Chair HSRC Dept. of Kinesiology 301-405-2484 email: [email protected] --------------------------------------------------- ----------------------------- Name of participant Birthday
--------------------------------------------------- ------------------------------ Signature of participant Date

81
APPENDIX C
SUMMARY OF DATA SPREADSHEETS EXPERIMENT 1
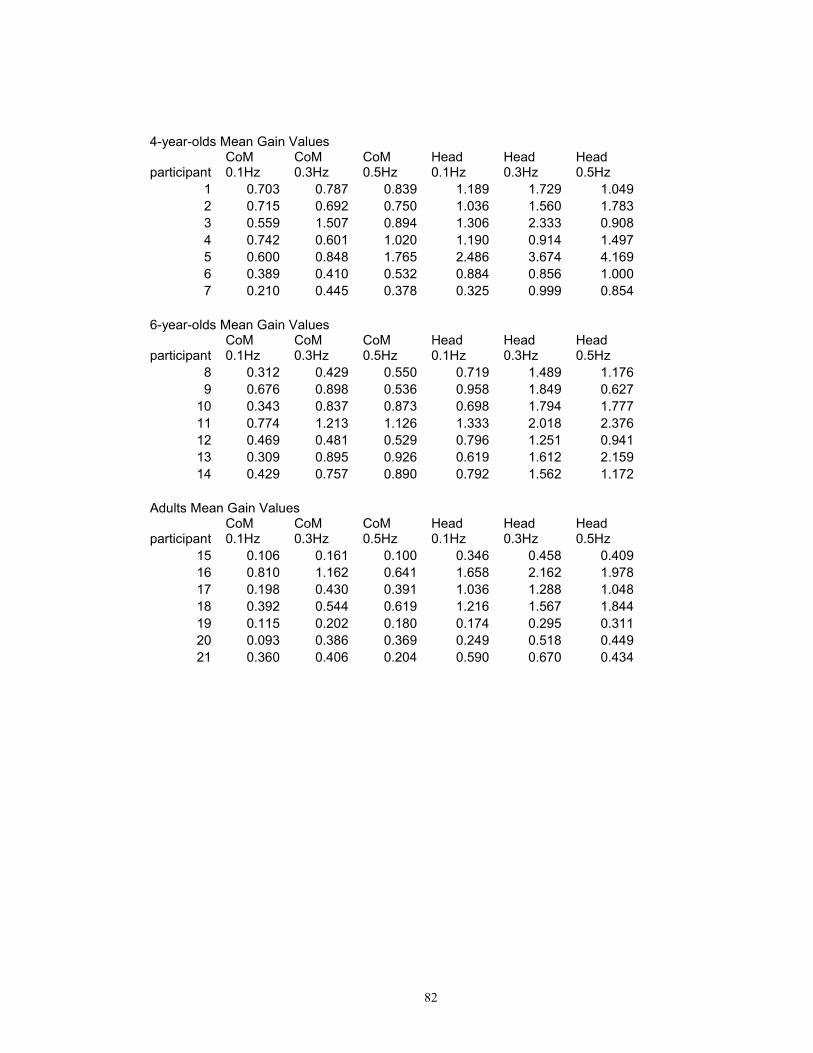
82
4-year-olds Mean Gain Values
participant CoM 0.1Hz
CoM 0.3Hz
CoM 0.5Hz
Head 0.1Hz
Head 0.3Hz
Head 0.5Hz
1 0.703 0.787 0.839 1.189 1.729 1.049 2 0.715 0.692 0.750 1.036 1.560 1.783 3 0.559 1.507 0.894 1.306 2.333 0.908 4 0.742 0.601 1.020 1.190 0.914 1.497 5 0.600 0.848 1.765 2.486 3.674 4.169 6 0.389 0.410 0.532 0.884 0.856 1.000 7 0.210 0.445 0.378 0.325 0.999 0.854
6-year-olds Mean Gain Values
participant CoM 0.1Hz
CoM 0.3Hz
CoM 0.5Hz
Head 0.1Hz
Head 0.3Hz
Head 0.5Hz
8 0.312 0.429 0.550 0.719 1.489 1.176 9 0.676 0.898 0.536 0.958 1.849 0.627
10 0.343 0.837 0.873 0.698 1.794 1.777 11 0.774 1.213 1.126 1.333 2.018 2.376 12 0.469 0.481 0.529 0.796 1.251 0.941 13 0.309 0.895 0.926 0.619 1.612 2.159 14 0.429 0.757 0.890 0.792 1.562 1.172
Adults Mean Gain Values
participant CoM 0.1Hz
CoM 0.3Hz
CoM 0.5Hz
Head 0.1Hz
Head 0.3Hz
Head 0.5Hz
15 0.106 0.161 0.100 0.346 0.458 0.409 16 0.810 1.162 0.641 1.658 2.162 1.978 17 0.198 0.430 0.391 1.036 1.288 1.048 18 0.392 0.544 0.619 1.216 1.567 1.844 19 0.115 0.202 0.180 0.174 0.295 0.311 20 0.093 0.386 0.369 0.249 0.518 0.449 21 0.360 0.406 0.204 0.590 0.670 0.434

83
4-year-olds Gain Standard Deviation
participant CoM 0.1Hz
CoM 0.3Hz
CoM 0.5Hz
Head 0.1Hz
Head 0.3Hz
Head 0.5Hz
1 0.551 0.653 0.653 0.869 0.999 0.335 2 0.710 0.084 0.235 0.256 0.508 0.375 3 0.124 0.454 0.335 0.809 1.491 0.107 4 0.122 0.178 0.390 0.264 0.802 0.733 5 0.044 0.364 0.245 1.049 1.227 0.914 6 0.196 0.183 0.079 0.341 0.166 0.181 7 0.098 0.203 0.111 0.200 0.099 0.280
6-year-olds Gain Standard Deviation
participant CoM 0.1Hz
CoM 0.3Hz
CoM 0.5Hz
Head 0.1Hz
Head 0.3Hz
Head 0.5Hz
8 0.087 0.104 0.505 0.242 0.796 0.615 9 0.240 0.150 0.220 0.122 0.279 0.220
10 0.195 0.067 0.170 0.243 0.205 0.590 11 0.399 0.121 0.815 0.579 0.547 0.731 12 0.234 0.372 0.214 0.330 0.901 0.197 13 0.082 0.284 0.351 0.451 0.307 0.684 14 0.375 0.581 0.211 0.214 0.983 0.541
Adults Gain Standard Deviation
participant CoM 0.1Hz
CoM 0.3Hz
CoM 0.5Hz
Head 0.1Hz
Head 0.3Hz
Head 0.5Hz
15 0.008 0.026 0.079 0.061 0.072 0.193 16 0.069 0.188 0.215 0.237 0.160 0.319 17 0.077 0.158 0.107 0.712 0.574 1.002 18 0.007 0.037 0.015 0.160 0.023 0.073 19 0.006 0.109 0.099 0.045 0.197 0.199 20 0.045 0.231 0.427 0.129 0.201 0.491 21 0.127 0.266 0.010 0.182 0.426 0.055

84
4-year-olds Mean Phase Values
participant CoM 0.1Hz
CoM 0.3Hz
CoM 0.5Hz
Head 0.1Hz
Head 0.3Hz
Head 0.5Hz
1 126.735 39.645 71.848 166.792 -91.482 -123.567 2 91.399 16.431 -77.293 66.397 -16.314 -100.242 3 122.451 -49.641 -58.141 122.953 -48.604 -101.614 4 51.533 -83.371 -49.754 63.201 -61.681 -86.080 5 72.941 -7.543 -8.358 60.902 -13.413 -90.740 6 50.865 5.446 -70.036 30.886 -46.710 -51.115 7 125.650 -5.557 -40.937 49.255 -25.377 -102.531
6-year-olds Mean Phase Values
participant CoM 0.1Hz
CoM 0.3Hz
CoM 0.5Hz
Head 0.1Hz
Head 0.3Hz
Head 0.5Hz
8 37.589 12.887 -25.096 32.226 -29.464 -142.401 9 56.837 -25.774 -96.881 34.429 -41.757 -92.821
10 98.189 -4.074 -45.041 63.023 -18.114 -93.739 11 64.316 3.423 -74.965 74.663 -27.555 -95.580 12 39.409 2.261 -70.845 14.309 -34.939 -88.829 13 87.764 12.471 -48.900 36.778 -0.252 -80.098 14 132.216 7.087 -89.536 101.418 24.502 -73.180
Adults Mean Phase Values
participant CoM 0.1Hz
CoM 0.3Hz
CoM 0.5Hz
Head 0.1Hz
Head 0.3Hz
Head 0.5Hz
15 161.326 -105.266 140.261 -3.075 66.781 -6.878 16 54.365 -17.824 -63.146 30.276 -43.930 -120.731 17 -59.427 166.770 96.721 -158.978 110.560 54.556 18 -144.754 157.764 82.532 26.345 -23.866 -101.392 19 153.298 80.946 50.701 143.147 69.414 46.958 20 132.413 -156.955 43.931 136.771 -163.575 34.984 21 8.129 10.861 -32.855 10.383 4.739 -36.418

85
4-year-olds Phase Standard Deviation
participant CoM 0.1Hz
CoM 0.3Hz
CoM 0.5Hz
Head 0.1Hz
Head 0.3Hz
Head 0.5Hz
1 64.002 71.911 64.519 57.370 62.745 53.590 2 25.705 35.627 32.053 21.042 13.759 22.073 3 22.059 53.968 2.583 11.867 53.359 45.412 4 57.170 25.392 39.969 63.918 74.471 24.121 5 14.682 17.771 9.786 11.918 11.611 7.831 6 27.447 26.399 66.104 45.113 9.620 29.846 7 49.279 27.711 36.610 63.453 23.400 33.329
6-year-olds Phase Standard Deviation
participant CoM 0.1Hz
CoM 0.3Hz
CoM 0.5Hz
Head 0.1Hz
Head 0.3Hz
Head 0.5Hz
8 18.145 11.529 72.859 22.004 24.465 58.241 9 11.626 33.126 24.967 9.110 24.362 5.955
10 15.710 13.417 25.075 8.950 13.870 5.413 11 2.892 13.087 69.421 31.964 14.671 21.068 12 16.991 21.597 6.394 12.690 44.570 30.117 13 23.009 7.004 16.247 10.175 9.509 17.796 14 50.931 41.754 39.466 24.541 59.945 50.223
Adults Phase Standard Deviation
participant CoM 0.1Hz
CoM 0.3Hz
CoM 0.5Hz
Head 0.1Hz
Head 0.3Hz
Head 0.5Hz
15 16.187 18.610 44.963 22.644 16.748 19.717 16 12.500 7.763 9.015 13.204 7.054 18.041 17 44.312 44.286 12.209 54.419 25.093 36.274 18 6.142 4.472 7.126 2.844 1.941 7.710 19 52.300 69.818 22.136 59.439 70.614 8.384 20 58.794 62.926 64.764 66.908 63.525 63.564 21 64.572 47.382 39.573 65.160 37.749 40.920

86
4-year-olds Mean residsway Values
participant CoM 0.1Hz
CoM 0.3Hz
CoM 0.5Hz
Head 0.1Hz
Head 0.3Hz
Head 0.5Hz
1 0.229 0.170 0.182 0.376 0.309 0.250 2 0.283 0.102 0.128 0.248 0.188 0.220 3 0.235 0.178 0.209 0.367 0.298 0.314 4 0.242 0.224 0.269 0.442 0.445 0.433 5 0.210 0.162 0.187 0.521 0.356 0.438 6 0.106 0.071 0.075 0.207 0.136 0.180 7 0.091 0.100 0.079 0.213 0.210 0.128
6-year-olds Mean residsway Values
participant CoM 0.1Hz
CoM 0.3Hz
CoM 0.5Hz
Head 0.1Hz
Head 0.3Hz
Head 0.5Hz
8 0.122 0.094 0.087 0.221 0.195 0.146 9 0.145 0.143 0.081 0.228 0.235 0.153
10 0.098 0.070 0.074 0.181 0.135 0.142 11 0.160 0.104 0.134 0.263 0.227 0.235 12 0.136 0.112 0.098 0.204 0.194 0.162 13 0.117 0.091 0.081 0.195 0.152 0.174 14 0.206 0.194 0.148 0.365 0.267 0.222
Adults Mean residsway Values
participant CoM 0.1Hz
CoM 0.3Hz
CoM 0.5Hz
Head 0.1Hz
Head 0.3Hz
Head 0.5Hz
15 0.031 0.027 0.024 0.087 0.072 0.070 16 0.075 0.063 0.059 0.133 0.113 0.105 17 0.089 0.066 0.067 0.263 0.173 0.223 18 0.044 0.030 0.032 0.121 0.086 0.082 19 0.073 0.057 0.053 0.103 0.083 0.074 20 0.078 0.081 0.074 0.132 0.112 0.106 21 0.066 0.054 0.055 0.098 0.085 0.097

87
4-year-olds residsway Standard Deviation
participant CoM 0.1Hz
CoM 0.3Hz
CoM 0.5Hz
Head 0.1Hz
Head 0.3Hz
Head 0.5Hz
1 0.049 0.036 0.032 0.121 0.099 0.024 2 0.275 0.012 0.035 0.080 0.028 0.066 3 0.006 0.063 0.070 0.192 0.066 0.098 4 0.034 0.031 0.176 0.021 0.069 0.132 5 0.056 0.045 0.037 0.164 0.026 0.050 6 0.022 0.012 0.012 0.056 0.026 0.063 7 0.013 0.026 0.011 0.025 0.061 0.031
6-year-olds residsway Standard Deviation
participant CoM 0.1Hz
CoM 0.3Hz
CoM 0.5Hz
Head 0.1Hz
Head 0.3Hz
Head 0.5Hz
8 0.059 0.032 0.037 0.059 0.089 0.044 9 0.027 0.049 0.012 0.046 0.040 0.046
10 0.028 0.006 0.007 0.033 0.008 0.017 11 0.056 0.015 0.015 0.147 0.059 0.032 12 0.063 0.020 0.011 0.092 0.095 0.048 13 0.021 0.016 0.003 0.056 0.031 0.013 14 0.106 0.182 0.039 0.179 0.149 0.053
Adults residsway Standard Deviation
participant CoM 0.1Hz
CoM 0.3Hz
CoM 0.5Hz
Head 0.1Hz
Head 0.3Hz
Head 0.5Hz
15 0.002 0.001 0.005 0.009 0.002 0.020 16 0.016 0.009 0.008 0.029 0.023 0.010 17 0.020 0.013 0.014 0.034 0.062 0.128 18 0.005 0.003 0.005 0.012 0.010 0.013 19 0.008 0.011 0.007 0.011 0.021 0.016 20 0.005 0.033 0.011 0.017 0.027 0.019 21 0.010 0.010 0.008 0.010 0.006 0.030

88
APPENDIX D
SUMMARY OF DATA SPREADSHEETS EXPERIMENT 2

89
4-year-olds Mean Gain Values
participant Head 2mm
Head 5mm
Head 8mm
CoM 2mm
CoM 5mm
CoM 8mm
1 2.313 2.598 2.310 1.556 0.737 1.241 2 3.366 1.629 2.359 2.571 1.082 1.562 3 4.212 2.630 1.907 3.474 1.348 1.034 4 4.580 2.449 1.466 3.630 1.289 1.276 5 2.421 1.082 1.573 1.539 0.519 0.671 6 3.734 3.155 2.571 2.619 1.279 0.823 7 0.917 0.961 0.268 0.812 0.350 0.275 8 6.001 1.817 1.083 5.508 1.168 1.464 9 6.914 2.292 1.889 3.898 1.035 0.708 10 4.020 2.100 1.158 2.370 1.186 0.713
6-year-olds Mean Gain Values
participant Head 2mm
Head 5mm
Head 8mm
CoM 2mm
CoM 5mm
CoM 8mm
11 5.062 5.484 3.136 1.596 1.214 1.118 12 2.948 1.703 2.013 1.066 1.045 0.939 13 2.362 4.540 2.130 1.290 1.256 0.773 14 3.417 2.668 2.115 2.500 1.686 1.523 15 2.447 1.850 2.000 1.090 0.769 0.733 16 2.744 2.681 1.987 1.709 1.322 0.974 17 2.408 3.180 2.378 1.227 1.396 1.078 18 3.299 3.696 2.930 0.608 1.159 0.735 19 1.966 1.923 1.161 1.042 0.992 0.525 20 2.152 1.802 1.254 1.607 0.773 0.829
Adults Mean Gain Values
participant Head 2mm
Head 5mm
Head 8mm
CoM 2mm
CoM 5mm
CoM 8mm
21 2.829 2.257 1.799 1.704 1.402 1.102 22 2.979 2.409 1.973 1.773 1.608 1.278 23 2.364 2.218 1.771 1.600 1.282 1.070 24 2.170 2.019 1.513 1.361 1.250 0.806 25 3.813 1.461 1.319 1.211 1.046 0.556 26 1.206 1.240 0.631 0.852 0.893 0.410 27 1.943 1.854 1.786 1.491 1.471 1.422 28 1.830 1.423 0.797 1.157 0.953 0.419 29 2.868 2.717 2.262 1.692 1.330 0.836 30 2.959 2.307 2.526 1.908 1.422 1.445

90
4-year-olds Gain Standard Deviation
participant Head 2mm
Head 5mm
Head 8mm
CoM 2mm
CoM 5mm
CoM 8mm
1 0.270 1.516 0.698 1.364 0.190 0.507 2 0.245 0.230 0.259 0.678 0.177 0.139 3 0.439 0.630 0.527 2.557 0.216 0.239 4 2.631 0.743 0.050 1.602 0.736 0.245 5 3.280 1.452 0.755 1.625 0.614 0.308 6 0.304 0.251 0.925 0.425 0.356 0.519 7 0.734 1.118 0.211 0.465 0.262 0.205 8 3.757 0.642 0.984 0.608 0.399 0.509 9 0.062 1.096 0.638 3.751 0.717 0.364 10 2.953 0.639 0.513 1.811 0.498 0.112
6-year-olds Gain Standard Deviation
participant Head 2mm
Head 5mm
Head 8mm
CoM 2mm
CoM 5mm
CoM 8mm
11 1.132 0.551 0.365 0.300 0.113 0.240 12 4.139 4.012 0.805 0.832 0.247 0.091 13 0.297 1.552 0.545 0.454 0.756 0.164 14 1.362 0.173 0.218 0.560 0.276 0.130 15 1.581 1.387 0.268 0.751 0.583 0.330 16 1.851 1.000 0.369 0.485 0.310 0.326 17 2.457 0.702 1.209 0.160 0.748 0.445 18 0.271 0.635 0.512 1.102 0.304 0.112 19 0.252 0.588 0.411 0.119 0.121 0.224 20 0.253 0.199 0.386 0.251 0.428 0.212
Adults Gain Standard Deviation
participant Head 2mm
Head 5mm
Head 8mm
CoM 2mm
CoM 5mm
CoM 8mm
21 0.312 0.261 0.111 0.449 0.067 0.096 22 0.610 0.355 0.142 0.530 0.230 0.141 23 0.230 0.245 0.137 0.280 0.258 0.084 24 0.749 0.084 0.138 0.449 0.127 0.017 25 0.610 0.414 0.129 0.347 0.337 0.147 26 1.772 0.912 1.091 0.119 0.474 0.190 27 0.026 0.149 0.223 0.146 0.156 0.105 28 1.051 0.179 0.206 0.734 0.050 0.192 29 0.534 0.114 0.467 0.267 0.252 0.206 30 0.263 0.108 0.785 0.215 0.138 0.076

91
4-year-olds Mean SFSA Values
participant Head static
Head 2mm
Head 5mm
Head 8mm
CoM static
CoM 2mm
CoM 5mm
CoM 8mm
1 0.289 0.227 0.636 0.905 0.141 0.153 0.180 0.486 2 0.295 0.330 0.399 0.924 0.202 0.252 0.265 0.612 3 0.683 0.413 0.644 0.747 0.461 0.341 0.330 0.405 4 0.311 0.450 0.600 0.575 0.264 0.356 0.316 0.500 5 0.184 0.238 0.265 0.617 0.124 0.151 0.127 0.263 6 0.415 0.261 0.555 0.723 0.264 0.183 0.226 0.232 7 0.065 0.090 0.235 0.105 0.028 0.080 0.086 0.108 8 0.122 0.420 0.321 0.304 0.236 0.389 0.206 0.410 9 0.597 0.678 0.561 0.740 0.295 0.383 0.253 0.277 10 0.207 0.394 0.514 0.454 0.132 0.232 0.290 0.279
6-year-olds Mean SFSA Values
participant Head static
Head 2mm
Head 5mm
Head 8mm
CoM static
CoM 2mm
CoM 5mm
CoM 8mm
11 0.284 0.497 1.343 1.229 0.205 0.157 0.297 0.438 12 0.214 0.289 0.417 0.789 0.140 0.105 0.256 0.368 13 0.195 0.232 1.111 0.834 0.082 0.127 0.307 0.303 14 0.198 0.335 0.653 0.730 0.229 0.245 0.413 0.507 15 0.115 0.240 0.453 0.784 0.046 0.107 0.188 0.287 16 0.186 0.269 0.656 0.779 0.065 0.168 0.324 0.382 17 0.202 0.236 0.779 0.932 0.067 0.120 0.342 0.422 18 0.299 0.324 0.905 1.148 0.141 0.060 0.284 0.288 19 0.121 0.193 0.471 0.455 0.040 0.102 0.243 0.206 20 0.072 0.211 0.441 0.491 0.046 0.158 0.189 0.325
Adults Mean SFSA Values
participant Head static
Head 2mm
Head 5mm
Head 8mm
CoM static
CoM 2mm
CoM 5mm
CoM 8mm
21 0.073 0.278 0.553 0.705 0.058 0.167 0.343 0.432 22 0.128 0.292 0.590 0.773 0.075 0.174 0.394 0.501 23 0.078 0.232 0.543 0.694 0.050 0.157 0.314 0.419 24 0.060 0.213 0.494 0.593 0.045 0.133 0.306 0.316 25 0.202 0.374 0.358 0.517 0.191 0.119 0.256 0.218 26 0.041 0.118 0.304 0.247 0.042 0.084 0.219 0.161 27 0.175 0.191 0.454 0.700 0.130 0.146 0.360 0.557 28 0.044 0.180 0.349 0.313 0.032 0.114 0.233 0.164 29 0.068 0.281 0.665 0.887 0.028 0.166 0.326 0.328 30 0.114 0.290 0.565 0.990 0.066 0.187 0.348 0.566

92
4-year-olds SFSA Standard Deviation
participant Head static
Head 2mm
Head 5mm
Head 8mm
CoM static
CoM 2mm
CoM 5mm
CoM 8mm
1 0.232 0.027 0.371 0.274 0.069 0.134 0.046 0.199 2 0.104 0.024 0.056 0.102 0.087 0.067 0.043 0.055 3 0.425 0.043 0.154 0.206 0.417 0.251 0.053 0.094 4 0.209 0.258 0.182 0.020 0.097 0.157 0.180 0.096 5 0.148 0.229 0.254 0.213 0.070 0.113 0.109 0.088 6 0.129 0.030 0.061 0.363 0.143 0.042 0.087 0.203 7 0.030 0.072 0.273 0.083 0.019 0.046 0.064 0.080 8 0.580 0.369 0.157 0.386 0.199 0.060 0.098 0.200 9 0.051 0.008 0.193 0.180 0.093 0.266 0.126 0.104 10 0.113 0.290 0.156 0.201 0.104 0.178 0.122 0.044
6-year-olds SFSA Standard Deviation
participant Head static
Head 2mm
Head 5mm
Head 8mm
CoM static
CoM 2mm
CoM 5mm
CoM 8mm
11 0.063 0.111 0.135 0.143 0.030 0.029 0.028 0.094 12 0.114 0.406 0.982 0.316 0.143 0.082 0.060 0.036 13 0.041 0.029 0.379 0.213 0.030 0.045 0.185 0.064 14 0.062 0.134 0.042 0.085 0.011 0.055 0.068 0.051 15 0.029 0.155 0.340 0.229 0.099 0.074 0.143 0.087 16 0.140 0.182 0.245 0.145 0.021 0.048 0.076 0.128 17 0.121 0.241 0.172 0.474 0.084 0.016 0.183 0.175 18 0.019 0.027 0.155 0.200 0.039 0.108 0.074 0.044 19 0.053 0.025 0.144 0.161 0.022 0.012 0.030 0.088 20 0.063 0.025 0.049 0.151 0.016 0.025 0.105 0.083
Adults SFSA Standard Deviation
participant Head static
Head 2mm
Head 5mm
Head 8mm
CoM static
CoM 2mm
CoM 5mm
CoM 8mm
21 0.136 0.031 0.064 0.044 0.075 0.044 0.016 0.038 22 0.029 0.060 0.087 0.056 0.033 0.052 0.056 0.055 23 0.022 0.022 0.060 0.054 0.002 0.027 0.063 0.033 24 0.067 0.073 0.021 0.054 0.035 0.044 0.031 0.007 25 0.015 0.060 0.101 0.051 0.023 0.034 0.082 0.058 26 0.018 0.174 0.223 0.428 0.026 0.012 0.116 0.074 27 0.022 0.003 0.037 0.087 0.011 0.014 0.038 0.041 28 0.088 0.103 0.044 0.081 0.060 0.072 0.012 0.075 29 0.067 0.052 0.028 0.183 0.047 0.026 0.062 0.081 30 0.026 0.026 0.026 0.308 0.022 0.021 0.034 0.030
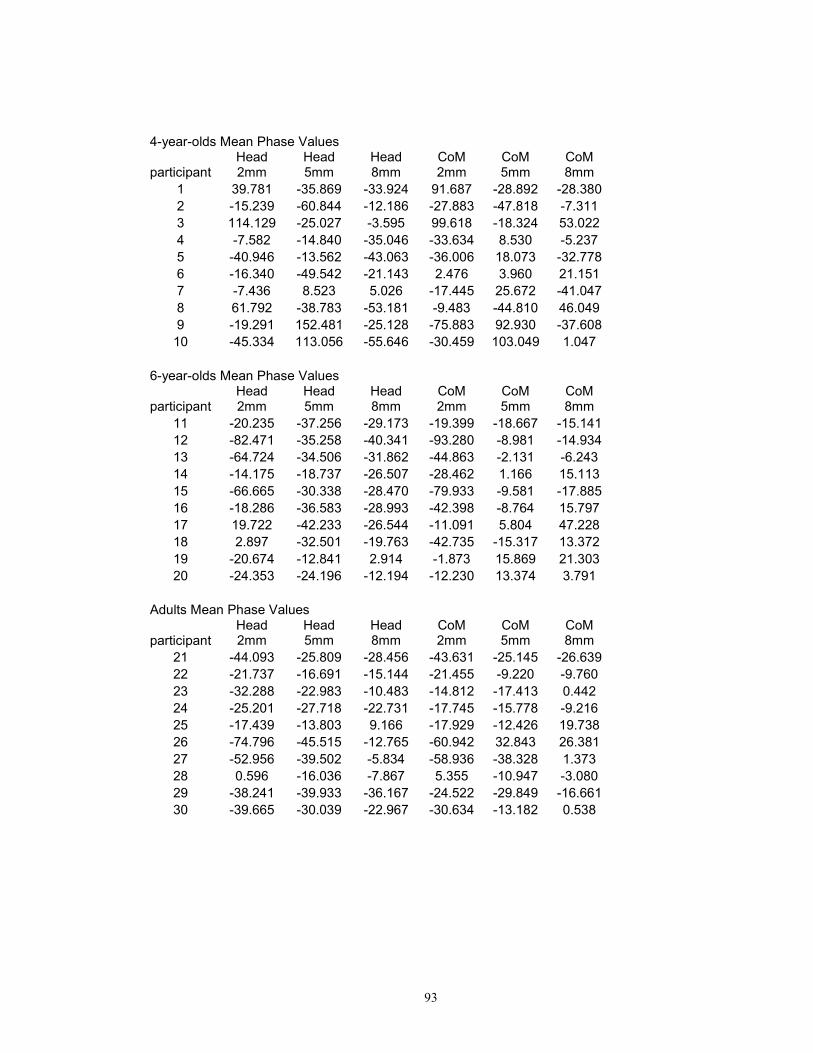
93
4-year-olds Mean Phase Values
participant Head 2mm
Head 5mm
Head 8mm
CoM 2mm
CoM 5mm
CoM 8mm
1 39.781 -35.869 -33.924 91.687 -28.892 -28.380 2 -15.239 -60.844 -12.186 -27.883 -47.818 -7.311 3 114.129 -25.027 -3.595 99.618 -18.324 53.022 4 -7.582 -14.840 -35.046 -33.634 8.530 -5.237 5 -40.946 -13.562 -43.063 -36.006 18.073 -32.778 6 -16.340 -49.542 -21.143 2.476 3.960 21.151 7 -7.436 8.523 5.026 -17.445 25.672 -41.047 8 61.792 -38.783 -53.181 -9.483 -44.810 46.049 9 -19.291 152.481 -25.128 -75.883 92.930 -37.608 10 -45.334 113.056 -55.646 -30.459 103.049 1.047
6-year-olds Mean Phase Values
participant Head 2mm
Head 5mm
Head 8mm
CoM 2mm
CoM 5mm
CoM 8mm
11 -20.235 -37.256 -29.173 -19.399 -18.667 -15.141 12 -82.471 -35.258 -40.341 -93.280 -8.981 -14.934 13 -64.724 -34.506 -31.862 -44.863 -2.131 -6.243 14 -14.175 -18.737 -26.507 -28.462 1.166 15.113 15 -66.665 -30.338 -28.470 -79.933 -9.581 -17.885 16 -18.286 -36.583 -28.993 -42.398 -8.764 15.797 17 19.722 -42.233 -26.544 -11.091 5.804 47.228 18 2.897 -32.501 -19.763 -42.735 -15.317 13.372 19 -20.674 -12.841 2.914 -1.873 15.869 21.303 20 -24.353 -24.196 -12.194 -12.230 13.374 3.791
Adults Mean Phase Values
participant Head 2mm
Head 5mm
Head 8mm
CoM 2mm
CoM 5mm
CoM 8mm
21 -44.093 -25.809 -28.456 -43.631 -25.145 -26.639 22 -21.737 -16.691 -15.144 -21.455 -9.220 -9.760 23 -32.288 -22.983 -10.483 -14.812 -17.413 0.442 24 -25.201 -27.718 -22.731 -17.745 -15.778 -9.216 25 -17.439 -13.803 9.166 -17.929 -12.426 19.738 26 -74.796 -45.515 -12.765 -60.942 32.843 26.381 27 -52.956 -39.502 -5.834 -58.936 -38.328 1.373 28 0.596 -16.036 -7.867 5.355 -10.947 -3.080 29 -38.241 -39.933 -36.167 -24.522 -29.849 -16.661 30 -39.665 -30.039 -22.967 -30.634 -13.182 0.538

94
4-year-olds Phase Standard Deviation
participant Head 2mm
Head 5mm
Head 8mm
CoM 2mm
CoM 5mm
CoM 8mm
1 38.446 23.496 5.760 56.148 20.533 37.734 2 50.420 32.000 8.904 66.165 17.845 10.353 3 53.031 16.747 14.009 56.454 22.523 52.096 4 54.415 45.376 47.845 12.783 67.993 51.071 5 38.476 21.662 2.305 57.992 52.620 28.089 6 30.242 35.251 7.350 38.159 66.041 5.516 7 33.179 48.043 45.491 28.604 41.700 41.358 8 55.574 61.510 72.744 24.764 12.229 67.937 9 68.942 76.555 63.318 64.332 69.449 25.734 10 19.942 67.764 60.423 46.408 69.169 19.007
6-year-olds Phase Standard Deviation
participant Head 2mm
Head 5mm
Head 8mm
CoM 2mm
CoM 5mm
CoM 8mm
11 33.080 2.738 6.869 42.820 9.942 8.418 12 27.840 6.495 14.875 47.729 14.444 3.709 13 31.405 14.645 18.895 29.976 41.873 17.100 14 33.143 1.895 8.444 41.781 3.834 8.733 15 18.432 10.617 7.845 40.316 16.687 2.568 16 36.951 12.360 25.970 26.847 26.222 17.973 17 64.326 8.568 13.924 73.982 19.838 34.320 18 25.564 4.399 8.773 38.916 5.277 21.452 19 21.170 13.977 21.116 17.292 6.316 22.147 20 16.666 6.592 7.775 34.893 21.190 11.634
Adults Phase Standard Deviation
participant Head 2mm
Head 5mm
Head 8mm
CoM 2mm
CoM 5mm
CoM 8mm
21 24.167 0.825 4.721 24.631 4.182 3.617 22 5.011 4.296 13.080 6.251 7.203 10.560 23 7.781 5.385 9.040 15.545 5.395 7.066 24 5.407 1.309 3.654 14.189 1.247 1.314 25 13.193 10.428 27.546 12.078 10.054 27.005 26 54.314 44.466 30.277 61.137 65.385 34.557 27 4.062 2.432 6.313 7.139 3.128 10.146 28 51.121 13.803 1.792 53.211 13.180 0.591 29 8.990 7.178 5.322 10.980 12.013 4.827 30 4.509 5.874 3.404 7.604 1.812 3.336

95
4-year-olds Mean residsway Values
participant Head static
Head 2mm
Head 5mm
Head 8mm
CoM static
CoM 2mm
CoM 5mm
CoM 8mm
1 0.389 0.414 0.317 0.402 0.219 0.308 0.174 0.266 2 0.322 0.208 0.188 0.239 0.219 0.174 0.130 0.178 3 0.579 0.343 0.271 0.329 0.612 0.218 0.182 0.226 4 0.416 0.352 0.410 0.329 0.333 0.265 0.235 0.236 5 0.306 0.285 0.272 0.267 0.233 0.191 0.169 0.171 6 0.370 0.194 0.323 0.370 0.195 0.114 0.224 0.165 7 0.078 0.077 0.117 0.097 0.054 0.059 0.085 0.063 8 0.248 0.325 0.356 0.254 0.310 0.351 0.358 0.345 9 0.793 0.803 0.659 0.663 0.383 0.396 0.347 0.318 10 0.381 0.447 0.451 0.373 0.234 0.294 0.306 0.227
6-year-olds Mean residsway Values
participant Head static
Head 2mm
Head 5mm
Head 8mm
CoM static
CoM 2mm
CoM 5mm
CoM 8mm
11 0.391 0.400 0.444 0.299 0.193 0.166 0.194 0.124 12 0.241 0.209 0.214 0.177 0.156 0.117 0.126 0.099 13 0.206 0.236 0.466 0.239 0.090 0.114 0.204 0.112 14 0.243 0.206 0.234 0.148 0.165 0.133 0.129 0.113 15 0.141 0.174 0.107 0.131 0.069 0.088 0.056 0.074 16 0.185 0.268 0.299 0.242 0.122 0.157 0.190 0.167 17 0.214 0.247 0.176 0.224 0.090 0.131 0.088 0.118 18 0.240 0.277 0.412 0.278 0.117 0.118 0.180 0.111 19 0.110 0.104 0.171 0.134 0.064 0.063 0.088 0.074 20 0.082 0.083 0.140 0.116 0.053 0.069 0.077 0.085
Adults Mean residsway Values
participant Head static
Head 2mm
Head 5mm
Head 8mm
CoM static
CoM 2mm
CoM 5mm
CoM 8mm
21 0.067 0.080 0.076 0.081 0.041 0.047 0.045 0.043 22 0.129 0.100 0.100 0.107 0.065 0.061 0.062 0.063 23 0.068 0.069 0.076 0.089 0.040 0.054 0.045 0.043 24 0.084 0.063 0.068 0.080 0.054 0.043 0.047 0.046 25 0.183 0.207 0.184 0.265 0.115 0.122 0.105 0.140 26 0.060 0.055 0.066 0.077 0.053 0.044 0.050 0.051 27 0.137 0.118 0.093 0.128 0.075 0.092 0.068 0.091 28 0.072 0.056 0.080 0.098 0.048 0.038 0.052 0.063 29 0.091 0.075 0.100 0.133 0.047 0.037 0.040 0.048 30 0.141 0.115 0.114 0.153 0.083 0.074 0.062 0.097

96
4-year-olds residsway Standard Deviation
participant Head static
Head 2mm
Head 5mm
Head 8mm
CoM static
CoM 2mm
CoM 5mm
CoM 8mm
1 0.266 0.068 0.092 0.176 0.111 0.071 0.041 0.076 2 0.106 0.081 0.092 0.064 0.075 0.063 0.056 0.067 3 0.254 0.059 0.028 0.055 0.169 0.110 0.079 0.133 4 0.059 0.135 0.117 0.062 0.021 0.100 0.082 0.059 5 0.148 0.229 0.254 0.213 0.070 0.113 0.109 0.088 6 0.082 0.080 0.039 0.059 0.122 0.119 0.030 0.066 7 0.014 0.005 0.082 0.026 0.001 0.009 0.047 0.009 8 0.008 0.189 0.104 0.285 0.066 0.060 0.154 0.043 9 0.022 0.113 0.047 0.098 0.020 0.125 0.099 0.034 10 0.049 0.008 0.041 0.060 0.052 0.053 0.109 0.004
6-year-olds residsway Standard Deviation
participant Head static
Head 2mm
Head 5mm
Head 8mm
CoM static
CoM 2mm
CoM 5mm
CoM 8mm
11 0.050 0.038 0.037 0.055 0.013 0.011 0.028 0.024 12 0.180 0.153 0.155 0.118 0.072 0.031 0.098 0.035 13 0.037 0.057 0.246 0.013 0.011 0.019 0.103 0.007 14 0.007 0.077 0.023 0.047 0.008 0.050 0.003 0.005 15 0.093 0.041 0.103 0.044 0.086 0.037 0.056 0.015 16 0.073 0.116 0.037 0.020 0.009 0.074 0.015 0.041 17 0.068 0.179 0.212 0.108 0.007 0.055 0.079 0.031 18 0.045 0.075 0.006 0.111 0.031 0.048 0.028 0.083 19 0.007 0.012 0.062 0.014 0.001 0.006 0.015 0.031 20 0.020 0.026 0.092 0.046 0.011 0.018 0.054 0.035
Adults residsway Standard Deviation
participant Head static
Head 2mm
Head 5mm
Head 8mm
CoM static
CoM 2mm
CoM 5mm
CoM 8mm
21 0.103 0.009 0.016 0.007 0.035 0.014 0.013 0.008 22 0.010 0.005 0.011 0.021 0.008 0.003 0.003 0.010 23 0.005 0.005 0.012 0.012 0.002 0.002 0.005 0.001 24 0.012 0.008 0.018 0.036 0.006 0.015 0.006 0.005 25 0.015 0.003 0.007 0.031 0.009 0.009 0.012 0.017 26 0.027 0.044 0.040 0.175 0.011 0.008 0.036 0.041 27 0.022 0.010 0.011 0.033 0.013 0.005 0.008 0.025 28 0.047 0.008 0.015 0.022 0.025 0.010 0.014 0.023 29 0.022 0.018 0.045 0.063 0.024 0.024 0.012 0.062 30 0.015 0.010 0.030 0.040 0.007 0.004 0.005 0.007

97
Reference List
Anderson, D. I., Campos, J. J., Anderson, D. E., Thomas, T. D., Witherington, D.
C., Uchiyama, I. et al. (2001). The flip side of perception-action coupling: Locomotor
experience and the ontogeny of visual-postural coupling. Human Movement Science, 20,
461-487.
Ashmead, D. H. & McCarty, M. E. (1991). Postural sway of human infants while
standing in light and dark. Child Development, 62, 1276-1287.
Barela, J. A., Jeka, J. J., & Clark, J. E. (2003). Postural control in children.
Coupling to dynamic somatosensory information. Experimental Brain Research, 150,
434-442.
Bertenthal, B. & Clifton, R. K. (1998). Perception and Action. In W.Damon & R.
M. Lerner (Eds.), Handbook of child psychology: Vol.2: Cognition, Perception, and
language (5 ed., pp. 51-102). New York: Wiley. Kuhn, D and Siegler, R. S.
Bertenthal, B. I. & Bai, D. L. (1989). Infants' sensitivity to optical flow for
controlling posture. Developmental Psychology, 25, 936-945.
Bertenthal, B. I., Boker, S. M., & Xu, M. (2000). Analysis of the perception-
action cycle for visually induced postural sway in 9-month-old sitting infants. Infant
Behavior & Development, 23, 299-315.

98
Bertenthal, B. I., Rose, J. L., & Bai, D. L. (1997). Perception-action coupling in
the development of visual control of posture. Journal of Experimental Psychology:
Human Perception and Performance, 23, 1631-1643.
Bertenthal, B. I. & von Hofsten, C. (1998). Eye, Head and Trunk Control: The
Foundation for Manual Development. Neurosci.Biobehav.Rev., 22, 515-520.
Berthoz, A., Lacour, M., Soechting, J. F., & Vidal, P. P. (1979). The role of vision
in the control of posture during linear motion. Progress in Brain Research, 50, 197-209.
Butterworth, G. & Hicks, L. (1977). Visual proprioception and postural stability
in infancy. A developmental study. Perception, 6, 255-262.
Collins, J. J. & De Luca, C. J. (1995). The effects of visual input on open-loop
and closed-loop postural control mechanisms. Experimental Brain Research, 103, 151-
163.
Delorme, A., Frigon, J. Y., & Lagace, C. (1989). Infants' reactions to visual
movement of the environment. Perception, 18, 667-673.
Dijkstra, T. M., Schöner, G., & Gielen, C. C. (1994). Temporal stability of the
action-perception cycle for postural control in a moving visual environment.
Experimental Brain Research, 97, 477-486.
Dijkstra, T. M., Schöner, G., Giese, M. A., & Gielen, C. C. (1994). Frequency
dependence of the action-perception cycle for postural control in a moving visual
environment: relative phase dynamics. Biological Cybernetics, 71, 489-501.

99
Forssberg, H. & Nashner, L. M. (1982). Ontogenetic development of postural
control in man: adaptation to altered support and visual conditions during stance. Journal
of Neurophysiology, 2, 545-552.
Foster, E. C., Sveistrup, H., & Woollacott, M. H. (1996). Transitions in Visual
Proprioception: A Cross-Sectional Developmental Study of the Effect of Visual Flow on
Postural Control. Journal of Motor Behavior, 28, 101-112.
Guerraz, M., Gianna, C. C., Burchill, P. M., Gresty, M. A., & Bronstein, A. M.
(2001). Effect of visual surrounding motion on body sway in a three-dimensional
environment. Perception & Psychophysics, 63, 47-58.
Gurfinkel, V. S., Levik, Yu. S., Semetanin, B. N., & Popov, K. E. (1988). Body
scheme in the control of postural activity. In V.S.Gurfinkel, M. E. Loffe, & J. a. R. J. P.
Massion (Eds.), Stance and Motion: Facts and Concepts (pp. 185-193). New York:
Plenum Press.
Horak, F. B. & Macpherson, J. M. (1996). Posture Orientation and Equilibrium.
In L.B.Rowell & J. T. Sheperd (Eds.), Handbook of Physiology (pp. 255-292). New
York: Oxford University Press.
Jeka, J., Oie, K., Schöner, G., Dijkstra, T., & Henson, E. (1998). Position and
velocity coupling of postural sway to somatosensory drive. Journal of Neurophysiology,
79, 1661-1674.

100
Jeka, J., Oie, K. S., & Kiemel, T. (2000). Multisensory information for human
postural control: integrating touch and vision. Experimental Brain Research, 134, 107-
125.
Johansson, R. & Magnusson, M. (1991). Human postural dynamics. Critical
Reviews in Bioengineering, 18, 413-437.
Jouen, F. (1984). Visual-vestibular interactions in infancy. Infant Behavior and
Development, 7, 135-145.
Jouen, F. (1988). Visual-proprioceptive control of posture in newborn infants. In
B.Amblard, A. Berthoz, & F. Clarac (Eds.), Posture and gait: Development, adaptation
and modulation (pp. 13-22). Amsterdam: Elsevier.
Jouen, F., Lepecq, J. C., Gapenne, O., & Bertenthal, B. I. (2000). Optic flow
sensitivity in neonates. Infant Behavior & Development, 23, 271-284.
Lee, D. N. & Aronson, E. (1974). Visual proprioceptive control of standing in
human infants. Perception & Psychophysics, 15, 529-532.
Lestienne, F., Soechting, J., & Berthoz, A. (1977). Postural readjustments induced
by linear motion of visual scenes. Experimental Brain Research, 28, 363-384.
Lishman, J. R. & Lee, D. N. (1973). The autonomy of visual kinaesthesis.
Perception, 2, 287-294.
Massion, J. (1998). Postural control systems in developmental perspective.
Neuroscience Biobehavioral Review, 22, 465-472.

101
Masson, G., Mestre, D. R., & Pailhous, J. (1995). Effects of the spatio-temporal
structure of optical flow on postural readjustments in man. Experimental Brain Research,
103, 137-150.
McCollum, G. & Leen, T. K. (1989). Form and exploration of mechanical
stability limits in erect stance. Journal of Motor Behavior, 21, 225-244.
Metcalfe, J. S. & Clark, J. E. (2000). Somatosensory information affords the
exploration of posture in newly walking infants and toddlers. Infant Behavior and
Development, 23, 391-405.
Nashner, L. M., Black, F. O., & Wall, C., III (1982). Adaptation to altered support
and visual conditions during stance: patients with vestibular deficits. Journal of
Neuroscience, 2, 536-544.
Newell, K. M. (1998). Applications of nonlinear dynamics to developmental
process modeling. Mahwah, New Jersey: Lawrence Erlbaum Associates.
Oie, K. S., Kiemel, T., & Jeka, J. J. (2001). Human multisensory fusion of vision
and touch: detecting non-linearity with small changes in the sensory environment.
Neuroscience Letters, 315, 113-116.
Oie, K. S., Kiemel, T., & Jeka, J. J. (2002). Multisensory fusion: simultaneous re-
weighting of vision and touch for the control of human posture. Brain Research:
Cognitive Brain Research, 14, 164-176.

102
Paulus, W. M., Straube, A., & Brandt, T. (1984). Visual stabilization of posture.
Physiological stimulus characteristics and clinical aspects. Brain, 107 ( Pt 4), 1143-1163.
Peterka, R. J. (2000). Postural control model interpretation of stabilogram
diffusion analysis. Biological Cybernetics, 82, 335-343.
Peterka, R. J. (2002). Sensorimotor integration in human postural control. Journal
of Neurophysiology, 88, 1097-1118.
Peterka, R. J. & Benolken, M. S. (1995). Role of somatosensory and vestibular
cues in attenuating visually induced human postural sway. Experimental Brain Research,
105, 101-110.
Portfors-Yeomans, C. V. & Riach, C. L. (1995). Postural control of children with
and without visual impairment. Developmental Medicine and Child Neurology, 37, 456-
463.
Riach, C. L. & Hayes, K. C. (1987). Maturation of postural sway in young
children. Developmental Medicine and Child Neurology, 29, 650-658.
Riach, C. L. & Starkes, J. L. (1989). Visual fixation and postural sway in children.
Journal of Motor Behavior, 21, 265-276.
Riach, C. L. & Starkes, J. L. (1994). Velocity of centre of pressure excursions as
an indicator of postural control systems in children. Gait & Posture, 2, 167-172.
Riley, M. A. & Turvey, M. T. (2002). Variability of determinism in motor
behavior. Journal of Motor Behavior, 34, 99-125.

103
Riley, M. A., Wong, S., Mitra, S., & Turvey, M. T. (1997). Common effects of
touch and vision on postural parameters. Experimental Brain Research, 117, 165-170.
Schmuckler, M. A. (1997). Children's postural sway in response to low- and high-
frequency visual information for oscillation. Journal of Experimental Psychology:
Human Perception and Performance, 23, 528-545.
Schöner, G. S., Dijkstra, J. J., & Jeka, J. J. (1998). Action-perception patterns
emerge from coupling and adaptation. Ecological Psychology, 10, 323-346.
Shumway-Cook, A. & Woollacott, M. (1995). Development of Postural Control.
(vols. 7) Baltimore, MD: Williams & Wilkins.
Shumway-Cook, A. & Woollacott, M. H. (1985). The Growth of Stability:
Postural Control from a Developmental Perspective. Journal of Motor Behavior, 17, 131-
147.
Stoffregen, T. A. (1985). Flow structure versus retinal location in the optical
control of stance. Journal of Experimental Psychology: Human Perception and
Performance, 11, 554-565.
Thelen, E. (2000). Grounded in the world: Developmental origins of the
embodied mind. Infancy, 1, 3-28.
van Asten, W. N., Gielen, C. C., & Denier van der Gon JJ (1988). Postural
adjustments induced by simulated motion of differently structured environments.
Experimental Brain Research, 73, 371-383.