abstract title of thesis: a novel airflow control valve
TRANSCRIPT

ABSTRACT
Title of Thesis: A NOVEL AIRFLOW CONTROL VALVE
FOR USE IN MEDICAL APPLICATIONS Kathryn Elizabeth Hitchcock, Master of Science,
2004 Thesis Directed By: Assistant Professor Dimitrios Hristu-Varsakelis
Department of Mechanical Engineering Rapid improvements in digital technology over the last two decades have led to
artificial ventilators that drastically improve physicians’ ability to measure and
control aspects of their patients’ breathing. However, the mechanical systems paired
with the new digital controllers have not advanced in parallel with them. As a result,
mechanical ventilators do not respond sufficiently fast to changes in operating
conditions and can injure patients by allowing the air volume or pressure in their
lungs to become too high. This thesis describes a new air flow control valve that can
be incorporated in existing ventilators to correct this condition. The valve’s low mass
and short stroke result in rapid full-range motion with low actuator force and travel.
These qualities also make the valve well-suited for use as a flow-change mechanism
in instruments that measure airway resistance, including the Airflow Perturbation
Device (APD). We describe a series of experiments that verify the valve’s
performance in both ventilator and APD applications.
A NOVEL AIRFLOW CONTROL VALVE FOR USE IN MEDICAL APPLICATIONS
by
Kathryn Elizabeth Hitchcock
Thesis submitted to the Faculty of the Graduate School of the University of Maryland, College Park, in partial fulfillment
of the requirements for the degree of Master of Science
2004 Advisory Committee: Assistant Professor Dimitrios Hristu-Varsakelis, Chair Professor Arthur T. Johnson Associate Professor Guangming Zhang

© Copyright by Kathryn Elizabeth Hitchcock
2004

ii
Acknowledgements
The author wishes to acknowledge and thank the following people for
contributing to the completion of this thesis:
Dr. Dimitris Hristu-Versekelis for his extremely patient guidance through four
years of balancing personal improvement with service to our nation.
Dr. Arthur T. Johnson for inspiring me to bridge the gap between two
disciplines; I would have given up one or the other, and always regretted it.
Dr. Guangming Zhang for reminding me that sometimes experienced
researchers have materials problems, too.
Mr. Bernie LaFrance, Mr. Howard Grossenbacher, and Mr. Gary Seibel for
helping shape an idea into reality.
Mr. Frank Koh for many patient hours of discussion, devil’s advocacy, and
just plain cheering up.
Dr. Carl Shanholtz for showing me where I could make a difference, and
reminding me that if one person lives when he would have died, then blood, sweat,
and tears are not too much to pay.
C, M, H, and P who make everything possible.
iii
Table of Contents Acknowledgements........................................................................................................ii Table of Contents..........................................................................................................iii List of Figures ...............................................................................................................iv Chapter 1: Introduction.................................................................................................1
1.1 Background ....................................................................................................1 1.2 Contribution.....................................................................................................4 1.3 Outline .............................................................................................................5
Chapter 2: Literature Review........................................................................................6
2.1 Pulmonary Support ........................................................................................6 2.2 The Measurement of Respiratory Resistance ..............................................10 2.3 The Role of Valve Design ...........................................................................15
Chapter 3: A Novel Air Control Device .....................................................................19
3.1 Design ..........................................................................................................19 3.2 Geometry and Sizing ...................................................................................25
3.2.1 Selection of Orifice Shape ...................................................................26 3.2.2 Required Airflow Capacity..................................................................29 3.2.3 Determination of Valve Dimensions ...................................................32
3.3 Prediction of Flow Performance ....................................................................34 3.3.1 Throttling Characteristics .......................................................................34 3.2.2 Expected Response to Periodic Actuation..............................................36
Chapter 4: Experimental Setup and Procedure ...........................................................41
4.1 Equipment and Instrumentation...................................................................41 4.1.1 Apparatus ...................................................................................................41 4.1.2 Instrumentation........................................................................................45
4.2 Experiment One: Static Tests .....................................................................46 4.3 Experiment Two: Dynamic Tests ...............................................................47 4.4 Experiment Three: Resistance Measurement .............................................48
Chapter 5: Results and Discussion .............................................................................49 Chapter 6: Conclusions ...............................................................................................59
6.1 Recommendations for Further Study.............................................................59

iv
List of Figures
Figure 1: Reduction of Achievable Lung Pressure by Unknown Airway Resistance………………………………………………………………... 15 Figure 2: Design Concept…………………………………………………………... 20 Figure 3: Internal Parts of Prototype Air Flow Control Device……………............. 21 Figure 4: Diagram and Photograph of Valve and Housing………………………… 22 Figure 5: Relationship of Perimeter Change and Area Change for Orifice Shapes for a 0.1 cm Reduction in Perimeter ……………………………………. 27 Figure 6: The Range of Valve Motion……………………………………………... 28 Figure 7: Assignment of Variables for Valve Calculations………………………... 32 Figure 8: Predicted Throttling Performance of the Valve …………………………. 35 Figure 9: Comparison of Theoretical Valve Performance with Major Valve Types……………………………………………………………… 36 Figure 10: Static Testing Rig………………………………………………………..42 Figure 11: Dynamic Testing Rig…………………………………………………… 43 Figure 12: Apparatus for Resistance Measurement ……………………………...... 44 Figure 13: Flowrate as Function of Changing Gap Size…………………………….49 Figure 14: Actual Performance of Valve…………………………………………... 51
Figure 15: Step Input to Valve, Closing……………………………………………. 53
Figure 16: Valve Response to High Frequencies…………………………………... 54
Figure 17: Detailed View of Valve Response to High Frequencies………………...56
Figure 18: Comparison of Current and Proposed APD Performance – Inhalation (top) and Exhalation (bottom)………………………………. 57
1
Chapter 1: Introduction
Without the use of mechanical ventilators, the severely ill and injured often
could not survive. Although the evolution of microprocessors over the last few
decades has drastically improved the performance of these machines, their secondary
effects can cause severe and lasting damage to the body. These injuries are attributed
to slow action in the airflow control valves within the ventilators, and to the lack of
real-time information concerning the patient’s respiratory condition on which to base
ventilator settings. The ultimate aim of researchers working to improve these life-
saving machines is to provide a continuous measurement of respiratory resistance
directly to existing ventilator controllers, and to improve the ventilator’s mechanical
response in order to achieve high-performance feedback control of the breathing
process. This thesis describes the design of a new airflow control device that has the
potential to advance the state of the art toward that goal.
1.1 Background
Since the 1500’s physicians have explored ways in which to provide artificial
respiration for those who, due to injury or illness, are unable to breathe for
themselves. Since that time, the science of mechanical ventilation has undergone
perpetual improvement and has taken on new roles in medical practice. In addition to
preventing immediate death, ventilators are used to reduce the physical cost of gas
exchange (that is, the amount of metabolic energy expended on this process), relieve

2
respiratory muscle fatigue, and allow healing of damaged or diseased tissues that are
normally burdened by the breathing process.
In early systems this was accomplished by supplying a fixed, low volume of
air to the patient at regular intervals, mimicking the perceived action of the lungs
were the patient able to breathe for himself. This approach was based on the belief
that people lying supine in hospital beds should not experience dramatic changes in
their breathing status like those they would undergo if they were actively exercising.
Long experience, however, has shown that this simplistic assumption is not accurate.
Beginning particularly during the poliomyelitis epidemic in the United States and
Canada in 1952, doctors became aware that patients subjected to artificial ventilation
over long periods suffered serious tissue damage due to the mechanical stresses
caused by the very machines that were keeping them alive [Hubmayr et al., 1990].
In the decades since then, dozens of schemes have been implemented to
reduce the stress that ventilators place on the pulmonary tissues, and to encourage
ventilator-dependent patients to more rapidly return to a state of normal breathing.
None of these are perfect, and the complicated interdependence of the factors that
impact their efficacy results in a lack of concrete proof of their value. The problems
common to all are so severe that success achieved by a new approach is generally
measured in the associated reduction of the mortality rate.
The task of determining how improvements might be made is not a trivial one.
Filling and venting the lungs is not a simple matter of moving air volume into and out
of a large, predictable space. The lungs and chest wall are flexible and stretch from
their neutral position during inhalation, opposing the flow of air, then provide the
3
driving force for exhalation through elastic recoil. The airways themselves oppose
flow in both directions – they are time-varying constrictions that impose some head
loss on the fluid, just as pipes do in mechanical systems [Hubmayr et al, 1990]. This
resistance is greater during exhalation than inhalation because pleural pressures are
greater than airway pressure in the former case and this causes a reduction in cross-
sectional area of smaller, softer-walled airways [Johnson, 1991]. The resistance and
elastance vary widely between people, and may change rapidly in an individual,
particularly during illness that involves the pulmonary system [Tobin, 2001].
It is clear, then, that the health of the airways is vital to good ventilation.
Airway resistance measurements, were they more readily available to health care
providers, would be of constant and urgent interest since a sudden or consistent
change in this parameter is one excellent indicator of respiratory health. Changes can
be caused by allergic reactions, the action of drugs (proper or improper), infection,
edema, tissue necrosis, and so forth, in addition to even more dire situations such as a
buildup of mucous, blood, or vomit in the airway, all of which may have a serious
impact on the health and survival probability of the individual [Walls et al., 1997].
Johnson et al. [1974] created a new mechanism for resistance measurement
that will make continuous airway resistance measurements available to the physician,
significantly improving the ability to diagnose and treat these acute pulmonary
problems, as well as replacing current unsatisfactory methods of diagnosing long-
term disease. The APD requires no special maneuver from the patient, and has been
proven to be immune to the effects of upper-airway flexibility. Since its inception it
has been verified through tests on hundreds of subjects, and meanwhile has

4
undergone a series of improvements in physical setup and data collection, most
notably the use of microprocessors rather than the human eye to compute a resistance
value. The next step in the development of this instrument is to employ a robust
method of causing steady, dependable changes in the airflow, in place of a current
device that is prone to mechanical problems.
Medical device design is complicated and costly, but it seems that the solution
to the weaknesses of both the current ventilators and the APD is a new air control
device that is robust and can operate at high speeds. This thesis describes just such a
valve that shows promise in fulfilling the requirements of both machines. It
represents a novel approach to airflow control, and is deliberately designed to
minimize bulk and required power in order to optimize performance. These qualities
also make it compatible with new technologies in smart materials, particularly
electroactive polymers, which are capable of replacing the bulky, high-current
actuators used today with light, low-power designs.
1.2 Contribution
This goal of this work was to create a novel air control device designed for
rapid actuation. This could be used within mechanical ventilators to produce more
rapid changes in flow with the intention of limiting the injurious effects of these
machines on the lung. The same design could be used to replace an unsatisfactory
flow-change mechanism within an existing respiratory resistance instrument called
the Airflow Perturbation Device (APD). This device could also be made compatible
with emerging smart materials in order to take advantage of their minimal size and

5
weight. This thesis describes an air flow control device that can transition between
fully open and fully shut over the range of pressures and flows required by
mechanical ventilators more rapidly than existing designs. It uses a previously
unexplored geometry that minimizes the overall size and the mass of moving parts. It
requires minimal control-mechanism stroke. We ensured that the valve possesses
favorable throttling characteristics, and verified its ability to produce a smooth curve
from full flow to zero flow when desired. Finally we demonstrated the use of the
valve as the perturbation mechanism for the APD. This should includes provisions
for adapting the valve to a design that does not fully close, ensuring a failsafe for
uninterrupted breathing to the patient.
1.3 Outline
The remainder of this document is organized as follows. In Chapter Two we
review of the role of mechanical ventilators in breathing support, the current science
of respiratory resistance measurement, and the current state of the art in the air
control devices used in such applications. Chapter Three describes the design
pursued in this project, as well as the process of exploration and analysis that led to
its final form. Chapter Four provides a detailed description of the testing this new
device was subjected to. Finally in Chapters Five and Six we present the results of
that testing and some conclusions drawn regarding the outcome of this study as
opportunities for further work.

6
Chapter 2: Literature Review
In this chapter, we will examine the current use and limitations of mechanical
ventilation in the hospital setting. We will then explain the history of the Airflow
Perturbation Device and explore its applications as the next generation of airway
resistance instruement. Finally we will consider the role the valves will play in the
advancement of these important life-saving techniques.
2.1 Pulmonary Support
Mechanical ventilators are used to provide gas exchange for patients
who are not able to breathe adequately on their own and reduce the breathing effort
required of those who are ill or injured. Air is forced into the lungs via a semi-rigid
tube placed in the trachea in order to ensure that a sudden swelling of the upper
airways or incursion of bodily fluid will not close off the path of flow. Existing
ventilators incorporate a number of methods for controlling the flowrate of air, either
supplying a specified volume of air per breath, or a specified range of pressures.
Breath frequency can be independently selected. The ventilator may perform the
entire work of respiration regardless of independent lung action, or may allow the
patient to participate in breathing to whatever extent he or she is able. Oxygen
enrichment from normal atmospheric partial pressures to nearly pure oxygen may be
employed [Gomella, 1998; Tobin, 2001].
There are two basic types of ventilator control. One method is to select the
overall volume delivered (tidal volume) and allow the machine to determine the

7
pressure necessary to force in this quantity against the resistance and elastance of the
airways. This entails a risk that the machine may select a high pressure in the
presence of strong resistance resulting in barotraumas to the lungs. The other method
is to specify a goal inspiratory pressure and program the ventilator to end inspiration
when it is reached, which decreases the risk of immediate lung damage but does not
guarantee that adequate volume will be delivered to keep the patient alive. Research
of the last several years shows that ventilator-induced lung damage can occur while
using either mode of control, and is not necessarily directly correlated to the
maximum pressure or volumes achieved [Tobin, 2001].
The mechanism of injury caused by mechanical ventilators has not been well
explained by research to date, so progress in preventing it has come only as a result of
trial and error [Whitehead and Slutsky, 2002]. Immediate evidence of damage
appears in the form of air in the intrapleural space of the thorax, the mediastinum, the
pericardium, or the pulmonary blood vessels. The lungs hemorrhage and may form
clots or begin to fill with blood. The damaged lung tissues stiffen with scars and may
become impermeable to gases, rendering them useless in respiration (surgical
emphysema). The injured portion of the lung inflames the tissues surrounding it,
resulting in their increased susceptibility to damage and a subsequent cascading
progression of deterioration. Blood thinners and transfusions used to combat the
subsequent systemic effects may result in profuse bleeding and infection that worsen
the presenting condition [Gawande, 2003; American Thoracic Society et al., 1999].
Lung tissue cannot be repaired by the body, so the impact of this chain of events will
leave a life- long mark on the patient and weaken his or her ability to withstand later
8
disease [Martini, 1998]. This state of affairs is only acceptable to the medical
community because the only alternative is death for their patients.
Clearly some combination of pressures and volumes results in trauma to the
lung, but low-volume, low-pressure breaths from a mechanical ventilator can, in some
patients, produce just as much damage as elevated levels of either parameter
[Matthay, 1999]. Progress in identifying contributing factors is slow. Trials must be
performed clinically since the complexity of the blood- lung-airway-machine system
in most cases renders useful modeling impossible at the current state of technology.
Trials of improved techniques, and even comparisons of existing techniques, are most
often conducted empirically since the difficulty of obtaining permission to experiment
on these patients in the most delicate of conditions makes standardized approaches
rare [Esteban et al, 1995].
A recent study by a group of clinical researchers in this field demonstrated
how dramatic an impact even minor improvements can have on the current state of
medical science in mechanical ventilation. A multi-center, randomized trial was
conducted in which one group of patients with ventilator-stiffened lungs was given
slightly lower volumes of air in each breath than dictated by traditional medical
practice (6 ml/kg of body weight at 30cm of H2O or less plateau pressure, versus 12
ml/kg of body weight at 50cm per water or less). The study was so successful beyond
expectation that it was stopped when less than half of the intended subjects had been
enrolled, and the results were hastily published, resulting in an immediate and
permanent change in universal practice. This simple innovation resulted in almost a
9% decrease in mortality, and an average of two fewer days per patient spent on
9
artificial ventilation (with a presumed concomitant decrease in permanent lung
damage) [ARDSNetwork, 2000].
One advancement in ventilator technology that has had an undeniably positive
impact on all methods of combating tissue damage was the advent of inexpensive,
highly flexible microprocessors that can be used to finely tune the air flow delivered
to the patient. Complex feedback loops in which the pressure and volume delivered
are sensed at the ventilator outlet and used to tailor subsequent breaths to a pre-
determined plan for ventilation have replaced the simple “volume in, volume out”
approach that formed the backbone of ventilator science well into the 1980’s.
The speed at which these controls can be effected, though, is still limited by
the mechanical devices used to alter air flowrate [Ranieri, 1996]. In a simple open-
loop scheme in which air is delivered for pre-determined intervals, ventilators now on
the market do not transition between zero and full flow and back again in less than
200 ms [Conti, 1997; Aestiva, 2004; Puritan Bennet 2003]. Since a complete
inhalation may need to be as short as 250 ms in the smallest patients (breathing
frequency 60 breaths per minute, inhalation to exhalation ratio 1:3), the time required
for flow change can represent a significant problem [Catlin, 1998]. This sluggishness
interferes with the fine tuning provided by the digital controller and may be the
greatest contributing factor in ventilator- induced lung injury. Du et al. [2001]
estimate that the electronic controller produces 6-40ms of this delay. A fast-acting
flow alteration device is needed in order to minimize the remaining fraction.
Valve lag is an undesirable characteristic in any part of the ventilator system,
but is particularly troublesome in the inhalation and exhalation valves, that is, those

10
which are closest to the patient and determine when the machine-controlled portions
of the breath begin and end. During weaning or partial support when the patient also
exerts breathing effort, a difference in initiation time between person and machine
results in the patient performing isometric exertion against a closed flow pathway.
This produces the exact strain and fatigue conditions the ventilator is intended to
prevent. In its worst form, the patient ceases to inhale before the valve fully opens,
the machine senses the cessation of inhalation effort and elects to not supply a breath,
and the patient receives little or no air at all (or conversely is unable to exhale a
breath); this condition is called patient-ventilator trigger asynchrony [Chao, 1997].
Other problems thus caused include insufflation lag, in which the patient receives a
smaller breath than intended due to slow valve action unrecognized by the ventilator,
and run-on in which the ventilator continues to inflate the lungs after the end of
intended inspiration. This last is particularly alarming in terms of potential tissue
damage. In every form, this poor timing tires the patient and can also cause extreme
discomfort, such that sedatives must be given in order to restore even breathing –
both results are clearly detrimental to the healing process [Yamada 2000]. Proposing
a solution to these serious problems is the target of this research.
2.2 The Measurement of Respiratory Resistance
One important step in reducing ventilator-induced lung injury will be the
routine measurement of airway resistance. This is currently clinically assessed in
cooperating patients using several methods. Spirometry involves having the patient
inhale to maximum capacity then exhale the entire volume forcefully through a

11
pneumotachograph, and repeating the process until 4 consistent repetitions are
achieved. Resistance is considered to be proportional to the amount of air that can be
exhaled in one second, although this is dependent on the patient’s level of effort, and
if the effort is painful or tiring, or if the patient is too young to follow instructions
properly, the maneuver may not be correctly performed [American Thoracic Society,
1994]. In whole-body plethysmography, a patient sitting inside a sealed chamber
inhales or exhales through a flowmeter, while the movements of the patient’s chest
cause changes in chamber pressure that can be measured. Respiratory resistance is
calculated using the relationship that resistance is equal to pressure change divided by
the resulting flowrate. As in spirometry, the patient must be willing and able to
perform breathing maneuvers that may be uncomfortable during illness [Holland,
1986].
In current clinical practice, however, because there is no appropriate
instrument available, very little attention is given to airway resistance in patients so
seriously ill that they cannot or will not comply with the standard techniques.
Resistance is measured sporadically, if at all, in hospitalized people when the
physician chooses to take it into account in a daily examination of overall health. He
does this in unconscious and ventilated patients by performing an occlusion
maneuver, that is, by shutting off their air flow for up to two seconds during an
inhalation or exhalation, and measuring resistance by the ratio of the difference
between occluded and unoccluded pressures to the change in flow [Abreau, 2001].
He may also employ an esophageal balloon in a related technique. This same
calculation has also been performed using the 200-300ms delay caused by existing

12
ventilator valves as the occlusion period [Conti, 1998]. Stopping the breath of a
conscious but weakly breathing or lightly sedated patient, however helpful the
resulting information, causes extreme discomfort and thus is rarely done [Farre,
2001].
A newer method is applied to both conscious and unconscious patients by
driving air at low pressure differential (generally less than 2cm H2O) into the
patient’s mouth during normal breathing at a higher frequency than the breaths and
measuring the pressures and flows as they exit the driving mechanism. This is called
forced oscillation, and is an improvement over previous techniques since it requires
no maneuvers from the patient, but is hampered by interactions in the soft pala te and
upper airways which flex unpredictably and elastically absorb some of the flow
energy, interfering with the calculation [Navajas and Farre, 2000].
Johnson [1974] used a variation on the occlusion maneuver to create a
continuous resistance monitoring device, in order to permit diagnosis of airway
conditions without a complicated procedure that would discomfit an already sick
individual. This device uses a rapid, periodic perturbation of air flow to compute
airway resistance by measuring the ratio of the pressure change during the
disturbance to the change in flow. Some conditioning of the signal is required since
there are two components of the pressure change thus produced, one in-phase with the
flow disturbance and one out of phase – the former is proportional to respiratory
resistance [Vo, 1987]. Several studies have been conducted to validate this method
and verify that it is not prone to the error induced by the flexing of upper airways
seen in the forced oscillation technique (see Sahota [1980] for details).
13
Previously the flow disturbance mechanism used in this instrument, called the
Airflow Perturbation Device (APD), was a rotating wheel with alternating resistance
and non-resistance segments perpendicular to flow. A pneumotachograph and
attached pressure transducers gave the needed flow and pressure signals – differential
pressure across the airway was measured using the assumption that alveolar pressure
does not change when the airflow is perturbed. Sahota [1998] showed that resistance
measured by this method includes that of the entire airway from trachea to alveoli,
and thus indicates the presence of any of the dangerous condit ions previously
discussed. This was verified by using accelerometers on the chest wall which were
able to detect the waveform produced by the APD, in a study which also verified the
device’s ability to produce repeatable, resistance-proportional measurements
[Lausted, 1999].
Unfortunately the current rotating wheel approach is not robust. Moisture
collection in the system, a constant condition in ventilatory applications, can cause
the wheel to hesitate or bind. High airflows slow the wheel audibly during maximum
inhalation and exhalation. Vo [1987] attempted to design a replacement, specifically
for use in series with mechanical ventilators, with a pinched tube, much like a roller
or peristaltic-type pump, in which the occlusion is supplied by a cam with lobes of a
shape carefully designed to produce the desired magnitude and periodicity. This
system was deemed undesirable for further development, however, because of several
mechanical problems including rapid wear of the tube, large size, prohibitive weight,
noise, and the need for a substantial source of electricity.

14
If a new disturbance mechanism were designed so that the proven analysis
approach of the APD could be successfully adapted for the physical demands of
clinical use, the benefits to patients could be substantial. The ability to immediately
and continuously visualize and analyze changes in airway resistance would supply
physicians with the information necessary to diagnose not only immediately
threatening situations such as a blood-filled airway, but also long-term degradations
in airway status that point to a life-threatening and otherwise hidden breathing
condition.
An important application of airway resistance measurement in ventilated
patients has bearing on the problems of mechanical ventilators discussed in Section
2.1. If the APD could be adapted for use in series with ventilators, continuous
monitoring of resistance would lead to the ability to predict with every breath the
exact inlet pressure required to maximize lung volume without exceeding limits based
on anticipated damage. Currently, the lung can be inflated only until inlet pressure
reaches maximum safe pressure, since the head loss due to resistance is unknown, and
the lung is never fully inflated. For the theoretical insufflation at constant flowrate
pictured in Figure 1 below, Pmax is the maximum pressure deemed safe for the lungs
in. Ideally plateau pressure would be equal to Pmax, but since Presistance is unknown, the
entire curve must be kept under the Pmax line. In cases of large resistance, the loss of
lung inflation volume (tidal volume) is substantial.
Region A is the initial pressure increase at the inlet due to flow resistance in
the airways. Region B is the constant- flow lung inflation opposed by the elasticity of
the lung tissue and chest wall. Region C is the plateau pressure between the end of

15
inhalation and the beginning of exhalation, and pressure drops at the inlet since the
need to oppose airway resistance is removed by lack of flow. The transition from C
to D is the opening of the exhalation valve, allowing the inlet (mouth) to go to
atmospheric pressure. In region D lung alveolar pressure declines exponentially as
air is elastically expelled, opposed by exhalation resistance.
Figure 1: Reduction of Achievable Lung Pressure by Unknown Airway Resistance
[Adapted from Hubmayr et al., 1990; Johnson, 1991; Martini, 1998; Aslanian et al.,
199; and Kreit et al. 1994.]
2.3 The Role of Valve Design
The next step in the evolution of ventilators is a mechanical air flow control
device that can improve both ventilators and the APD. In general, it can be said that
standard valve types are not suitable for this type of activity for two reasons. One is
Pmax
Pmax
D B C A
Patm Inlet (mouth) Pressure
Alveolar Pressure
Plateau Pressure
Plateau
Presistance

16
their long actuation time – the lengthy rotary motion required to close, for example, a
globe or gate valve would be unacceptable in this setting. The other is general
suitability to a medical application. The valve must tolerate high humidity, require
little supporting equipment, be light and compact, and have excellent throttling
characteristics. It must not contain or involve any materials hazardous to the
respiratory system, and must use little or no lubricant, with complete isolation of
lubricated surfaces from the air flow path, since these substances can be extremely
harmful to the lung. The valve must either be disposable or capable of being
sterilized if it is to come in contact with exhalation flow; current designs lack this
quality, a long- ignored problem that has become critical during the present outbreak
of SARS [Field, 2004]. In the current hospital financial environment, inexpensive
production is also of capital importance.
One common type of valve used in medically-related air flow applications is a
type of rotary shutter device called a scissor valve. In general it possesses the desired
qualities, but it has poor throttling capabilities and requires substantial actuating
travel that results in a lag between the initiation of motion and significant change in
flow. Although concerns about litigation make all aspects of ventilator design highly
guarded proprietary information, some ventilator companies will state that they
employ this type of device [SensorMedics, Emerson, Puritan-Bennet, 2003]. Another
design frequently advertised by valve-making companies as ideally suited for
ventilator use is the proportional solenoid valve. These perform reasonably well, with
the more expensive models capable of particularly high frequencies, but are prone to
17
hysteresis as great as 20%, which makes control a difficult problem [Kosarzecki,
2003].
A valve that could produce the flow changes necessary for the ventilator
would also be well suited to replace the perturbation mechanism in the APD. The
flow capacities are necessarily equal, and although it is mandatory that the APD
device not close completely in order to ensure a patent airway for the patient at all
times, a small modification to the valve or housing should be possible that would
satisfy this restriction.
Recent improvements in the availability of smart materials have given
rise to the possibility that one of these technologies might provide a solution to both
the ventilator control valve problem and the APD perturbation challenge. The ideal
approach would be to make a control device completely from a smart material with
no other moving parts, but none of the substances currently in development combine
the required strength, speed, and magnitude of deformation to produce such a
mechanism. In conjunction with control surfaces like those used in existing valve
designs, however, these new actuators could present a useful solution to limitations
that have not seen a satisfactory alternative in existing valves. The properties that
would make a valve highly compatible with smart material actuation – minimal travel
and mass – are the very qualities that are sought in the improvement of ventilatory
applications.
Ultimately, the ideal implementation of both a workable solution for
resistance measurement and the reduction of valve lag time could lead to an
integrated system in which real-time data regarding the patient’s airway status is
18
provided to the physician who then sets the ventilator to an algorithm that provides
the best gas exchange for the patient’s immediate condition. With improved
inspiratory and expiratory valves this program could be carried out more precisely,
leading to results that more closely approach natural respiration, and resulting in
reduced fatigue and damage to the patient. This goal is well within the capabilities of
current electronics and software, and awaits only the appropriate hardware to become
a reality. The most newly proposed methods of ventilator control, collectively called
proportional assist ventilation or “power steering” attempt to use positive feedback to
work toward this end, but even their most ardent advocates admit that their practical
application awaits the necessary flow control device [Brunner, 2002].

19
Chapter 3: A Novel Air Control Device
This chapter describes an air flow control mechanism that overcomes the
difficulties associated with current ventilator and Airflow Perturbation Device
designs. The slow actuation seen in current mechanical ventilators is eliminated here
by employing only a few moving parts of small size and low density. This method of
flow control will also work well in the APD because it is not sensitive to humidity or
flow nor does it bind during prolonged operation.
We will begin with a description of the proposed valve, and discuss its
intended qualities which are to be tested experimentally.
3.1 Design
Figure 2 depicts the valve that was produced as a result of this work. It
consists of four equal wedge-shaped sections that fit together to form a cylinder 25
mm in diameter and 10 mm thick, when closed. In the open position the these
sections move apart to form an X-shaped opening 1 mm wide between pieces. This
cruciate orifice is maintained by soft springs so that a symmetrical, circumferential
force is required for the four wedges to move together. When that happens, each
spring compresses into shallow wells cut into the flat opposing faces of the wedges.
When the force is released, the valve springs open again to permit flow through the
orifice.

20
Figure 2: Design Concept
Figure 3 shows the final prototype used in the testing of this design, with the
wedges arranged in a retaining ring. The cable used for actuation is not visible here,
but wraps around the four wedges and passes out through a hole in the surrounding
ring to attach to the motion-generating device. This is a small, high-frequency
electric motor which wraps the cable around its axle to close the valve, or unwraps it
in the opening direction, as it turns. In the future, however, this is intended to be a
smart material such as an electroactive polymer in order to reduce the overall size and
weight of the whole unit.
Air flow spaces
Maximum Ga p 1.0 mm
(exaggerated here)
Spring
Spring One Quarter
Cable groove
This surface in contact with housing
This surface normal to flow

21
Figure 3: Internal Parts of Prototype Air Flow Control Device
The moving parts of the valve have a total mass of 4.90g, and the center of
gravity of each wedge moves through 0.69 mm as the valve transitions from fully
open to fully closed. These parameters result in a low-inertia valve that throttles or
stops flow with a minimum of motion and therefore can be fully actuated within a
very short period. The wedges are machined from Delrin®, a material chosen for its
low density, toughness, and consistent composition; it is frequently used in medical
applications and can be easily disinfected.
The springs are chosen for desired performance, balancing two needs: i) to
minimize the force required by the actuator to shut the valve, and ii) to make the
valve open rapidly and reliably in all conditions of flow. The springs used in the final
prototype were made of 0.45 mm diameter silver-coated beryllium copper which was
chosen for its high fatigue strength and ability to withstand corrosion in humid
environments. Their spring constant was 0.53 N/mm.
The valve is actuated by a reducing its circumference by means of a ring or
loop of cable placed around it. This could be an electroactive polymer ring that
deforms in the presence of an electric field to produce the necessary diameter
reduction. Testing showed that the state-of-the-art in these materials did not provide

22
adequate actuation force for this application, however. In its place, a
polytetrafluoroethylene (Gore-Tex ®) cable was used, with the collapsing loop being
formed by passing the free end through an eye in the portion wrapped around the
valve. This choice of material resulted in low friction between the cable and valve
body, allowing the valve to open with minimal spring force and producing quick
actuation in both directions.
An adapter was fabricated to provide coupling with upstream and downstream
tubing and provide lateral stability for the valve quarters in addition to closing the
flow path at the valve gaps. A diagram and photo are shown in Figure 4. A paper
ring is inserted between the valve wedges and the retaining ring in the photograph for
visual clarity.
Figure 4: Diagram and Photograph of Valve and Housing
The housing was made in two parts in order to facilitate insertion and removal
of the moving valve parts, and is clamped together by 16 custom-cut bolts around the
perimeter. If tightened carefully these eliminate the need to use a gasket at this
Actuation Cable
Valve quarter, side view Spring recess

23
closure, although at pressures above the range of interest to this work a more complex
closure might be necessary. The size of the tubing extensions was chosen for
compatibility with standard ventilator hose which can easily be ring-clamped to the
housing with no significant leakage.
A lip was included where the flat faces of the moving valve parts slide against
the housing at the inlet and outlet, because in the intended application moisture tends
to collect along this surface and cause adhesion if the contact area is too la rge.
Friction at this interface can be substantial, particularly when the valve is closed
against a high pressure differential, and must be overcome with adequate spring and
cable force. In the case of using the valve as the perturbation mechanism for the
APD, one option for ensuring that the valve could never completely close off flow,
guaranteeing that the patient would always have an open airway, would be to cut
grooves into this lip, purposely allowing some air to leak around the valve seat.
Care was necessary in choosing the method of springing apart the quarters of
the valve. The actuator would exert a constrictive force to bring the quarters together,
but some other mechanism would need to be added to re-open the valve during
actuator relaxation. The idea ultimately used was to employ compression springs
with their ends recessed in opposing flat faces so that the quarters could close
together completely if desired. In the case of using this valve to provide perturbation
for the APD, a second idea for ensuring a flow pathway even if the valve failed shut
would be to place stops between the valve quarters to keep them from lying flat
against one another at maximum loop contraction. A further refinement was to
include guides made of steel tubing through which the spring could be inserted, to
24
provide the desired stability and keep the valve quarters from fluttering. For the
diameter of springs available, the enclosing tubes had approximately the same area
normal to flow as the theorized spring shie lds used in the flow calculations in Section
3.2.
Simple wood prototypes were built for several other springing arrangements
which ultimately were not as promising. Leaf springs connected at the perimeter of
the valve across each inter-quarter gap would only negligibly constrict flow and could
provide stability in the arrangement of the valve quarters by making them thick
enough in the direction of flow to control any twisting motion caused by high
velocities. The deformation of a flat spring at this location, though, would exert an
outward force on the actuator. A closely related idea was to attach the quarters to the
inner wall of a flexible rubber tube with the actuator wrapped around the outside of it,
which would have the advantage of completely containing the airflow, an
arrangement that might be desirable if vaporized medicines were to be introduced
upstream of the valve which would tend to precipitate from the stream in regions of
tortuous flow. The model showed that that this design, too, would have to be
abandoned, because the deformation of the small amount of free tubing at the valve
gaps produced a large amount of force, and this would unacceptably restrict the types
of driving mechanisms that could be used. A third possibility was to pinch a very
thin-walled latex tube into the gaps between the valve quarters, and use force exerted
by the wedges on the outside of this conduit to produce deformation that would
control flow. This, too, would have the advantage of allowing complete isolation of
the air stream from the actuator of the valve, and in this case from the hard parts of

25
the valve as well, but the model showed that thinner latex tubing could not be made to
spring open nicely when the valve was open, and that heavier tubing did not compress
well to produce flow control. A fourth alternative was to use disc springs between
each pair of valve quarters with a recess cut into one face of each to allow the
quarters to close together completely. The prototype of this design worked well and
held up under constant motion.
3.2 Geometry and Sizing
In order to understand the decisions made with respect to the shape and size of
the proposed valve, it is necessary to keep in mind some important parameters.
Mechanical ventilators are designed to produce maximum flows of 120 L/min at a
driving pressure of 120 cm H2O. Flowrates in this range are generally associated
with exercise and so this is ample for any patient resting quietly in a hospital bed or
participating in basic respiratory testing in a physician’s office; it is therefore also a
reasonable limit for the APD. The target for actuation time was 200 ms or less since
this is the figure generally quoted for the initiation of air flow control in ventilators.
We would like to improve that time by an order of magnitude or better.
Even though currently available electroactive polymers did not lend
themselves to testing of the prototype in this project, we kept the actuation length
within their operating range to facilitate later adaptation. This meant that the length
change required of the actuator had to be 4% or less of its original length. If a better
polymer does become available it will be enormously beneficial in this application

26
since it will be light and low-volume compared to an electric motor, and will require
substantially less power to run.
3.2.1 Selection of Orifice Shape
Orifice geometry was the key to a workable design with minimal valve travel
in order to improve time response. To satisfy the goal of minimizing valve motion it
was necessary to find an orifice shape that would produce the largest change in area
for a given change in perimeter.
For simple shapes, one can easily describe their change in area as a function
of change in perimeter:
Circle: Square:
0
2
0241
APA
A −
∆−=∆
ππ
π 0
2
0
4
4A
PAA −
∆−=∆
Square with two sides held constant: Equilateral triangle:
20 PA
A∆−
=∆ ( ) 0
2
023181
APAA −∆−=∆
Equilateral triangle with two sides held constant at (2A0)1/2:
( )0
0
2
010 1
42
cossin AA
PAAA −
−
−∆−
=∆ −
Rectangle with length to width ratio of a:1, long sides held constant
dPA
Aα
α 0−=∆
Where, in the formulas above :

27
A0 is the original area
?P is the perimeter change
?A is the resulting change in area
A graphical representation of these equations is included in Figure 5, using quantities
representative of the dimensions needed for this control device.
-0.35
-0.3
-0.25
-0.2
-0.15
-0.1
-0.05
00 0.2 0.4 0.6 0.8 1
Initial Area (cm2)
Cha
nge
in A
rea
(cm2 )
.
Circle
Square
Square, 2 SidesConstant
Equilateral Triangle
Equil. Triangle, 2Sides Constant
4w Rectangle, LongSides Constant
12w rectangle, LongSides Constant
Figure 5: Relationship of Perimeter Change and Area Change for Orifice Shapes for
a 0.1 cm Reduction in Perimeter
Most existing valves have an irregular orifice shape that is roughly circular or
square, and thus require a large perimeter change for a given change in area and flow,
as demonstrated in Figure 5. One exception is the globe valve, which has a conic

28
disk-and-seat arrangement that produces an approximately rectangular cross-sectional
area for flow but requires very large stem travel in order to create a change. As
Figure 5 shows, for a given perimeter change and initial area, the maximum reduction
in area comes from the rectangle with its long sides held constant (each short side is
reduced by ?P/2). The longer the rectangle compared to its width the better this
performance. This observation is supported by the fact that the circle is the shape
with the maximum ratio of area to perimeter, while thin rectangles have the smallest
area to perimeter ratio.
The simplest way to employ this relationship was to create a circular valve
with an X-shaped (cruciate) orifice, the arms of which would be four such rectangles
that would change in width by the amount of reduction in the circular diameter. More
arms in the orifice would amplify the change in area but would also complicate
construction, and for a demonstration at this stage such a trade-off was considered
undesirable.
Figure 6: The Range of Valve Motion
To determine the feasibility of the proposed design, it was first necessary to
determine whether an adequate flow area could be created while restricting the valve
Air flow spaces
open closed

29
gaps so that the valve could be fully closed with the intended 4% diameter change. A
further constraint was the need to keep valve size moderate – for the target
application, a valve more than a few centimeters wide is not be acceptable.
Minimization of valve size would also lower the mass of the moving parts, reducing
their inertia and improving response time.
3.2.2 Required Airflow Capacity
The maximum area for flow (Amax) should be sufficient to allow 120 L/min of
airflow with 120 cm H2O upstream pressure, as discussed above. The differential
pressure in an operating mechanical ventilator is reduced by the use of positive end
expiration pressure (PEEP), in which a constant higher-than-atmospheric pressure is
maintained in the lungs, even at maximum exhalation, in order to maintain
recruitment of maximum lung tissue, in other words, to reduce the collapse of small
airways leading to the problems discussed in Chapter 2.
For a rectangular orifice (as if the gaps of the cruciate orifice were laid-end-to
end, plus the open square at the center of the X), we assumed a length to width ratio
of 6:1, so that for the rectangular orifice described above, area (A) = 4lw+w2, and
perimeter (ß) = 8l + 4w. The following equations predict the required flow area
[Munson et al., 1994, p505]. The hydraulic diameter is
wwwl
wlwADh 923.1
2)5.0(48)4(44 2
=++
+==
β (1)
The differential pressure across the orifice is given by

30
2
2vDL
fph
ρ=∆ (2)
where f is the Darcy friction factor, L is the length in the direction of flow, Dh is the
hydraulic diameter as calculated in (1), ? is the fluid density, and v is the mean
velocity of the fluid. For circular conduits, the Darcy friction factor may be read
from a standard graph, but for a rectangular orifice it must be calculated from a
constant (C) that is related to geometry (C = 96.0 for a rectangle with length to width
ratio greater than 20:1) and the hydraulic-diameter-dependent Reynolds number (Reh)
which is calculated from density (?), velocity (V), hydraulic diameter (Dh), and the
fluid viscosity (µ) as follows:
hh VD
CCf
ρµ
==Re
(3)
We can combine Equations 1-3 to obtain:
21
2hAD
LQCp
µ=∆ and therefore 22max
425.02 wpD
LQCA
h
=∆
≥µ
(4)
where w is in mm and Amax is in mm2. This result is obtained knowing that the
flowrate (Q) is equal to the velocity multiplied by the area for flow, the driving
pressure is (120-5) cm H2O = 11.3 x10³ N/m2, the length in the direction of flow is
0.01m for reasons that will be explained shortly, and the viscosity of air is
approximately 1.85 x10⁻⁵ N.s/m2. Equation 4 tells us that we can choose a suitable
width (w), and the minimum area to produce the given flow will be given by this
ratio. It is clear that the required area should be dependent on the width, since
Equations 1-4 attempt to take into account the friction of the fluid against the orifice

31
wall, which will necessarily change with proportions. For a less favorable pressure
head, once lung pressure reaches an average value of 15 cm H2O, the minimum
orifice area is given by 0.465/w2, if 120 L/min airflow is still desired.
Since Equations 1-4 only place a restriction on the orifice proportions, and do
not determine the actual flow area required, a simple Bernoulli analysis was
performed. The assumptions are that air flow in this region is inviscid, steady, and
sufficiently laminar so that streamlines are consistent in moving through the valve.
An additional assumption is that the air is incompressible, since in this region the
compressibility corrections are minute compared to the remainder of the terms. The
streamline in question would be at a constant or nearly constant height, and the
gravity term would be very small. The points chosen for analysis are just upstream of
the valve and just inside the valve on the downstream side. These simplifications
leave us with G
vKhL 2
2
= . For existing valves the value of K is well known and
can be found from design tables, but in our case it must be estimated. For the most
restrictive configuration in the tables (gate valve ¼ open), K = 20 [Welty et al, 1984].
The continuity equation, Q = VA, combined with the Bernoulli solution, using
an air density of ? = 1.2928 kg/m3 gives the head loss as a function of flowrate and
area as
AQg
Q
hL02.1
)81.9(2)lg4(
202
=+
= and therefore A
QGhP L
68.12==∆ ρ (5)
32
where A is the cross sectional area for flow in m2. Therefore to allow the maximum
flowrate of 120 L/min or 0.002 m3/s with a minimum differential pressure of 20 cm
H2O (1.96 kPa), we require 2max 129.0 cmA = .
In the determination of valve dimensions, which will be made in Section
3.2.3, both the rectangular conduit result and the Bernoulli solution need to be taken
into account.
3.2.3 Determination of Valve Dimensions
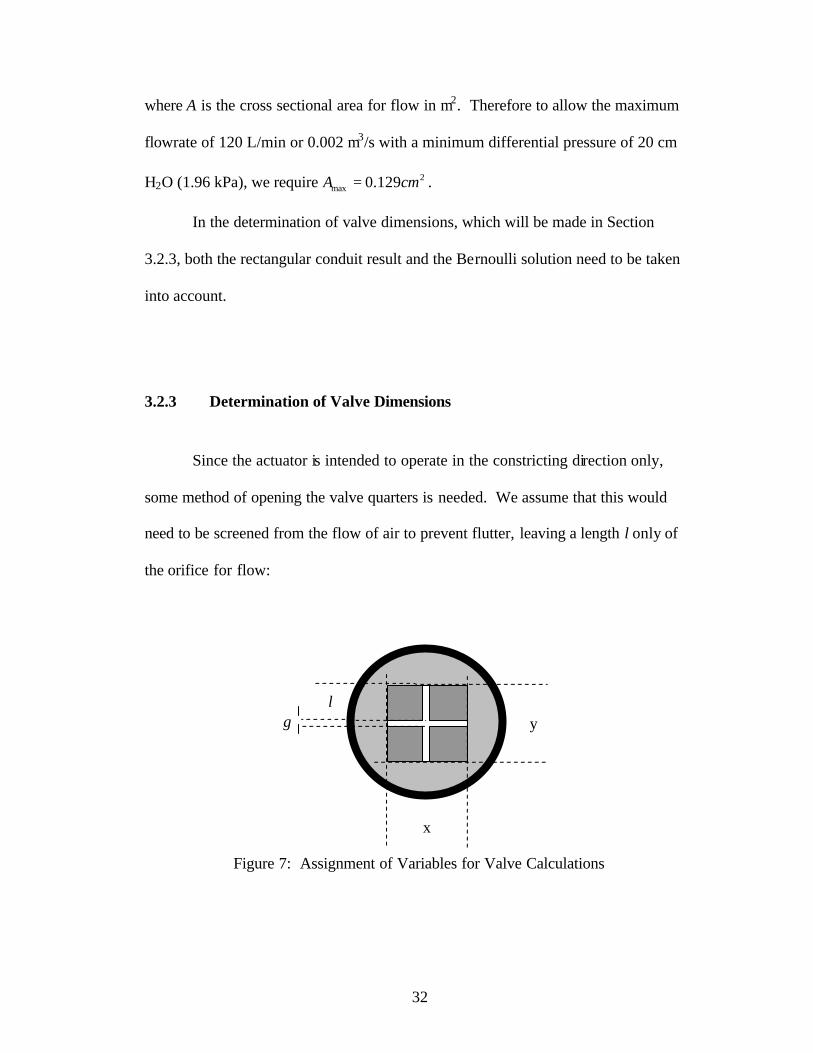
Since the actuator is intended to operate in the constricting direction only,
some method of opening the valve quarters is needed. We assume that this would
need to be screened from the flow of air to prevent flutter, leaving a length l only of
the orifice for flow:
Figure 7: Assignment of Variables for Valve Calculations
y
x
l g
33
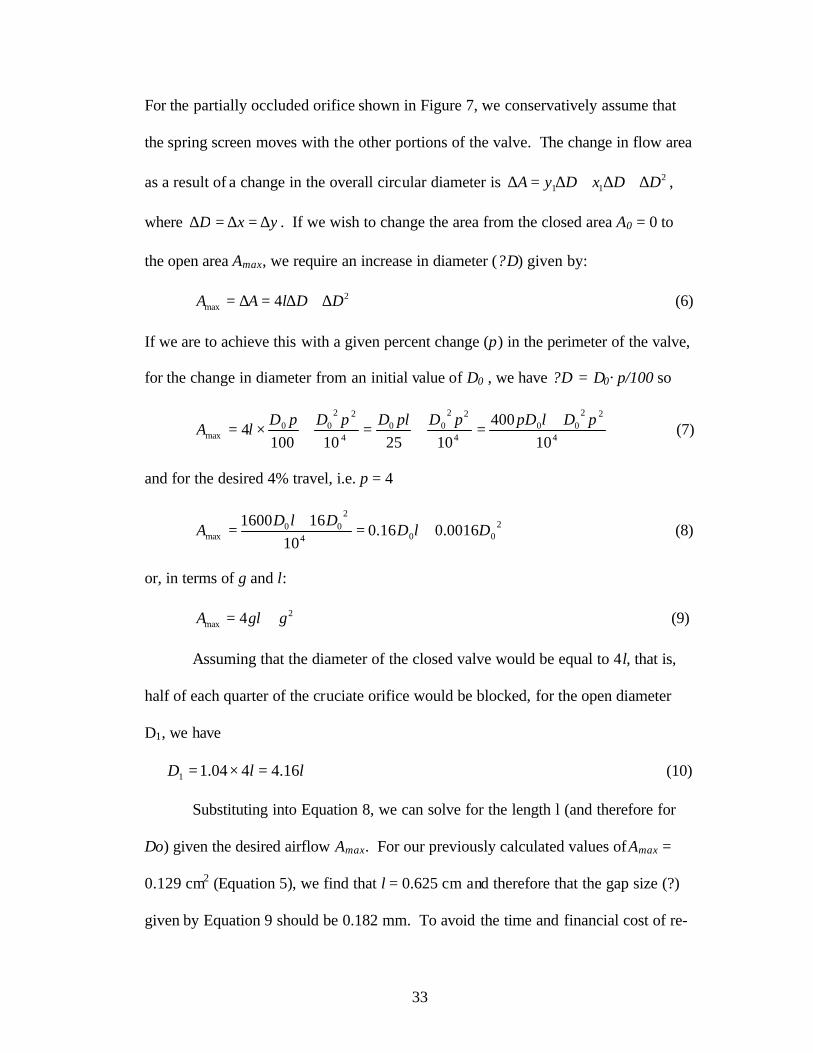
For the partially occluded orifice shown in Figure 7, we conservatively assume that
the spring screen moves with the other portions of the valve. The change in flow area
as a result of a change in the overall circular diameter is 211 DDxDyA ∆+∆+∆=∆ ,
where yxD ∆=∆=∆ . If we wish to change the area from the closed area A0 = 0 to
the open area Amax, we require an increase in diameter (?D) given by:
2max 4 DDlAA ∆+∆=∆= (6)
If we are to achieve this with a given percent change (p) in the perimeter of the valve,
for the change in diameter from an initial value of D0 , we have ?D = D0· p/100 so
4
2200
4
2200
4
2200
max 10400
1025101004
pDlpDpDplDpDpDlA
+=+=+×= (7)
and for the desired 4% travel, i.e. p = 4
2004
200
max 0016.016.010
161600DlD
DlDA +=
+= (8)
or, in terms of g and l:
2max 4 gglA += (9)
Assuming that the diameter of the closed valve would be equal to 4l, that is,
half of each quarter of the cruciate orifice would be blocked, for the open diameter
D1, we have
llD 16.4404.11 =×= (10)
Substituting into Equation 8, we can solve for the length l (and therefore for
Do) given the desired airflow Amax. For our previously calculated values of Amax =
0.129 cm2 (Equation 5), we find that l = 0.625 cm and therefore that the gap size (?)
given by Equation 9 should be 0.182 mm. To avoid the time and financial cost of re-
34
machining, we overdesign the valve to accomodate an Amax of 0.25 cm2 with a gap
size of 0.1 cm. Using Equations 8 and 10, this gives D0 = 2.5 cm and l = 0.625 cm.
We chose of valve height of 1cm in the direction of flow. The longer the
valve in this direction, the greater the minimum head loss it will produce when in the
open position, which would be undesirable in most settings. On the other hand, if the
valve is too short the sections of the valve might flutter or twist in conditions of high
flow. This would produce unpredictable throttling, and would also create the risk that
the quarters would become disengaged from one another and that they or the
springing mechanism would be carried downstream and could the harm ventilator or
the patient.
3.3 Prediction of Flow Performance
In order to determine whether the proposed valve shape is suitable for use in
ventilator and resistance measurement airflow control, we calculated the expected
flow performance of the valve as a throttling mechanism and in response to a periodic
input.
3.3.1 Throttling Characteristics
For the configuration described above, we assumed that the mechanism used
to screen the springs from flow would remain attached to the valve wedges such that
the length of each orifice quarter would remain constant at l. The throttling equation
relating diameter change to area change (D) and the closed diameter of the valve (D0)
is:
35
0224 DDldDdA
−+= and therefore
lDdDdA
42 −= (11)
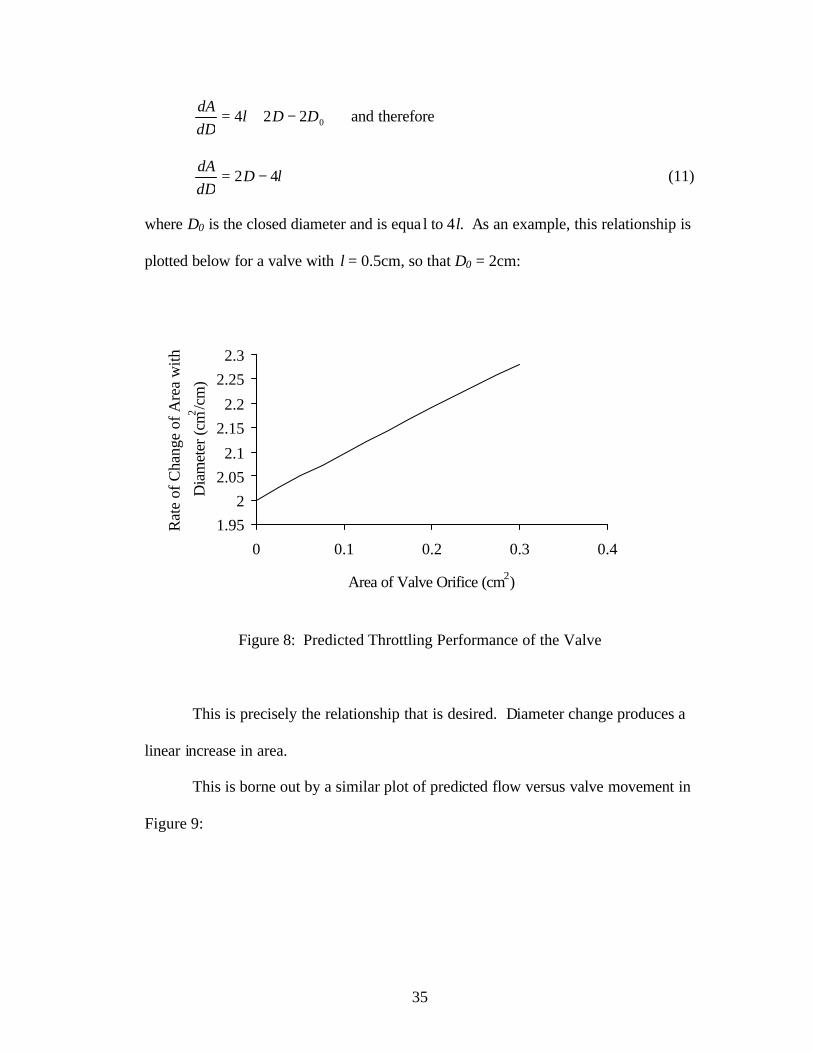
where D0 is the closed diameter and is equa l to 4l. As an example, this relationship is
plotted below for a valve with l = 0.5cm, so that D0 = 2cm:
1.952
2.052.1
2.152.2
2.252.3
0 0.1 0.2 0.3 0.4
Area of Valve Orifice (cm2)
Rat
e of
Cha
nge
of A
rea
with
.
Dia
met
er (c
m2 /cm
)
Figure 8: Predicted Throttling Performance of the Valve
This is precisely the relationship that is desired. Diameter change produces a
linear increase in area.
This is borne out by a similar plot of predicted flow versus valve movement in
Figure 9:

36
0
10
20
30
40
50
60
70
80
90
100
0 20 40 60 80 100
Percentage of Total Stroke
Perc
enta
ge o
f Max
ium
um F
low
.NeedleGateButterflyGlobeHitchcock
Figure 9: Comparison of Theoretical Valve Performance with Major Valve Types
[Adapted from Zappe, 1981; and Lyons, 1982]
In Figure 9, the line for our proposed design is drawn based on the assumption
that flowrate is directly proportional to flow area at constant upstream pressure
(Equation 5). As shown in this graph, the designed valve does not possess the
optimum throttling ratio of the globe valve between 40% and 60% of stroke, yet it has
a linear flow vs. stroke relationship without any regions of sudden change as seen in
the gate valve. This would be an important advantage if the valve were used as part
of a feedback control system.
3.2.2 Expected Response to Periodic Actuation
In both the APD and mechanical ventilators, current methods of use show that
the valve would need to respond across its range of flow at a rate of 10 Hz or better.
Implementation of the proposed design would depend on ensuring that this rate of
operation is far from the natural frequency of the system, and on finding a driver with

37
sufficient force or torque to produce the desired displacement at the needed
frequency. The natural frequency of the system of a single valve wedge of mass m
and its associated spring with constant k is:
HzkgmN
mk
n 10361090.4
/52563 =
⋅== −ω (12)
To calculate the natural frequency for the valve as a whole, it is necessary to
determine the effective spring constant (Keff) for the system. The mechanical work
done to close one of the four gaps between the wedges from a starting gap width of ?,
knowing that the necessary force is γ∆= kF , is given by 2maxmax 2
121
γγ kFW == .
Therefore, for the system of four wedges, the work to close the entire cruciate orifice
is
22 221
4 γγ kkW =
= (13)
In order to determine the needed force to produce this work at the cable, we
assume that the distance-force relationship is linear (which will be proven shortly).
Thus, at the cable, the linear displacement S of the free end is given by the change in
circumference (p · ?), and the work (Wc) perfomed on the cable is:
maxmax21
FWc γπ ⋅= (14)
Finally, since the work on the valve must be equal to the work at the cable, we can
write
πγ max
max
4kF = (15)
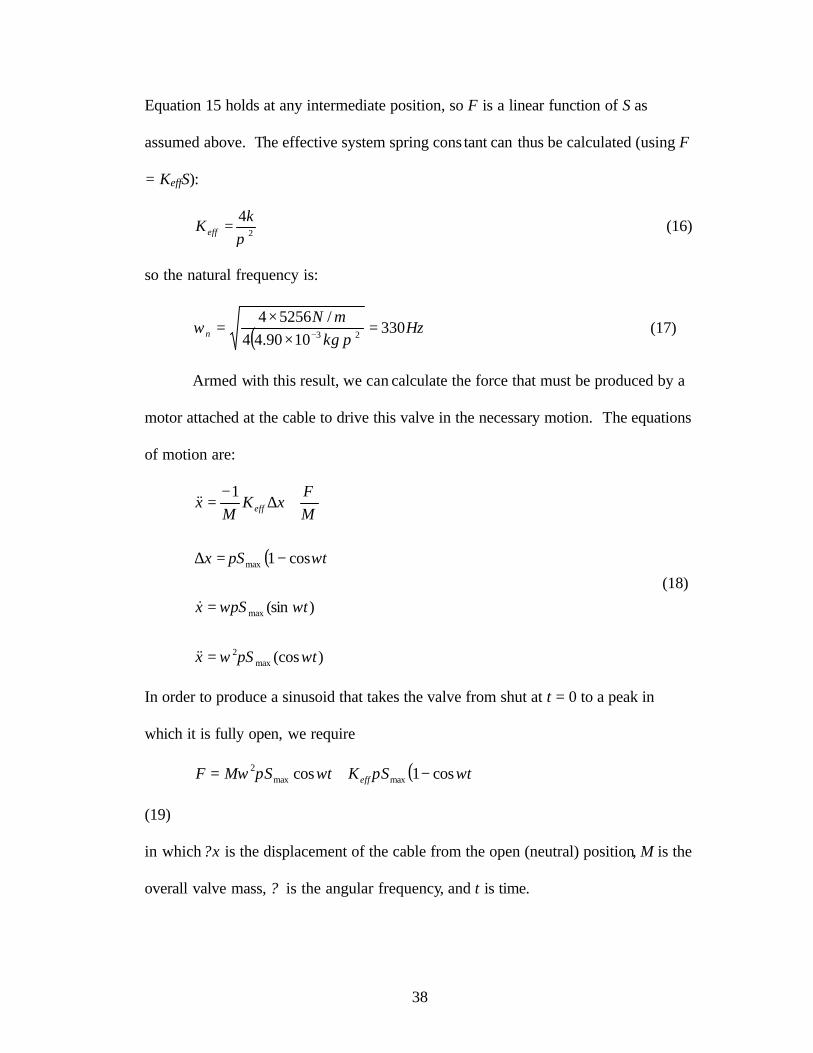
38
Equation 15 holds at any intermediate position, so F is a linear function of S as
assumed above. The effective system spring cons tant can thus be calculated (using F
= KeffS):
2
4π
kK eff = (16)
so the natural frequency is:
( ) Hzkg
mNn 330
1090.44/52564
23 =×
×= − π
ω (17)
Armed with this result, we can calculate the force that must be produced by a
motor attached at the cable to drive this valve in the necessary motion. The equations
of motion are:
( )
)(cos
)(sin
cos1
1
max2
max
max
tSx
tSx
tSx
MF
xKM
x eff
ωπω
ωωπ
ωπ
=
=
−=∆
+∆−
=
&&
&
&&
(18)
In order to produce a sinusoid that takes the valve from shut at t = 0 to a peak in
which it is fully open, we require
( )tSKtSMF eff ωπωπω cos1cos maxmax2 −+=
(19)
in which ?x is the displacement of the cable from the open (neutral) position, M is the
overall valve mass, ? is the angular frequency, and t is time.
39
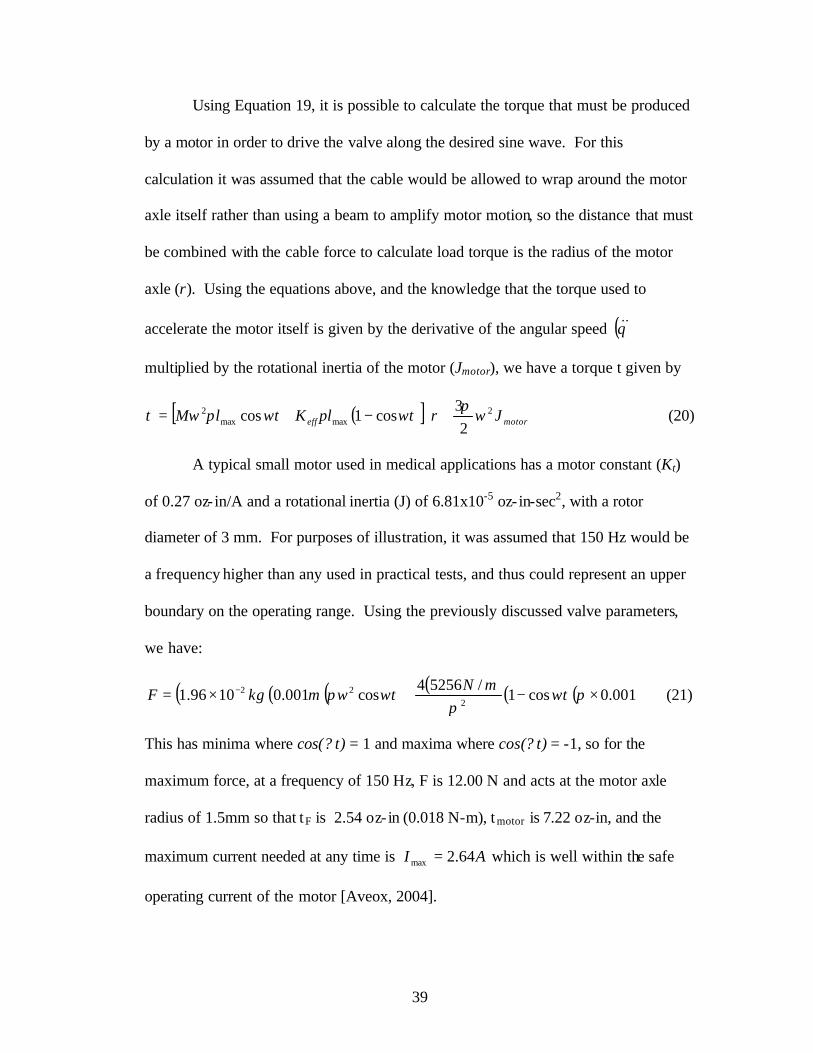
Using Equation 19, it is possible to calculate the torque that must be produced
by a motor in order to drive the valve along the desired sine wave. For this
calculation it was assumed that the cable would be allowed to wrap around the motor
axle itself rather than using a beam to amplify motor motion, so the distance that must
be combined with the cable force to calculate load torque is the radius of the motor
axle (r). Using the equations above, and the knowledge that the torque used to
accelerate the motor itself is given by the derivative of the angular speed ( )θ&&
multiplied by the rotational inertia of the motor (Jmotor), we have a torque t given by
( )[ ] motoreff JrtlKtlM 2maxmax
2
23
cos1cos ωπ
ωπωπωτ +⋅−+= (20)
A typical small motor used in medical applications has a motor constant (Kt)
of 0.27 oz- in/A and a rotational inertia (J) of 6.81x10⁻⁵ oz- in-sec2, with a rotor
diameter of 3 mm. For purposes of illustration, it was assumed that 150 Hz would be
a frequency higher than any used in practical tests, and thus could represent an upper
boundary on the operating range. Using the previously discussed valve parameters,
we have:
( )( )( ) ( ) ( )( )001.0cos1/52564
cos001.01096.12
22 ×−+×= − πωπ
ωπω tmN
tmkgF (21)
This has minima where cos(? t) = 1 and maxima where cos(? t) = -1, so for the
maximum force, at a frequency of 150 Hz, F is 12.00 N and acts at the motor axle
radius of 1.5mm so that tF is 2.54 oz- in (0.018 N-m), t motor is 7.22 oz-in, and the
maximum current needed at any time is AI 64.2max = which is well within the safe
operating current of the motor [Aveox, 2004].

40
The design described above should satisfy all of the objectives of this study.
With the given mass and spring constants, the spring-and-wedge system would have a
natural frequency that far exceeds the intended rate of operation. A stock motor
would have the required torque to drive the valve throughout its desired frequency
range. Flow calculations for this geometry show desirable throttling characteristics,
particularly a gradual transition between full and zero flow.
In addition, the valve is sturdy and simply made which fits the requirements of
the hospital environment. It can be easily disassembled for sterilization or
replacement of internal parts, and the 100% humidity seen in ventilatory applications
will not disturb it. The materials used are all known to be medically safe. In
applications such as the APD in which total valve closure must be prevented as a
failsafe, the design can be readily and inexpensively adapted to ensure that flow is
always available.

41
Chapter 4: Experimental Setup and Procedure
This chapter details the instrumentation used, testing done on the throttling
behavior and dynamic flow performance of the valve, and the use of the valve for
flow resistance measurement.
4.1 Equipment and Instrumentation
Three different experimental setups were used to test the proposed design.
The first was intended to minimize flow disturbances so that highly accurate
calibration curves could be obtained without the influence of turbulence. The second
was arranged to simulate the actual flow environments of the valve within a
mechanical ventilator. The third was the standard setup for human testing of the
APD. Similar instrument arrangements were used in all cases. The details of each
are described here.
4.1.1 Apparatus
For static testing, a test chamber was built using 318 mm inner diameter,
3.2mm wall-thickness hard polyethylene tubing, with a length of 150 cm to allow air
flow to become steady and laminar before entering the test section. At the inlet of the
chamber, 0.6 cm diameter Tygon® tubing connected it to an air manifold supplied by
the regulator described above. Near the outlet of the chamber a 2.5 cm inner diameter
latex rubber tube was placed to keep the valve wedges immobile and form a seal
around their perimeter so that accurate flow measurements could be made. The latex
tubing was 25 cm in length, greater than the seven times its diameter as indicated by
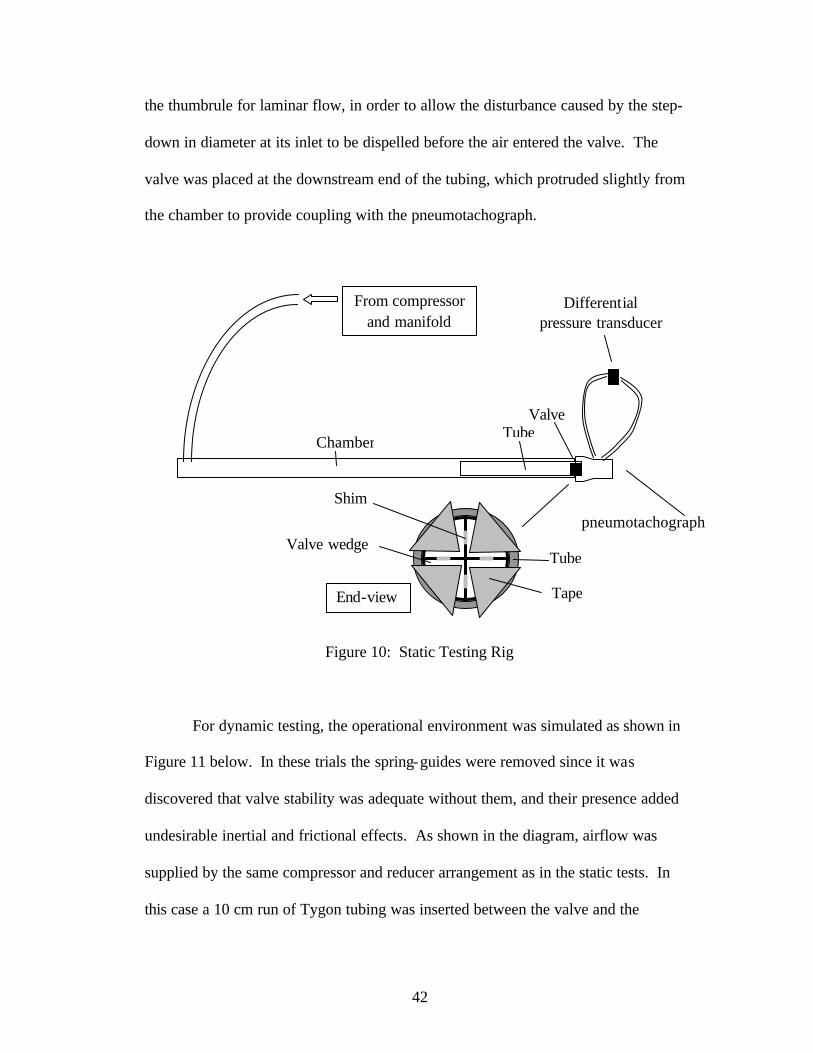
42
the thumbrule for laminar flow, in order to allow the disturbance caused by the step-
down in diameter at its inlet to be dispelled before the air entered the valve. The
valve was placed at the downstream end of the tubing, which protruded slightly from
the chamber to provide coupling with the pneumotachograph.
Figure 10: Static Testing Rig For dynamic testing, the operational environment was simulated as shown in
Figure 11 below. In these trials the spring-guides were removed since it was
discovered that valve stability was adequate without them, and their presence added
undesirable inertial and frictional effects. As shown in the diagram, airflow was
supplied by the same compressor and reducer arrangement as in the static tests. In
this case a 10 cm run of Tygon tubing was inserted between the valve and the
End-view
Tube
Tape
Valve wedge
Shim
Chamber
From compressor and manifold
Tube Valve
pneumotachograph
Differential pressure transducer

43
pneumotachograph in order to simulate the tubing between the control valves and the
flow detector in a mechanical ventilator.
The actuation mechanism for frequency response testing consisted of a
waveform generator with a signal fed through a power supply to an electric motor and
gear assembly as shown below. This drove a lightweight aluminum arm with a Gore-
TEX® cable attached at its end and wrapped around the valve body in a free-sliding
loop. For step- input testing the motor used did not produce adequate torque, so the
strike of a hand-held plastic rod against the motor arm was used.
Figure 11: Dynamic Testing Rig
Differential pressure
transducer
Regulators Valve Pneumotach.
Cable Motor
Demodulator
PCI 6013 DAQ
Labview 7
Waveform Generator Amp
Compressor
Position detector
Air flow

44
For dynamic testing, the valve was placed downstream of the Airflow
Perturbation Device, as shown in Figure 12, and the built- in perturbation mechanism,
a rotating wheel, was disabled in a position that left the flow path to the valve
unobstructed. The valve was then removed and the wheel was to provide reference
tests under the same conditions.
Figure 12: Apparatus for Resistance Measurement
Pressure and flow detectors
Rotating wheel (stopped while testing valve)
Mouthpiece with or without added
resistance
Subject
Valve
Motor
Waveform Generator
Power Supply
45
4.1.2 Instrumentation
Air pressure was supplied to the testing rig by an electrically driven
compressor followed by three reduction stages to minimize fluctuations. During
static testing a two-arm water manometer and two-arm mercury manometer were
used to measure the pressure supplied to the testing setup, and were read to 0.1 cm on
each arm. For speed of reading during dynamic testing, pressure was measured using
the reducer scale in units of psig and accurate to +/- 0.1 psig.
Flow was measured using a Fleisch #3 pneumotachograph (+/- 0.5% of
reading) purchased from Phipps and Bird of Richmond, VA, connected downstream
of the test section holding the valve, its downstream end open to atmosphere. (The
APD uses a Fleisch #2 pneumotachograph with the same accuracy). A Validyne
(Northridge, CA) DP-15 pressure transducer (+/- 0.35 mV/V) was connected across
the taps of the pneumotachograph for flow measurement via differential pressure
using the factory-tested differential pressure versus flowrate calibration curve.
During static testing the signal from the pressure transducer was converted to a 0-10V
dc signal using a lab-built demodulator that was read using a Fluke 73 digital
multimeter (+/- 0.3% of reading). During dynamic testing the signal from the
pressure transducer was sent to a Validyne Carrier/Demodulator Model CD12.
Processed output was fed to a National Instruments (Austin, TX) PCI-6013 type data
acquisition card driven with NI DAQ 7.10 and graphed using National Instruments’
Labview 7.0. Sampling occurred at 250 Hz. Calibration of the differential-pressure
46
signal was performed before each experimental run using a water manometer read in
units of 0.1 cm.
4.2 Experiment One: Static Tests
Because the orifice of the valve is of a shape not previously investigated, its
static pressure-flow relationship was first determined in order to characterize the
valve’s ability to throttle and finely control airflow. Polyester shims of graduated
thicknesses were inserted into the spaces between each pair of wedges to form a
cruciate orifice with arms of exact width. Each shim was circular in cross section
with a diameter of 4 mm perpendicular to flow to equal the portion of the spring
guide that would be exposed were the valve in the given position during dynamic
testing, and centered on the opposing face of the wedge as the spring guide would be.
Shims with thicknesses of 0.10, 0.25, 0.38, 0.51, 0.64, 0.76, 1.02, and 1.27mm
were used. Soft vinyl tape was used to hold the wedges in place at the mouth of the
latex tube and prevent leakage between the tube and the curved surface of the wedge.
The tape was carefully cut to the same shape as the wedge face to prevent occlusion
of the orifice and a resulting reduction in flow. For each set of shims, flow through
the valve was measured at upstream pressures of 1.7, 27.6, 53.2, and 79.6 cm of water
as measured by the water manometer, and 73.4, 93.8, 111.5, and 127.8 cm of water
using the mercury manometer (mercury heights of 54, 69, 82, and 94 mm).
Additionally, leak testing was performed on the assembled but unconnected
valve quarters to determine whe ther flat, smoothly machined Delrin® faces opposed
with minimal force would be adequate to completely stop flow. This test was
47
performed at the pressures shown above which represent the maximum range of
pressures used within a mechanical ventilator. Flow could be completely stopped
using the valve as built, so although at higher pressures it might be desirable to
develop this aspect of the design, this simple approach is satisfactory for the intended
purpose.
4.3 Experiment Two: Dynamic Tests
Upstream pressures of 0.5 to 7.0 psig were used to measure the response of
the valve in closing against 0.53 N/mm springs. In order to simulate as nearly as
possible a step- input to the valve, the motor arm was struck with a plastic rod to drive
the valve fully shut during each trial. Aluminum stops were used on either side of the
arm to ensure that motion did not exceed the desired range. The motor assembly was
left attached, despite the undesirable small addition of rotational inertia, to provide
position indication for the valve arm.
In order to further verify the ability of the valve to fully open or close in a
desirable timeframe, a constant upstream pressure of 2.0 psig was supplied and
waveforms at various frequencies were input via the power supply to the motor to
determine whether full-range flow could be attained. A light latex band was used to
counteract the tendency of the motor to continuously wind in the positive direction.
Metal stops were again used to ensure that the motor did not over-expand the valve or
snap the driving cable. These tests had to be discontinued at a maximum of 18 Hz
because the motor had exceeded its maximum safe input voltage range.

48
4.4 Experiment Three: Resistance Measurement
Finally, the valve was used in place of the existing perturbation mechanism
for resistance measurements. Two individuals were tested for natural breathing
resistance and with a selection of four orifices placed between the subject and the
resistance measurement device to simulate degraded ventilatory conditions. This
procedure was validated in an earlier experiment [Lausted and Johnson, 1998]. The
valve was driven at 10Hz during these trials, which is within the previously
established operating frequency for the APD. The measurements were compared to
those using the standard wheel-perturbed APD, for which the perturbation was
nominally 11 Hz.
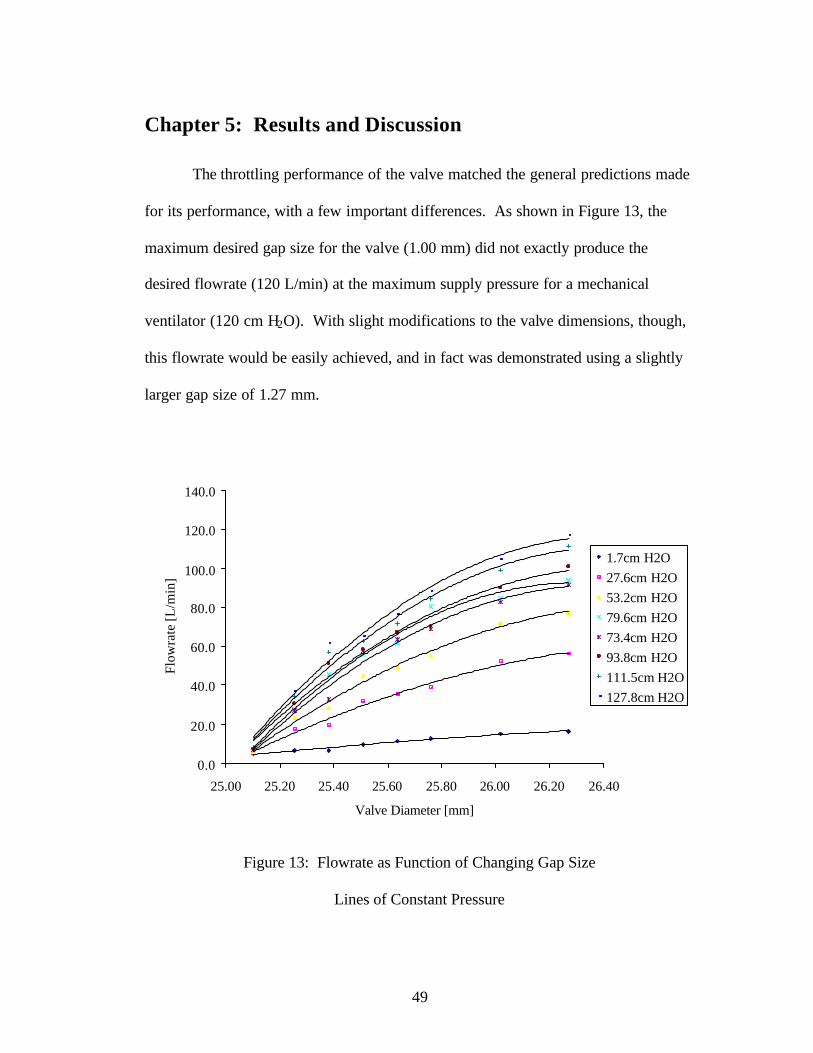
49
Chapter 5: Results and Discussion
The throttling performance of the valve matched the general predictions made
for its performance, with a few important differences. As shown in Figure 13, the
maximum desired gap size for the valve (1.00 mm) did not exactly produce the
desired flowrate (120 L/min) at the maximum supply pressure for a mechanical
ventilator (120 cm H2O). With slight modifications to the valve dimensions, though,
this flowrate would be easily achieved, and in fact was demonstrated using a slightly
larger gap size of 1.27 mm.
0.0
20.0
40.0
60.0
80.0
100.0
120.0
140.0
25.00 25.20 25.40 25.60 25.80 26.00 26.20 26.40
Valve Diameter [mm]
Flow
rate
[L/m
in]
1.7cm H2O27.6cm H2O53.2cm H2O79.6cm H2O73.4cm H2O93.8cm H2O111.5cm H2O127.8cm H2O
Figure 13: Flowrate as Function of Changing Gap Size
Lines of Constant Pressure
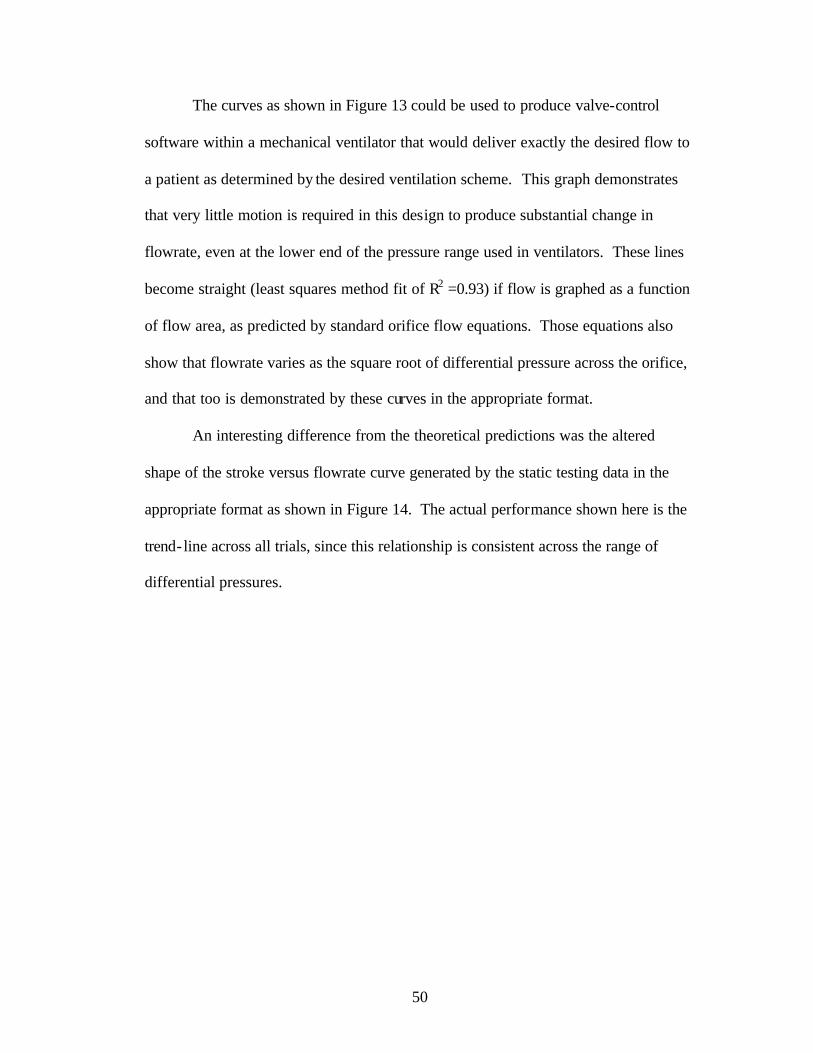
50
The curves as shown in Figure 13 could be used to produce valve-control
software within a mechanical ventilator that would deliver exactly the desired flow to
a patient as determined by the desired ventilation scheme. This graph demonstrates
that very little motion is required in this design to produce substantial change in
flowrate, even at the lower end of the pressure range used in ventilators. These lines
become straight (least squares method fit of R2 =0.93) if flow is graphed as a function
of flow area, as predicted by standard orifice flow equations. Those equations also
show that flowrate varies as the square root of differential pressure across the orifice,
and that too is demonstrated by these curves in the appropriate format.
An interesting difference from the theoretical predictions was the altered
shape of the stroke versus flowrate curve generated by the static testing data in the
appropriate format as shown in Figure 14. The actual performance shown here is the
trend- line across all trials, since this relationship is consistent across the range of
differential pressures.

51
-20
0
20
40
60
80
100
120
0 50 100
Percentage of Total Stroke
Perc
enta
ge o
f Max
imum
Flo
w .
Needle
GateButterflyGlobe
Actual HitchcockPredicted Hitchcock
Figure 14: Actual Performance of Valve
[Adapted from Zappe, 1981; and Lyons, 1982]
This actual curve shape is slightly less desirable than the predicted one since
in the nearly-closed region a small amount of valve stroke produces a greater change
in flow. The reason for this is unknown but is almost certainly a function of valve
geometry. Calculations were done assuming that the orifice is a rectangle, since that
is the only shape for which equations are available that take friction into account.
This valve incorporates an open square at its center with little friction, since its sides
are the open arms of the X-shape, and this will necessarily have an impact on flow.
This curve is still a consistent, predictable relationship without any sudden
transitions, however, and is therefore still favorable for the intended uses.
As mentioned previously, the static testing did also demonstrate that a simple
flat-machined surface at the interface between valve wedges was adequate to control
pressures in excess of maximum ventilator pressure. This means that mass
production of the valve with this simple wedge shape could be carried out cheaply

52
due to minimum design and machining costs, and that the hard, inexpensive plastic
used in production would be appropriate for the actual application.
Simplicity of shape and production is important for two reasons beyond unit
cost. In the resistance measurement application, the valve must have the ability to be
sterilized between patients. This means either heat or chemical treatments in which
every part of the valve must be accessible to steam, mist, or radiation. The only
alternative is to make the internal parts of the valve disposable, which means that it
must be easily disassembled and reassembled. Keeping the seat design simple
promotes both ends.
The tests of the flow relationships during valve motion produced much better
results than expected. In the absence of complete knowledge about the time-scale of
current ventilator valve designs, due to careful guarding of that information by the
companies that produce these machines, a goal of 200ms or less was set and exceeded
for these trials.
The compilation graph shown in Figure 15 was made by examining flow and
valve motion plots at each pressure, and extracting just that part of the graph in which
the motion of interest takes place. Each line was time-correlated to the valve motion
included in the graph so that the exact time from start of valve motion to beginning of
flow change is shown here.
53
-50
0
50
100
150
200
250
300
0.000 0.010 0.020 0.030 0.040 0.050 0.060
Time (Seconds)
Flow
rate
(L/m
in)
.
-0.2
0
0.2
0.4
0.6
0.8
1
1.2
Gap
Siz
e (m
m)
.
7 psi6 psi5 psi4 psi3 psi2 psi1.5 psi1 psi0.5 psiValve
Figure 15: Step Input to Valve, Closing
Sampling in Figure 15 is at 250 Hz, and each symbol represents one sample.
Each line shows the motion of the valve from 1mm gap size (valve diameter = 2.60
cm) to fully closed or vice versa. As is apparent here, the equipment used to measure
flow was at the limit of its ability to respond on this time scale, but these curves
nevertheless show the expected characteristics. It is interesting to note that higher
differential pressure across the valve did not result in slower closing response as
might be expected. It is also of interest that the motion of the valve did not appear to
cause large disturbances in the flow even at the lower pressures, as the lines remain
equally smooth across the differential pressure range.
The valve fully closed in 28 ms or better throughout the trials represented by
this graph, despite valve motion which required an equal amount of time. This is

54
attributable to the extremely small amount of motion required to change flow across
the full range, in comparison to existing designs which require substantial linear or
rotary action to produce a needed change in flow area. The moving parts of this valve
are also very few and have low mass, so the required force is small and acceleration is
rapid.
These conclusions are reinforced by the results of the trials in which a signal
of constant frequency was used to drive the valve between full flow and no flow at a
differential pressure of 2 psi, shown in Figure 16.
0
20
40
60
80
100
120
140
2 2.2 2.4 2.6 2.8 3
Time (seconds)
Flow
rate
(L/m
in)
.
12 Hz16 Hz18 Hz
Figure 16: Valve Response to High Frequencies

55
As shown here the valve was demonstrated to produce full flow changes at up to and
including 16 Hz. The results of the step-input trials suggest that even higher
frequencies would be possible, but even at 18 Hz, as shown in Figure 16, the voltage
input to the actuating motor could not be made large enough to cause full range
motion without damaging the motor system. Nevertheless this graph does support the
step input data, and demonstrates that many full actuations within one second can be
achieved as may be desirable for fine control in ventilator applications. This also
shows that the valve is appropriate for use in resistance measurements, as the
Airwflow Perturbation Device has been shown to produce usable measurements at
frequencies as low as 7 Hz.
The flow curves of lower frequencies in this graph include an unexpected
shoulder during the closing movement as shown in Figure 17 below. The cause of
this has not been proven but is thought to be a result of spring interaction with the
edge of the recess into which the spring compacts during the closing motion. This
catch can be felt when actuating the va lve by hand. The 0.532 N/mm springs used
during dynamic testing had a diameter 0.04 mm larger than the original 0.039 N/mm
springs for which these holes were drilled. This could be corrected by re-drilling but
was not done in this case in order to allow the smaller springs to continue to be used
in later tests if desired without instability created by lateral motion of the valve
quarters. This catch could also be avoided by using the spring guides of the original
design, but this was not done because the effect did not appear to be detrimental to
the testing done here.

56
0
20
40
60
80
100
120
140
1.552 1.602 1.652
Time (seconds)
Flow
rate
(L/m
in)
.
12 Hz16 Hz18 Hz
Figure 17: Detailed View of Valve Response to High Frequencies
Finally, resistance measurements were attempted in order to reinforce the
conclusion that adequate flow changes are produced by the valve to allow its use in
conjunction with the APD. The comparison of results in Figure 18 shows that
although the valve-perturbed measurement did not precisely match the wheel-
perturbed number for the same conditions, there is a strong, predictable relationship
between the two, with a least-squares analysis result of (R2 = 0.9843 for inhalation,
R2 = 0.9867 for exhalation). No attempt was made to recalibrate the device for the
greater resistance created by adding the valve into the existing flow path, and this
certainly accounts for at least a portion of the difference between the two
measurements. The APD software could be slightly modified to account for the
difference in calibration.

57
-10
0
10
20
30
40
50
60
70
0 10 20 30 40 50
Resistance Measured with Existing APD (cm H2O-L/Sec)
Res
ista
nce
Mea
sure
d w
ith V
alve
. (c
m H
2O-L
/Sec
)
-10
0
10
20
30
40
50
0 5 10 15 20 25 30 35 40
Resistance Measured with Existing APD (cm H2O-L/Sec)
Res
ista
nce
Mea
sure
d w
ith V
alve
.
(cm
H2O
-L/S
ec)
Figure 18: Comparison of Current and Proposed APD Performance – Inhalation (top)
and Exhalation (bottom)

58
The valve as built is a good replacement for the existing air perturbation
mechanism. The current slotted disk design is subject to frequent binding,
particularly in the high-moisture environment of ventilatory applications. In addition,
air flow causes the wheel to slow, particularly in high-flow conditions, which may
interfere with the calculation of resistance. The valve is subject to neither of these
difficulties. It is robust and steady in its operation. With a slight modification to the
current housing design, it could be driven by the electric motor already used in the
APD to turn the perturbation wheel.
The current APD is also physically built only for breathing to the open
environment and has significant leaks. With the valve housing as built it is a
completely sealed, symmetric system and would require no further adaptation to
connect it between a mechanical ventilator and a patient, if it is desired to proceed
with the cable-driven approach rather than waiting for usable electroactive polymer
technology to achieve a workable actuator.
An attempt was made to measure breathing resistances against a downstream
capacitance in order to demonstrate this type of application. This could not be
completed because the current APD software is designed to measure negative mouth
pressures during inhalation, while a positive pressure forcing air into the mouth
causes negative pressure to never be achieved. The program therefore returns a null
result for resistance. This will be the subject of further development within the APD
project.

59
Chapter 6: Conclusions
The valve designed as part of this work represents a new type of fluid flow
control mechanism with a geometry different from that of existing valves. Our design
allows the use of circumferential actuation that minimizes actuator travel during valve
stroke. Its small mass and resulting low inertia allow the rapid actuation demanded of
air-control devices in medical settings. The valve’s throttling characteristics are
favorable and predictable, with a smooth profile across the range of operation.
Furthermore, the new valve is a suitable replacement for the current perturbation
mechanism in the Airflow Perturbation Device. Our design is simple and robust in
the presence of humidity and high-velocity flows.
6.1 Recommendations for Further Study
It was clear during our experiments that the speed of valve’s step response
was limited by the speed at which the motor could rotate, not by the design of the
valve. The step response experiments and the analysis of valve dynamics point to
a much higher operating frequency than the ones generated by the actuator used in
our setup.
The mechanical characteristics of the valve can be further improved. The
Gore-TEX® cable used to drive the valve tended to bind or fray after an hour or
two of motion. This was largely caused by crudely drilling a hole in the housing
through which the cable passed. The cable hole was also the source of significant
air leakage if not packed carefully. This passage should be redesigned to resolve

60
both problems, and other low-friction, high-strength cable materials should be
considered.
Friction between the moving valve parts and the housing surface normal to
flow necessitated the use of fairly stiff springs to ensure that the valve would
open, even in the presence of a high differential pressure. The friction between
wedges and housing increased in the presence of collected moisture, which would
certainly be present in a ventilator application. Consideration should be given to
the geometry of this interface.
The head loss caused by the valve in its open state is fairly large, but might be
reduced by creating a tapered surface normal to flow rather than the flat plane
used in this case. Redesigning the three-dimensional shape of the valve wedges
would be a useful focus of improved design.
Finally, the capabilities of this valve make it physically possible to perform
rapid closed- loop control of assisted breathing. Software will have to be created
for valve control and to adapt the APD to operation in the presence of a
mechanical ventilator.

61
Bibliography
Abreu, M. Gama. 2001. Monitoring the Pulmonary Function of the Patient with ARDS. Thes. University Clinic Carl Gustav Carus, Dresden University of Technology. Aestiva. 2004. Product Brochure for 5 MRI Anesthesia Machine. American Thoracic Society, with the European Society of Intensive Care Medicine, and Le Societe de Reanimation de Langue Francaise. 1999. “Internal Consensus Conferences in Intensive Care Medicine: Ventilator-associated Lung Injury in ARDS.” Respiratory Critical Care Medicine 160: 2118-2124. American Thoracic Society. 1994. “Standardization of Spirometry: 1994 Update.” Official Statement of the American Thoracic Society, Adopted by its Board of Directors, 11 November 1994. ARDS Network. 2000. “Ventilation with Lower Tidal Volumes as Compared with Traditional Tidal Volumes for Acute Lung Injury and the Acute Respiratory Distress Syndrome.” The New England Journal of Medicine 342(18): 1301- 1308. Aslanian, Pierre, Souhail El Atrous, Daniel Isabey, Elisabeth Valente, Daniella Corsi, Alain Harf, Francois Lemaire, and Laurent Brochard. 1998. “Effects of Flow Triggering on Breathing Effort During Partial Ventilatory Support.” American Journal of Respiratory Critical Care Medicine 157: 135-143. Aveox. 2004. Medical Motor Type 1005 Product Specifications. Brunner, J. X. 2002. “History and Principles of Closed- loop Control Applied to Mechanical Ventilation.” Nederlandse Vereniging voor Intensive Care 6(4): 6-9. Catlin, Elizabeth A. 1998. “Mechanical Ventilation in the Neonate.” Internal memorandum from the Harvard and Massachusetts General Hospital Departemnt of Neonatology. Chao, David, David J. Scheinhorn, and Meg Stearn-Hassenpflug. 1997. “Patient- ventilator Trigger Asynchrony in Prolonged Mechanical Ventilation.” Clinical Investigations in Critical Care 112(6): 1592-1599. Conti, Georgio, Massimo Antonelli, Silvia Arzano, and Alessandro Gasparetto. 1997. “Equipment Review: Measurement of Occlusion Pressures in Critically Ill Patients.” Critical Care 1(3): 89-93.

62
Du, Hong-Lin, Mikiya Ohtsuji, Masaki Shigeta, David C. Chao, Katsunori Sasaki, Yutaka Usuda, and Yoshitsugu Yamada. 2001. “Expiratory Asynchrony in Proportional Assist Ventilation.” American Journal of Respiratory Critical Care Medicine 165: 972-977. Emerson. 2003. Personal communication. Esteban, Andres, Fernando Frutos, Martin Tobin, Inmaculada Alia, Jose Solsona, Inmaculada Valverdu, Rafael Fernandez, Miguel A. De La Cal, Salvador Benito, Roser Tomas, Demetrio Carriedo, Santiago Macias, and Jesus Blanco. 1995. “A Comparison of Four Methods of Weaning Patients from Mechanical Ventilation.” The New England Journal of Medicine 332(6): 345-350. Farré, Ramon, Marco Mancini, Mar Rotger, Miquel Ferrer, Josep Roca, and Daniel Navajas. 2001. “Oscillatory Resistance Measured during Noninvasive Proportional Assist Ventilation.” American Journal of Respiratory Critical Care Medicine. 164: 790-794. Field, Karen A.. 2003. “Engineers Fight SARS.” Design News 4 August 2003. Gawande, Atul. 2002. Complications. New York: Picador USA. Gomella, Leonard G. 1998. Clinician’s Pocket Reference. 7th ed. Norwalk, Connecticut: Appleton and Lange. Grasso, Salvatore, Filomena Puntillo, Luciana Mascia, Giovanni Ancona, Tommaso Fiore, Francesco Bruno, Arthur Slutsky, and V. Marco Ranieri. 2000. “Compensation for Increase in Respiratory Workload during Mechanical Ventilation.” American Journal of Respiratory Critical Care Medicine 161:819-826. Holland, W. P., A. F. Verbraak, J. M. Bogaard, and W. Boender. 1986. “Effective Airway Resistance: A Reliable Variable from Body Plethysmography.” Clinical Physiology and Physiology Measurement 7(4): 319-331. Hubmayr, Rolf D., Martin D. Abel, and Kai Rehder. 1990. “Physiologic Aproach to Mechanical Ventilation.” Critical Care Medicine 18(1): 103-113. Johnson, A. T., H. M. Berlin, and S. A. Purnell. 1974. “Perturbation Device for Noninvasive Measurement of Airways Resistance.” Medical Instrumentation 8:141. Johnson, Arthur T. 1991. Biomechanics and Exercise Physiology. New York: John Wiley and Sons, Inc.

63
Kosarzecki, Connie. 2003. “Proportional Flow Controls.” Command Controls Corporation Product Brochure. Kreit, J. W., M. W. Capper, and W. L. Eschenbacher. 1994. “Patient Work of Breathing During Pressure Support and Volume-cycled Mechanical Ventilation.” American Journal of Respiratory Critical Care Medicine 149(5): 1085-1091. Lausted, Christopher G., and Arthur T. Johnson. 1999. “Respiratory Resistance Measured by an Airflow Perturbation Device.” Physiological Measurement 20: 21-35. Martini, Frederic. Fundamentals of Anatomy and Physiology. Upper Saddle River, New Jersey: Prentice Hall. Matthay, Frank J. A. 2003. “Science Review: Mechanisms of Ventilator-Induced Injury.” Critical Care 7(3): 233-41. Munson, Bruce R., Donald F. Young, and Theodore H. Okiishi. 1994. Fundamentals of Fluid Mechanics. 2nd ed. New York: John Wiley and Sons, Inc. Navajas, Daniel and Ramon Farre. 2001. “Forced Oscillation Assessment of Respiratory Mechanics in Ventilated Patients.” Critical Care Medicine 5(1): 3-9. Phipps and Bird, Internal memorandum. Pneumotachographe De Fleisch, Modèle n.3. April, 2004. Puritan Bennet. 2003. Personal communication. Puritan Bennet. 2003. Product Brochure on Achieva Model Ventilator. Ranieri, V. Marco, Rocco Giuliani, Luciana Mascia, Salvatore Grasso, Vito Petruzzelli, Muccia Puntillo, Gaetano Perchiazzi, Tommaso Fiore, and Antonia Brienza. 1996. “Patient-ventilator Interaction During Acute Hypercapnia: Pressure-support vs. Proportional-Assist Ventilation.” The American Physiological Society 161: 426-436. Sahota, Manjit Singh. 1998. Validation of the Airflow Perturbation Device and the Pressure Flow Characteristics of Excised Sheep Lungs. Diss. University of Maryland. SensorMedics. 2003. Personal communication. Tobin, Martin, Amal Jubran, and Franco Laghi. 2001. “Patient-Ventilator Interaction.” American Journal of Respiratory and Critical Care Medicine 163(5): 1059-1072.
64
Tobin, Martin. 2001. “Ventilator Monitoring, and Sharing the Data with Patients.” American Journal of Respiratory and Critical Care Medicine 163: 810-811. Vo, Quang Viet. 1987. The Airflow Perturbation Device Ventilated. Thes. University of Maryland. Walls, Ron, Robert Luten, Michael Murphy, and Robert Schneider. 1997. Manual of Emergency Airway Management. Philadelphia: Lippincott Williams & Wilkins Publishers. Whitehead, T. and A. S. Slutsky. 2002. “The Pulmonary Physician in Critical Care – 7: Ventilator Induced Lung Injury.” Thorax 57: 635-642. Yamada, Yoshitsugu, and Hong-Lin Du. 2000. “Analysis of the Mechanisms of Expiratory Asynchrony in Pressure Support Ventilation: A Mathematical Approach.” Journal of Applied Physiology 88(6): 2143-2158. Yang, Karl L., and Martin Tobin. 1991. “A Prospective Study of Indexes Predicting the Outcome of Trials of Weaning from Mechanical Ventilation.” The New England Journal of Medicine 324(21): 1445-1450.