abstract title of dissertation / thesis: interactions of
TRANSCRIPT
ABSTRACT
Title of Dissertation / Thesis: INTERACTIONS OF VIBRIO CHOLERAESEROGROUPS O1 AND O139 AND COPEPODS
Tonya Kafí Rawlings, Doctor of Philosophy, 2005
Dissertation / Thesis Directed By: Dr. Rita R. Colwell, Department of Cell Biology and Molecular Genetics
Vibrio cholerae O1 El Tor and O139 Bengal have caused cholera epidemics
throughout Bangladesh and elsewhere in the world with a seasonal regularity. This
has raised questions about whether clinical presentations of cholera caused by these
two epidemic serogroups of V. cholerae reflect similar responses to their aquatic
habitat. The association of V. cholerae with plankton has been suggested to be an
important factor in transmission of the disease. In this study, differences in resource
utilization of copepods and chitin by V. cholerae O1 and O139 were analyzed using
laboratory microcosm experiments.
When occurring separately, V. cholerae O1 and O139 were able to colonize
copepods, including Acartia tonsa and Eurytemora affinis. However, V. cholerae O1
had a higher affinity for colonizing adults of both copepod species, as well as the
multiple life stages of E. affinis, than V. cholerae O139.
In sympatry, colonization of copepods by V. cholerae O1 and O139 did not
result in specific exclusion of one serogroup by the other. Results of this study
indicate that cells that are already established may facilitate attachment through new
biofilm formation, notably by V. cholerae O139.
Soluble chitin, employed as a nutrient source, supported growth of V. cholerae
O1 and O139. Growth of both serogroups with the addition of chitin was
significantly greater than in river water alone. In competition assays, V. cholerae
O139 had a deleterious effect on V. cholerae O1 growth, but not vice versa.
Together, these data indicate that V. cholerae O1 and O139 respond
differently to copepods as habitat, as well as nutrient resources. Such differences
may play a role in cholera epidemics. The spatiotemporal dynamics of V. cholerae in
the environment is complex, and understanding what drives cholera outbreaks
requires explicit consideration of population responses and interactions of multiple
serogroups.
INTERACTIONS OF VIBRIO CHOLERAE SEROGROUPS O1 AND O139 AND COPEPODS
By
Tonya Kafí Rawlings
Dissertation submitted to the Faculty of the Graduate School of the University of Maryland, College Park, in partial fulfillment
of the requirements for the degree ofDoctor of Philosophy
2005
Advisory Committee:Dr. Rita Colwell, ChairDr. Greg Ruiz, Co- ChairDr. Pedro BarbosaDr. Fred DobbsDr. Margaret Palmer
© Copyright byTonya Kafi Rawlings
2005

ii
Dedication
I dedicate this work to my parents, Gilbert and Marti Rawlings, who have supported
me in every endeavor since my inception.
iii
Acknowledgements
I am indebted to my advisors, Dr. Rita Colwell and Dr. Greg Ruiz, who
helped direct my intellectual curiosity of Vibrio cholerae. Thanks also to committee
members who provided critical input, intellectual challenges, and scientific guidance.
A special thanks goes to Dr. Anwar Huq for his thesis research and helpful
discussions on the association of zooplankton and Vibrio cholerae, which set the
foundation for my dissertation. I would also like to acknowledge and thank Norma
Brinkley for her administrative help and all around support.
I gratefully acknowledge Bud Milsaps of the Chesapeake Bay Laboratories,
Solomons, MD, who provided Eurytemora affinis copepod stocks and Tim Mullady,
Jaime Lawshe, and the many interns of the Smithsonian Environmental Research
Center, Edgewater, MD, for their excellent assistance in this study. I would also like
to acknowledge Dr. Estelle Russek-Cohen and Dr. Mark Minton, who provided
statistical guidance.
I would like to thank my friends and family for supporting me through this
process from beginning to end. Without their love and understanding, I might not
have made it this far.
This study was supported by National Institutes of Health Grant No.
1R01A139129-01, National Sea Grant No.SA7528006-A, and several fellowships:
the Robert D. Watkins Fellowship, American Society of Microbiology, Washington,
D.C.; a Smithsonian Institution Graduate Fellowship, Smithsonian Institution,
Washington, D.C.; and a Dissertation Fellowship from UNCF•Merck Scientific,
United Negro College Fund, Virginia.
iv
Table of Contents
Dedication ..................................................................................................................... iiAcknowledgements...................................................................................................... iiiList of Tables ............................................................................................................... viList of Figures ............................................................................................................ viiiChapter 1: General Introduction .................................................................................. 1
1.1 Cholera as a Paradigm ........................................................................................ 11.2 Ecological and Epidemiological Background of Vibrio cholerae with an emphasis on the association of serogroups O1 and O139 with zooplankton............ 2
1.2.1 Importance of zooplankton .......................................................................... 31.2.2 Epidemiology and Molecular Biology of V. cholerae O1 El Tor and O139 Bengal................................................................................................... 61.2.3 Interactions in the aquatic environment influencing V. choleraedistribution ............................................................................................................ 9
1.3 Copepods and Areas of V. cholerae Presence .................................................. 131.4 Scope of the Present Research .......................................................................... 17
Chapter 2: Association of Vibrio cholerae serogroups O1 El Tor and O139Bengal with the copepods Acartia tonsa and Eurytemora affinis............................... 19
2.1 INTRODUCTION ............................................................................................ 192.2 MATERIALS AND METHODS...................................................................... 22
2.2.1 Effect of Copepod Species and Serotype on Colonization ........................ 222.2.2 Colonization of E. affinis Life Stage.......................................................... 25
2.3 RESULTS ......................................................................................................... 292.3.1 Effect of Copepod Species and Serogroup on Colonization...................... 292.3.2 Colonization of E. affinis Adults, Eggs, Nauplii ....................................... 36
2.4 DISCUSSION................................................................................................... 472.4.1 Effect of Copepod Species and Serogroup on Colonization...................... 472.4.2 Colonization of E. affinis Adults, Eggs, Nauplii ....................................... 50
Chapter 3: Sympatric existence of V. cholerae O1 and O139 in copepod habitats .... 543.1 INTRODUCTION ............................................................................................ 543.2 MATERIAL AND METHODS........................................................................ 57
3.2.1 Sympatric colonization of copepods.......................................................... 573.2.2 Chitin Utilization ................................................................................ 613.2.3 Competition for Soluble Chitin........................................................... 63
3.3 RESULTS ......................................................................................................... 653.3.1 Sympatric colonization of copepods.......................................................... 653.3.2 Chitin Utilization ................................................................................ 733.3.3 Competition for Soluble Chitin.................................................................. 76
3.4 DISCUSSION................................................................................................... 863.4.1 Sympatric colonization of copepods.......................................................... 863.4.2 Chitin Utilization ................................................................................ 883.4.3 Competition for Soluble Chitin.................................................................. 883.4.4 Possible Mechanisms of Coexistence ................................................. 90
v
Chapter 4: Implications of copepod patchiness on V. cholerae distribution .............. 954.1 Large Geographic Patterns: meso- to coarse-scale ........................................... 994.2 Population Interactions: fine-scale.................................................................. 1014.3 Individual Copepod: micro-scale.................................................................... 103
Chapter 5: Future directions and Conclusion............................................................ 1065.1 Future Directions ............................................................................................ 1065.2 Summary and Conclusion ............................................................................... 110
REFERENCES ......................................................................................................... 114
vi
List of Tables
TABLE 1.1 Zooplankton associated with environmental V. cholerae in
plankton
surveys…………………………………………………………………….…………15
TABLE 2.1: Two-way ANOVA (Mixed Model) for the colonization of
A. tonsa and E. affinis copepods by V. cholerae O1 and O139……………………...30
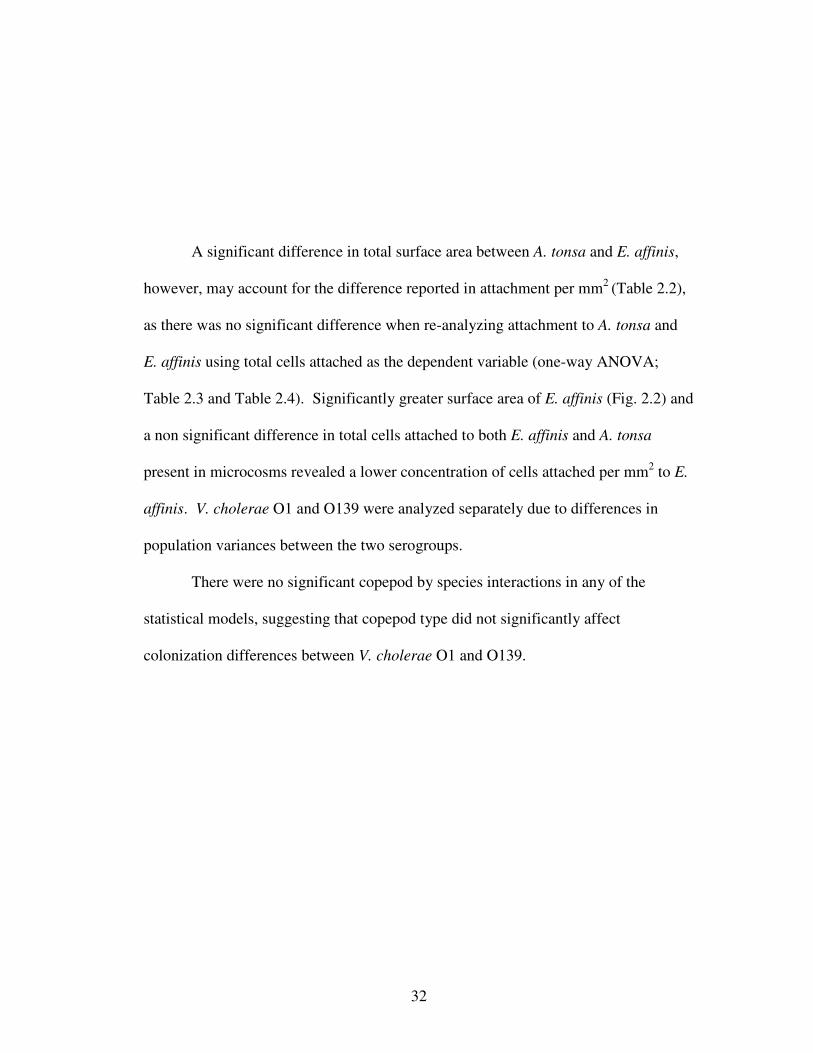
TABLE 2.2: Two-way ANOVA (Mixed Model) for the difference in total
surface area between A. tonsa and E. affinis copepods by
V. cholerae O1 and O139……………………………………………………………33
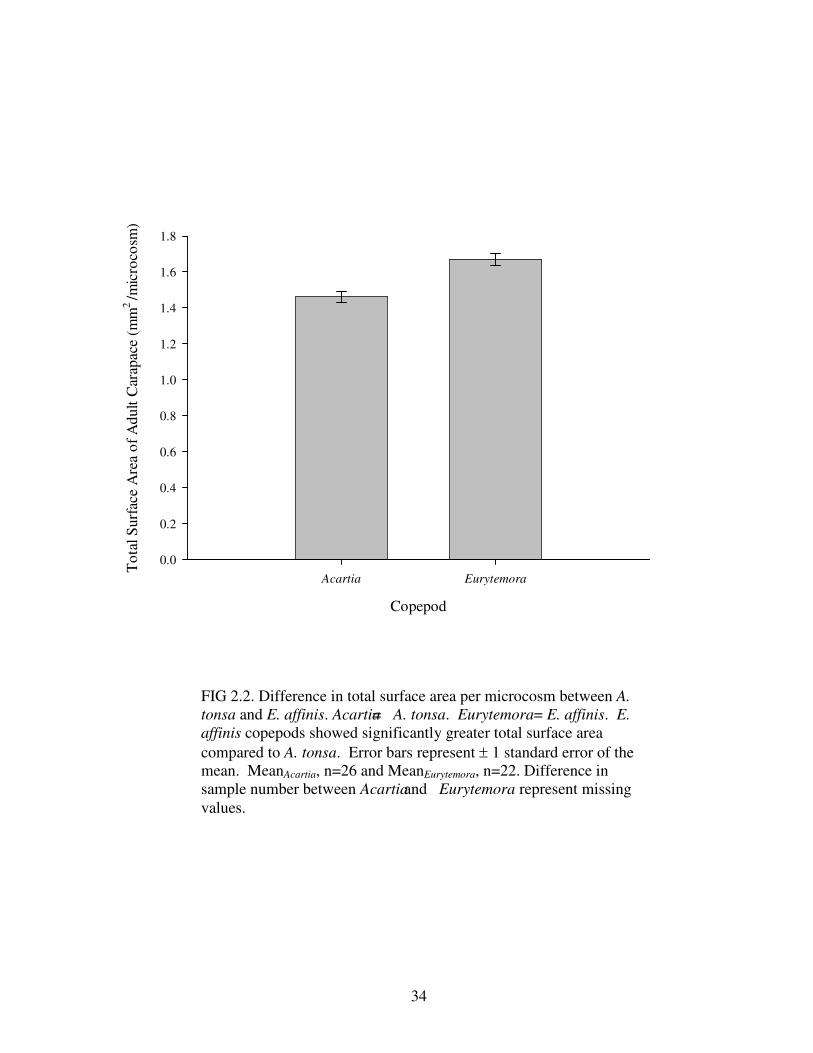
TABLE 2.3: One-way ANOVA (Mixed Model) for the colonization of
A. tonsa and E. affinis copepods by V. cholerae O1……………………….………..35
TABLE 2.4: One-way ANOVA (Mixed Model) for the colonization of
A. tonsa and E. affinis copepods by V. cholerae O139……………………….……..35
TABLE 2.5: Two-way ANOVA (GLM) for colonization of E. affinis
adults by V. cholerae O1 and O139 over 48 h.……………………………….……..37
TABLE 2.6: Two-way ANOVA (GLM) for colonization of E. affinis
eggs by V. cholerae O1 and O139 over 48 h..………………………………………39
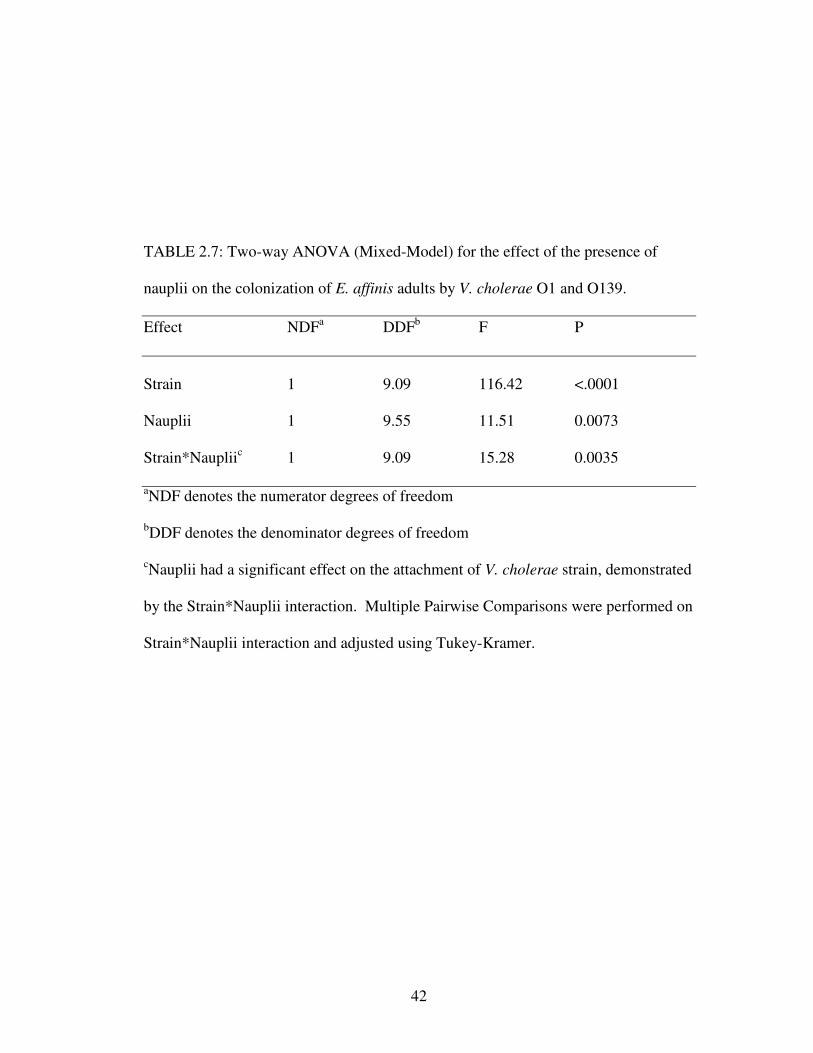
TABLE 2.7: Two-way ANOVA (Mixed-Model) for the effect of the presence
of nauplii on the colonization of E. affinis adults by
V. cholerae O1 and O139 ………………………………………………….………..42
vii
TABLE 2.8: Two-way ANOVA (Mixed-Model) for the effect of the presence
of nauplii on the colonization of E. affinis eggs by
V. cholerae O1 and O139.……………………….…………………………………...44
TABLE 3.1: Three-way ANOVA (Mixed-Model) for sympatric colonization
of A. tonsa and E. affinis by V. cholerae O1 and O139………………..…………….67
TABLE 3.2: Two-way ANOVA (Mixed-Model) for sympatric colonization
of A. tonsa and E. affinis by “invader” and “established” forms
V. cholerae O1……………………………………………………………………….69
TABLE 3.3: Two-way ANOVA (Mixed-Model) for sympatric colonization
of A. tonsa and E. affinis by “invader” and “established” forms
V. cholerae O139…………………………………………………………………….71
TABLE 3.4: Repeated Measures analysis for 72 h growth of V. cholerae
O1 and O139 using either soluble chitin or micronutrients present in
filtered river water as substrate……………………………………………….……...74
TABLE 3.5: Repeated Measures analysis for the relative fitness of
V. cholerae O1 and O139 using soluble chitin as substrate …………..…………….77
TABLE 3.6: Repeated Measures analysis of growth curves of V. cholerae
O1 in single and mixed competitive cultures, measured at 24 to 72 h,
with soluble chitin as substrate ……………………………………………...……....82
TABLE 3.7: Repeated Measures analysis of growth curves of V. cholerae
O139 in single and mixed competitive cultures, measured at
24 to 72 h, with soluble chitin as substrate…………………………………………..84
viii
List of Figures
Figure 2.1 V. cholerae O1 and O139 attached to A. tonsa and E. affiniscopepods……………………………………………………………………………..31
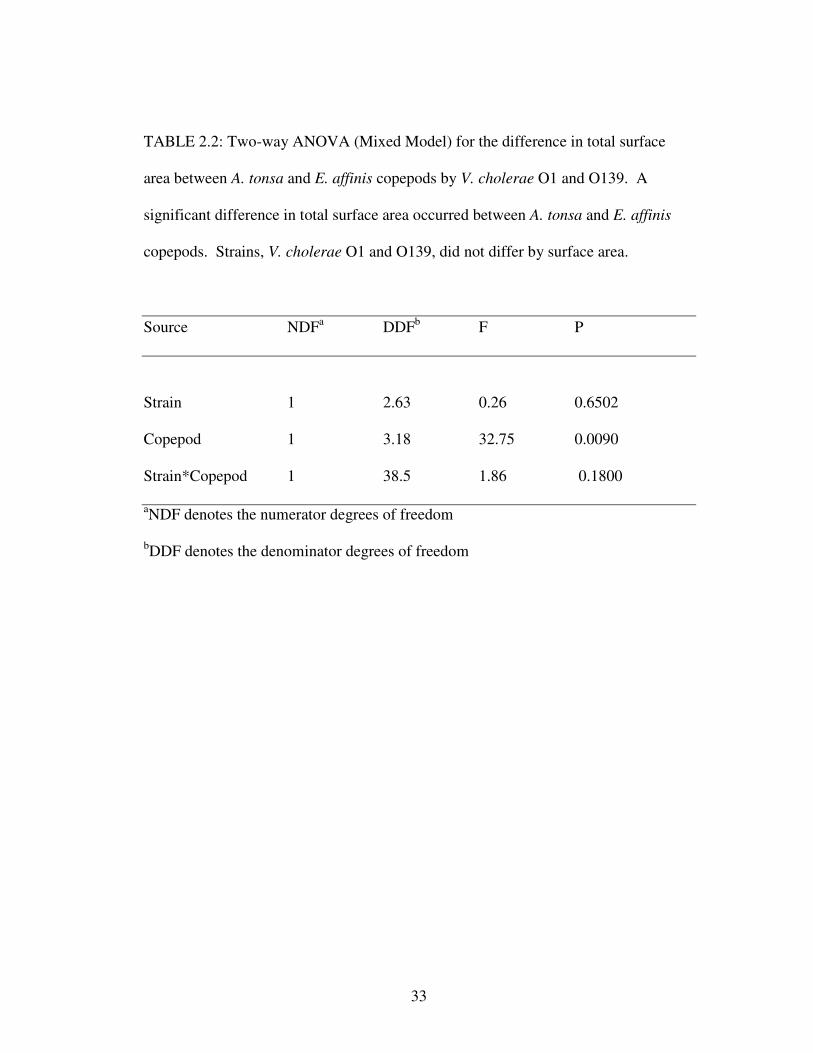
Figure 2.2 Difference in total surface area per microcosm between A. tonsaand E. affinis ………... ……………………………………………………………...34
Figure 2.3 Colonization of E. affinis adults by V. cholerae O1 and O139, measured over 48 h …………………………………………………………………38
Figure 2.4 Colonization of E. affinis eggs by V. cholerae O1 and O139, measured over 48 h ………………….………………………………………………40
Figure 2.5 Association of V. cholerae O1 and O139 with E. affinis adults in the presence or absence of hatched nauplii ……..…………………………………….…43
Figure 2.6 Association of V. cholerae O1 and O139 with E. affinis eggs in the
presence or absence of hatched nauplii ……………………………………….……..45
Figure 2.7 Association of V. cholerae O1 with E. affinis adults and nauplii in
separate microcosms………………………….……………………………………...46
Figure 3.1 Experimental design of sympatric colonization of A. tonsa and
E.affinis by V. cholerae O1 and O139.………………………………………………60
Figure 3.2 Influence of “invader” strains by V. cholerae previously “established”
on copepods.…………………………………………………………………………68
Figure 3.3 Colonization of copepods by “established” and “invader” forms ofV. cholerae O139…………………………………………………………………….70
Figure 3.4 Colonization of A. tonsa and E. affinis by “established and
“invader” forms of V. cholerae O139………………………………………..……..72
ix
Figure 3.5 Growth of V. cholerae O1 and O139 with soluble chitin as
substrate ……………………………………………………………………………..75
Figure 3.6 Change in fitness of V. cholerae O1 and O139 at 0- 24h and 24-72h…………………...…………….……………………………………………..78
Figure 3.7 Net rate of change in cell concentration of V. cholerae O1 and O139 in mixed strain microcosms………………………………………………………….79
Figure 3.8 Net rate of change in concentration of V. cholerae O1 and O139 in single strain microcosms…………………………………………………………..80
Figure 3.9 Comparison of single and mixed cultures of V. cholerae O1………….....83
Figure 3.10 Comparison of single and mixed cultures of V. cholerae O139………...85
1
Chapter 1: General Introduction
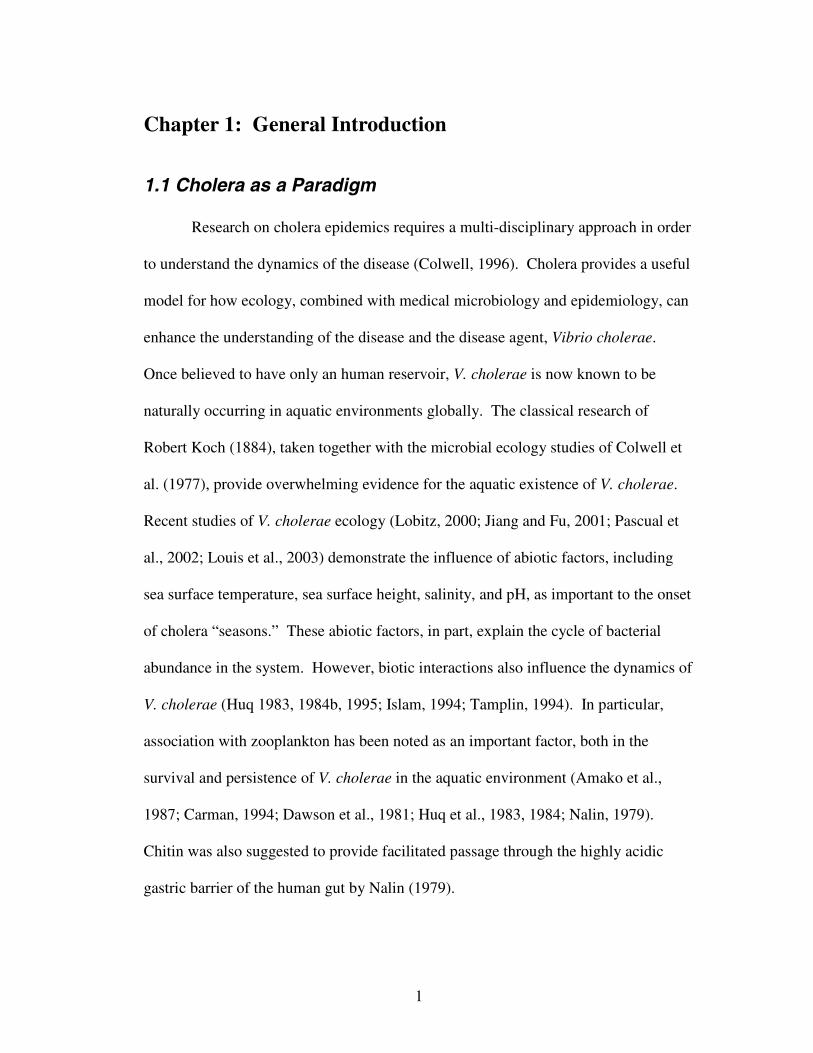
1.1 Cholera as a Paradigm
Research on cholera epidemics requires a multi-disciplinary approach in order
to understand the dynamics of the disease (Colwell, 1996). Cholera provides a useful
model for how ecology, combined with medical microbiology and epidemiology, can
enhance the understanding of the disease and the disease agent, Vibrio cholerae.
Once believed to have only an human reservoir, V. cholerae is now known to be
naturally occurring in aquatic environments globally. The classical research of
Robert Koch (1884), taken together with the microbial ecology studies of Colwell et
al. (1977), provide overwhelming evidence for the aquatic existence of V. cholerae.
Recent studies of V. cholerae ecology (Lobitz, 2000; Jiang and Fu, 2001; Pascual et
al., 2002; Louis et al., 2003) demonstrate the influence of abiotic factors, including
sea surface temperature, sea surface height, salinity, and pH, as important to the onset
of cholera “seasons.” These abiotic factors, in part, explain the cycle of bacterial
abundance in the system. However, biotic interactions also influence the dynamics of
V. cholerae (Huq 1983, 1984b, 1995; Islam, 1994; Tamplin, 1994). In particular,
association with zooplankton has been noted as an important factor, both in the
survival and persistence of V. cholerae in the aquatic environment (Amako et al.,
1987; Carman, 1994; Dawson et al., 1981; Huq et al., 1983, 1984; Nalin, 1979).
Chitin was also suggested to provide facilitated passage through the highly acidic
gastric barrier of the human gut by Nalin (1979).
2
Molecular studies of V. cholerae suggest that proteins used in attachment to
zooplankton may be a part of the disease cascade, once it reaches the human gut
(Tarsi and Pruzzo, 1999; Meibom et al., 2004). Specifically, cholera toxin and other
virulence factors may influence the association of V. cholerae with zooplankton in the
aquatic environment, thereby contributing to its transmission to susceptible human
hosts. Thus, components influencing the persistence of V. cholerae in the aquatic
environment may play a role in human infection.
Research across many disciplines provides a composite model of transmission
(Colwell and Huq, 1994), demonstrating how the cycling of V. cholerae between
aquatic and human environments may be significant in epidemic cholera. Such a
model can provide a mechanism for viewing physicochemical parameters and
epibiotic interactions with plankton that involve V. cholerae in the aquatic
environment as an agent of disease.
Despite these advances, several gaps remain in understanding V. cholerae
dynamics in the environment. Below the current knowledge about the association of
V. cholerae and plankton is reviewed briefly, providing the background and basis for
my thesis research.
1.2 Ecological and Epidemiological Background of Vibrio cholerae with an emphasis on the association of serogroups O1 and O139 with zooplankton
Past research explored the association between V. cholerae and plankton and
provided a foundation for understanding the relationship between ecological
dynamics of V. cholerae in the aquatic environment and human epidemics. The body
3
of literature that provides a background for the work presented in the following
chapters is briefly reviewed here. This section is divided into three parts: 1) the
zooplankton-vibrio association, 2) the emergence and re-emergence of V. cholerae
O1 El Tor and O139 Bengal., and 3) the association of V. cholerae with zooplankton
in the aquatic environment and its possible role in shaping the characteristics of a
cholera epidemic.
1.2.1 Importance of zooplankton
The association of plankton and Vibrio cholerae has been reported in aquatic
systems globally. V. cholerae blooms have been correlated with plankton abundance
and warm temperatures, whereby V. cholerae achieves greatest abundance during the
summer months, often attached to zooplankton (Venkateswaran et al., 1989; Tamplin
et al., 1990; Heidelberg, 2000). Laboratory studies (Huq et al., 1983, 1984) further
demonstrated that zooplankton contribute to the growth of V. cholerae. These studies
suggest that zooplankton provide a resource for V. cholerae during inter-epidemic and
epidemic initiating periods that may play a role in the ubiquitous occurrence of V.
cholerae in the aquatic environment.
The chitinous exoskeleton of zooplankton has been reported to provide a
protective environment for V. cholerae, contributing to transmission of cholera when
ingested by humans. Research on V. cholerae exposed to low temperatures in the
presence of chitin indicates that attachment to zooplankton increased survivorship
(Amako et al., 1987). Attachment to chitin particles has provided protection for V.
cholerae O1 from acidic environments with chitin acting as a buffer (Nalin, 1979).
Research involving human subjects showed that adequate dosages of V. cholerae O1
did not stimulate disease symptoms unless administered with a buffer or with food
(Levine et al., 1981). Thus, attachment to zooplankton is hypothesized to enhance the
4
probability of disease initiation by increasing the chance of survival past the acidic
human gastric barrier (Nalin, 1979).
An advantage of epibiotic organisms, such as V. cholerae, on biotic substrates,
is their proximity to available nutrients. V. cholerae that live on highly mobile
zooplankton are less likely to be nutrient limited than "free-living" or planktonic
forms of organisms in the environment. Zooplankton hosts have their own nutrient
requirements, and provide a regular nutrient source for V. cholerae via exudates,
creating an environment suitable for growth and colonization (Wahl, 1989).
Furthermore, nutrients accumulate at solid-liquid interfaces (Marshall, 1976), making
them more accessible to V. cholerae that live on host organisms than those that occur
unattached as planktonic cells. During periods when readily available nutrients are
limited for both host and bacterium, chitin can act as a sole source of C and N for
vibrios since vibrios posses a chitinase (Kaneko and Colwell, 1975; West and
Colwell, 1984), breaking down chitin into its constituents, fructose-6-P, acetate, and
NH3.
Attachment to plankton may also affect osmolarity with important
consequences for survival of V. cholerae. Despite an unequivocal requirement for
sodium (Na+) and optimal growth stimulated by conditions typical of an estuarine
habitat (Cavari and Colwell, 1981; Singleton et al., 1982a,b), V. cholerae is found in
aquatic environments ranging from freshwater to river water. Colwell (1984)
suggested that V. cholerae can sequester Na+ in the human intestinal environment
and similarly acquire Na+ when associated with aquatic metazoans.
It has been suggested that a function of cholera toxin (CT) may be
osmoregulation. Once in the human intestines, environmental signals (i.e., a change
in osmolarity) can promote a cascade that stimulates the up- regulation of virulence
factors (DiRita et al., 1992; Häse and Mekalanos, 1999). The sodium-sensitive
5
flagellar motor of V. cholerae is driven by sodium motive forces, and any decrease in
flagellar rotation, i.e. contact with the high media viscosity of the epithelial lining or a
change in osmolarity, increases expression of the cholera toxin gene (ctxab) regulated
by a series of transcriptional activators (Häse and Mekalanos, 1999). Cholera toxin,
once acting on and internalized by the epithelial cells of the intestines, stimulates
intestinal secretions of electrolytes by blocking the uptake of Na+ (Field et al., 1972),
causing a build up of Na+ in the intestinal space. The subsequent increase of
electrolytes in the intestines induces the release of fluids from cells and consequently
the diarrhea that characterizes cholera.
The broad aquatic distribution of V. cholerae suggests that these mechanisms,
when associated with epithelial cells of aquatic metazoans, may act to assist in its
survival during periods of low sodium concentrations in the aquatic environment.
The vibrio-plankton relationship may help V. cholerae survive across a wide range of
salinities and periods of rapid fluctuations, and may possibly benefit plankton by
playing a role in osmoregulation.
Although the association of V. cholerae with various plankton species has
been reported, the relationship between V. cholerae and copepods may be especially
important. Not only are copepods the predominant macroplankton taxon in most
estuaries (Herman et al., 1968; Conover, 1956), but there is also a significant
presence of V. cholerae cells in size fractions of filtered water where copepods are
most numerous (Huq et al., 1984; Lipp et al., 2003; Louis et al., 2003). Attachment
of V. cholerae in and on copepods may be an essential component in the initiation of
epidemics, as large numbers of copepods are frequently present during the bimodal
cholera peaks, as observed in the Chesapeake Bay (Heidelberg et al., 2002; Louis et
al., 2003) and the Bay of Bengal (Cockburn and Cassanos, 1960; Oppenheimer et al.,
1978; Glass et al., 1982; Lobitz et al., 2000). Furthermore, V. cholerae has been
reported attached to single calanoid copepods in concentrations that can serve as
6
infectious doses (Huq et al., 1983). Thus, copepods may prove important in
facilitating transmission and causing disease, since cholera is dose-dependent, with
ca. 104-106 cells being required for infection, depending on the health of the
individual (Cash et al., 1974).
1.2.2 Epidemiology and Molecular Biology of V. cholerae O1 El Tor and O139 Bengal.
V. cholerae comprises a diverse group of genotypes. There are over 206
serogroups, two of which, serogroups O1 and O139, are known to cause epidemic
cholera (Faruque et al., 1998). With regard to clinical presentation and general modes
of transmission, serogroup O139 does not differ from O1 (Morris et al., 1995). But
the shifting predominance of V. cholerae O1 El Tor and O139 Bengal as the etiologic
agent of cholera suggests that aquatic populations are dynamic, a factor that this
research explores.
Historically, the V. cholerae O1 serogroup has been shown to be the causative
agent of cholera (Pacini, 1854; Koch, 1884; Pollitzer, 1959). The "Classical" biotype
is responsible for at least the fifth and sixth pandemics, whereas V. cholerae O1 El
Tor biotype, which originated in Indonesia, was isolated and described as the
etiologic agent of the seventh pandemic. Recently, it has been suggested that we are
entering the eighth pandemic, with the emergence of the Bengal biotype, serogroup
O139.
V. cholerae O139 was initially isolated in Madras, India in 1992 (Ramamurthy
et al., 1993). V. cholerae O139 likely derived from V. cholerae O1 El Tor as a clonal
lineage, with the exception of the deletion of O1 specific DNA and the insertion of V.
cholerae non-O1 specific DNA (Bik et al., 1995). This genetic recombination
appears to give V. cholerae O139 the ability to cause cholera outbreaks (Islam et al.,
7
1993). V. cholerae O139 expresses a thin polysaccharide capsule specific to V.
cholerae non-O1 types that may thwart human immunity, giving O139 a possible
advantage, compared to O1, as the etiologic agent of cholera (Weintraub et al., 1994).
Although polysaccharide layers protect many bacteria against leukocyte phagocytosis
(Weintraub et al., 1994), the layer of polysaccharides surrounding V. cholerae O139
cells differs enough that it rarely contributes to establishment of septicaemic infection
(Albert et al., 1999).
In Bangladesh, the shift from cholera epidemics caused by V. cholerae O1 to
those caused by V. cholerae O139 is thought to be a result of the inefficient protection
of immunity acquired from V. cholerae O1 infections and the pathogenic properties
of V. cholerae O139 (Morris et al., 1994; Nair et al., 1994). Most adults in endemic
areas have V. cholerae O1 antibodies and are thus partially immune, while children
are traditionally the group most susceptible to V. cholerae O1 infection (Glass et al.,
1982; Cholera Working Group, ICDDR,B, 1993). The Cholera Working Group,
International Centre for Diarrhoeal Disease Research, Bangladesh (1993) showed,
however, that neither adults nor children had immunity to V. cholerae O139,
increasing the number of susceptibles to include adults. In fact, 74% of patients
during the initial wave of cholera caused by V. cholerae O139 in Bangladesh were
greater than 15 years of age (Cholera Working Group, ICDDR,B, 1993). Increased
proportions of susceptibles in Bangladeshi populations facilitated the emergence and
rapid spread, replacing both V. cholerae O1 Classical and El Tor, largely in southern
coastal regions and northeastern districts. In northwestern districts, however, both V.
cholerae O1 and O139 were detected (Siddique et al., 1996). Spread of V. cholerae
O139 varied seasonally by location, coinciding with the dry season in coastal areas
and the wet season in the northern areas. Siddique et al. (1996) detected substantial
differences in V. cholerae redistribution, appearing nearly two years after the initial
spread of serogroup O139 in Bangladesh. In coastal regions V. cholerae O1 El Tor
8
re-emerged and coexisted with O139 but a new clone of V. cholerae O1 El Tor
replaced O139 in the northern districts (Siddique et al., 1996). Therefore, conditions,
i.e., temperature, salinity, biotic interactions, experienced by V. cholerae O1 and
O139 in the aquatic environment, combined with immunity and possible coinfections
occurring in humans, may influence emergence and resurgence by altering regional
persistence of clones, genetic reassortment, abundance, and pathogenicity.
Scientists have indicated molecular changes associated with the annual
fluctuations in the populations of V. cholerae O1 and O139 in Bangladesh (Faruque
1997a, 1997b, 2000; Basu et al., 2000). Since the initial emergence of V. cholerae
O139, a significant amount of genetic reassortment has occurred in O139 populations,
and to a lesser degree in the O1 populations (Faruque et al., 2003). Early studies
indicated that O139 strains were closely related to O1 El Tor strains and the initial
O139 strain emerged from serotype-specific genetic changes in an ancestral El Tor
strain (Nair et al., 1994; Bik et al., 1995). However, since the initial spread of V.
cholerae O139, rapid genetic changes have resulted in the origination of new clones
(Albert et al., 1997; Faruque et al., 1999, 2000). Initial appearance of V. cholerae
O139 was caused by strains from two different ribotypes, BI and BII. Since 1992, at
least seven ribotypes have been documented (Faruque et al., 1999, 2000).
Past and recent V. cholerae O139 strains also contain different copies of CTX
prophage that carries the cholera toxin gene. Strains isolated during 1992-1993 had
the El Tor type CTX prophage (CTXET) and variants associated with epidemics since
contain CTXET, as well as a new type of CTX prophage, referred to as the Calcutta
type (CTXcal) (Faruque et al., 2003). Clonal differences, recent susceptibility to
antibiotics, and additional cholera toxin (CTX) prophages indicate that V. cholerae
O139 continues to evolve.
9
In addition, Faruque et al. (1997b) showed differences in genes for conserved
rRNA, cholera toxin, and zonula occludens toxin between V. cholerae O1 El Tor
strains preceding and following the 1992-1993 epidemic of V. cholerae O139. The
newly emerged V. cholerae O1 El Tor strain proceeded to replace O139 in northern
Bangladesh. It is unclear what is driving these genetic reassortments. However,
Faruque and his colleagues suggest that interactions in the aquatic environment
conferring mechanisms of survival may be factors in the changing genotypes of
epidemic cholera (Faruque et al.,1997a,b, 2003).
Some scientists have interpreted the genetic variation within the O139
genotype as attributed to multiple origins (Faruque et al., 2000), however, others
suggest that the substantial genetic diversity reflects "founder flush" (Garg et al.,
2003). Founder flush occurs when similar genotypes descendent from the founder
population but not identical to the founder produce a sufficient amount of offspring
that become established in the population during times of population expansion (Garg
et al., 2003). Thus, genetic diversity is not necessarily produced by separate origins
but can be created by the variation in genotypes originating from the founder. The
subsequent annual changes in genotypes within the two serogroups may demonstrate
that population dynamics are correlated with the severity of an epidemic being
affected by selection pressures from unidentified ecological factors, as well as similar
pressures due to the immunity of the human host population.
1.2.3 Interactions in the aquatic environment influencing V. cholerae distribution
Genotypic replacement of one epidemic variant by another appears to be a
critical component in the defining character of cholera pandemics, i.e., V. cholerae
O1 Classical replaced by O1 El Tor and possibly V. cholerae O1 El Tor replaced by
O139 Bengal. Furthermore, the shifting predominance and coexistence of V.
10
cholerae O1 and O139 in both the human and aquatic reservoir suggests that
dynamics in the aquatic habitat may affect the relative importance of a specific
biotype in cholera infection. Nevertheless, the question of how ecological dynamics
of these variants in the aquatic environment have an impact on cholera epidemiology
remains unanswered. Like any organism, V. cholerae genotypes experience variation
in habitat suitability that could influence population survival and distribution.
Dynamic biotic interactions, some of which are already recognized to influence
survival and persistence of V.cholerae in the aquatic environment (Nalin, 1979;
Amako et al., 1987; Dawson et al., 1981; Huq et al., 1983, 1984; Islam, 1994;
Carman, 1994; Tamplin, 1990), perhaps contribute to shifts in epidemic agents.
Small shifts in genotype may go unrecognized until the character of an epidemic
changes significantly, as was the case in the emergence of V. cholerae O139. Adults
considered immune to cholera infections were susceptible to the newly emerged V.
cholerae O139. In particular, biotic interactions (vibrio-vibrio or vibrio-plankton)
that influence aquatic persistence and water to human transmission could contribute
strongly to shifts in the composition of genotypes.
Persistence of microbial species in dynamic aquatic systems suggests that
they must respond to shifts in environmental parameters through a wide variety of
genotypic and phenotypic mechanisms. Previous research on the ecology of V.
cholerae include examinations of the response of V. cholerae to varying salinities,
temperatures, and inter- and intra-species interactions (Amako et al., 1987; Singleton
et al., 1982; MacDonell et al., 1984). V. cholerae has shown tolerance to a wide
range of salinities and temperatures by its presence in fluctuating tidal, estuarine, and
riverine systems around the world, as well as in laboratory and field studies
(Singleton et al., 1982; Jiang and Fu, 2001; Louis et al., 2003). V. cholerae has also
shown a suite of physiological and biotic adaptations to adverse environmental
11
conditions, such as size reduction, metabolic rate increase, and attachment to
substrates (MacDonell et al., 1984; Dawson et al., 1981; Ostling et al., 1993).
Significant genotypic and phenotypic variation may exist in the ability of V.
cholerae to respond to the presence of shifting biotic interactions, such as inter- and
intra-species competition, fluctuating substrate availability, and predation. As already
mentioned, V. cholerae occurs in large numbers attached to zooplankton relative to
those in the water column (Huq et al., 1984; Heidelberg et al., 2000), however, not all
strains may be able to compete equally for space on all zooplankton species. The
epibiotic nature of V. cholerae also exposes these cells to fluctuations within the
zooplankton host environment. Of the Vibrio species that attach to and comprise the
zooplankton microhabitat, most are pathogenic for humans (Heidelberg et al., 2000),
suggesting that pathogenicity, i.e., selected properties of V. cholerae associated with
the epibiotic existence may contribute to pathogenicity in humans. Faruque et al.
(1998) suggested that the acquisition of the CTX genetic element provides a selective
advantage to epidemic forms of V. cholerae by facilitating selective enrichment in the
intestinal environment, conferring increased evolutionary fitness. If pathogenicity is
linked to association with zooplankton, whether passive or active, then colonization
and competition within this habitat could affect the character of an epidemic by
affecting the abundance of a particular genotype of V. cholerae and possibly the
evolution of clones.
Within the discourse of the ecology of V. cholerae and the association of V.
cholerae with zooplankton, it is often assumed implicitly that where V. cholerae is
present in the aquatic environment it has an even and constant distribution. But
12
zooplankton, an important vehicle of transmission of V. cholerae, like many other
aquatic organisms, are distributed in patches that change over space and time (Haury,
1977), and epibiotic bacteria that utilize zooplankton as a substrate are likely to be
affected by this variation. Theory suggests that organisms exposed to the stochastic
loss of local habitat patches will depend on their ability to colonize new patches in
order to persist (Slatkin, 1974; Roughgarden, 1977; Hanski, 1983; Neuhauser, 1998).
Some populations may experience local extinctions and the ability to disperse to new
patches will facilitate regional existence. Populations that have a greater affinity to
disperse and colonize new patches may have an advantage during periods of habitat
loss or competitive exclusion. V. cholerae may experience similar loss of habitat
when attached to molting copepods or thinning copepod patches. Differences between
genotypes of V. cholerae in their ability to disperse, colonize, and compete for
nutrients and space on zooplankton may lead to one genotype outcompeting another
for use of zooplankton resources, especially in coastal environments that are also
subject to fluctuations in temperature, salinity, and nutrient availability.
The use of the zooplankton substrate by pathogenic V. cholerae species raises
questions, explored in the research reported here: whether serogroups O1 and O139
differ in response to zooplankton species, and how such responses may contribute to
cycles of endemicity. Zooplankton as a resource and endemic cycles of V. cholerae
appear to be inextricably linked. Zooplankton are utilized by V. cholerae as habitat as
well as nutritional or protective resources, and they are simultaneously inadvertent
vehicles of human infection. Thus, interactions that influence the colonization ability
of various genotypes could affect the characteristics of an epidemic. If one genotype
13
of V. cholerae demonstrates a colonization rate more rapid and/or extensive than
others during epidemic-initiating periods when "empty patches" of newly emerged
zooplankton increase in numbers, then that genotype could have a numeric advantage
during transmission. Differences between epidemic variants in the degree of
colonization and resource utilization of zooplankton microhabitats should give insight
into the pattern of emergence and re-emergence of V. cholerae O1 and O139.
Variation in the strength of association with specific zooplankton species
could also influence transmission, spread, and seasonal patterns of cholera
occurrence. Plankton species vary in life histories and have seasonal cycles
themselves. They can be found in a number of habitats and are often designated by
their existence in one, i.e. benthic, demersal., or planktonic. They can brood their
eggs in sacs on the outside of their bodies or they can scatter them one by one.
Furthermore, most plankton species are highly influenced by a combination of
salinity and temperature tolerances and tidal movement, often limiting their
occurrence to certain regions, seasons, and years. Depending on species, the
distribution of metapopulations can be geographically extensive or very restricted,
and abundance can fluctuate greatly. Due to the seasonality of V. cholerae and its
affinity for plankton, it appears likely that V. cholerae dynamics are associated and
causally linked to dynamics of particular zooplankton species or a number of co-
occurring species.
1.3 Association of V. cholerae with CopepodsThough copepods have been reported as important to V. cholerae, only a few
studies have shown an association of V. cholerae with specific genera or species (Huq
14
et al., 1990; Tamplin et al., 1990). Several additional reports demonstrate plankton-V.
cholerae associations. These reports identify the plankton that are present in samples
by species, large taxonomic groupings, or size fractions (Table 1.1). However, the
association of plankton and V. cholerae was made on the composite and not on
specific species or groupings. Although, most studies present results of multiple
plankton species and not specific associations, investigations from different global
regions show that V. cholerae is consistently found in size fractions where copepods
are predominant (Heidelberg et al., 2002a; Lipp et al., 2003; Louis et al., 2004).
Furthermore, the zooplankton genera reported as associated with V. cholerae in
Bangladesh can be found worldwide with similar seasonal occurrences (Table 1.1),
particularly, Acartia.
Chesapeake Bay provides an example of zooplankton composition and
species-level differences that may influence vibrio dynamics. Copepods comprised
98% of zooplankton in an analysis for Chesapeake Bay (Herman et al., 1968), as well
as 95% in Long Island Sound (Conover, 1956), two estuarine ecosystems in areas of
historic cholera epidemics in the United States. Acartia tonsa and Eurytemora affinis
are two of the predominant copepod species in both estuaries, and these species occur
commonly in estuaries throughout the Northern Hemisphere.
15
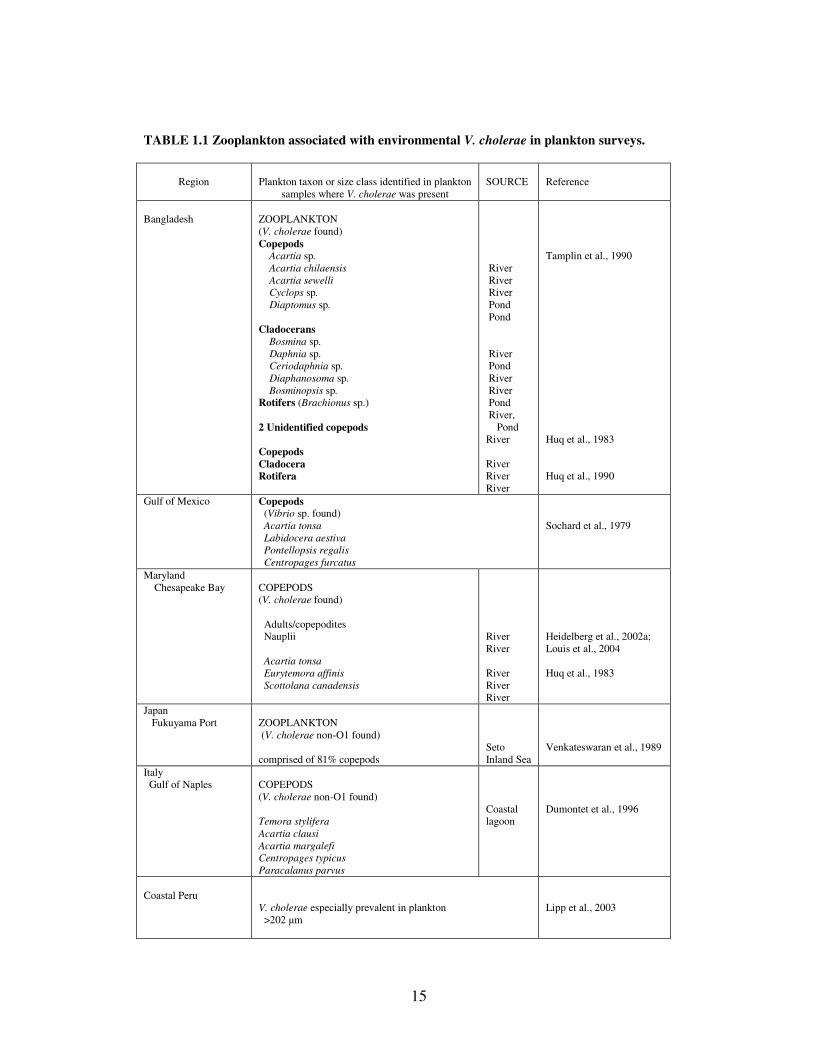
TABLE 1.1 Zooplankton associated with environmental V. cholerae in plankton surveys.
Region Plankton taxon or size class identified in plankton samples where V. cholerae was present
SOURCE Reference
Bangladesh ZOOPLANKTON(V. cholerae found)Copepods
Acartia sp.Acartia chilaensisAcartia sewelli
Cyclops sp. Diaptomus sp.
CladoceransBosmina sp.
Daphnia sp. Ceriodaphnia sp. Diaphanosoma sp. Bosminopsis sp.Rotifers (Brachionus sp.)
2 Unidentified copepods
CopepodsCladoceraRotifera
River River River Pond Pond
River Pond River River Pond River, PondRiver
RiverRiverRiver
Tamplin et al., 1990
Huq et al., 1983
Huq et al., 1990
Gulf of Mexico Copepods (Vibrio sp. found)
Acartia tonsa Labidocera aestiva Pontellopsis regalis Centropages furcatus
Sochard et al., 1979
Maryland Chesapeake Bay COPEPODS
(V. cholerae found)
Adults/copepodites Nauplii
Acartia tonsa Eurytemora affinis Scottolana canadensis
RiverRiver
RiverRiverRiver
Heidelberg et al., 2002a;Louis et al., 2004
Huq et al., 1983
Japan Fukuyama Port ZOOPLANKTON
(V. cholerae non-O1 found)
comprised of 81% copepodsSeto Inland Sea
Venkateswaran et al., 1989
Italy Gulf of Naples COPEPODS
(V. cholerae non-O1 found)
Temora styliferaAcartia clausiAcartia margalefiCentropages typicusParacalanus parvus
Coastallagoon
Dumontet et al., 1996
Coastal PeruV. cholerae especially prevalent in plankton >202 µm
Lipp et al., 2003
16
Differences in physical characters and life history distinguish them. Although A.
tonsa and E. affinis are both considered pelagic, calanoid copepods, E. affinis is also
known to be demersal (attaches to substrates such as rocks and pilings), whereas A.
tonsa is largely planktonic. Egg production is another feature that differentiates these
copepods. A. tonsa is a broadcast spawner, releasing eggs one at a time, essentially
“scattering” them, and E. affinis copepods brood their eggs in a exterior assemblage
(egg sac) near the anal pore.
Finally, these two species also differ in salinity distribution and seasonal
abundance, as reported for the Patuxent River of Chesapeake Bay (Heinle, 1969). A.
tonsa is continuously present in the Patuxent River, where it is the most abundant
copepod, comprising 55-60% of the total zooplankton and occurring at all salinities.
Population densities are commonly 1x10⁵-2x10⁵ individuals per m3 and sometimes
106 individuals per m3 during its peak (Heinle, 1969). E. affinis, however, is the
second most abundant copepod (37%); it occurs in a range of salinities but usually
dominates the lower salinity waters. Its population density is similar to that of A.
tonsa, but at times exceeds 3x10⁶ individuals per m3. Acartia makes up the largest
fraction in the warmer months, whereas Eurytemora increases in abundance during
the winter and occurs, commonly, until late spring. There is a seasonal shift in
dominance between Acartia and Eurytemora which results in a period of sympatry,
coinciding with a shift from the cooler, less saline months to warmer, more saline
months (Brownlee and Jacobs, 1987).
17
For V. cholerae dynamics, the significance of biological., ecological., and
seasonal differences among these and other zooplankton species remains virtually
unexplored.
1.4 Scope of the Present ResearchIn a "Special Feature" of the journal Ecology entitled Disease Ecology (1996),
several investigators illustrated the importance of applying ecological principles in
investigations of community dynamics influencing ecological and evolutionary
consequences of pathogens, emphasizing a multi-disciplinary approach to understand
disease transmission, vector production, emergence, and maintenance of disease foci.
Real (1996) proposed a set of questions upon which disease ecology has and should
focus to elucidate disease processes and disease management practices, asking: how
processes of populations account for patterns of disease emergence; what genetic
processes account for evolutionary patterns in resistance and virulence; does the
ecology of hosts, vectors, and pathogens enter into the design of immunization
programs; will diseases respond to global climate change.
This dissertation examines one of the questions put forth by disease ecologists
as fundamental in the field, namely: whether ecological and population dynamics can
account for a pattern of disease emergence. In applying this construct, the dynamics
within the zooplankton habitat were studied to obtain an understanding of why the
epidemic variants of V. cholerae, serogroups O1 and O139, fluctuate in a pattern of
infection in cholera endemic Bangladesh. The pattern of shifting prevalence between
V. cholerae serogroups O1 and O139 over the past decade has raised many questions
about whether their coexistence is a result of competition for resources or whether
18
they occupy completely separate niches. Microcosm experiments, modeled to
replicate environmental conditions of cholera endemic areas, were used to test
whether serogroups O1 and O139 utilize spatial and nutritional resources similarly as
a means of finding out whether they can occupy the same niche.
In Chapter Two, differences are reported between V. cholerae O1 and O139 in
their ability to colonize adult copepods, A. tonsa and E. affinis, as well as eggs and
nauplii of E. affinis. Similarities or differences in how the serogroups O1 and O139
utilize different copepod species should give perspective on possible niche
differences.
Chapter Three explores the question of whether the extent of resource
utilization, both colonization and nutrient acquisition, by V. cholerae O1 and O139 in
a copepod habitat may facilitate or inhibit coexistence. Sympatric colonization of
copepods by V. cholerae O1 and O139 and utilization of chitin by these serogroups
was examined to test the dynamics of V. cholerae O1 and O139 when co -occurring.
Coexistence and competitive interactions of V. cholerae O1 and O139 in ecological
environments are intriguing, as interactions between serogroups within their natural
aquatic habitat may help explain their role in epidemics of cholera.
Chapter Four discusses the implications of the copepod-V. cholerae
relationship based on results presented in experimental chapters, results of previous
V. cholerae investigations, spatiotemporal patterns of copepods, and ecological
theories of interactions in stochastic environments.
Chapter Five discusses the shift towards integrative studies addressing disease
science and possible directions for future research.
19
Chapter 2: Association of Vibrio cholerae serogroups O1 El Tor and O139 Bengal with the copepods Acartia tonsa and Eurytemora affinis
2.1 INTRODUCTIONVibrio cholerae O1 El Tor and O139 Bengal are recognized as causative
agents of cholera and are responsible for cholera epidemics in India and Bangladesh.
More than ten years ago, V. cholerae O139 Bengal was recognized as a newly
emerged epidemic variant when it replaced V. cholerae O1 El Tor for two successive
cholera seasons. It is not clear what factors contributed to the emergence of
serogroup O139 as an epidemic variant or its present coexistence with O1. However,
results from research provide strong evidence that horizontal transfer of genes among
environmental strains of V. cholerae was a mechanism for its origin (Bik et al., 1995;
Comstock et al., 1995). Since the emergence of V. cholerae O139 in the Gangetic
Delta region, both V. cholerae O1 and O139 have been the cause of cholera infections
with a regular seasonality but with temporal variation in the prevalence of the two
serogroups (Mukhopadhyay et al., 1996; Basu et al., 2000). The observed
fluctuations in the reported numbers of people infected by either V. cholerae O1 or
O139 may suggest differences in responses of the two serogroups to stochastic
aquatic habitats, resource utilization, immunity of susceptible human populations and
possibly in mechanisms of transmission.
Vibrios are found associated with various aquatic organisms, which serve as
microhabitats, ranging from algae to crustaceans. Simidu et al. (1985) showed that
different vibrios aggregate in microhabitats based on phenotype, suggesting that
20
habitat segregation among vibrios corresponds to temporal and spatial changes in the
abiotic and biotic aquatic environments. V. cholerae has been reported attached to or
associated with phytoplankton, zooplankton, and other crustaceans. Survey data of
Bangladeshi aquatic habitats reveal that V. cholerae association with phytoplankton
does not demonstrate the same corresponding bacterial blooms as it shows when
associated with zooplankton just prior to cholera epidemics (R.R. Colwell, personal
communication). Furthermore, zooplankton have been demonstrated as particularly
important habitats for epidemic forms of V. cholerae. Zooplankton have a protective
effect for attached cholera vibrios, especially during inter-epidemic and epidemic
periods (Nalin, 1979; Dawson et al., 1981; Huq et al., 1983, 1984; Amako et al.,
1987; Carman, 1994). Furthermore, Colwell and Huq (1994) proposed transmission
of the cholera vibrios via zooplankton to be significant in cholera epidemics in
developing countries. Copepods, in particular, have been reported to be important in
this regard because they are the most numerous and widely dispersed zooplankton
with which the incidence and distribution of V. cholerae have been found associated
(Huq et al., 1983, 1984; Tamplin et al., 1990). Thus, the seasonal and regional
fluctuations of copepod populations will have an impact on attached V. cholerae
populations.
Attachment to an organic substrate like the copepod also provides a bacterial
cell the advantage of nutrients from the copepod itself (Marshall, 1976; Dawson et al.,
1981). In fact, V. cholerae, like most vibrios, is both chitinolytic and proteolytic,
allowing it to break down and utilize constituents of chitin and zooplankton egg
protein as nutrient resources (Kaneko and Colwell, 1975; Nalin, 1976; Bassler et al.,
21
1991; Guthrie and Cofie, 1991; Halpern et al., 2003; Meibom et al., 2004). During
plankton blooms, the use of such enzymes may be unnecessary as copepods produce
nutrient plumes by "sloppy-feeding," exuding high and low molecular weight
molecules, and evacuating fecal pellets (Moller and Nielsen, 2001). The extent of
nutrients released by copepod blooms may be largely responsible for the increased
numbers of V. cholerae during and after blooms. Some models suggest that increased
aquatic populations of V. cholerae are integral in transmission of cholera and,
ultimately, in cholera outbreaks in areas of cholera endemicity (Colwell and Huq,
1994).
Results of previous investigations studying the colonization, interactions, and
organization of zooplankton epibiont communities suggest that there is a premium on
efficient location of suitable substrates, especially when such substrates are
periodically renewed and sometimes occur in widely dispersed patches (Threlkeld
and Willey, 1993). Areas on the copepod or within copepod patches that provide
optimal growth conditions by proximity to nutrients may be limited, possibly creating
competitive interactions between V. cholerae variants. Thus, differences in dispersal
and colonizing abilities may affect relative inter-strain abundances, persistence during
inter-epidemic periods, and transmission of cholera.
Publications that compare V. cholerae O1 and O139 largely emphasize
molecular distinctions (Faruque et al., 1994; Johnson et al., 1994; Khetawat et al.,
1998; Dziejman et al., 2002), and surveys of their distributions (Huq et al., 1995,
Siddique et al., 1996; Ali et al., 2001), rather than explore the ways in which these
genotypes may differ in their resource use. Different copepod species or life stages

22
may not provide equally suitable resources for V. cholerae, since space, molt
frequency, nutrients, and patch distribution can differ greatly between species and life
stages (Carman and Dobbs, 1997). It is unknown whether V. cholerae colonizes
copepod species or copepod life stages in similar concentrations, or if one serogroup
is better than the other at colonizing these substrates.
The objective of this study was to analyze the interaction of V. cholerae
epidemic serogroups, O1 and O139, with two copepod species that represent different
life histories as well as to explore any differences in affinity to copepod life stages in
order to elucidate resource use of V. cholerae O1 and O139. Microcosms were used
to compare the colonization of two species copepods, Acartia tonsa and Eurytemora
affinis by V. cholerae O1 and O139. The copepods included in the study are
predominant in the Chesapeake Bay system, have been associated with V. cholerae
cell attachment, and may have been a significant factor in historic cholera epidemics
in the Mid-Atlantic region of the United States.
2.2 MATERIALS AND METHODS
2.2.1 Effect of Copepod Species and Serotype on ColonizationMicrocosms contained between 15-40 adult copepods of either A. tonsa
collected from Baltimore Harbor or E. affinis collected from the Patuxent River, a
tributary of the Chesapeake Bay. The copepods were cultured as single species in
containers to acclimate them to the experimental conditions. After washing once with
phosphate buffered saline, the harvested copepods were placed into 200 ml tall form
berzelius beakers (Kimble-Kontes, Inc., New Jersey) containing 100 ml of filter
23
sterilized river water collected during the spring from the Rhode River, Maryland,
which served as the microecosystem. The river water was filtered in a step series
filtration, employing 10 µm, 5 µm, 1 µm filters (Filterite Inc., Timonium, MD), and
0.22 µm poretic polycarbonate filters (OSMONIC Inc., Livermore, CA) and served as
the suspension medium for the microcosms, adjusted to a salinity of 15‰ and pH 8.5
and (Huq et al., 1994).
Prior to inoculation, the two strains of V. cholerae were incubated
individually at 37 ºC, with shaking, for 6 hours in 20 ml of APW (1% w/v Peptone,
Difco, 1% w/v NaCl, pH 8.5). Both serogroups grew to ca. 107 cells per ml,
determined by direct fluorescent counts (Hasan et al., 1994). The cells were
harvested by centrifugation, washed twice, resuspended in filter sterilized river water,
and inoculated into microcosms.
For each copepod species, microcosms (n=13) were inoculated with V.
cholerae O1 El Tor strain C6709 and the same number with V. cholerae O139 Bengal
strain MO10 to a final concentration of ca. 5 x 10⁴ cells per ml. For each copepod
species, additional microcosms (n=13) were used as controls, containing copepods
without addition of V. cholerae to detect V. cholerae present on cultured copepods.
Microcosms were incubated at 25 ºC for 24 h. At 24 h, copepods from each
microcosm were collected by filtration, using a 153µm sieve. The copepods were
rinsed to disassociate loosely attached bacteria. All samples were prepared for direct
viable counts (DVC) described elsewhere (Hasan et al., 1994; Chowdhury et al.,
1995) and fixed with 5% formalin.
24
The number of copepods in each sample was counted and the copepod surface
area estimated for each microcosm. Surface area was determined by measuring the
length and width of a subsample of each copepod species (n=50, per species) using
the Scion Imaging Program (NIH, Bethesda, MD). To estimate the surface area, the
cephalothorax was modeled as a right angle cylinder (π√(r2 + l2)). After the copepods
in each microcosm had been counted, they were sonicated for 120 seconds and
homogenized in a tissue grinder. Direct fluorescent antibody reagent (New Horizons,
Columbia, MD) specific for O1 and O139 was added to each sample, permitting
enumeration of V. cholerae O1 and O139 cells (both non-culturable and culturable
cells), using an epifluorescent microscope (Leitz Dialux 20, Germany).
Microcosm experiments were employed in a Randomized Complete Block
Design (RCBD) with a 2x2 factorial treatment structure. A two-way ANOVA
(Mixed Model, SAS Institute, 8.0) was used to determine differences, if any, in the
number of V. cholerae cells per mm2 that were associated with A. tonsa and E. affinis.
Multiple replicates for each copepod-serogroup treatment (including the control) were
run on different days to obtain an overall total of thirteen replicate microcosms per
treatment. Replicates were pooled because there was no significant covariate effect
of day in the Mixed Model ANOVA. Day and day x treatments were considered
random effects in the mixed model. Further analysis (two–way ANOVA) was
performed to determine whether there were differences in total surface area
contributing to any differences between copepods. Neither V. cholerae O1 nor O139
was present in any of the controls and thus the controls were not included in any of
the analyses. Cell counts were log-transformed to satisfy homoscedacity.
25
2.2.2 Colonization of E. affinis Life Stage
Time Series: V. cholerae O1 and O139 colonization of adults and eggs
V. cholerae O1 El Tor strain C6709 and O139 Bengal strain MO10 were
introduced into microcosms containing E. affinis adults. E. affinis copepods were
collected from the Patuxent River, Maryland, a tributary of the Chesapeake Bay.
They were cultured in flasks from which they were collected, washed once, and
placed into the microcosms (as described above), preceding bacterial inoculation.
Water, collected in the spring from the Rhode River, a tributary of the Chesapeake
Bay, Maryland, was filtered though 10 µm, 5 µm, 1 µm filters (Filterite Inc,
Timonium, MD), and finally a 0.22 µm polycarbonate filter (OSMONICS,
Livermore, CA) and served as the suspension medium for the microcosms.
Microcosms consisted initially of ca.50-100 adult copepods of E. affinis collected.
Copepods distributed to microcosms were a mixture of males and both ovigerous and
non-ovigerous females. Initial counts of eggs ranged from between 30-150 per
microcosm.
V. cholerae O1 and O139 were incubated at 37ºC, with shaking at 150 rpm,
for 6 h in 20 ml of APW (1% w/v Peptone, 1% w/v NaCl, pH 8.5). Both serogroups
grew to ca. 107 cells per ml, determined by direct fluorescent counts (Hasan et al.,
1994). The cells were harvested, washed twice, resuspended in filter sterilized water,
and inoculated into microcosms containing copepods at a final concentration of ca. 5
x 104 cells per ml. Microcosms were run without the addition of bacteria to detect
any inherent V. cholerae O1 or O139 present in or on cultured copepods that may

26
contribute to differences in the results. All microcosms were adjusted to a salinity of
15‰ and pH 8.5 and incubated at 25ºC, conditions shown to be representative of
endemic and epidemic conditions (Huq et al., 1994). Microcosms were sampled at 0,
24, and 48 h, such that each microcosm was sampled only once, representing a single
independent replicate. There were five independent microcosms for each serogroup +
five microcosms controlling for inherent V. cholerae at each time point (0, 24, and
48). Neither V. cholerae O1 nor O139 was present in any of the controls and thus the
controls were not included in the analyses.
Adults and eggs were collected from each microcosm by filtering the copepod
fractions with a 63 µm sieve. Copepods were rinsed with filter sterilized water to
disassociate loosely attached bacteria. All samples were prepared for direct viable
counts (DVC) obtained following the method described in detail elsewhere (Hasan et
al., 1994; Chowdhury et al., 1995) and then fixed with 5% formalin.
Each life stage was separated out manually. Adults and eggs were analyzed as
independent components. The number of adult copepods and eggs were counted.
Once counted, each replicate was sonicated for 120 seconds and homogenized in a
tissue grinder. Direct fluorescent antibody reagent (New Horizons, Columbia, MD),
specific for O1 and O139, was added to the samples for counting. V. cholerae O1
and O139 cells (both non-culturable and culturable cells, combined) were enumerated
by epifluorescent microscopy using a Leitz Dialux microscope (Wetzlar, Germany).
Any nauplii present were not included in this analysis.
Two-way ANOVA (General Linear Model, SAS 8.0) was used to analyze the
effect of time on the attachment of V. cholerae O1 and O139 on adults and eggs.
27
Adults and eggs, however, were analyzed separately to avoid violating the
assumptions of independence of the ANOVA model. Cell counts were log-
transformed to satisfy homocesdascity
Effect of nauplii on colonization of adults and eggs by V. cholerae O1 and O139
Analysis of the effect of nauplii on the association of V. cholerae O1 and
O139 with adults and eggs over 24 h was performed. Microcosms were prepared and
analyzed as above, where each microcosm contained between 15-40 adults, including
males as well as ovigerous and non-ovigerous females. The presence of nauplii was a
function of their hatching out during the experiment and they were not produced in all
microcosms. Replicates were employed for each serogroup treatment.
Adults, nauplii, and eggs were collected from each microcosm by filtering the
copepod fractions with a 63µm sieve. Each life stage was separated out manually and
each was analyzed as an independent component. The number of adult copepods and
eggs were counted. Nauplii were treated as a qualitative measure (present/absent).
Microcosms were set-up in a RCBD with a 2x2 factorial treatment structure to
examine the effect of nauplii on the colonization of adults and eggs by V. cholerae O1
and O139. Experimental runs were performed on different days and combined using
Mixed Model ANOVA statistics (SAS 8.0). Replicates employed were different
between days, three for the run on the first day and four on the second. Day and day x
serogroup treatment were considered random effects. There was no significant
covariate effect of day so results were combined from two experimental runs (run on
separate days), forming an overall total of seven replicate microcosms for adults and
28
eggs. Adults and eggs were analyzed separately to avoid violating the assumptions of
the ANOVA model. Cell counts were log-transformed to satisfy homoscedascity.
Neither V. cholerae O1 nor O139 was present in any of the controls and thus were not
included in the analyses.
Colonization of adults and nauplii by V. cholerae O1
Following the methods described above, V. cholerae O1 El Tor was added to
microcosms containing either 10-20 E. affinis adults or 20-45 nauplii (all stages, N1-
N6) to obtain a quantitative measure of the attachment of V. cholerae to adults and
nauplii as separate entities. As above, all microcosms were inoculated with V.
cholerae O1 to a final concentration of ca. 5 x 10⁴ cells per ml. All microcosms were
adjusted to a salinity of 15‰ and pH 8.5, incubated at 25ºC, and sampled after 24 h,
each representing a single independent replicate. Again, controls consisted of
microcosms without addition of V. cholerae bacteria. Replicates were run, two for
the first two runs of the experiment and four for the third, for each treatment.
Experimental runs were performed on different days.
As described above, total cells attached per microcosm were analyzed using a
one-way ANOVA (Mixed Model ANOVA, SAS Institute 8.0) to measure the
attachment of V. cholerae O1 to adults and nauplii. Neither V. cholerae O1 was
present in any of the controls and thus the controls were not included in the analyses.
Since experimental runs were performed on different days, treatments were combined
where day and day x copepod life stage were considered random effects in the
ANOVA. There was no significant covariate effect of day. Thus, replicates were
29
combined from the three experiments, forming an overall total of eight replicate
microcosms for adults and nauplii. Cell counts were log-transformed to satisfy
homoscedascity.
2.3 RESULTS
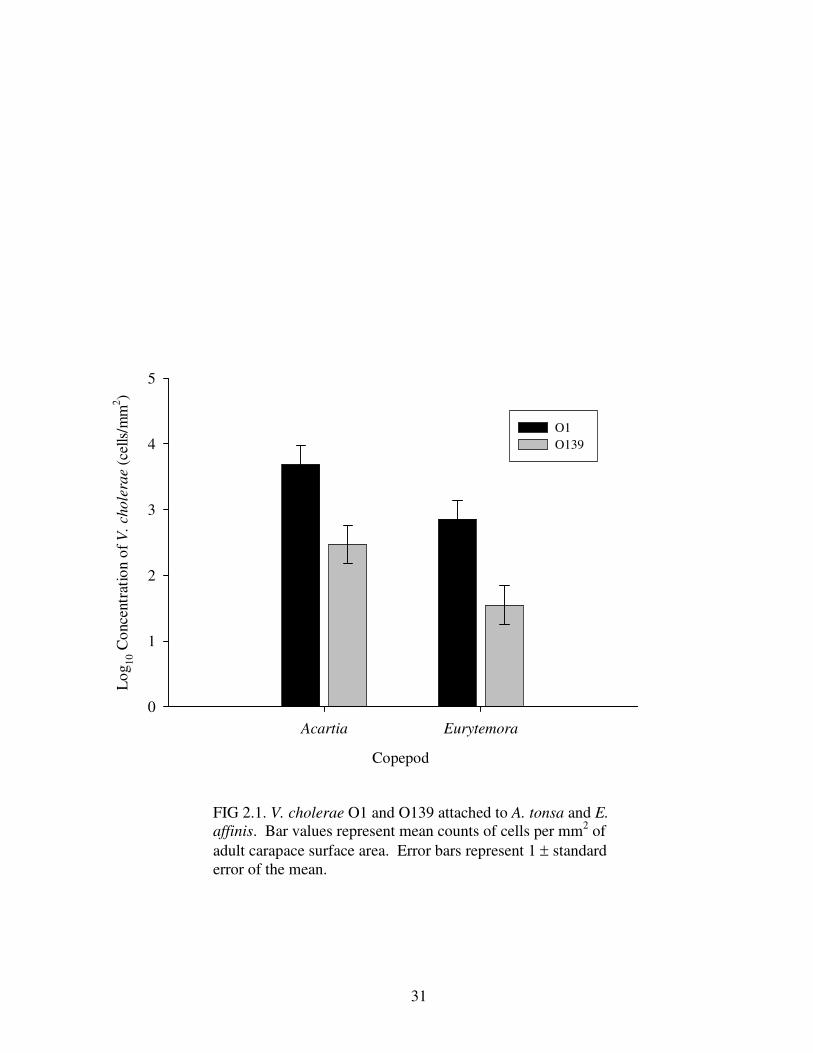
2.3.1 Effect of Copepod Species and Serogroup on ColonizationAfter incubation for 24 h, results revealed a significant difference in
attachment of V. cholerae to copepod species and a significant difference in
colonization by strain (Table 2.1). More V. cholerae colonized A. tonsa than E.
affinis per mm2 of surface area (Fig. 2.1). Furthermore, V. cholerae O1 attached to
both copepod species in significantly larger numbers than O139 per mm2 of surface
area (Table 2.1), greater than an order of magnitude difference between the two
strains (Fig. 2.1). There was no significant difference in the amount of copepod
surface area present between V. cholerae O1 and O139 m icrocosms that would
contribute to differences in cells attached per mm2 (Table 2.2.).
30
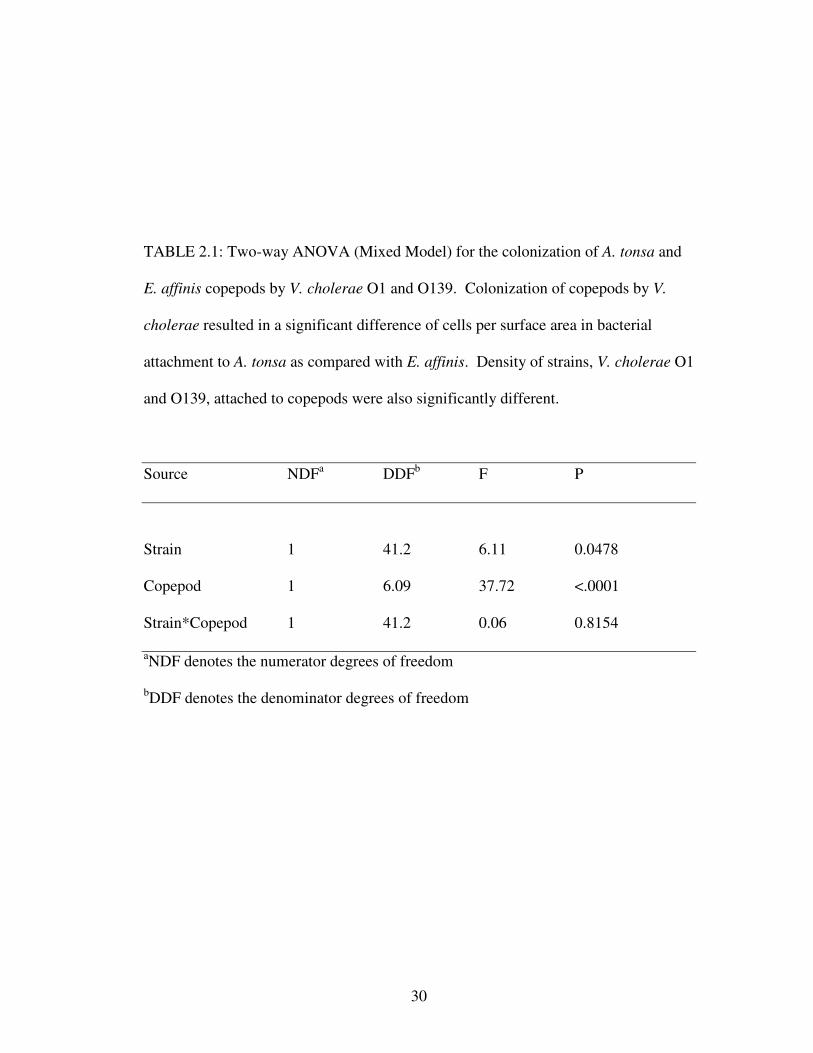
TABLE 2.1: Two-way ANOVA (Mixed Model) for the colonization of A. tonsa and
E. affinis copepods by V. cholerae O1 and O139. Colonization of copepods by V.
cholerae resulted in a significant difference of cells per surface area in bacterial
attachment to A. tonsa as compared with E. affinis. Density of strains, V. cholerae O1
and O139, attached to copepods were also significantly different.
Source NDFa DDFb F P
Strain 1 41.2 6.11 0.0478
Copepod 1 6.09 37.72 <.0001
Strain*Copepod 1 41.2 0.06 0.8154
aNDF denotes the numerator degrees of freedom
bDDF denotes the denominator degrees of freedom
31
Copepod
Acartia Eurytemora
Log
10 C
once
ntra
tion
of V
. cho
lera
e (c
ells
/mm
2 )
0
1
2
3
4
5
O1 O139
FIG 2.1. V. cholerae O1 and O139 attached to A. tonsa and E. affinis. Bar values represent mean counts of cells per mm2 of adult carapace surface area. Error bars represent 1 ± standard error of the mean.
32
A significant difference in total surface area between A. tonsa and E. affinis,
however, may account for the difference reported in attachment per mm2 (Table 2.2),
as there was no significant difference when re-analyzing attachment to A. tonsa and
E. affinis using total cells attached as the dependent variable (one-way ANOVA;
Table 2.3 and Table 2.4). Significantly greater surface area of E. affinis (Fig. 2.2) and
a non significant difference in total cells attached to both E. affinis and A. tonsa
present in microcosms revealed a lower concentration of cells attached per mm2 to E.
affinis. V. cholerae O1 and O139 were analyzed separately due to differences in
population variances between the two serogroups.
There were no significant copepod by species interactions in any of the
statistical models, suggesting that copepod type did not significantly affect
colonization differences between V. cholerae O1 and O139.
33
TABLE 2.2: Two-way ANOVA (Mixed Model) for the difference in total surface
area between A. tonsa and E. affinis copepods by V. cholerae O1 and O139. A
significant difference in total surface area occurred between A. tonsa and E. affinis
copepods. Strains, V. cholerae O1 and O139, did not differ by surface area.
Source NDFa DDFb F P
Strain 1 2.63 0.26 0.6502
Copepod 1 3.18 32.75 0.0090
Strain*Copepod 1 38.5 1.86 0.1800
aNDF denotes the numerator degrees of freedom
bDDF denotes the denominator degrees of freedom
34
Copepod
Acartia Eurytemora
Tot
al S
urfa
ce A
rea
of A
dult
Car
apac
e (m
m2 /m
icro
cosm
)
0.0
0.2
0.4
0.6
0.8
1.0
1.2
1.4
1.6
1.8
FIG 2.2. Difference in total surface area per microcosm between A. tonsa and E. affinis. Acartia= A. tonsa. Eurytemora= E. affinis. E. affinis copepods showed significantly greater total surface area compared to A. tonsa. Error bars represent ± 1 standard error of the mean. MeanAcartia, n=26 and MeanEurytemora, n=22. Difference in sample number between Acartia and Eurytemora represent missing values.
35
TABLE 2.3: One-way ANOVA (Mixed Model) for the colonization of A. tonsa and
E. affinis copepods by V. cholerae O1. Colonization of copepods by V. cholerae O1,
measured by total cells attached, was not significantly different between A. tonsa and
E. affinis.
Source NDF DDF F P
Copepod 1 5.81 4.20 0.0877
TABLE 2.4: One-way ANOVA (Mixed Model) for the colonization of A. tonsa and
E. affinis copepods by V. cholerae O139. Colonization of copepods by V. cholerae
O139, measured by total cells attached, was not significantly different between A.
tonsa and E. affinis.
Source NDF DDF F P
Copepod 1 6.28 2.99 0.1326

36
2.3.2 Colonization of E. affinis Adults, Eggs, Nauplii
Time Series: V. cholerae O1 and O139 colonization of adults and eggs
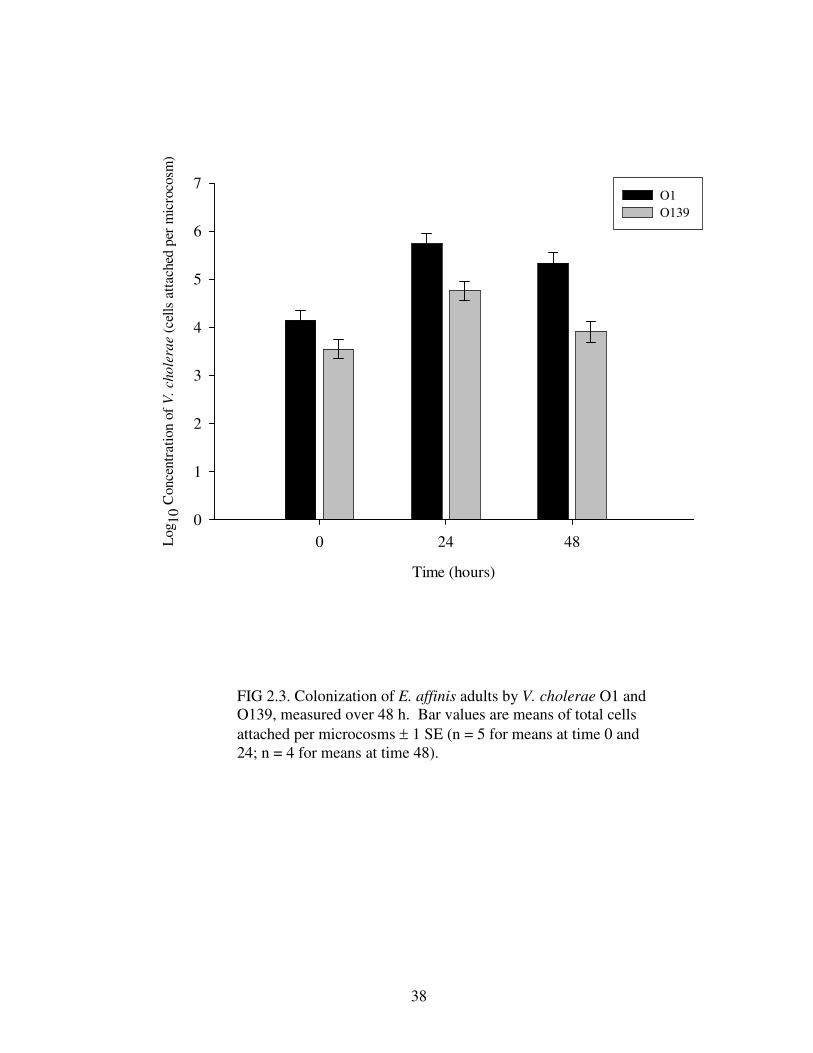
Time series data showed significant differences between cell counts of
attached V. cholerae O1 and O139 over 48 h to E. affinis adults (Table 2.5), revealing
more V. cholerae O1 cells attached than O139 (Fig 2.3). Colonization of V. cholerae
O1 and O139 to adult E. affinis copepods, although different in abundance, increased
by over an order of magnitude within the first 24 h of incubation and remained at the
same cell counts after another 24 h (Fig 2.3). Attachment to eggs by V. cholerae
showed a significant difference between strains but not between time periods (Table
2.7), whereby V. cholerae O1 attaches in greater numbers than O139 over 48 h (Fig
2.5).

37
TABLE 2.5: Two-way ANOVA (GLM) for colonization of E. affinis adults by V.
cholerae O1 and O139 over 48 h.
Source dfc MSd Fe Pf
Straina 1 6.98294767 35.01 <.0001
Timeb 2 4.93140613 24.73 <.0001
Time*Strain 2 0.38142554 1.91 0.1715
a V. cholerae O1 or O139, attached to copepods.
b Time = 0, 24, 48 h of incubation. Actual time points were equal to t + 1 hour.
c df = degrees of freedom
d MS = mean square error or the mean squared deviation from the mean
e F statistic= test of the equality of the means, a one-tailed variance ratio of the groups MS/error MS
f P = probability of rejecting the null hypothesis at 0.05
38
Time (hours)
0 24 48Log
10 C
once
ntra
tion
of V
. cho
lera
e (c
ells
att
ache
d pe
r m
icro
cosm
)
0
1
2
3
4
5
6
7O1 O139
FIG 2.3. Colonization of E. affinis adults by V. cholerae O1 and O139, measured over 48 h. Bar values are means of total cells attached per microcosms ± 1 SE (n = 5 for means at time 0 and 24; n = 4 for means at time 48).
39
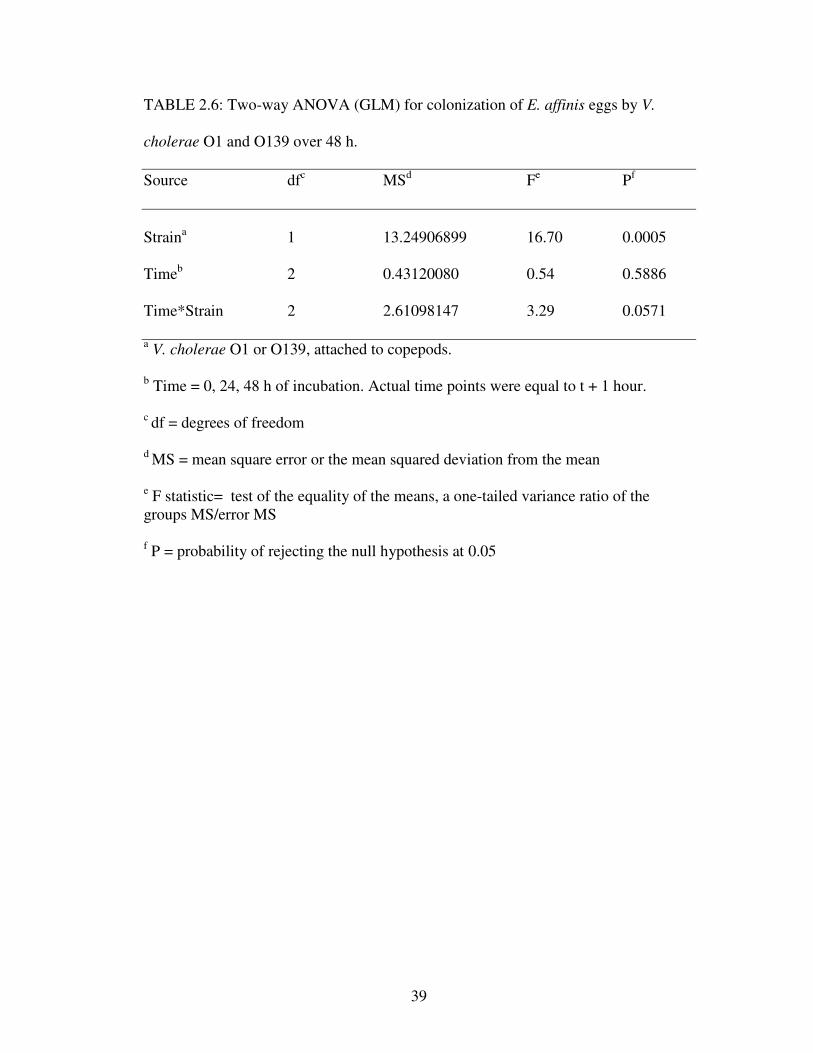
TABLE 2.6: Two-way ANOVA (GLM) for colonization of E. affinis eggs by V.
cholerae O1 and O139 over 48 h.
Source dfc MSd Fe Pf
Straina 1 13.24906899 16.70 0.0005
Timeb 2 0.43120080 0.54 0.5886
Time*Strain 2 2.61098147 3.29 0.0571
a V. cholerae O1 or O139, attached to copepods.
b Time = 0, 24, 48 h of incubation. Actual time points were equal to t + 1 hour.
c df = degrees of freedom
d MS = mean square error or the mean squared deviation from the mean
e F statistic= test of the equality of the means, a one-tailed variance ratio of the groups MS/error MS
f P = probability of rejecting the null hypothesis at 0.05
40
Time (hours)
0 24 48Log
10 C
once
ntra
tion
of V
. cho
lera
e (c
ells
atta
ched
per
mic
roco
sm)
0
1
2
3
4
5
6
7O1O139
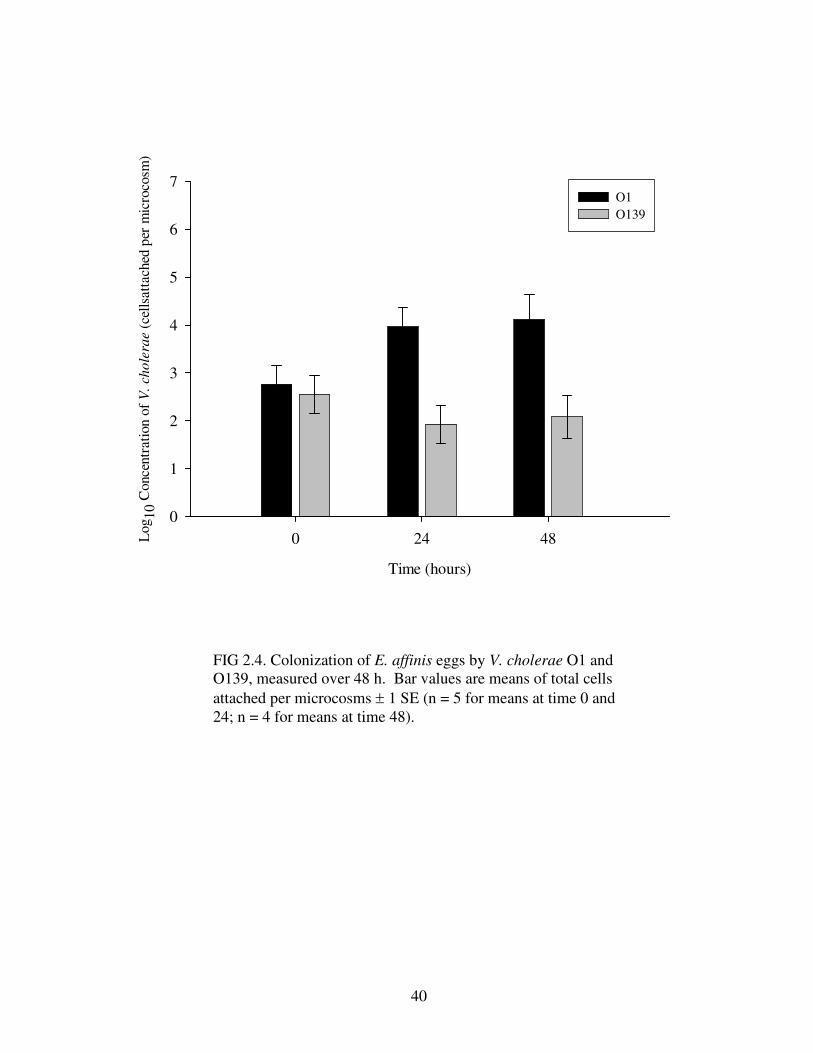
FIG 2.4. Colonization of E. affinis eggs by V. cholerae O1 and O139, measured over 48 h. Bar values are means of total cells attached per microcosms ± 1 SE (n = 5 for means at time 0 and 24; n = 4 for means at time 48).
41
Effect of nauplii on colonization of adults and eggs by V. cholerae O1 and O139
As shown in Table 2.7, there was an effect of presence or absence of nauplii
on the numbers of V. cholerae but the effect of nauplii was not the same for
serogroups O1 and O139, as indicated by the significant interaction of main effects.
Tukey’s HSD test, used for post hoc multiple comparisons of strain and nauplii,
showed that the presence or absence of nauplii did not affect numbers of V. cholerae
O1 (Fig. 2.4). However, V. cholerae O139 attached in greater numbers to adults in
the absence of nauplii (Fig. 2.4).
There was also a significant difference between numbers of V. cholerae O1
and O139 attached to E. affinis eggs (Table 2.8). Again, V. cholerae O1 attached in
significantly greater numbers than V. cholerae O139 (Fig. 2.6). Furthermore, V.
cholerae attached to eggs in greater numbers when nauplii were present, as compared
to attachment when nauplii were absent (Fig. 2.6). Unlike attachment of V. cholerae
to adults, there was no significant interaction between serogroups and the presence of
nauplii when attaching to eggs.
42
TABLE 2.7: Two-way ANOVA (Mixed-Model) for the effect of the presence of
nauplii on the colonization of E. affinis adults by V. cholerae O1 and O139.
Effect NDFa DDFb F P
Strain 1 9.09 116.42 <.0001
Nauplii 1 9.55 11.51 0.0073
Strain*Naupliic 1 9.09 15.28 0.0035
aNDF denotes the numerator degrees of freedom
bDDF denotes the denominator degrees of freedom
cNauplii had a significant effect on the attachment of V. cholerae strain, demonstrated
by the Strain*Nauplii interaction. Multiple Pairwise Comparisons were performed on
Strain*Nauplii interaction and adjusted using Tukey-Kramer.

43
Nauplii
present absentLog
10 C
once
ntra
tion
of V
. cho
lera
e (c
ells
att
ache
d pe
r m
icro
cosm
)
0
1
2
3
4
5
6
7O1 O139 a
a
b
c
FIG 2.5. Association of V. cholerae O1 and O139 with E. affinis adults in the presence or absence of hatched nauplii. Bar values are means of total cells attached per microcoms ± 1 SE (n = 4). Letters denote differences between means, adjusted by Tukey-Kramer (significance level α = 0.05). Means with different letters are significantly different.
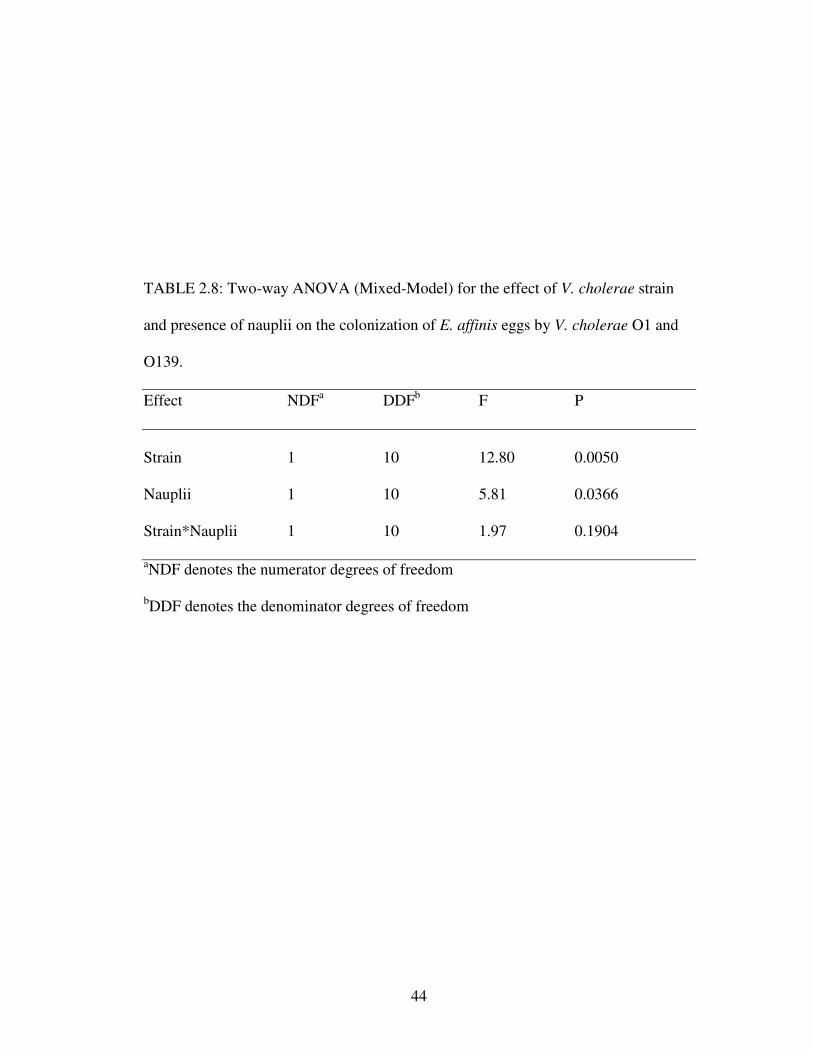
44
TABLE 2.8: Two-way ANOVA (Mixed-Model) for the effect of V. cholerae strain
and presence of nauplii on the colonization of E. affinis eggs by V. cholerae O1 and
O139.
Effect NDFa DDFb F P
Strain 1 10 12.80 0.0050
Nauplii 1 10 5.81 0.0366
Strain*Nauplii 1 10 1.97 0.1904
aNDF denotes the numerator degrees of freedom
bDDF denotes the denominator degrees of freedom
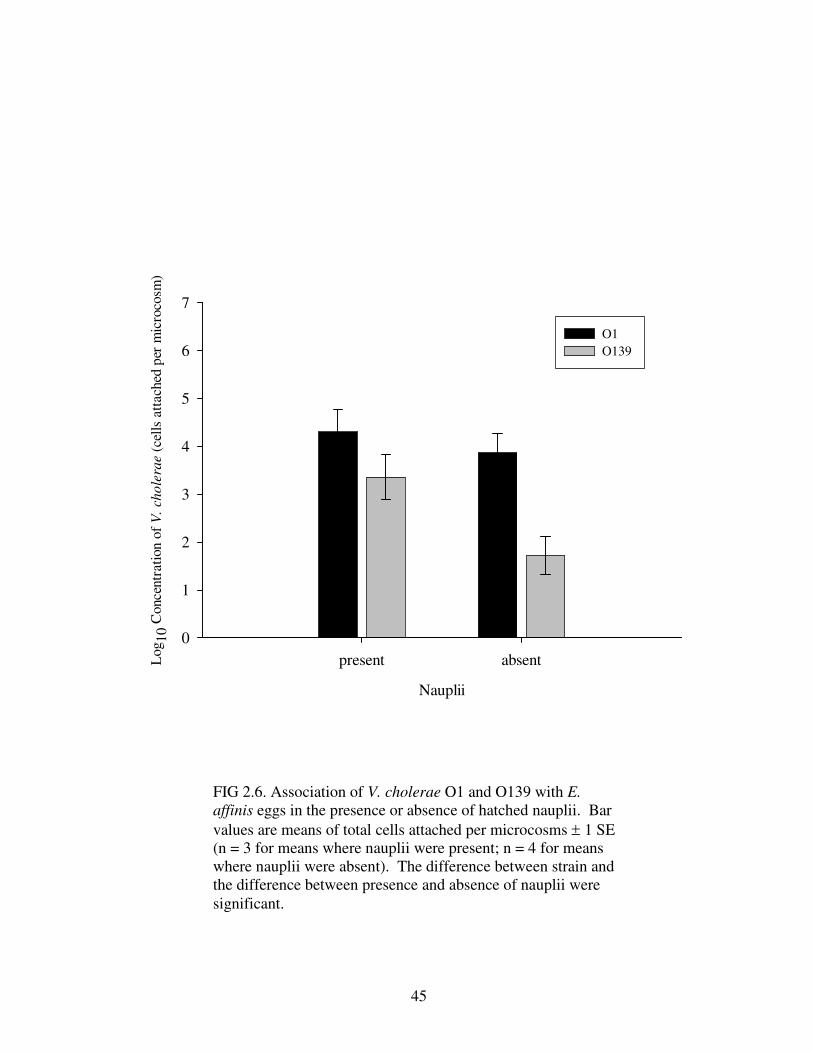
45
Nauplii
present absentLog
10 C
once
ntra
tion
of V
. cho
lera
e (c
ells
att
ache
d pe
r m
icro
cosm
)
0
1
2
3
4
5
6
7
O1 O139
FIG 2.6. Association of V. cholerae O1 and O139 with E. affinis eggs in the presence or absence of hatched nauplii. Bar values are means of total cells attached per microcosms ± 1 SE (n = 3 for means where nauplii were present; n = 4 for means where nauplii were absent). The difference between strain and the difference between presence and absence of nauplii were significant.
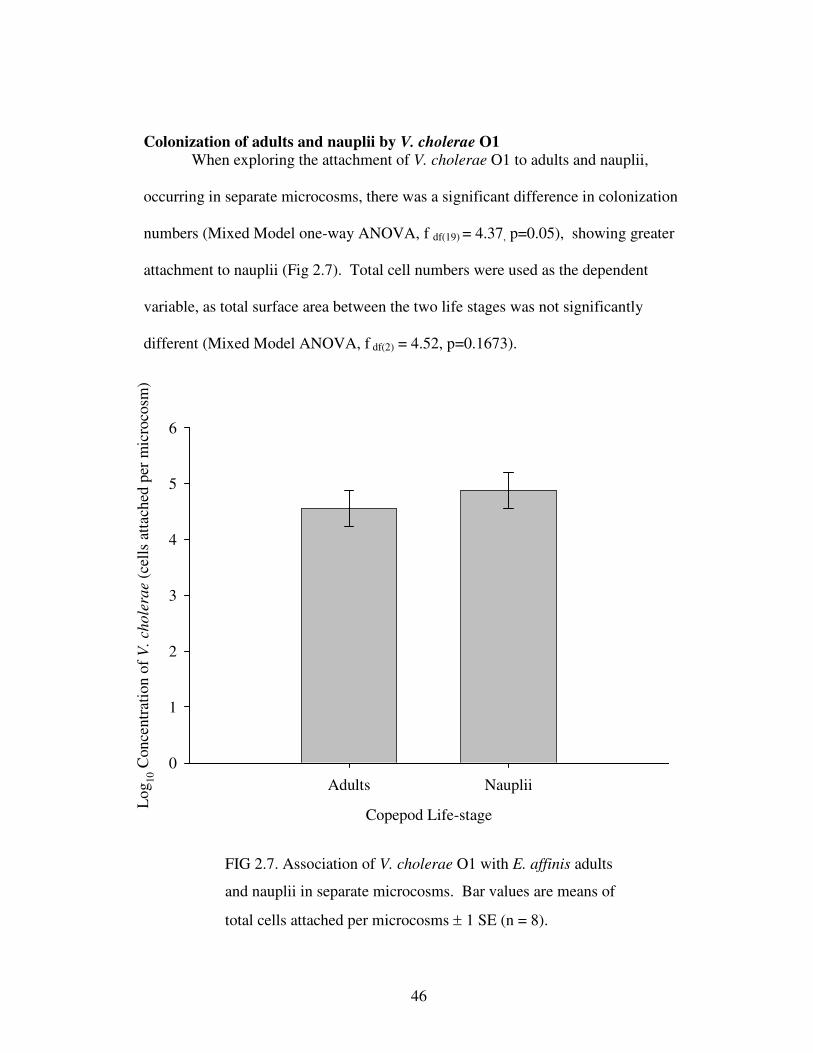
46
Colonization of adults and nauplii by V. cholerae O1When exploring the attachment of V. cholerae O1 to adults and nauplii,
occurring in separate microcosms, there was a significant difference in colonization
numbers (Mixed Model one-way ANOVA, f df(19) = 4.37, p=0.05), showing greater
attachment to nauplii (Fig 2.7). Total cell numbers were used as the dependent
variable, as total surface area between the two life stages was not significantly
different (Mixed Model ANOVA, f df(2) = 4.52, p=0.1673).
FIG 2.7. Association of V. cholerae O1 with E. affinis adults
and nauplii in separate microcosms. Bar values are means of
total cells attached per microcosms ± 1 SE (n = 8).
Copepod Life-stage
Adults Nauplii
Log
10 C
once
ntra
tion
of V
. cho
lera
e (c
ells
atta
ched
per
mic
roco
sm)
0
1
2
3
4
5
6
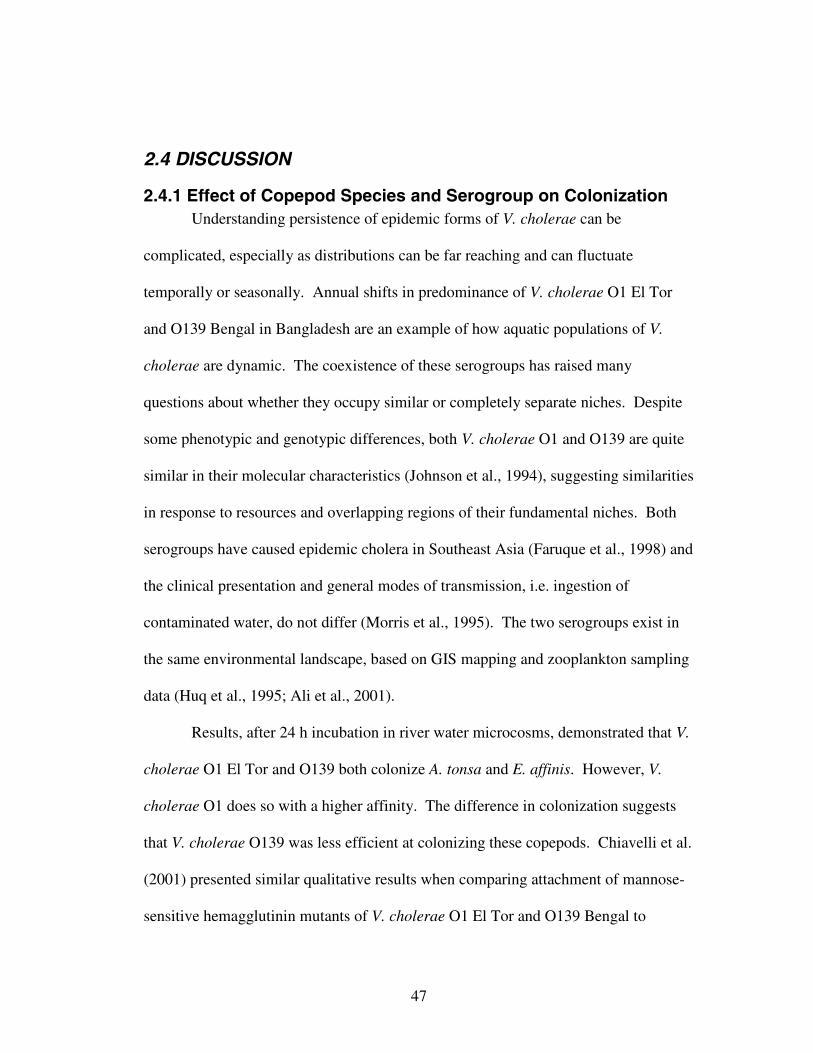
47
2.4 DISCUSSION
2.4.1 Effect of Copepod Species and Serogroup on ColonizationUnderstanding persistence of epidemic forms of V. cholerae can be
complicated, especially as distributions can be far reaching and can fluctuate
temporally or seasonally. Annual shifts in predominance of V. cholerae O1 El Tor
and O139 Bengal in Bangladesh are an example of how aquatic populations of V.
cholerae are dynamic. The coexistence of these serogroups has raised many
questions about whether they occupy similar or completely separate niches. Despite
some phenotypic and genotypic differences, both V. cholerae O1 and O139 are quite
similar in their molecular characteristics (Johnson et al., 1994), suggesting similarities
in response to resources and overlapping regions of their fundamental niches. Both
serogroups have caused epidemic cholera in Southeast Asia (Faruque et al., 1998) and
the clinical presentation and general modes of transmission, i.e. ingestion of
contaminated water, do not differ (Morris et al., 1995). The two serogroups exist in
the same environmental landscape, based on GIS mapping and zooplankton sampling
data (Huq et al., 1995; Ali et al., 2001).
Results, after 24 h incubation in river water microcosms, demonstrated that V.
cholerae O1 El Tor and O139 both colonize A. tonsa and E. affinis. However, V.
cholerae O1 does so with a higher affinity. The difference in colonization suggests
that V. cholerae O139 was less efficient at colonizing these copepods. Chiavelli et al.
(2001) presented similar qualitative results when comparing attachment of mannose-
sensitive hemagglutinin mutants of V. cholerae O1 El Tor and O139 Bengal to
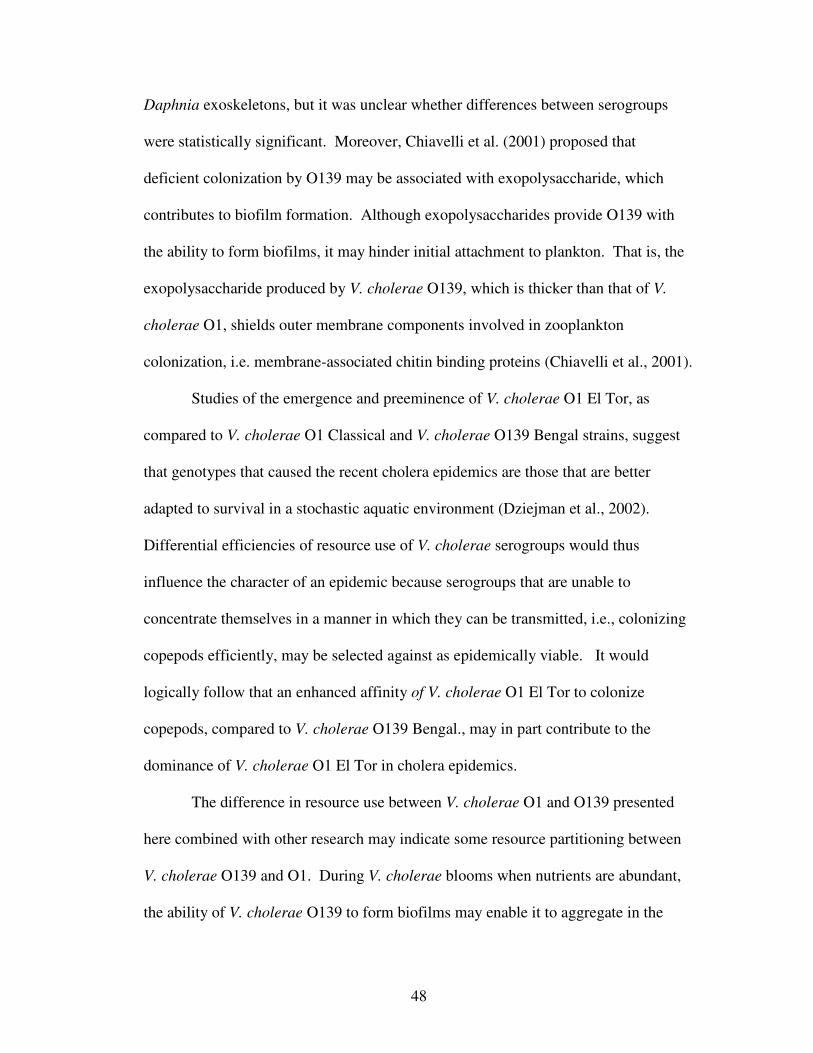
48
Daphnia exoskeletons, but it was unclear whether differences between serogroups
were statistically significant. Moreover, Chiavelli et al. (2001) proposed that
deficient colonization by O139 may be associated with exopolysaccharide, which
contributes to biofilm formation. Although exopolysaccharides provide O139 with
the ability to form biofilms, it may hinder initial attachment to plankton. That is, the
exopolysaccharide produced by V. cholerae O139, which is thicker than that of V.
cholerae O1, shields outer membrane components involved in zooplankton
colonization, i.e. membrane-associated chitin binding proteins (Chiavelli et al., 2001).
Studies of the emergence and preeminence of V. cholerae O1 El Tor, as
compared to V. cholerae O1 Classical and V. cholerae O139 Bengal strains, suggest
that genotypes that caused the recent cholera epidemics are those that are better
adapted to survival in a stochastic aquatic environment (Dziejman et al., 2002).
Differential efficiencies of resource use of V. cholerae serogroups would thus
influence the character of an epidemic because serogroups that are unable to
concentrate themselves in a manner in which they can be transmitted, i.e., colonizing
copepods efficiently, may be selected against as epidemically viable. It would
logically follow that an enhanced affinity of V. cholerae O1 El Tor to colonize
copepods, compared to V. cholerae O139 Bengal., may in part contribute to the
dominance of V. cholerae O1 El Tor in cholera epidemics.
The difference in resource use between V. cholerae O1 and O139 presented
here combined with other research may indicate some resource partitioning between
V. cholerae O139 and O1. During V. cholerae blooms when nutrients are abundant,
the ability of V. cholerae O139 to form biofilms may enable it to aggregate in the
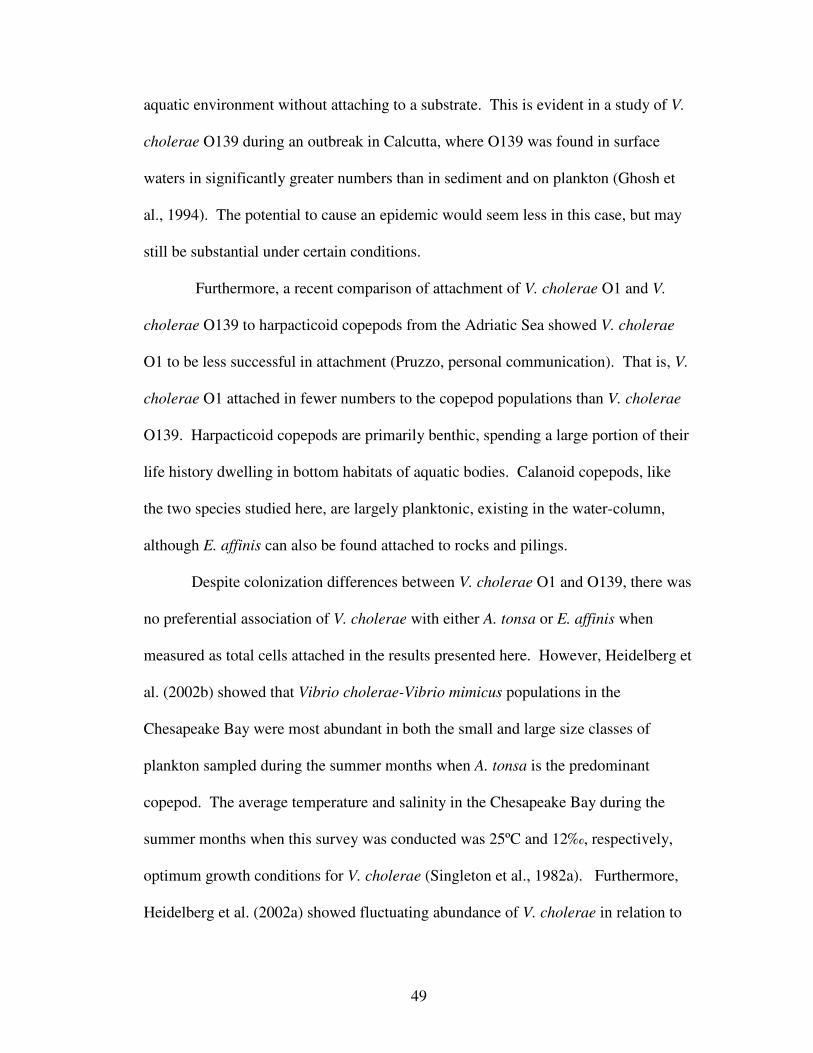
49
aquatic environment without attaching to a substrate. This is evident in a study of V.
cholerae O139 during an outbreak in Calcutta, where O139 was found in surface
waters in significantly greater numbers than in sediment and on plankton (Ghosh et
al., 1994). The potential to cause an epidemic would seem less in this case, but may
still be substantial under certain conditions.
Furthermore, a recent comparison of attachment of V. cholerae O1 and V.
cholerae O139 to harpacticoid copepods from the Adriatic Sea showed V. cholerae
O1 to be less successful in attachment (Pruzzo, personal communication). That is, V.
cholerae O1 attached in fewer numbers to the copepod populations than V. cholerae
O139. Harpacticoid copepods are primarily benthic, spending a large portion of their
life history dwelling in bottom habitats of aquatic bodies. Calanoid copepods, like
the two species studied here, are largely planktonic, existing in the water-column,
although E. affinis can also be found attached to rocks and pilings.
Despite colonization differences between V. cholerae O1 and O139, there was
no preferential association of V. cholerae with either A. tonsa or E. affinis when
measured as total cells attached in the results presented here. However, Heidelberg et
al. (2002b) showed that Vibrio cholerae-Vibrio mimicus populations in the
Chesapeake Bay were most abundant in both the small and large size classes of
plankton sampled during the summer months when A. tonsa is the predominant
copepod. The average temperature and salinity in the Chesapeake Bay during the
summer months when this survey was conducted was 25ºC and 12‰, respectively,
optimum growth conditions for V. cholerae (Singleton et al., 1982a). Furthermore,
Heidelberg et al. (2002a) showed fluctuating abundance of V. cholerae in relation to
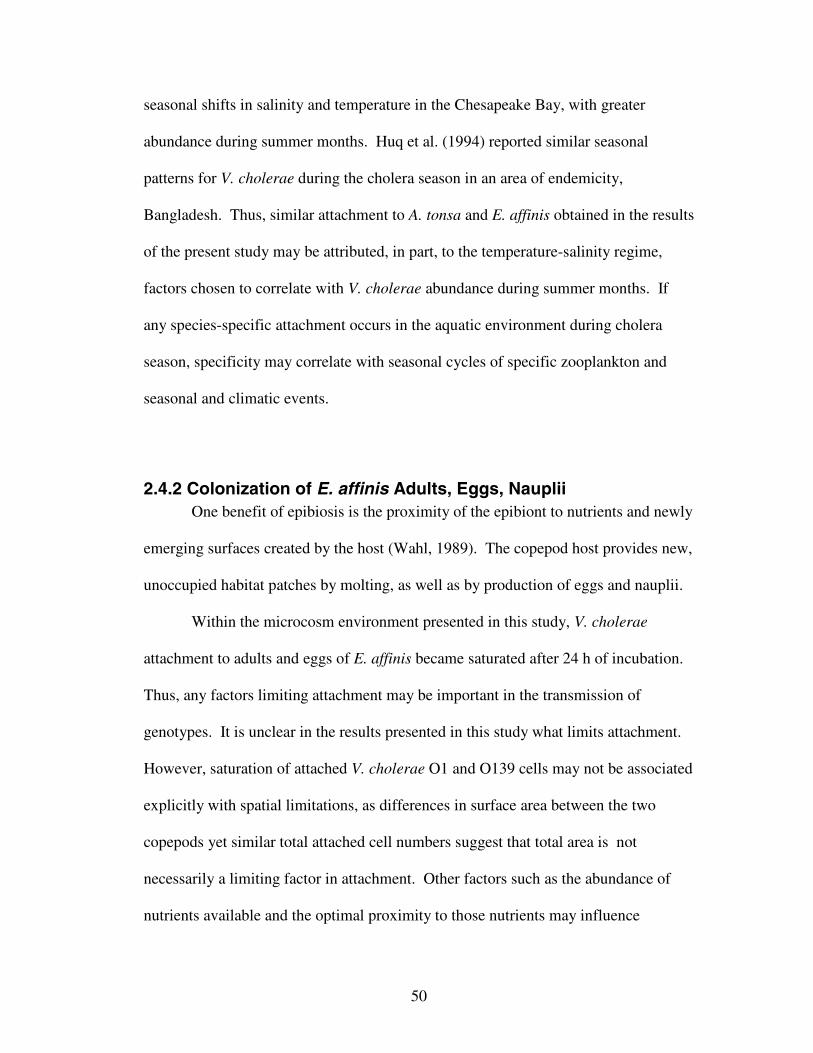
50
seasonal shifts in salinity and temperature in the Chesapeake Bay, with greater
abundance during summer months. Huq et al. (1994) reported similar seasonal
patterns for V. cholerae during the cholera season in an area of endemicity,
Bangladesh. Thus, similar attachment to A. tonsa and E. affinis obtained in the results
of the present study may be attributed, in part, to the temperature-salinity regime,
factors chosen to correlate with V. cholerae abundance during summer months. If
any species-specific attachment occurs in the aquatic environment during cholera
season, specificity may correlate with seasonal cycles of specific zooplankton and
seasonal and climatic events.
2.4.2 Colonization of E. affinis Adults, Eggs, NaupliiOne benefit of epibiosis is the proximity of the epibiont to nutrients and newly
emerging surfaces created by the host (Wahl, 1989). The copepod host provides new,
unoccupied habitat patches by molting, as well as by production of eggs and nauplii.
Within the microcosm environment presented in this study, V. cholerae
attachment to adults and eggs of E. affinis became saturated after 24 h of incubation.
Thus, any factors limiting attachment may be important in the transmission of
genotypes. It is unclear in the results presented in this study what limits attachment.
However, saturation of attached V. cholerae O1 and O139 cells may not be associated
explicitly with spatial limitations, as differences in surface area between the two
copepods yet similar total attached cell numbers suggest that total area is not
necessarily a limiting factor in attachment. Other factors such as the abundance of
nutrients available and the optimal proximity to those nutrients may influence
51
attached cell abundance. For example, Huq et al. (1983) reported that V. cholerae
largely accumulated in areas of copepods where exudates were concentrated, e.g.,
around the mouthparts and on the egg sacs (which are located adjacent to the anal
pore). Similarly, results of earlier research revealed that vibrios, including V.
cholerae, attached to and used the chitinaceous exoskeleton and eggs of aquatic
invertebrates as nutrient substrates (Kaneko and Colwell, 1975; Nalin, 1979; Guthrie
and Cofie, 1991; Yu et al., 1991; Broza and Halpern, 2001; Halpern et al., 2003;
Meibom et al., 2004). The cooperation of bacterial cells through quorum-sensing in
biofilms is limited by the size of the three-dimensional structure, based on nutrient
diffusion, consumption rates by cells present, and local saturation of growth (Ward et
al., 2003). Thus, the ability to attach to copepods in “hot spots” such that V. cholerae
cells can efficiently use nutritional resources, in microcolonies or biofilms, may be
crucial for incidence and distribution during periods of nutrient limitations and may
be an important factor in the persistence and/or ascendance of one genotype over
another. Furthermore, contact rates of copepods and V. cholerae may limit
attachment, particularly in the microcosm environment in this study.
Results revealed here showed that the hatching of nauplii affects the
distribution of V. cholerae attachment to both adults and eggs, especially V. cholerae
O139. Presence of hatched nauplii influenced V. cholerae cell abundance on eggs,
such that eggs had greater numbers of cells attached when nauplii were present as
compared to when nauplii were absent. One possible explanation for this difference
may be production of chemoattractants produced by prehatched nauplii, drawing V.
cholerae to the egg sac. In this case, the ability of V. cholerae to metabolize chitin
52
and mucin may contribute to hatching of copepod eggs by weakening the integrity of
the egg sac and egg casing. The close proximity of V. cholerae to hatching nauplii by
colonization of the egg sac could further facilitate colonization and distribution of V.
cholerae to new emerging substrate of the nauplius. The effect of nauplii on the
decrease in numbers of V. cholerae O139 colonizing adults may be associated with
the redistribution from the carapace to eggs, as noted above.
In addition, results revealed greater colonization of nauplii by V. cholerae O1,
compared to colonization of adults when adults and nauplii occurred in separate
microcosms. Although the difference in attachment between adults and nauplii was
slight but significant, production of a large number of nauplii that occurs during
copepod blooms suggests that nauplii may serve as an amplifying mechanism for V.
cholerae during cholera season. Similar results were observed for plankton samples
collected from the Bangladeshi aquatic environment, demonstrating that at times
when nauplii are the majority of the copepod population, V. cholerae will continue to
be associated with copepods, perhaps at even greater abundance (Huq et al., in
preparation). Increases in copepods and consequent offspring production coincide
with phytoplankton blooms, which sequentially precede the onset of cholera seasons
in Bangladesh (Colwell and Huq, 1994). It would, thus, fit that a period of bacterial
transmission, whereby cells are dispersed to nauplii, could facilitate a regional V.
cholerae bloom.
Similarly, studies of other vibrios have shown initial juvenile stages attracting
and providing an important substrate on which vibrio bacteria can settle. The
relationship between Vibrio fischeri and its squid host, Euprymna scolopes, is a good
53
example, whereby V. fischeri from adults colonize the crypt epithelia of squid
juveniles. The crypt epithelia of the squid provide an array of amino acids, peptides,
and proteins, supporting the proliferation of V. fischeri (Graf and Ruby, 1998).
Constant proliferation of V. fischeri renders the adult host a source of expelled cells
that subsequently colonize newly hatched juveniles. Adult squid provide a source
habitat of V. fischeri for juveniles, which, in time, also become source habitats and
maintain the persistence of V. fischeri (Lee and Ruby, 1994). Similarly, copepod
eggs, particularly those that hatch into nauplii and go though the multiple-molting
juvenile life stages may be critical to V. cholerae in its regional dispersal and
persistence during epidemic-initiating and epidemic periods.
Estuarine zooplankton blooms, in particular, create a situation in which large
numbers of eggs and juveniles are produced and often outnumber adults (Miller,
1984). Thus, the abundance of juvenile copepod stages is among the many factors
that may significantly influence the patterns of occurrence and distribution of V.
cholerae in the aquatic environment. Temperature and salinity regulate many of the
physiological changes that occur during the life cycle of copepods, i.e., hatching and
molting, hence it becomes difficult to uncouple the many abiotic and biotic factors
influencing cholera epidemics. It is clear, nevertheless, that the role of juvenile stages
of the copepod in cholera transmission merits further investigation.
54
Chapter 3: Sympatric existence of V. cholerae O1 and O139 in copepod habitats
3.1 INTRODUCTION
Since the emergence of V. cholerae O139 Bengal in 1992 as an epidemic
strain, both V. cholerae O1 and O139 have caused epidemic cholera in South East
Asia (Faruque and Mekalanos, 1998). In some areas, V. cholerae O139 replaced both
the Classical and El Tor forms of V. cholerae O1 and, in others, V. cholerae O139
and O1 El Tor continue to coexist (Siddique et al., 1996). In the coastal areas of
Bangladesh, where they coexist, annual fluctuations suggest that populations of each
serogroup are highly dynamic. In fact, data accumulated to date show a shift in
predominance of infection prevalence between V. cholerae O1 El Tor and O139
Bengal (Mukhopadhyay et al., 1996), which has raised questions about whether
similar clinical presentations translate into related responses to the natural aquatic
habitat (Zo et al., 2002). If so, the dynamics of coexisting serogroups in the aquatic
reservoir may involve direct interactions, i.e. competition or facilitation.
The molecular characteristics of V. cholerae and its association with
zooplankton provide evidence that V. cholerae O1 and O139 have the potential to
occupy the same niche and possibly compete for the same resources (Johnson et al.,
1994; Huq et al., 1995; Ali et al., 2001). To date, it has been difficult to find both
serogroups in a given environment at the same time, especially during inter-epidemic
periods, which makes it even more difficult to demonstrate whether the two
55
serogroups are sympatric. Investigators have, however, detected both serogroups
attached to some of the same aquatic metazoans (Bhanumathi et al., 2003; Huq et al.,
1983, 1995; Islam and Aziz, 1981) but only one of the studies has revealed
simultaneous occurrence on the same zooplankton assemblage (Huq et al., 1995).
Although the available evidence reveals that occupation of the same habitat
can occur for V. cholerae O1 and O139, patterns of resource utilization that may
explain the coexistence and yearly fluctuation in prevalence of epidemic serogroups
have not been established. If a numerical advantage of one serogroup could prevent
the attachment of another to a copepod, attachment ability could favor transmission of
the first serogroup. Furthermore, because cholera is dose-dependent (Cash et al.,
1974), survival and proliferation of V. cholerae in the human gut and subsequent
release into the water in large numbers via fecal discharge would affect transmission.
Thus, the serogroup that is efficient in colonizing copepods would increase
transmission prevalence.
Attachment to copepods may provide V. cholerae with the nutrients created by
a copepod in its own feeding, making attachment advantageous. In fact, Yu et al.
(1991) demonstrated that adhesion to immobilized chitin oligosaccharides by V.
furnissii required trace amounts of amino acids. Channels circulating nutrients that
are formed by the three-dimensional structure of cells in biofilms would enable V.
cholerae to take advantage of nutrient capture when attached to copepods as
compared to cells that are planktonic.
During inter-epidemic periods, when plankton blooms are infrequent or not as
pronounced, V. cholerae cells may rely on their ability to sequester nutrients straight
56
from the structural elements of copepods. Vibrios, including V. cholerae posses
chitinolytic and proteolytic enzymes that degrade the chitin exoskeleton and egg
protein of the copepod to use as a nutrient resource (Kaneko and Colwell, 1974;
Nalin, 1976; Guthrie and Cofie, 1991; Yu et al., 1991; Halpern et al., 2003). Bassler
et al. (1991a) showed that starvation of Vibrio furnissii resulted in a 2- to 3-fold
increase in chemotaxis to chitin oligomers. It is probable that V. cholerae will be
similarly attracted to chitin when small molecular weight nutrients are scarce.
Attaching to and breaking down the structural matrix of insoluble chitin
substrates into its constituents for use is a highly regulated process (Yu et al., 1991;
Bassler et al., 1991a, 1991b). In fact, Meibom et al. (2004) demonstrated a complex
regulation of genes, elucidated by Heidelberg et al. (2002), in processing chitin.
Chitin utilization involves regulation of genes that enable sensing of, attachment to,
and degradation of natural chitin surfaces (Yu et al., 1991; Bassler et al., 1991a,
1991b; Meibom et al., 2004). Furthermore, Guthrie and Cofie (1991) demonstrated
that chitin exoskeletons of marine organisms also stimulate cholera toxin production.
Any differences between V. cholerae O1 and O139 in chitin utilization, i.e.,
attachment to and acquisition of chitin, could be a significant factor in determining
success of one serogroup over the other in copepod habitats, transmission to humans,
and the character of cholera epidemics.
The research reported here was undertaken to compare chitin utilization by V.
cholerae O1 and O139 when they occur sympatrically in and on copepod habitats.
Chapter two reported colonization of live copepods, by V. cholerae O1 El Tor and
O139 Bengal when occurring allopatrically, indicating that V. cholerae O1 colonized

57
the copepod substratum in greater numbers than O139. This study tests whether
sympatric colonization of copepods by V. cholerae O1 and O139 affected serotype
composition in and on the copepod and it examines the ability of V. cholerae O1 and
O139 to utilize and compete for chitin
Several different laboratory experiments were performed, whereby V.
cholerae O1 and O139 were introduced into laboratory microcosms in either the
presence of copepods or soluble chitin. First, for each serogroup, V. cholerae was
introduced as an "invader" to copepods, with a pre-established population of V.
cholerae of the alternate serogroup, to determine if the previously established strain
would inhibit colonization of the newly introduced strain and whether colonization by
the "invading" serogroup would influence total abundance of the established
serogroup. Second, growth of V. cholerae O1 and O139 were compared, with soluble
chitin as the nutrient source, under the same environmental conditions as the
colonization assays. Third, V. cholerae O1 and O139 were inoculated in different
ratios into aquatic microcosms containing soluble chitin to determine whether relative
fitness, a measure of the relative ability to convert nutrient resources into more cells,
changed over time when they occurred sympatrically. Fourth, mixed cultures of V.
cholerae O1 and O139 were compared to their respective unmixed cultures to
determine the presence of any competitive interactions.
3.2 MATERIAL AND METHODS
3.2.1 Sympatric colonization of copepods
Microcosms were prepared, consisting of either 10-50 adult copepods of
Acartia tonsa collected from the Baltimore Harbor or Eurytemora affinis collected
58
from the Patuxent River, both contributing bodies of water of the Chesapeake Bay,
Maryland. Stock cultures of copepods were kept in flasks at 20ºC from which they
were collected using a 202 µm sieve, washed once with filter sterilized water, and
placed into microcosms. Microcosms, 200 ml tall form berzelius beakers (Kimbel-
Kontes, Inc., New Jersey), contained 100 ml of filter sterilized river water collected
from the Rhode River, a tributary of the Chesapeake Bay, Maryland. Water was
filtered through 10 µm, 5 µm, 1 µm filters (Filterite Inc, Timonium, MD), and finally
a 0.22 µm polycarbonate filter (OSMONICS, Livermore, CA) and served as the
suspension medium for the microcosms, adjusted to a salinity of 15‰ and pH 8.5
(Huq et al., 1994).
Prior to inoculation, V. cholerae strains were grown separately in 20 ml tubes
of akaline peptone water (1% w/v Peptone, 1% w/v NaCl, pH 8.5) at 37ºC, with
shaking at 150 rpm, for six hours. Both serogroups grew to ca. 107 cells per ml,
determined by direct fluorescent counts (Hasan et al., 1994). The cells were harvested
by centrifugation, washed twice, resuspended in filter sterilized river water,
inoculated into microcosms to a final concentration of ca. 5 x 10⁴ cells per ml.
Microcosms were set-up in a replicated Randomized Incomplete Block
Design with a 2x2x2 factorial treatment structure (2 copepod species, 2 initial strains
of V. cholerae, 2 subsequent additions (+/-) of the other strain). Each copepod-strain
treatment was replicated twice and run on two different days, representing a total of
four microcosms for each copepod-strain treatment (Fig 3.1).
Microcosms of each copepod species were inoculated with either an initial
aliquot of V. cholerae O1 El Tor strain C6709 or inoculated with V. cholerae O139

59
Bengal strain MO10. For each species of copepod, additional microcosms contained
copepods without addition of either V. cholerae serogroup to control for the presence
of any naturally associated V. cholerae O1 and O139. After incubation for 24 h at
25ºC, half of the treatment microcosms consisting of the initial serogroup, represented
here as the "established strain," were inoculated with the other V. cholerae serogroup,
the "invading strain", such that the final concentration of the “invading strain” was ca.
5 x 10⁴ cells per ml. For example, microcosms with V. cholerae O1 as an
"established strain" received O139 as the "invading strain" and vice versa. However,
the other half of the treatment microcosms with pre-established strains was not
exposed to “invaders” of the same strain type (Fig 3.1). The microcosms were then
incubated for an additional 24 h at the same temperature before final sampling.
Each microcosm was sampled at 48 h with each microcosm representing an
independent observational unit. Copepods from each microcosm were collected by
filtration using a 153µm sieve and analyzed as independent components. The
copepods were rinsed to disassociate loosely attached bacteria. All samples were
prepared for direct viable counts (DVC) (Hasan et al., 1994; Chowdhury et al., 1995)
and fixed with 5% formalin.

60
V. cholerae O1 V. cholerae O139No V. cholerae,
River water
24 h incubation
River V. choleraewater O139
River V. choleraewater O1
No V. cholerae,River water
Another 24 h incubation
Filtration and sampling of copepods
FIG 3.1. Experimental design of sympatric colonization of A. tonsa and E. affinisby V. cholerae O1 and O139. The above design was the same for each copepod species, replicated twice for each treatment and blocked by day. Samples were analyzed after 48 h. Aliquots of river water equaling the aliquot volume of V. cholerae cells resuspended in river water were added to microcosms that did not receive V. cholerae.
61
The copepods from each microcosm were counted. Eggs were removed from
ovigerous females and these eggs were not included in the analyses. After the
copepods in each microcosm had been counted, they were sonicated for 120 sec and
homogenized in a tissue grinder. Direct fluorescent antibody reagent (New Horizons,
Columbia, MD), specific for O1 and O139, was added to each sample. V. cholerae
O1 and O139 cells (both non-culturable and culturable cells, combined) were
enumerated using an epifluorescent microscope (Leitz Dialux 20, Germany).
Three-way analysis of variance (Mixed Model ANOVA, SAS Institute,
Version 8.0) was used to determine differences, if any, in V. cholerae strains attached
as established bacteria on A. tonsa and E. affinis copepods in the presence or absence
of an “invader” strain. Two-way analysis of variance (Mixed Model, SAS 8.0) was
used to further analyze whether attachment to copepods by “established” and
“invader” strains were significantly different. To determine whether established and
invader strains attach in different numbers, V. cholerae O1 and O139 were analyzed
separately to avoid violating assumptions of the ANOVA model. Day and day x
treatment was included in these Mixed Models as a random effect. There was a small
covariate effect of day. It, however, was insignificant. Thus, treatments were
combined to obtain a total of four replicate microcosms per treatment. Cell counts
were log-transformed to satisfy homoscedacity
3.2.2 Chitin Utilization
V. cholerae O1 El Tor strain C6709 and O139 Bengal strain MO10 were
inoculated into separate, 20 ml tubes of Akaline Peptone Water (1% w/v Peptone, 1%
w/v NaCl, pH 8.5), incubated at 37ºC, with shaking at 150 rpm, for 6 hours. Both
62
serogroups grew to ca. 107 cells per ml, determined by direct fluorescent counts
(Hasan et al., 1994). The cells were harvested, washed thrice, and resuspended in
filter sterilized water collected from the Rhode River, a tributary of the Chesapeake
Bay, MD [water filtered through 10 µm, 5 µm, 1 µm filters (Filterite Inc, Timonium,
MD), and a 0.22 µm polycarbonate filter (OSMONICS, Livermore, CA)]. V.
cholerae O1 and O139 cells were inoculated into 200 ml beakers as microcosms,
containing 100 ml of river water, to a final concentration of ca. 5 x 10⁴ cells per ml.
Aliquots of a soluble chitin oligosaccharide, chitobiohexoase - GlcNAc6, (Seikagaku
America, East Falmouth, MA) described as able to induce two extracellular chitinases
and a porin that senses oligosaccharides (Meibom et al., 2004), were then added to
microcosms containing either V. cholerae O1 or O139 so that the final chitin
concentration was 56 µg/ml. Controls consisted of microcosms without the chitin
oligosaccharide. Treatments and controls were replicated (n=4). Salinity of the
microcosms was adjusted to 15‰, pH 8.5. The microcosms were incubated at 25ºC
for 72 h, conditions representative of those in endemic and epidemic cholera
countries, e.g. Bangladesh and India (Huq et al., 1994).
At 24, 48, and 72 h, 1 ml samples were taken from each microcosm. All
samples were prepared for direct viable counts (DVC) (Hasan, 1994; Chowdhury,
1995) and fixed with 2% formalin. After fixation, samples were sonicated for 60
seconds to disrupt any aggregation due to biofilm formation. Aliquots were fixed to
slide wells and direct fluorescent antibody reagent (New Horizons, Columbia, MD)
for O1 and O139 was applied for DVC. All antigen-antibody associated V. cholerae
O1 and O139 cells (both non-culturable and culturable cells combined) were
63
enumerated by epifluorescent microscopy using a Leitz Dialux microscope (Wetzlar,
Germany).
Repeated measures analysis (Mixed Model ANOVA, SAS Institute) was used
to determine differences in the influence of soluble chitin and river water nutrients on
growth of V. cholerae O1 and O139 in single culture microcosms over 72 h.
Heterogeneous Toeplitz structure was chosen as the best-fit variance-covariance
matrix, in part due to the experimental design and fit statistics. Tukey’s HSD test was
used for post hoc multiple comparisons of a significant interaction between time,
serogroup, and nutrient (significant at α =0.05). Cell counts were log-transformed to
satisfy homocedacity.
3.2.3 Competition for Soluble Chitin
For fitness assays, V. cholerae O1 and O139 and media components were
prepared as above. However, the two serogroups were inoculated into microcosms,
200 ml beakers containing 100 ml of river water, at different O1:O139 ratios. V.
cholerae O1 and O139 were present together in three different initial O1:O139 ratios
(0.25, 0.50, 0.75) totaling a final concentration of ca. 5 x 10⁴ cells per ml. Aliquots
of a soluble chitin oligosaccharide were added to all treatments so that the final
concentration was 56 µg/ml. Microcosms were adjusted to a salinity of 15‰, pH 8.5,
and were incubated at 25ºC for 72 h (Huq et al., 1994). Fitness assays were replicated
four times. Samples (1 ml) were taken from each microcosm at 24, 48, and 72 h and
were prepared and analyzed as above.
64
An estimate of relative fitness was used to determine whether different initial
ratios of V. cholerae O1 and O139 facilitate competitive coexistence between the two
serogroups when present in mixed cultures. Differences in fitness between V.
cholerae O1 and O139 may be caused by differences in the duration of lag phase,
growth rates, affinity for resources as they become limiting, survival at stationary
phase, or a combination of these factors. Relative fitness between V. cholerae O1 and
O139 was measured by calculating the ratio of the realized Malthusian parameter for
each serogroup (Lenski et al., 1991), a measure of the average rate of change of a
genotype, mi = ln[Ni(1)/Ni(0)]/(t), where Ni(0) and Ni(1) are the initial density of a
genotype and density after some time, respectively. Relative fitness is, thus, the ratio
of Malthusian parameters during direct competition of genotypes or Wij = mi/mj.
Competition was analyzed using a subset of the above experiment, whereby
mixed cultures, those inoculated in a 1:1 ratio of V. cholerae O1 and O139, were
compared to single cultures. Mixed and unmixed cultures were analyzed to
determine the effect of a competing strain on growth of V. cholerae O1 or O139.
Competition assays were designed so that in unmixed microcosms an equal amount of
the same serogroup was added as compared to the amount of competitor serogroup
added to mixed microcosms. Aliquots of a soluble chitin oligosaccharide were added
to all treatments so that the final concentration was 56 µg/ml. Microcosms were
adjusted to a salinity of 15‰, pH 8.5, and were incubated at 25ºC for 72 h (Huq et al.,
1994). Competition assays were replicated four times. Samples (1 ml) were taken
from each microcosm at 24, 48, and 72 h and were prepared and analyzed as above.
65
Repeated measures analysis (Mixed Model ANOVA, SAS Institute 8.0) was
used to determine differences in the relative fitness and differences in growth curves
of mixed and single serogroup cultures of V. cholerae O1 and O139 to determine the
extent of competition between 24 and 72 h. Compound Symmetry structure was
chosen as the best-fit variance-covariance matrix, in part due to the experimental
design and fit statistics for the analyses determining a change in relative fitness
between V. cholerae O1 and O139 over time. Compound Symmetry structure was
also chosen as the best-fit variance-covariance matrix for analysis of growth curve
differences of V. cholerae O1 when present in single and mixed cultures to determine
the extent of competition. However, the Heterogenous Compound Symmetry
structure was used to analyze growth curves of V. cholerae O139 in single and mixed
cultures. V. cholerae O1 and O139 were analyzed separately when comparing
differences between mixed and single strain growth curves to avoid non-
independence of the mixed cultures. Cell counts were log-transformed to satisfy
homoscedacity.
3.3 RESULTS
3.3.1 Sympatric colonization of copepods
Patterns of colonization showed that both V. cholerae O1 and O139 colonized
copepods in significantly different numbers in the presence or absence of an invader
strain (Table 3.1; Fig. 3.2). Overall, V. cholerae O1 attached to copepods an order of
magnitude greater than O139. Despite the significance in numbers attached, the
addition of either V. cholerae O1 or O139 positively influenced the numbers of the
66
established strain, whether V. cholerae O1 or O139 had previously colonized the
copepods. As for attachment to A. tonsa and E. affinis, the extent to which V.
cholerae colonized the two was not significantly different (Table 3.1).
When each serogroup was examined separately, to elucidate colonization
patterns between established and invading V. cholerae, there were differences
present. The extent of colonization by established and invading V. cholerae O1 did
not differ significantly regardless of copepod species (Table 3.2). However,
established and invading forms of V. cholerae O139 attached to copepods in
significantly different numbers (Table 3.3). In fact, numbers of attached V. cholerae
O139 were greater as invaders than as established strains (Fig. 3.3) and attached in
greater numbers to E. affinis than to A. tonsa (Fig. 3.4).
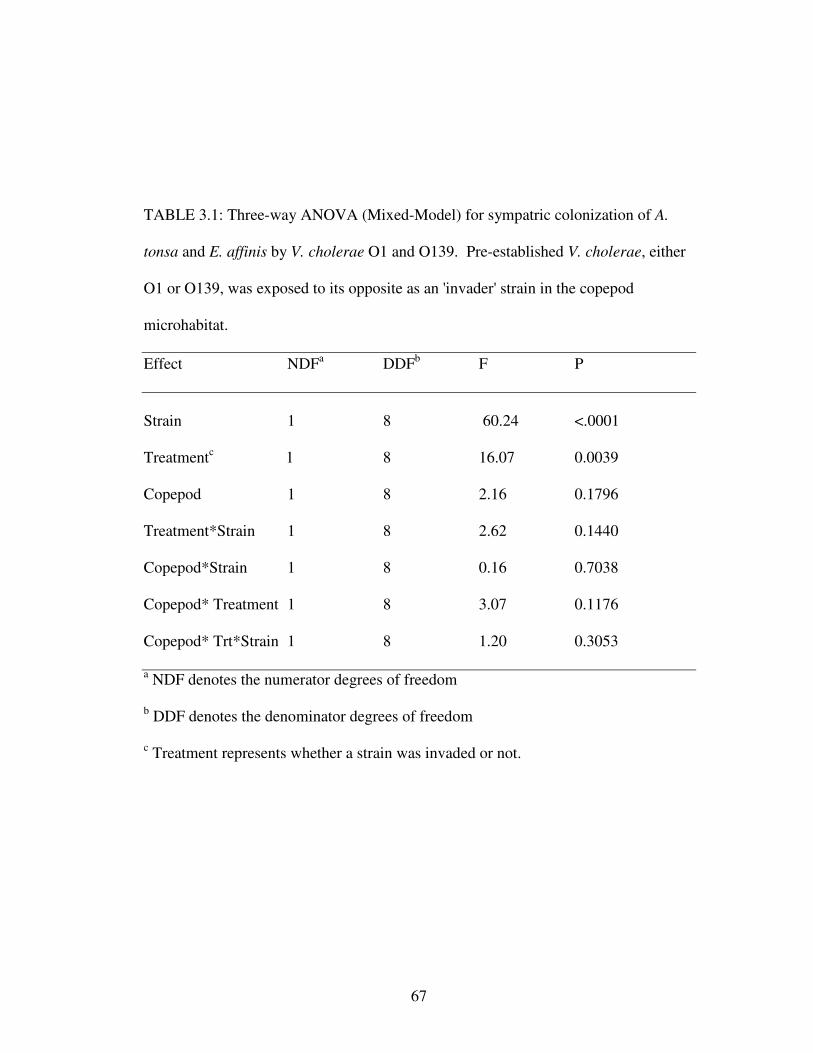
67
TABLE 3.1: Three-way ANOVA (Mixed-Model) for sympatric colonization of A.
tonsa and E. affinis by V. cholerae O1 and O139. Pre-established V. cholerae, either
O1 or O139, was exposed to its opposite as an 'invader' strain in the copepod
microhabitat.
Effect NDFa DDFb F P
Strain 1 8 60.24 <.0001
Treatmentc 1 8 16.07 0.0039
Copepod 1 8 2.16 0.1796
Treatment*Strain 1 8 2.62 0.1440
Copepod*Strain 1 8 0.16 0.7038
Copepod* Treatment 1 8 3.07 0.1176
Copepod* Trt*Strain 1 8 1.20 0.3053
a NDF denotes the numerator degrees of freedom
b DDF denotes the denominator degrees of freedom
c Treatment represents whether a strain was invaded or not.
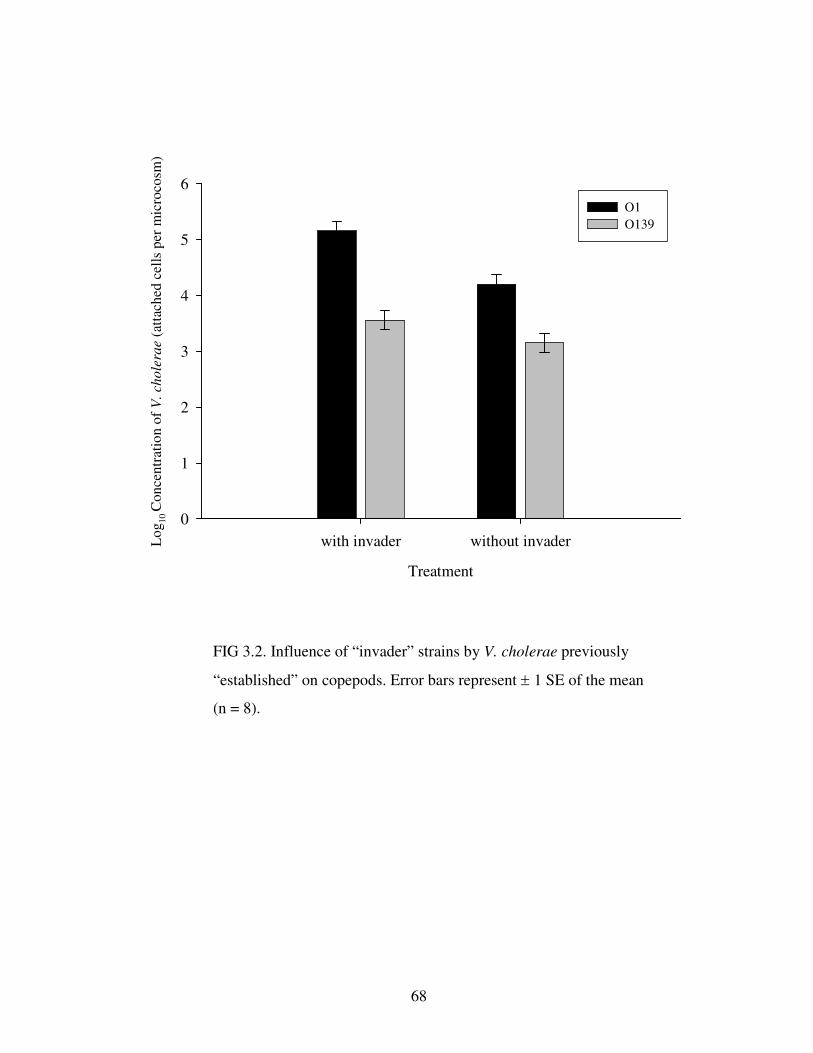
68
FIG 3.2. Influence of “invader” strains by V. cholerae previously
“established” on copepods. Error bars represent ± 1 SE of the mean
(n = 8).
Treatment
with invader without invaderLog
10 C
once
ntra
tion
of
V. c
hole
rae
(att
ache
d ce
lls
per
mic
roco
sm)
0
1
2
3
4
5
6
O1 O139
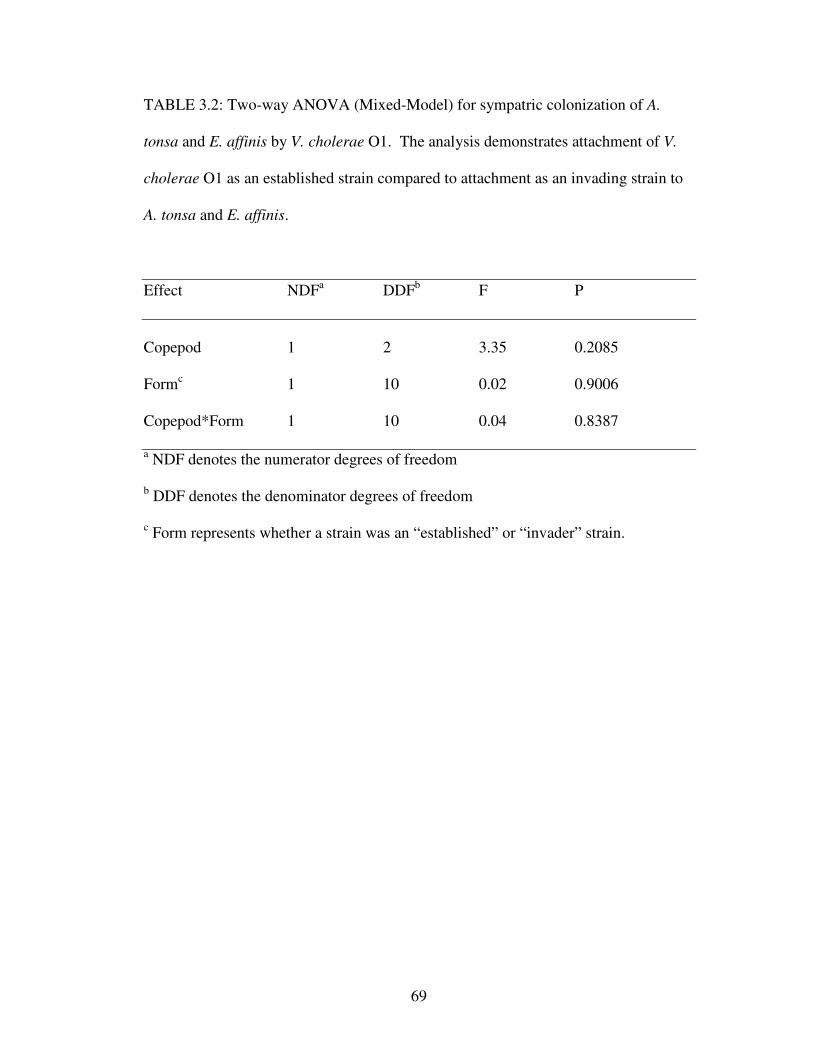
69
TABLE 3.2: Two-way ANOVA (Mixed-Model) for sympatric colonization of A.
tonsa and E. affinis by V. cholerae O1. The analysis demonstrates attachment of V.
cholerae O1 as an established strain compared to attachment as an invading strain to
A. tonsa and E. affinis.
Effect NDFa DDFb F P
Copepod 1 2 3.35 0.2085
Formc 1 10 0.02 0.9006
Copepod*Form 1 10 0.04 0.8387
a NDF denotes the numerator degrees of freedom
b DDF denotes the denominator degrees of freedom
c Form represents whether a strain was an “established” or “invader” strain.
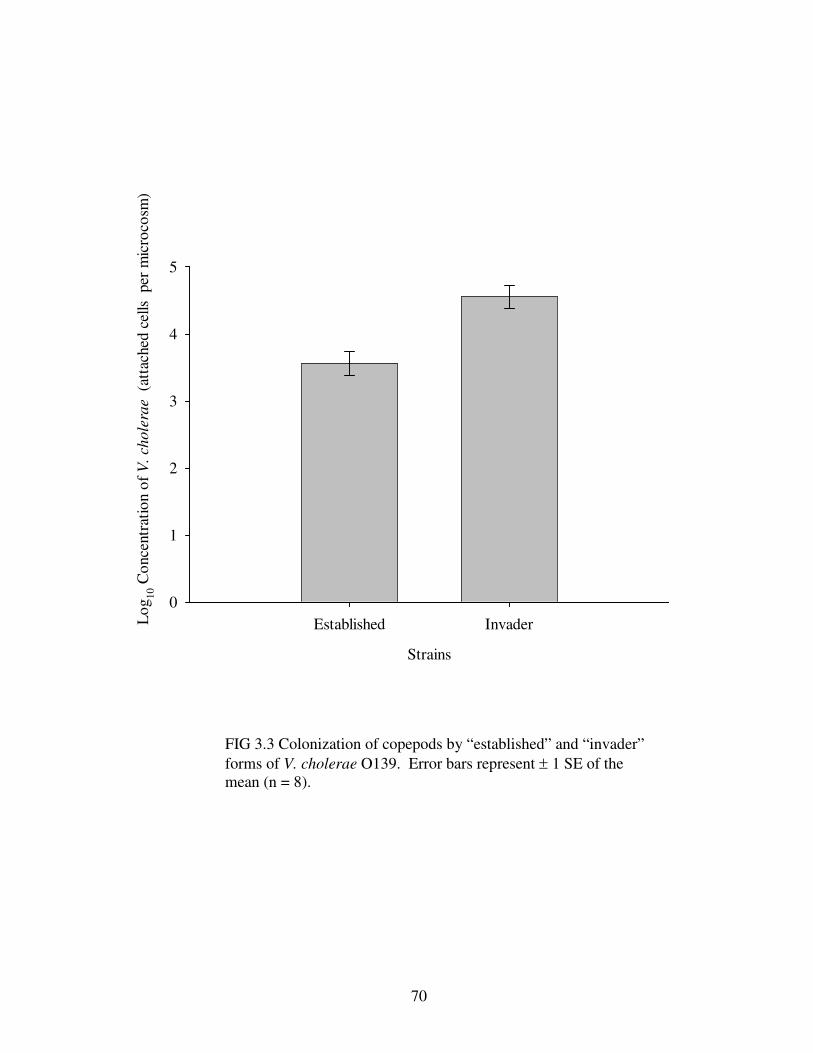
70
Strains
Established InvaderLog
10 C
once
ntra
tion
of V
. cho
lera
e (
atta
ched
cel
ls p
er m
icro
cosm
)
0
1
2
3
4
5
FIG 3.3 Colonization of copepods by “established” and “invader” forms of V. cholerae O139. Error bars represent ± 1 SE of the mean (n = 8).
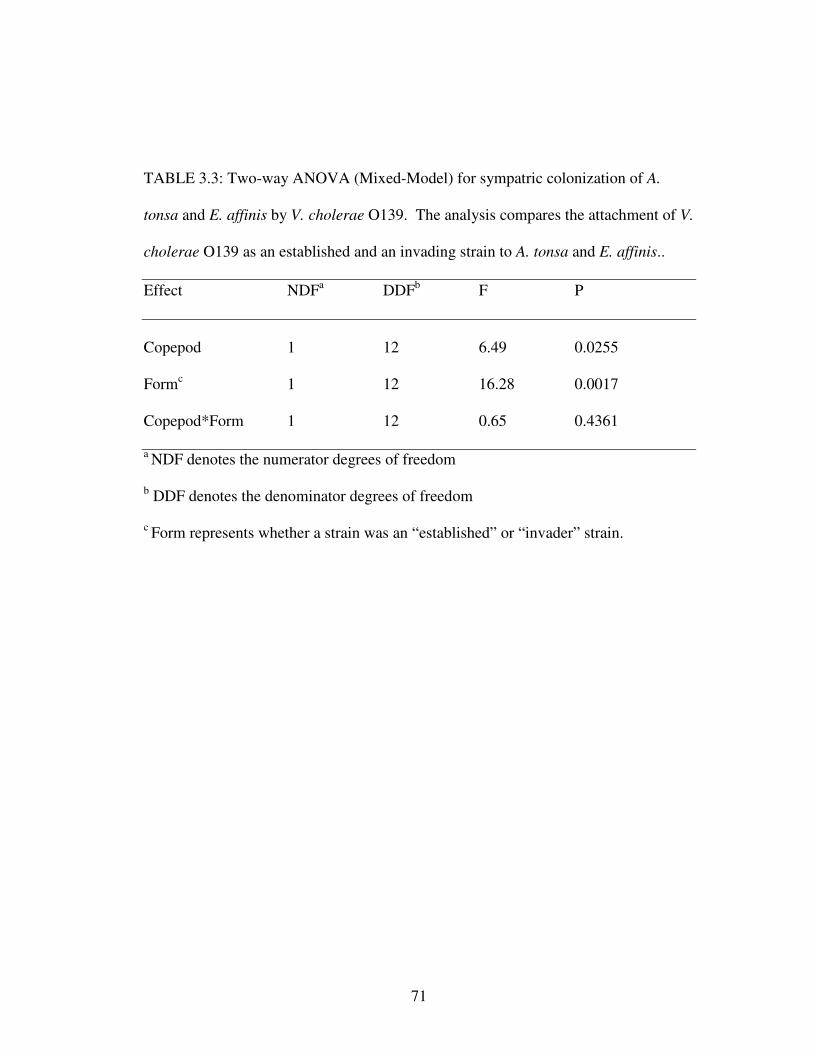
71
TABLE 3.3: Two-way ANOVA (Mixed-Model) for sympatric colonization of A.
tonsa and E. affinis by V. cholerae O139. The analysis compares the attachment of V.
cholerae O139 as an established and an invading strain to A. tonsa and E. affinis..
Effect NDFa DDFb F P
Copepod 1 12 6.49 0.0255
Formc 1 12 16.28 0.0017
Copepod*Form 1 12 0.65 0.4361
a NDF denotes the numerator degrees of freedom
b DDF denotes the denominator degrees of freedom
c Form represents whether a strain was an “established” or “invader” strain.
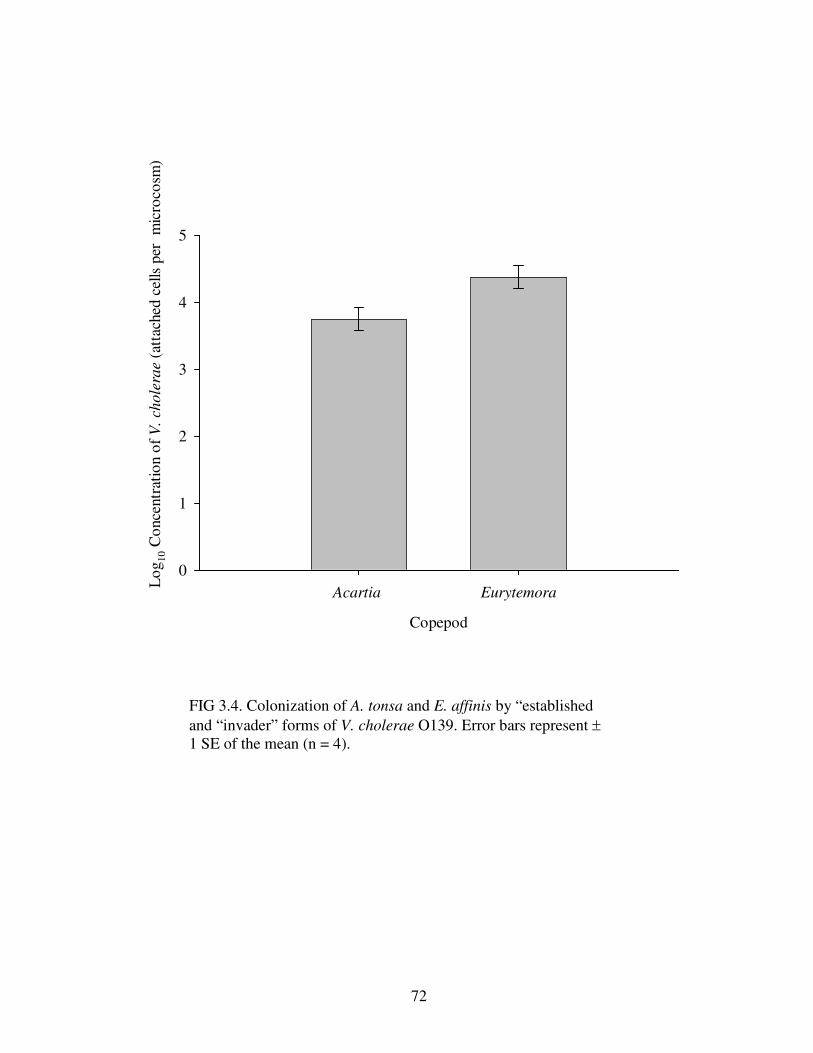
72
Copepod
Acartia Eurytemora
Log
10 C
once
ntra
tion
of V
. cho
lera
e (a
ttac
hed
cells
per
mic
roco
sm)
0
1
2
3
4
5
FIG 3.4. Colonization of A. tonsa and E. affinis by “established and “invader” forms of V. cholerae O139. Error bars represent ±1 SE of the mean (n = 4).
73
3.3.2 Chitin Utilization
Results showed that soluble chitin contributed to the growth of both V.
cholerae O1 El Tor and O139 Bengal (Fig. 3.5). The presence of a third level
interaction demonstrates that time has an effect on the growth of V. cholerae O1 and
O139 when in the presence or absence of soluble chitin. It is clear that growth for
both V. cholerae O1 and O139 was significantly greater in the presence of soluble
chitin than in filtered river water alone (Table 3.4). Multiple pairwise comparisons
adjusted using Tukey-Kramer to control experimentwise error showed that O1 and
O139 were not significantly different when grown using soluble chitin as growth
substrate.
Exponential growth of both V. cholerae O1 and O139, utilizing soluble chitin
as a resource, demonstrated a faster rate of increase as seen by the steeper slope of
soluble chitin compared to the slope of exponential growth using river water nutrients
(Fig. 3.5). V. cholerae O1 and O139 also entered stationary growth phase quicker in
soluble chitin microcosms.
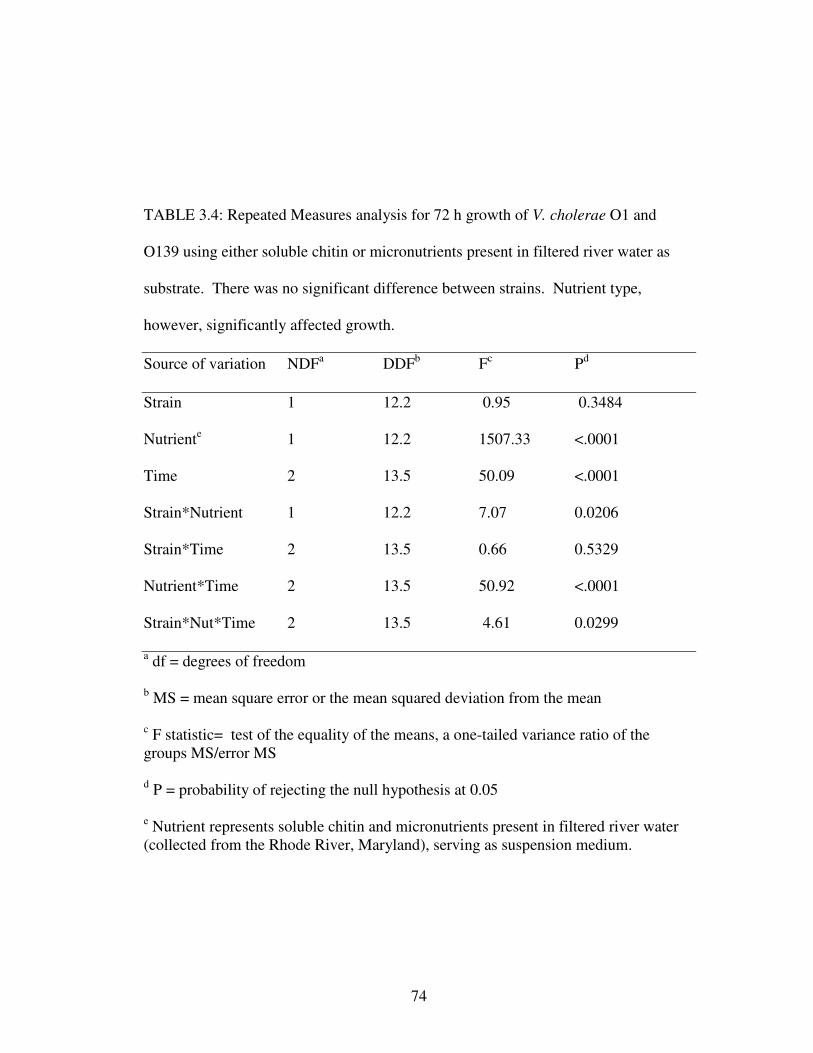
74
TABLE 3.4: Repeated Measures analysis for 72 h growth of V. cholerae O1 and
O139 using either soluble chitin or micronutrients present in filtered river water as
substrate. There was no significant difference between strains. Nutrient type,
however, significantly affected growth.
Source of variation NDFa DDFb Fc Pd
Strain 1 12.2 0.95 0.3484
Nutriente 1 12.2 1507.33 <.0001
Time 2 13.5 50.09 <.0001
Strain*Nutrient 1 12.2 7.07 0.0206
Strain*Time 2 13.5 0.66 0.5329
Nutrient*Time 2 13.5 50.92 <.0001
Strain*Nut*Time 2 13.5 4.61 0.0299
a df = degrees of freedom
b MS = mean square error or the mean squared deviation from the mean
c F statistic= test of the equality of the means, a one-tailed variance ratio of the groups MS/error MS
d P = probability of rejecting the null hypothesis at 0.05
e Nutrient represents soluble chitin and micronutrients present in filtered river water (collected from the Rhode River, Maryland), serving as suspension medium.
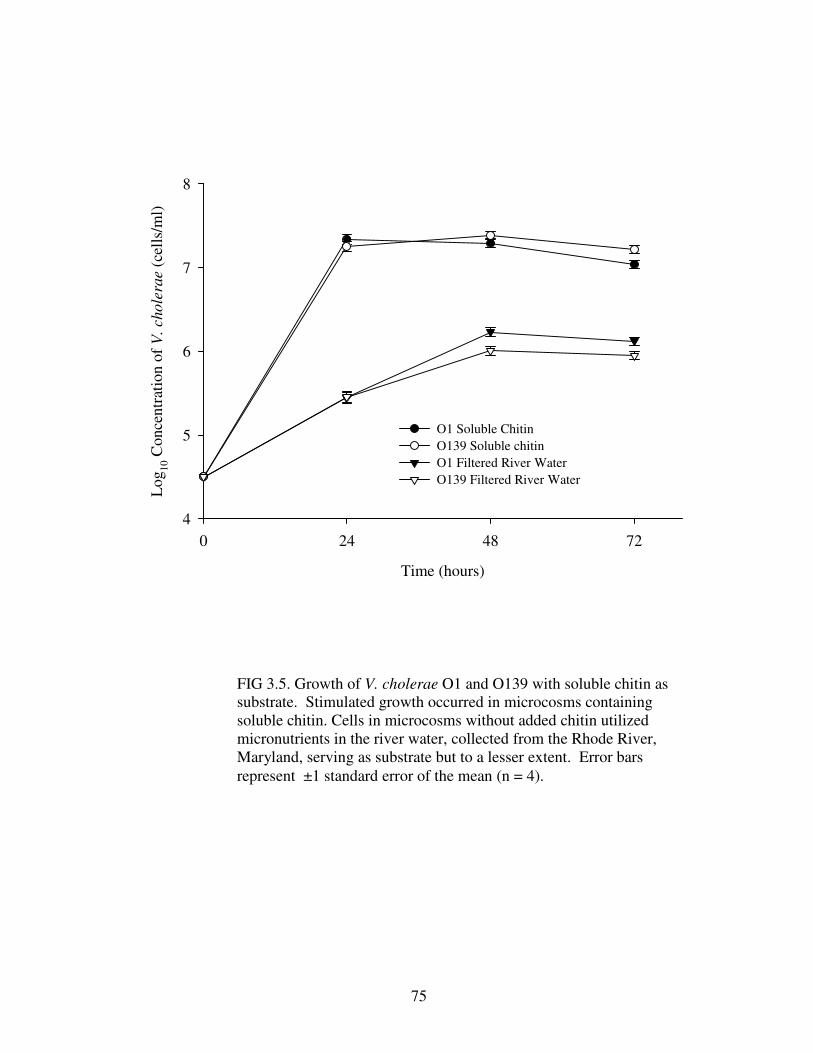
75
FIG 3.5. Growth of V. cholerae O1 and O139 with soluble chitin as substrate. Stimulated growth occurred in microcosms containing soluble chitin. Cells in microcosms without added chitin utilized micronutrients in the river water, collected from the Rhode River, Maryland, serving as substrate but to a lesser extent. Error bars represent ±1 standard error of the mean (n = 4).
Time (hours)
0 24 48 72
Log
10 C
once
ntra
tion
of
V. c
hole
rae
(cel
ls/m
l)
4
5
6
7
8
O1 Soluble ChitinO139 Soluble chitinO1 Filtered River WaterO139 Filtered River Water

76
3.3.3 Competition for Soluble Chitin
Relative fitness assays between the two serogroups, showed no significant
difference between ratios of mixed treatments but a significant difference between
relative fitness of V. cholerae O1 compared to O139 measured from 0-24 and 24-72
hours (Table 3.5). After 24 h, there was a one to one relationship between V.
cholerae O1 and O139 (Fig 3.6). Relative fitness after 72 h, however, showed a
significant change in fitness between V. cholerae O1 and O139 (Table 3.5), which
demonstrated either a decrease in the growth rate of V. cholerae O1, an increase in
the growth rate of V. cholerae O139, or both (Fig 3.6).
To evaluate the change in relative fitness, the absolute rate of change in
population density was computed between 24 to 72 h for both V. cholerae O1 and
O139 (adapted from Turner et al., 1996). Results showed that V. cholerae O139 had
net growth in the presence of O1, whereas O1 had a negative growth rate when mixed
with O139 (Fig. 3.7; ANOVA, f = 33.01, p <0.0001). Similarly, single strain
microcosms containing only V. cholerae O1 showed negative rates of change but
microcosms with only V. cholerae O139 bacteria demonstrated no net change (Fig.
3.8).
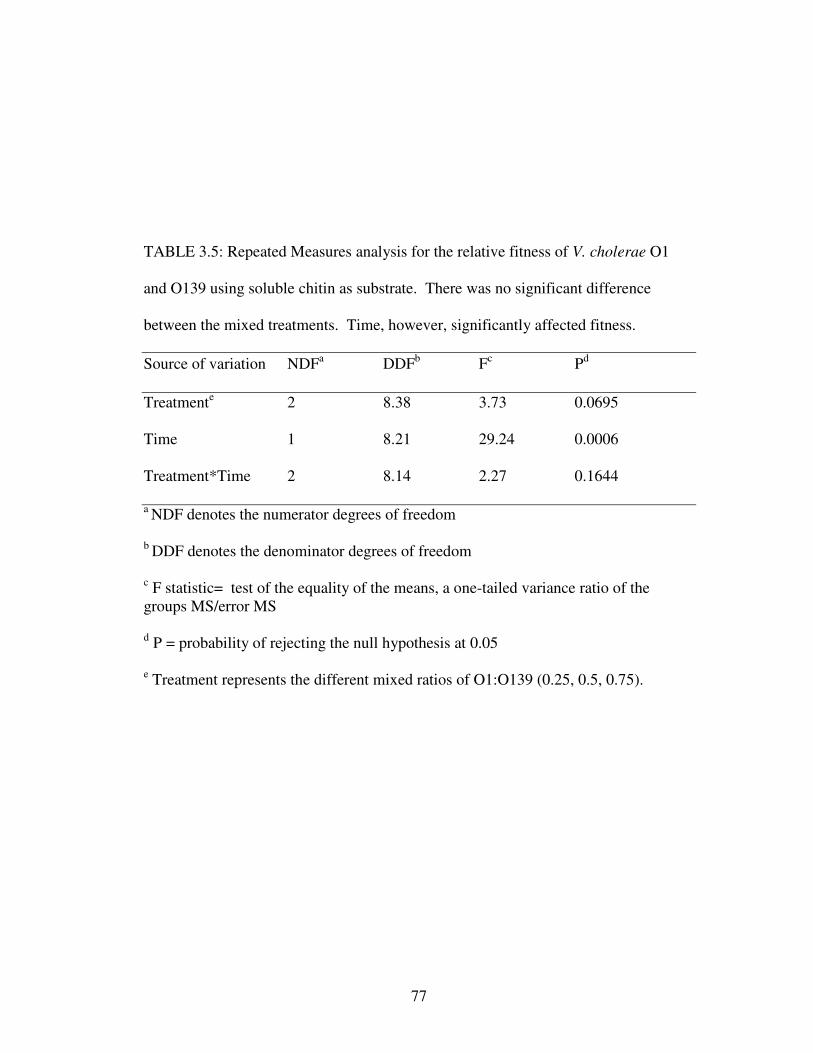
77
TABLE 3.5: Repeated Measures analysis for the relative fitness of V. cholerae O1
and O139 using soluble chitin as substrate. There was no significant difference
between the mixed treatments. Time, however, significantly affected fitness.
Source of variation NDFa DDFb Fc Pd
Treatmente 2 8.38 3.73 0.0695
Time 1 8.21 29.24 0.0006
Treatment*Time 2 8.14 2.27 0.1644
a NDF denotes the numerator degrees of freedom
b DDF denotes the denominator degrees of freedom
c F statistic= test of the equality of the means, a one-tailed variance ratio of the groups MS/error MS
d P = probability of rejecting the null hypothesis at 0.05
e Treatment represents the different mixed ratios of O1:O139 (0.25, 0.5, 0.75).
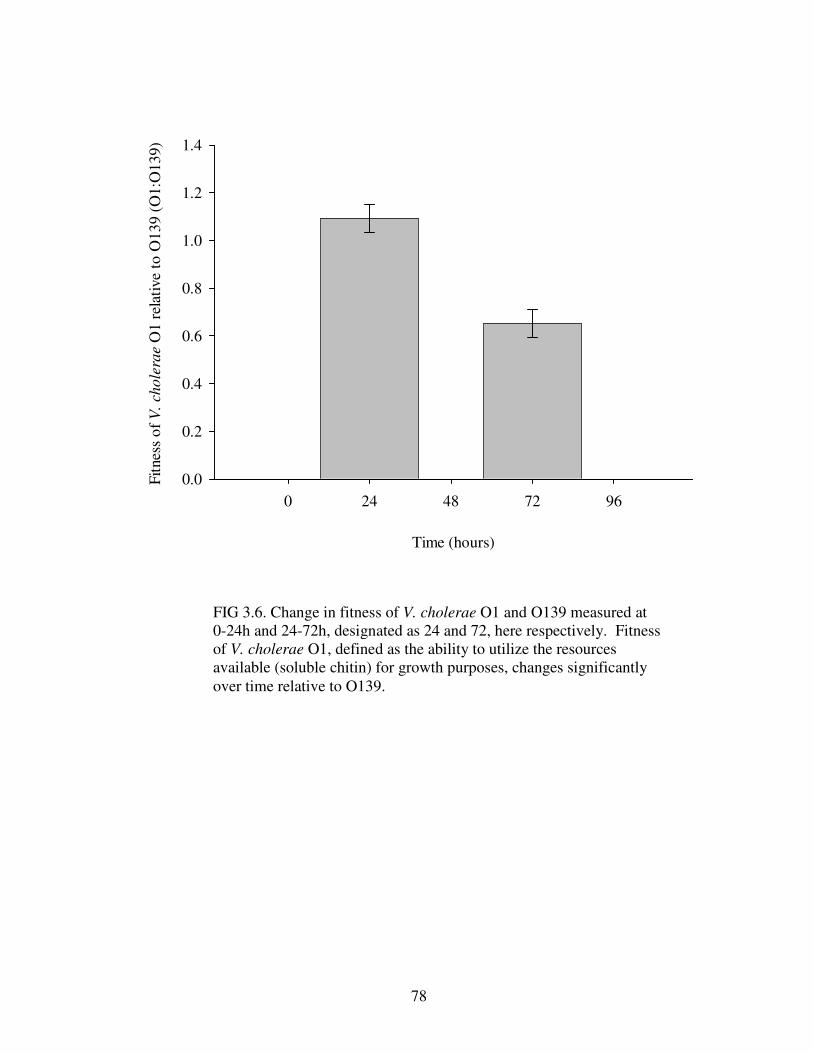
78
FIG 3.6. Change in fitness of V. cholerae O1 and O139 measured at 0-24h and 24-72h, designated as 24 and 72, here respectively. Fitness of V. cholerae O1, defined as the ability to utilize the resources available (soluble chitin) for growth purposes, changes significantly over time relative to O139.
Time (hours)
0 24 48 72 96
Fitn
ess
of V
. cho
lera
e O
1 re
lativ
e to
O13
9 (O
1:O
139)
0.0
0.2
0.4
0.6
0.8
1.0
1.2
1.4
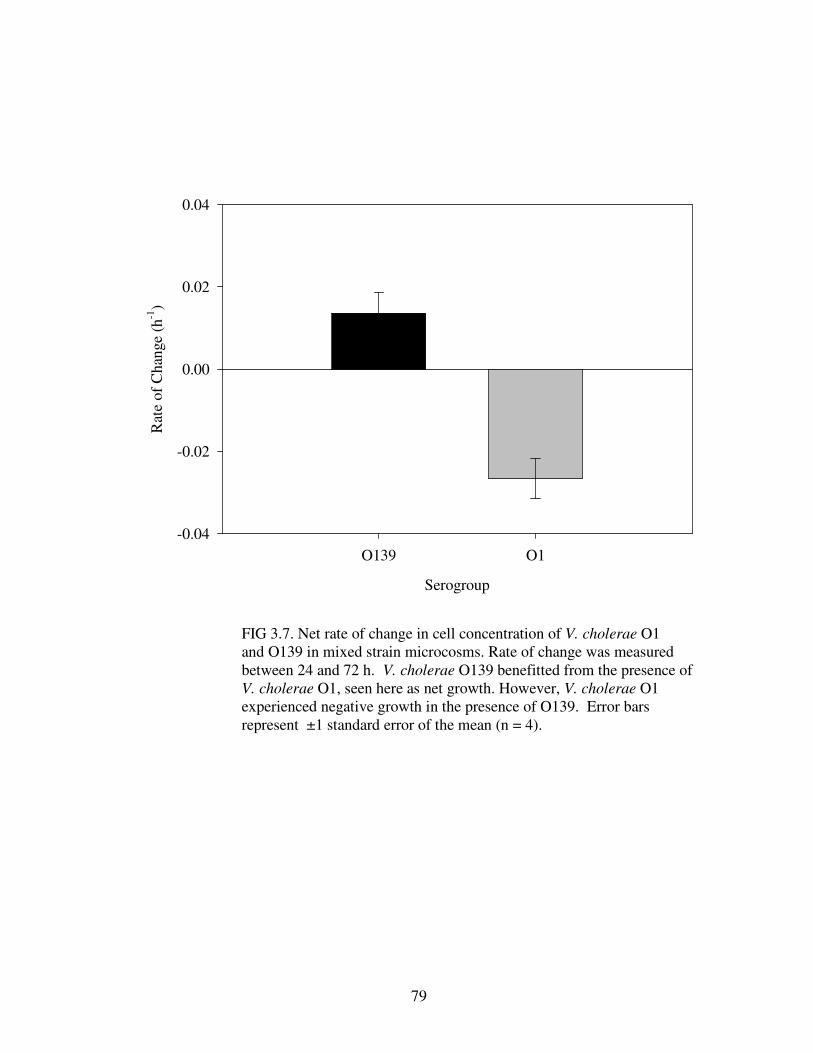
79
FIG 3.7. Net rate of change in cell concentration of V. cholerae O1 and O139 in mixed strain microcosms. Rate of change was measuredbetween 24 and 72 h. V. cholerae O139 benefitted from the presence of V. cholerae O1, seen here as net growth. However, V. cholerae O1experienced negative growth in the presence of O139. Error barsrepresent ±1 standard error of the mean (n = 4).
Serogroup
O139 O1
Rat
e of
Cha
nge
(h-1
)
-0.04
-0.02
0.00
0.02
0.04
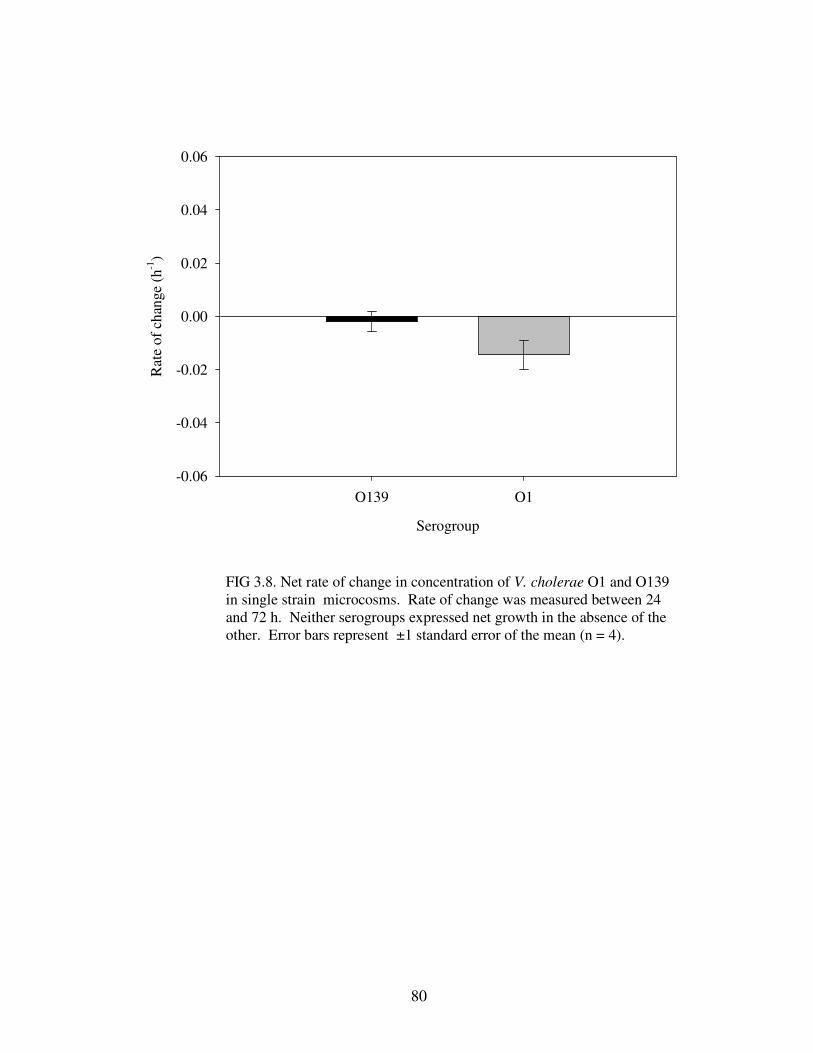
80
FIG 3.8. Net rate of change in concentration of V. cholerae O1 and O139in single strain microcosms. Rate of change was measured between 24 and 72 h. Neither serogroups expressed net growth in the absence of the other. Error bars represent ±1 standard error of the mean (n = 4).
Serogroup
O139 O1
Rat
e of
cha
nge
(h-1
)
-0.06
-0.04
-0.02
0.00
0.02
0.04
0.06
81
Results of the competition assay showed that V. cholerae O1 grown in mixed
and single cultures changed significantly in concentration from each other over time
(Table 3.6), whereby the presence of V. cholerae O139 influenced the growth of V.
cholerae O1, such that O1 begins to sharply decline after 24h as compared with
single cultures of V. cholerae O1 (Fig. 3.9). However, the presence of V. cholerae
O1 did not have the same effect on V. cholerae O139 (Table 3.7). In fact, by 48 h V.
cholerae O139 in mixed cultures was not significantly different than V. cholerae
O139 in single cultures (Fig 3.10).
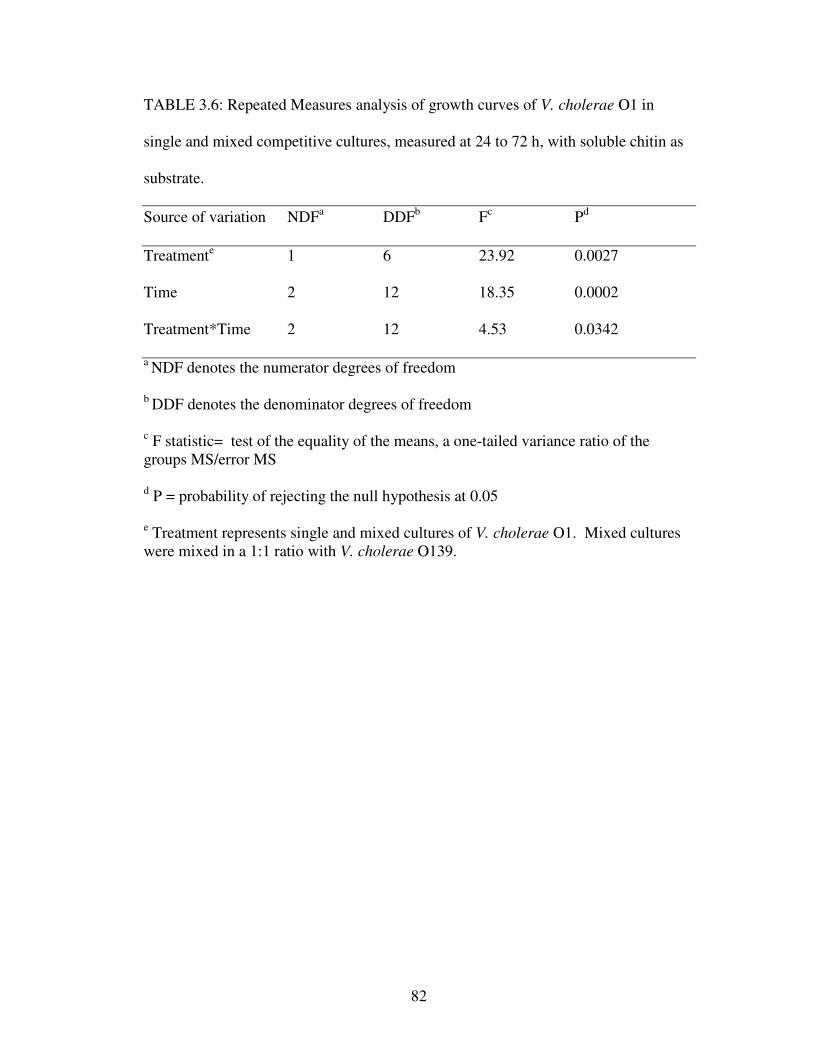
82
TABLE 3.6: Repeated Measures analysis of growth curves of V. cholerae O1 in
single and mixed competitive cultures, measured at 24 to 72 h, with soluble chitin as
substrate.
Source of variation NDFa DDFb Fc Pd
Treatmente 1 6 23.92 0.0027
Time 2 12 18.35 0.0002
Treatment*Time 2 12 4.53 0.0342
a NDF denotes the numerator degrees of freedom
b DDF denotes the denominator degrees of freedom
c F statistic= test of the equality of the means, a one-tailed variance ratio of the groups MS/error MS
d P = probability of rejecting the null hypothesis at 0.05
e Treatment represents single and mixed cultures of V. cholerae O1. Mixed cultures were mixed in a 1:1 ratio with V. cholerae O139.
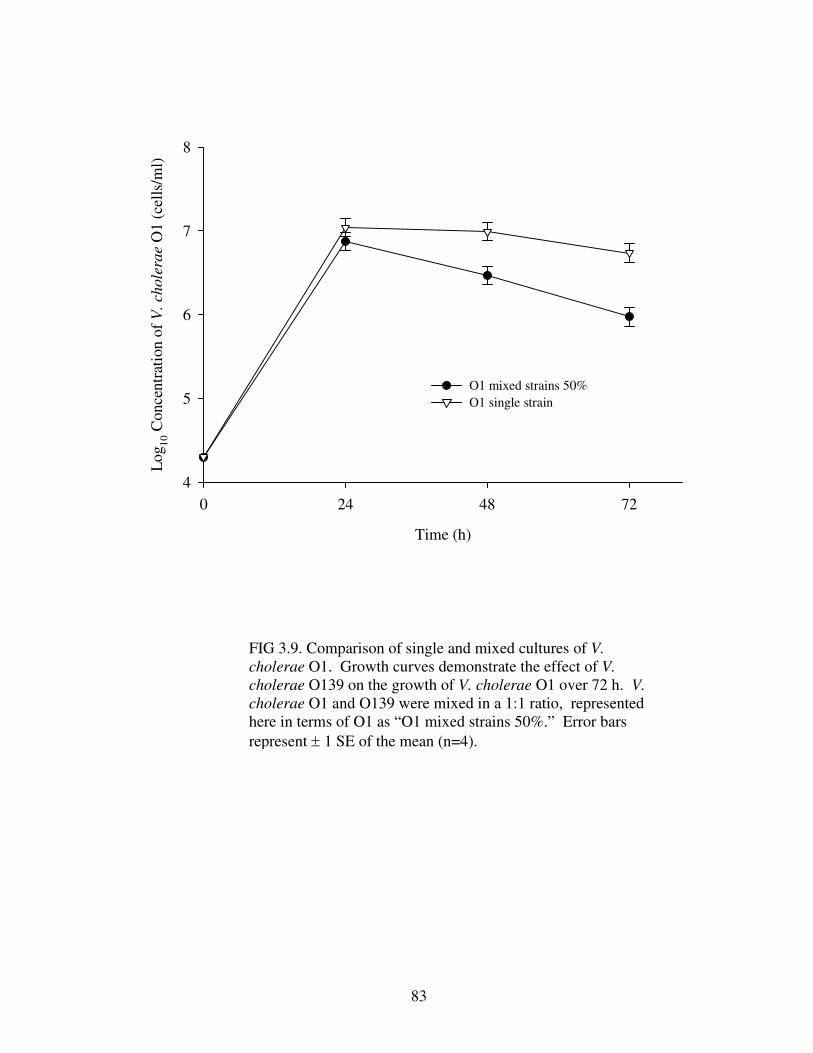
83
FIG 3.9. Comparison of single and mixed cultures of V. cholerae O1. Growth curves demonstrate the effect of V. cholerae O139 on the growth of V. cholerae O1 over 72 h. V. cholerae O1 and O139 were mixed in a 1:1 ratio, represented here in terms of O1 as “O1 mixed strains 50%.” Error bars represent ± 1 SE of the mean (n=4).
Time (h)
0 24 48 72
Log
10 C
once
ntra
tion
of
V. c
hole
rae
O1
(cel
ls/m
l)
4
5
6
7
8
O1 mixed strains 50%O1 single strain
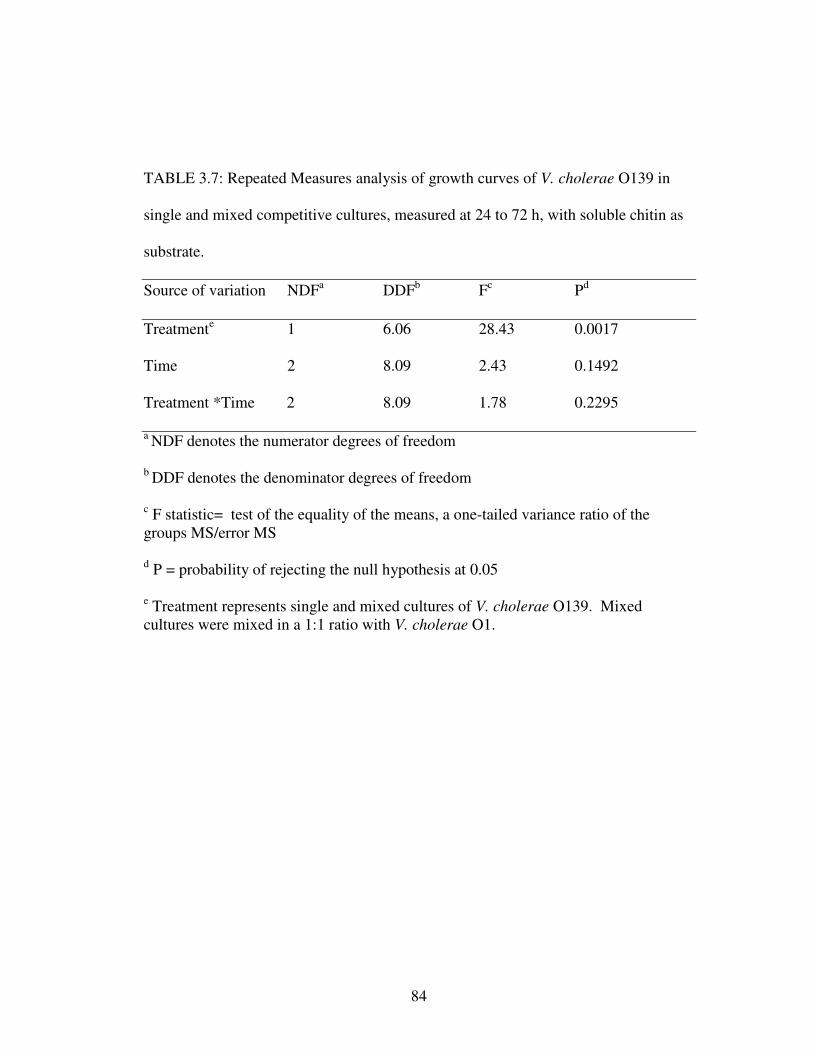
84
TABLE 3.7: Repeated Measures analysis of growth curves of V. cholerae O139 in
single and mixed competitive cultures, measured at 24 to 72 h, with soluble chitin as
substrate.
Source of variation NDFa DDFb Fc Pd
Treatmente 1 6.06 28.43 0.0017
Time 2 8.09 2.43 0.1492
Treatment *Time 2 8.09 1.78 0.2295
a NDF denotes the numerator degrees of freedom
b DDF denotes the denominator degrees of freedom
c F statistic= test of the equality of the means, a one-tailed variance ratio of the groups MS/error MS
d P = probability of rejecting the null hypothesis at 0.05
e Treatment represents single and mixed cultures of V. cholerae O139. Mixed cultures were mixed in a 1:1 ratio with V. cholerae O1.
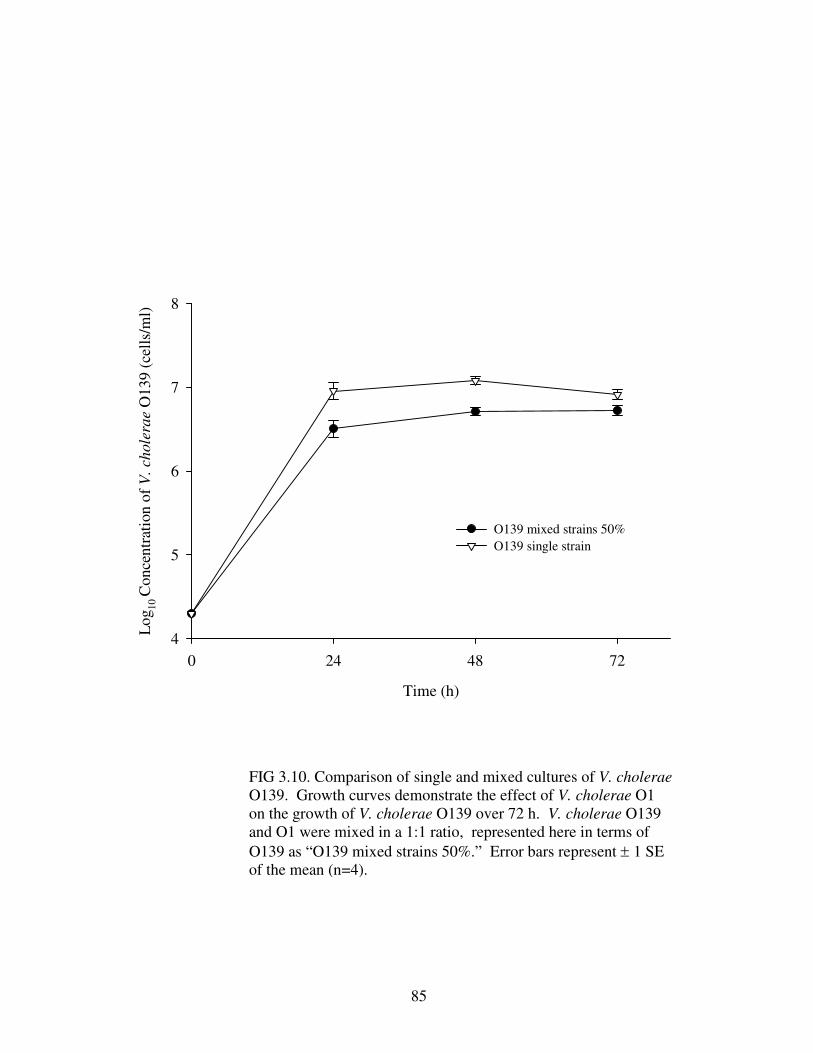
85
FIG 3.10. Comparison of single and mixed cultures of V. choleraeO139. Growth curves demonstrate the effect of V. cholerae O1 on the growth of V. cholerae O139 over 72 h. V. cholerae O139 and O1 were mixed in a 1:1 ratio, represented here in terms of O139 as “O139 mixed strains 50%.” Error bars represent ± 1 SE of the mean (n=4).
Time (h)
0 24 48 72
Log
10 C
once
ntra
tion
of
V. c
hole
rae
O13
9 (c
ells
/ml)
4
5
6
7
8
O139 mixed strains 50%O139 single strain
86
3.4 DISCUSSION
3.4.1 Sympatric colonization of copepods
A difference in colonization of copepods demonstrated by V. cholerae O1 El
Tor and O139 Bengal., as presented in results of this study, supports reported
differences in zooplankton associated populations of the two serogroups from earlier
studies, whereby O1 was found in more plankton samples than O139 (Huq et al.,
1995). In the same study by Huq and colleagues, both serogroups also occurred
together. Co-occurrence, as reported here, demonstrated that colonization of the
copepod by one serogroup did not preclude attachment of another serogroup, nor did
the addition of more cells hinder growth or attachment of the previously established
cells. In fact, the data suggest that one serogroup already established on the copepod
may facilitate the colonization of the other serogroup. Since there are more than 200
serogroups of V. cholerae (but only two epidemic serogroups), this phenomenon will
need to be extended to other serogroups in the future. Possible mechanisms of
facilitation of bacterial attachment include cross-feeding on secondary metabolites,
transfer of genetic material., and biofilm formation and intra-biofilm cooperation.
Results reported here appear to belong in the category of biofilm cooperation but do
not rule out other forms of facilitation.
The ability to attach to copepods even when an established population of V.
cholerae may be present would be important, especially, during a cholera epidemic
when V. cholerae cells are returned to the aquatic environment through fecal
shedding. Passage through the human gut increases infectivity of V. cholerae O1,
87
with enhanced pathogenicity retained upon reentry into the aquatic environment
(Merrell et al., 2002). Increased patch density of copepods during blooms and
increased numbers of V. cholerae cells through proliferation in the aquatic
environment and proliferation in the human gut can facilitate increased colonization
of cells that have greater infectivity. With this in mind, it is evident that not only is
initial transmission important in defining an epidemic, but also the physiological state
of cells returned to the aquatic system from the human gut and their ability to
colonize plankton.
It is unclear what stimulated additional attachment or growth of V. cholerae
cells already established in the microcosm. However, research has shown that
biofilm formation on solid substrates are especially important in oligotrophic
environments, enabling bacteria to take advantage of the trapping of nutrients by
channels formed through three dimensional structure of the biofilm (Marshall, 1976;
Geesey et al., 1978). Thus, V. cholerae added to nutrient poor microcosms that
already contained V. cholerae may have stimulated an increase in cell attachment to
copepods. Additional V. cholerae cells added to microcosms would also increase the
probability of contact between copepods and V. cholerae, possibly facilitating an
increase in cells attached. Furthermore, such additions revealed that the association
of copepods and V. cholerae cells that were already established in the system was not
deterred, suggesting that colonization may protect attached cells from biotic
perturbations.
88
3.4.2 Chitin Utilization
Results from the chitin utilization assay demonstrated similar growth patterns
in the presence of soluble chitin for the strains of V. cholerae O1 and O139 examined
in this study. Low molecular weight nutrients present in river water could account for
the growth in control microcosms. Results from previous investigations of V.
cholerae in sterilized estuarine water showed significant growth, proposed as a result
of available micronutrients and absence of competing organisms (Hood and Ness,
1982). Additionally, V. cholerae has been shown to survive under various salinities
and temperatures simulating estuarine conditions, even when nutrient concentrations
were limited or absent (Singleton et al., 1982a, 1982b; Miller et al., 1984).
Although soluble chitin stimulated increased V. cholerae cell growth, both
serogroups reached carrying-capacity 24 h before V. cholerae grown on river water
nutrients, suggesting different efficiencies and pathways used to metabolize the
nutrients. Differences in the amount of waste build-up in the two systems may also
contribute to differential onset of stationary growth, as a greater number of cells
would produce more secondary metabolites.
3.4.3 Competition for Soluble ChitinAt these densities and chitin concentration, different ratios of the two
serogroups did not demonstrate strong frequency-dependent competition that could
suggest stabilizing coexistence. However, a change in relative fitness over time
demonstrated differences in ability to utilize chitin between the two strains. The
change of relative fitness was evident in competition assays showing that the presence
89
of V. cholerae O139 influenced a decline in V. cholerae O1 but not vice versa,
suggesting that V. cholerae O139 is a better competitor for soluble chitin in the
presence of O1. Results presented here also showed different rates of change of the
two serogroup strains between 24 and 72 h, suggesting that the change in relative
fitness results from both a decrease in V. cholerae O1 cells and an increase in V.
cholerae O139 cells. Increase of the latter, although positive in direction, was
insignificant in magnitude, as revealed by nonsignificant growth of V. cholerae O139
in mixed cultures from 24 to 72 h. Extending the time frame of the experiment may
reveal significant growth of V. cholerae O139 during the latter time periods but it was
not evident here.
Soluble chitin as substrate in this experiment may not represent the complete
activity of serogroups on insoluble chitin exoskeletons in the aquatic environment. In
chitin degradation, V. cholerae most probably attaches to the chitin polymer, degrades
it to soluble oligosaccharides extracellularly, further hydrolyzes the oligosaccharides
to N-acetylglucosamine which is converted to glucosamine-6-P, and finally to
fructose-6-P, intracellularly, in the periplasmic space, as shown for V. furnissii (Yu et
al., 1991; Bassler et al., 1991b). Furthermore, Kaneko and Colwell (1975) suggested
that adsorption of Vibrio parahaemolyticus to copepod exoskeletons may be
complicated by materials secreted by the copepod, i.e., the epicuticle secreted by the
tegumental gland, which covers the exoskeleton. Therefore, differences in the use of
copepods as resource occurring between V. cholerae O1 and O139 may begin at steps
involved in attaching to and breaking-down the insoluble form, such as the
differences revealed between the two serogroups in this and the previous chapter
90
when comparing their ability to colonize copepod substrates. Once attached,
however, superior uptake and efficient integration of chitin and other nutrients into
new cells by one serogroup may generate a situation where there is a competitive
dominant and a competitive inferior.
3.4.4 Possible Mechanisms of Coexistence
Ecological theorists are beginning to recognize the importance of facilitation,
i.e., positive interactions, among organisms as influential in structuring communities
(Bruno et al., 2003). Studies of microbial biofilms and surface-attached bacterial
physiology and structure are providing evidence to support facilitation as a factor
meriting inclusion in niche theory. For instance, Palmer et al. (2001) reported
enhanced growth of biofilm forming species involved in dental plaque formation as a
result of interspecies and intergeneric facilitation, whereby dental plaque-forming
species flourished in numbers together that they were unable to achieve individually.
Furthermore, Nielsen et al. (2000) showed that metabolic commensalism of bacterial
species, i.e., cross-feeding, where one species metabolizes the secondary metabolites
of the other, can influence the spatial structure of biofilms. When cross-feeding
occurred, so did mixed biofilm formation. However, when cross-feeding did not
occur, species grew in unassociated microcolonies.
If sympatric existence of V. cholerae O1 and O139 involves facilitation, then
interactions may be contact dependent, whereby cells that are already established in
the copepod microhabitat provide a three-dimensional structure, potentially making it
easier for further attachment and biofilm formation by other strains. An established
91
three-dimensional biofilm structure may be more important for attachment by V.
cholerae O139. That is, its performance as an invader versus as an established strain,
reported in this study, suggests that its ability to form biofilms to previously attached
V. cholerae biofilms may be superior to its ability to attach directly to live calanoid
copepod carapace. Furthermore, this study and the study in the previous chapter
show that V. cholerae O139 attaches in smaller numbers compared to O1.
Research has shown that V. cholerae O139 develops biofilm more rapidly
than V. cholerae O1 El Tor (Watnick et al., 2001). While V. cholerae O139 may
produce biofilm more effectively, the results of this study and of other investigations
(Chiavelli et al., 2001) showed that V. cholerae O1 El Tor colonized zooplankton
more efficiently. It has been suggested that the exopolysaccharide produced by V.
cholerae O139 may shield much of the chitin attachment proteins responsible for
attachment to zooplankton, making it difficult to colonize zooplankton in greater
numbers (Chiavelli et al., 2001). Secondary stages of biofilm formation,
characterized by surface accumulation of cellular aggregates and mediated by
polysaccharide production, as demonstrated by Staphyloccus epidermidis (Heilmann
et al., 1996), may be more important in facilitating the association of V. cholerae
O139 with copepods, than attachment proteins alone.
If facilitation of biofilm by pre-established V. cholerae O1, in fact, does occur,
then V. cholerae O1 may provide V. cholerae O139 with the opportunity to attach to
calanoid copepods in greater numbers. Such facilitative interactions would promote
increased use of a portion of the fundamental niche space already occupied, resulting
in periods of sympatry (Bruno et al., 2003). Bruno et al. (2003) further suggested that
92
the presence of facilitative interactions does not necessarily exclude competitive
interactions. In fact, Griffin et al. (2004) demonstrated that the amount of
cooperation in pathogenic bacteria can depend on the scale of competition and
relatedness, such that the influence of relatedness on cooperation begins to decay as
competition becomes more local. The degree of relatedness between V. cholerae O1
and O139 may have an influence on facilitative colonization presented here but it is
unclear to what extent. Possible facilitative interactions, however, do not entirely
explain coexistence or the yearly fluctuations in prevalence between V. cholerae O1
and O139, as there seems to be conditions in which one is favored over the other.
Frequency-dependent selection has been hypothesized as one of many
mechanisms to maintain genetic polymorphisms and stable coexistence in natural
populations, whereby each genotype has the ability to invade an established
population when it is rare (Haldane and Jayakar, 1963; Ayala and Cambell, 1974;
Levin, 1988). It is unclear whether frequency dependence can explain the
coexistence between V. cholerae O1 and O139 in the aquatic environment or whether
stable coexistence exists within copepod patches. A colonization-competition trade-
off more appropriately fits the results of this study. Metapopulation theory suggests
that coexistence between species will occur, if there is a trade-off between
colonization and competition, such that the species that has superior colonization
ability is an inferior competitor, comparatively (Hanski, 1983, 1994, Amarasekare
and Nisbet, 2001). This trade-off enables successional use of patches in habitats
without regional extinction of either genotype. Colonization results obtained in this
study showed that V. cholerae O1 attached to copepods in greater numbers over 24 h
93
whereas fitness assays demonstrated that V. cholerae O139 continued stationary
growth or persistence on nutrients for a greater period of time.
Without further experimentation, mechanisms of coexistence between the two
serogroups in the copepod microhabitat remain hypothetical. Other factors that can
contribute to the dynamics of V. cholerae and cholera outbreaks may also influence
coexistence of epidemic serogroups. For instance, coexistence may, in part, be
correlated with the changes in the relative competitive abilities of clones. Results of
molecular investigations demonstrated that there is sufficient genetic variation within
these populations that annual competitive abilities may fluctuate (Faruque et al.,
1997a). For example, the V. cholerae O1 El Tor clone that emerged as the epidemic-
causing strain in 1996, after the emergence of V. cholerae O139 Bengal., was shown
to be genetically distinct from the El Tor strain that occurred pre-Bengal (Faruque et
al., 1997a). Genetic changes have also been revealed for V. cholerae O139 since its
initial emergence. Furthermore, genetic and phenotypic differences i.e., in sugar
profiles and in polysaccharide production may suggest that V. cholerae O1 and O139
largely use different parts of the aquatic habitat, enabling them to coexist regionally
in bays, estuaries, and river systems.
Interactions of genotypes of V. cholerae both within the aquatic environment
and in the human gut, combined with selection, may drive genetic change,
influencing the structure and function of the population and ultimately feeding back
into genetic differences and emergence of new clones. Simply stated: subtle genetic
differences among individual strains can have broader implications for ecological

94
interactions among populations, community fluxes, and evolutionary dynamics
(Bohannan and Lenski, 2000).
Although the results presented here give some insight into the ecology of V.
cholerae and copepods, to understand more fully the relationship between the two
serogroups, copepods, and endemic patterns of cholera will require further research.
Determining growth and competition in the presence of zooplankton exudates would
provide useful information about the use of such nutrients by the epidemic serogroups
of V. cholerae. Distinguishing between colonization and growth on copepods may
reveal different results for competition of nutrients that could disprove the detrimental
effect of V. cholerae O139 on the growth of O1, as differences in acquisition of and
metabolizing nutrients by bacteria when attached to a substrate compared to bacteria
that are planktonic are often different (Costerton et al., 1987). Furthermore,
investigations into the effect of seasonal factors, i.e., temperature, salinity, and pH
that have been shown to influence the patterns of cholera epidemics, on the V.
cholerae O1/O139-plankton relationship, could help elucidate further the nature of
epidemics caused by V. cholerae O139.
95
Chapter 4: Implications of copepod patchiness on V. cholerae distribution
Ecology of Vibrio cholerae is inherently complex due to the multi-
environment existence of V. cholerae. Biotic and abiotic factors and interactions
within fluctuating aquatic environments and in the human intestines expose V.
cholerae to a range of conditions far more extensive than the experiments presented
in this dissertation were able to explore. Results here are limited in their description
of the V. cholerae-copepod relationship both in time and with respect to specific
particular biotic and abiotic conditions. The results, however, showed that different
copepod species and life stages can have different influences on colonization by V.
cholerae O1 and O139. Furthermore, when V. cholerae O1 and O139 were
sympatric, there were no obvious competitive influences on colonization of copepods
but competitive effects were present when the serogroups used soluble chitin as a
nutrient source under the conditions employed in this study. These results warrant
further investigation and discussion, as the copepod-V. cholerae relationship is
complex at many different spatiotemporal scales and may change if different strains
of V. cholerae O1 and O139 are explored.
The cholera problem encompasses fundamentals of biocomplexity, defined as,
"properties emerging from the interplay of behavioral., biological., chemical.,
physical., and social interactions that affect, sustain, or are modified by living
organisms" (Michener et al., 2001). V. cholerae bacteria are influenced by factors at
96
multiple scales and in multiple environments, i.e., genetic, ecological., local.,
regional., diurnal., seasonal., and annual. As described in previous chapters, V.
cholerae bacteria are affected by interactions in the aquatic environment and within
the human gut. Additionally, anthropogenic and large-scale climatic effects can
directly and indirectly influence V. cholerae distribution, transmission, and cholera
severity (Lobitz et al., 2000; Pascual et al., 2002).
The complexity of cholera epidemics derives at least in part from the occurrence of V.
cholerae as an epibiont in the fluctuating ecosystem of estuaries, rivers, and other
bodies of water. Field surveys and experimental investigations demonstrate the
importance of the V. cholerae-copepod relationship on the incidence and distribution
of V. cholerae in the aquatic environment and on cholera epidemics (Huq et al., 1983,
1984, 1994; Tamplin et al., 1990; Heidelberg et al., 2002a). However, in the
conventional view of V. cholerae distribution in the aquatic environment, it is
assumed implicitly that V. cholerae populations are evenly distributed wherever and
whenever present in the environment. Very little attention has been given to the
heterogeneity of its epibiont host (copepod) distribution and possible patchy existence
of V. cholerae as well. Any bacterial species that inhabits a transient habitat, such as
copepods will experience changes in number, quality, and spatial arrangement of
habitat patches over time. The life cycle of copepods, in turn, can exhibit strong
seasonal variation in distribution, size/age structure, and abundance.
Although attachment to copepods may facilitate dispersal greater distances as
compared with distances that V. cholerae could disperse alone, specific
spatiotemporal patterns of copepods that could influence cholera outbreaks have not
97
been fully explored, in part, due to the difficulty in finding endemic populations of V.
cholerae and the logistics and costs of large-scale sampling. Speirs et al. (2004)
developed a spatially explicit demographic model of copepod distributions that could
be beneficial to the on-going study of the complexity of cholera by elucidating spatial
and temporal maps of copepod recruitment and correlating them with epidemic V.
cholerae distributions. A brief discussion of the implications of copepod dynamics
on cholera epidemics, based on the results presented in this dissertation, results of
previous V. cholerae investigations, spatiotemporal patterns of copepods, and
ecological theories of interactions in stochastic environments, is provided as follows.
Plankton, by definition, are incapable of directly controlling their position in
relation to water current, and copepods are notoriously spatially heterogeneous.
Populations are distributed in patches, rather than distributed evenly, in the water
column, in part, influenced by the distribution of resources in stochastic aquatic
environments (Roughgarden, 1977). How patches are distributed can change
throughout the day due to vertical migration and can change seasonally due to biotic
and abiotic factors influenced by weather patterns. Copepod patches can be defined
by a number of attributes, i.e., patch intensity, spacing, species composition,
longevity, and spatial dimensions.
To address more effectively the ecological and evolutionary consequences of
plankton patchiness, Haury (1977) developed a conceptual framework that divided
the plankton aggregation continuum into categories at which spatial and temporal
patterns can be observed. These categories describe different scales of plankton
interaction and behavior, ranging from the large biogeographic patterns of oceans to
98
the micro-scale patterns of the individual. Each category encompasses different
aspects of copepod ecology, as different processes happen at various spatiotemporal
scales. Haury (1977) discussed how these categories could be used to explore
copepod dynamics. However, in this chapter these categories are used to explore how
different scales of copepod distribution could be used to determine how the copepod-
V. cholerae relationship at various scales could influence cholera. The epibiotic
nature of epidemic V. cholerae exposes the bacteria to patterns of copepod dynamics
at various scales, which may directly or indirectly influence local interactions and
regional persistence of endemic genotypes.
Of the categories presented by Haury (1977), meso, coarse, fine, and micro-
scale patterns are most appropriate to the discussion of physical and biological
influences of copepod aggregation on V. cholerae ecology. Meso to coarse scale
effects are large physical processes, i.e., upwelling events, tidal fronts and river
currents that can distribute copepods over long distances. Extensive spatial dispersal
could distribute V. cholerae from water bodies that contain endemic V. cholerae
populations to uncontaminated water bodies, spreading the possibility of infection
from one region to the next. The fine scale category comprises copepod dynamics at
the level of population and interactions of individuals. Reproduction rates, migration
among local populations, and other biological processes of copepods at this scale
affecting patch density and composition will have an impact on metapopulation
dynamics of V. cholerae. Micro-spatial scales occur, however, at the level of the
individual copepod. At this scale, local interactions of V. cholerae could affect
99
ecological and evolutionary trajectories of epidemic genotypes through cell-to-cell
interactions, influencing selection.
4.1 Large Geographic Patterns: meso- to coarse-scale
Large-scale influences on the spatiotemporal heterogeneity of copepods are
often associated with oceanic frontal zones and river currents. Processes that are
particularly significant to copepod distribution at this scale are long-distance dispersal
of patches and recruitment of juvenile stages. Meso-scale eddies, frontal zones, and
river currents can carry copepod patches over hundreds of kilometers (Haury et al.,
1977). This dispersal may be a significant factor explaining the transport of V.
cholerae and the regional spread of cholera across hundreds of kilometers in
Bangladesh. According to results presented here on the association of V. cholerae
with copepod nauplii, as well as plankton surveys employed in Bangladesh (Huq et
al., in preparation), large-scale dispersal of juvenile stages may be important, as the
recruitment of juvenile copepods may determine the onset of cholera.
Additionally, stochastic weather events can influence the magnitude of
processes at this scale. Siddique et al. (1996) suggested changes in climate, severe
weather patterns, and anthropogenic impacts on the environment may influence
patterns of cholera epidemics in Bangladesh:
In the past few decades, soil erosion and construction of barrages
and dams in the river system have affected the ecological balance
of the area. Increasingly severe flooding and prolonged
waterlogging affect mostly the northern and north-eastern
regions. The north-western region of the country is becoming
100
more and more arid due to reduced river flow. In the southern
region, a reduction of freshwater flow has changed the
hydrodynamics and resulted in an increase in salinity and
incursion of brackish water deeper inland. The Bay of Bengal is
subject to violent atmospheric turbulence in the form of
cyclones. The last major cyclone occurred in April 1991, when a
great tidal surge flooded the entire southern coast. This may
have affected the estuarine water quality by mixing sediments
dislodged by the force of the tidal surge. The changing
ecological balance of different regions of the country and
variations in their salinity and nutrient concentration were
thought to be associated with geographic clustering of El Tor and
classic biotypes of V. cholerae O1 prior to the emergence of
O139 strains. This may also be the case for the difference in the
distribution and dynamics of spread of O139 strains in
Bangladesh.
Siddique et al. (1996)
Increases in salinity along rivers, such as the incursion reported by Siddique et al.
(1996), can extend the distribution of copepod species up-stream. Furthermore,
severe weather events, such as cyclones, can potentially distribute coastal species
farther inland than usual. If inland habitats are already perturbed by physical
changes, then redistributed species could influence the composition of the endemic
copepod population. Overall, changes in the physical attributes of an ecosystem and
consequent influx of copepods carrying V. cholerae could affect the ecological
balance and influence the emergence of novel strains of V. cholerae, especially if
serogroups associate preferentially to a specific species, genus, or seasonal grouping
101
of copepods. For instance, if V. cholerae O139 attaches preferentially to benthic
copepods, as recent research suggests (Pruzzo, personal communication), then a
cyclonic event, such as the event Siddique et al. (1996) reported in 1991, may have
helped distribute copepods and the attached V. cholerae farther then they might
otherwise have migrated.
4.2 Population Interactions: fine-scale
Patch density and longevity caused by processes measured on the scale of
individual interactions, such as competition, coexistence, niche partitioning,
predation, and food acquisition may affect cholera spread, timing of peak infection
prevalence, and the biogeography of cholera outbreaks. For instance, V. cholerae
abundance positively correlates to the density of copepods (personal observation;
Colwell, 1996), possibly due to the fact that density facilitates easier dispersal and
colonization as dispersal distances from individual to individual are shorter.
Therefore, during seasons when copepod patch densities are thin or robust, cholera
prevalence may be similarly thin or robust.
Fine scale interactions can also influence species composition and distribution
of copepods and their epibionts. Threlkeld et al. (1993) demonstrated that the
prevalence of plankton infection by epibiotic ciliates correlated with the presence of a
specific zooplankton taxon, such that the abundance of that taxon strongly influenced
the abundance and seasonality of the cilitates. Thus, interactions like competition and
selective predation that might limit the distribution of specific copepods would be
important for epibionts as well.
102
Seasonal peaks of cholera outbreaks in Bangladesh are correlated with
geographical location, demonstrating that V. cholerae populations are distributed as a
metapopulation, whereby populations are regionally distributed in patches that are
separated in space rather than distributed evenly. Additionally, results from
investigations showing regional variation in genetic composition of phage types,
characterizing individual strains, similarly support the suggested distribution (Glass et
al., 1983). Persistence of regional distributions of patchy populations depends on a
number of factors, such as the availability of resources, habitat patch size, the degree
of isolation of patches, local interactions within patches, and the ability to disperse
from patch to patch (Levins, 1969; Hanski, 1983, 1994). As plankton may facilitate
nutrient acquisition by V. cholerae and its dispersal., colonizing mobile plankton
populations would enhance the regional distribution of V. cholerae. Furthermore,
close proximity to new colonizable substrate, i.e., egg sacs or embryos, may also be
important to both local and regional distribution of epidemic V. cholerae. Dwyer
(1991) demonstrated a similar dynamic while exploring the importance of host
density, patchiness, and larval presence in transmission of nuclear polyhedrosis virus
(NPV), an insect virus, from infected to healthy hosts. The results suggested that
larval stages were particularly important in the transmission and spread of NPV,
concluding that transmission models would benefit from including age-specific
dispersal rates as it pertains to biological controls (Dwyer, 1991). Similarly, eggs and
juvenile copepods provide a means for spread in the aquatic environment by
increasing available copepod surface area per cubic meter of water.

103
4.3 Individual Copepod: micro-scale
Molting rates, chemical cues, and bacterial interactions that could affect V.
cholerae distribution occur within the copepod spatiotemporal micro-scale. V.
cholerae growth and distribution may be affected by age-structured molting rate of
juvenile stages. Molting rates, which are linked to developmental and growth
phenomena of the copepod, change at different developmental stages due to
physiological processes, food availability, and temperature (Carlotti and Nival.,
1992). Chemicals produced by physiological changes of copepod juveniles may have
positive or negative effects on growth of V. cholerae. Certain attached genotypes
may be more or less sensitive to these chemicals than others, potentially generating
genotypes selection. Furthermore, molting could alleviate local interactions, such as
competition, by producing more epibiotic surface area. Therefore, different rates of
molting by juvenile copepod stages could influence the coexistence of genotypes,
depending on the duration of the stage (molting usually occurs within 2-6 days,
according to stage), as compared to the generation and competition period of V.
cholerae.
Close proximity of cells in and on copepods due to sympatric biofilm
formation enable horizontal gene transfer, facilitating ecological and possible
evolutionary changes mediated through sharing of genetic material (Souza et al.,
1991). Examples of gene transfer among V. cholerae genotypes are provided in
studies of molecular influences of cholera. For instance, results from research
demonstrates that V. cholerae O139 originated as a V. cholerae O1 El Tor genotype
and differentiated through a suite of deletions and genetic acquisitions (Bik et al.,
104
1995; Comstock et al., 1995). One particularly important genetic transfer event was
the acquisition of rfb genes from O22, O141, and other related non-O1 V. cholerae
that enable V. cholerae O139 to produce a polysaccharide capsule, differentiating it
from O1 (Bik et al., 1995, 1996; Comstock, 1995; Dumontier and Berche, 1998).
Additionally, cholera toxin is acquired by transduction of DNA from a filamentous
phage carrying the CTX genetic element, which can then be transferred laterally
between strains, influencing genetic variation and consequent selection of epidemic
genotypes (Waldor and Mekalanos, 1996). Cholera toxin can also be transferred to
non-epidemic strains, enabling them to cause disease.
Local interactions of V. cholerae, such as competition and facilitation on
copepods will influence the regional persistence of particular genotypes in the aquatic
environment and the quality and distribution of copepod patches will influence the
magnitude of V. cholerae spread, thus impacting cholera character and prevalence.
Furthermore, dynamics in the aquatic environment combined with amplification and
dispersal mechanisms that humans provide specifically impact the persistence of the
epidemic branch of V. cholerae.
Local interactions demonstrated in the results presented in this dissertation,
such as colonization, use of newly emerged substrate, and resource utilization, may
influence the composition of regional persistence as density of plankton patches and
concentrations of limiting nutrients fluctuate (Amarasekare and Nisbet, 2001).
Metapopulation models such as that proposed by Ruxton and Rohani (1998) describe
dispersal as fitness dependent, such that emigration from a site depends on relative
fitness at that site. If dispersal were dependent on fitness, it would help maintain
105
coexistence between V. cholerae O1 and O139 and sustain regional persistence of V.
cholerae O1, especially during inter-epidemic periods when nutrients are scarce.
Ruxton and Rohani further suggest that this type of fitness-dependent dispersal could
reduce chaotic fluctuations to simple cycles, synchronizing local population dynamics
across patches (Ruxton and Rohani, 1998). As copepod population densities and
diversity dwindle, coexistence between V. cholerae O1 and O139 may change.
Although scaling up from local interactions occurring in laboratory
experiments to large-scale ecosystem dynamics is limited in accuracy, the
implications are important to explore. Epidemiological models of cholera suggest
that results could benefit from the inclusion of ecological interactions between V.
cholerae and its environment. For example, Codeço (2001) demonstrated how the
reproduction rate of V. cholerae in both the aquatic reservoir and the human host is
important to epidemic and endemic occurrence. Models of cholera infection
presently provide a starting point for further investigations. However, generalities in
model coefficients and unknowns in the ecology and epidemiology of cholera cause
models to fall short as a predictor (Bouma and Pascual., 2001; Codeço, 2001).
Further assessments of these factors could help contribute to more accurate
estimations of model coefficients, lending to clearer interpolation of emergence and
resurgence. Once variables influencing reservoir persistence and transmission are
uncovered for both V. cholerae O1 and O139, better assessments can also be made
about variant coexistence and thus the future of pandemics.
106
Chapter 5: Future directions and Conclusion
5.1 Future Directions
To understand disease emergence, it is important to investigate the disease
agent as well as its interactions with its environmental reservoir, vector, and other
animal hosts (Schrag and Wiener, 1995; Galvani, 2003). Knowledge of the complete
life history of disease-causing organisms, what Skelly and Weinstein (2003) call
"pathogen survival trajectories", will improve our understanding and approach to
disease prevention, control, and surveillance. This "eco-environmental" approach
models the pathogen population as it moves through those environments that define
its life history and includes human disease surveillance, epidemiological case-control
studies, and microbiological and ecological investigations (Skelly and Weinstein,
2003).
Collins (2003) also asserts that an integrative approach is a way to discard the
myopia of past paradigms in disease science to address the emergence and re-
emergence of diseases such as cholera. He states that, "progress can be made through
improved understanding of how health hazards arise through the changing ecology of
disease agents [V. cholerae] in the environment and the human's relationship to that
environment" (Collins, 2003). But, complexity in the interrelationships and linkages
between climate, pathogens, and humans make it difficult to predict and manage
disease outbreaks and their spread. Vector-borne diseases often interact with multiple
hosts and vectors at various spatiotemporal scales. Conventional approaches to
infectious disease have been limited in their ability to study parasite transmission
107
ecology and consequently the way transmission has been modeled (McCallum et al.,
2001). Mathematical models of epidemic spread demonstrate that transmission
coefficients are important factors in prediction of disease (Anderson and May, 1981;
Keeling and Gilligan, 2000). For instance, researchers of bubonic plague demonstrate
the importance of studying factors that maintain the pathogen cycle outside the
human host (Hinnebusch et al., 1998; Perry, 2003). Understanding that genes
affecting transmission of plague to humans also play key roles in maintaining the
vector-pathogen relationship and that estimations of bacterial abundance can provide
a reliable means to evaluate risk to human populations will be crucial for modeling
and monitoring epizootic infections (Hinnebusch et al., 1998; Perry, 2003). Research
uncovering specifics of pathogen interactions and mechanisms of disease ecology and
evolution would enable better coefficients for predictive models. However,
transmission values may be estimated improperly due to unknowns in how pathogen-
vector/vehicle interactions influence transmission. When thinking about disease
susceptibility and prevention, we should more consistently study aspects of the
pathogen life cycle beyond the human host. Therefore, this study concludes with a
description of several avenues for future studies of V. cholerae that would lead
towards a more robust understanding of the ecology of this bacterial species.
Although there are concerns about a "crumbling foundation of infectious
disease surveillance" (Berkelman et al., 1994), new tools and a shifting paradigm
integrating multiple disciplines are rejuvenating the field of disease science. For
instance, landscape ecologists are being brought into the fold of disease surveillance
as scientists are recognizing the spatial complexities of vector- and water-borne
108
zoonoses (Kitron, 1998). Geographical Information Systems (GIS), Global
Positioning Systems (GPS), remote sensing, and spatial statistics are tools that are
used to gather, integrate, and analyze biotic and abiotic components of cholera on
micro and macro-scales (Colwell, 1996; Lobitz et al., 2000; Ali et al., 2001; Pascual
et al., 2002). Additionally, molecular biologists are studying how phylogeny can
identify differences in ecological interactions of V. cholerae genotypes in various
regions of Bangladesh, ultimately linking molecular insight to ecologically relevant
traits (Zo, 2004 dissertation).
Integrating population biology into disease science is being recognized as an
important aspect in studying the ecology of infectious disease agents that have an
environmental reservoir or path (Schrag and Weiner, 1995; Schoolnik and Yildiz,
2000). Population biologists explore and describe the interaction of populations
within their biotic and abiotic environments to elucidate the relative abilities of
various genotypes to survive and reproduce, the relative "fitness" of the genotypes
(Lenski et al., 1991). Specifically, they ask questions about whether environments
that are stable or fluctuating in space and time and imposing fluctuating selection
pressures can maintain polymorphisms. Typical disciplines exploring disease focus
on gene function, transient nature of polymorphisms, and physiological mechanisms
of disease symptoms. Multiscale and multispatial factors affecting disease
symptomology, characteristics, and transmission make it difficult to elucidate clear
cause and effect relationships; however studying molecular and physiological
processes in their ecological context can help elucidate organismal development and
performance (Jackson et al., 2002). Until now, the tools to address genetic and
109
proteomic responses in situ were not available. Advances in molecular technology,
however, have made it possible to identify the expression of thousands of genes
simultaneously, using microarray expression profiling. Microarrays exploit the
preferential binding of complementary single-stranded nucleic acid sequences,
whereby an unknown sample is hybridized to an ordered array of immobilized DNA
molecules whose sequences are known. Unlike conventional nucleic-acid
hybridization methods, microarrays allow researchers to determine genome-wide
gene expression in a given cell type at a particular time and under particular
conditions. Thus, when used in experimental settings, scientists can explore the
genomic consequences of environmental conditions and population interactions. The
combination of these two approaches, functional genomics and experimental
population biology, will prove fruitful for exploring ecological and evolutionary
principles involving such systems as host-parasite systems, competition, speciation,
and transient polymorphisms (Gibson, 2002; Schoolnik, 2002).
The combination of exploring the ecology of infectious disease agents and
then applying molecular techniques, such as microarray-based comparative studies,
can further illuminate how specific gene function and plasticity of virulence may
enhance the persistence of pathogenic lineages. Research including spatial dynamics,
pathogen-vector interactions, and functional genomics of disease occurrence and its
relation to abiotic factors and vector distribution should benefit significantly from
genomic and proteomic microarray techniques. Comparative gene expressions can be
assessed to determine whether virulence-associated genes are regulated differently in
multiple environments such as the reservoir, vector, and host. Microarray analyses
110
can be used to assess the extent and nature of genes that are controlled by
biochemical signatures in the host-vector microenvironments, which in turn could
reveal new concepts about managing disease.
These approaches will yield a more robust understanding of the capabilities of
infectious disease agents that interact with environments other than humans.
Knowledge of factors underlying disease emergence can help focus resources on key
situations and areas worldwide, and develop more effective prevention strategies.
Conducting successful interdisciplinary collaborations will depend on a priori
strategies to overcome potential discretions of knowledge structures among
cooperating disciplines that could impede solving the cholera problem (Benda et al.,
2002). Collaborating disciplines often approach problem solving at different space
and time scales, with dissimilar interdisciplinary language, at different scales of
accuracy and precision, and availability of data and predictive models. Therefore,
practical considerations will be helpful in multi-scale approaches to cholera.
5.2 Summary and Conclusion
The objective of this study was to examine how V. cholerae O1 and O139
utilize the copepod as habitat, considering the role of copepods in the transmission of
V. cholerae to humans (Colwell and Huq, 1994). Findings are summarized as
follows.
1. Both V. cholerae O1 and O139 can attach to the copepods, Acartia tonsa and
Eurytemora affinis. The extent of copepod colonization and chitin utilization,
111
however, suggest that the serogroups do not utilize copepods as a resource
precisely the same.
2. V. cholerae O1 colonizes A. tonsa and E. affinis copepods to a larger total
population than O139, irrespective of species or life stage.
3. The effect of nauplii on the attachment of V. cholerae O1 and O139 to adults
and eggs suggest that eggs and nauplii may be important substrate for V.
cholerae distribution.
4. V. cholerae, either O1 or O139, already established on copepods appears
impervious to perturbation by the other serogroup. Furthermore, pre-
established populations of V. cholerae O1 or O139 facilitates attachment of an
“invader” strain.
5. The ability to utilize soluble chitin by V. cholerae O1 and O139 serogroups
appears to be similar, when present in unmixed cultures.
6. However, results of competition assays demonstrate that, in mixed cultures,
utilization of chitin by V. cholerae O1 and O139 is not the same. V. cholerae
O139 appears to utilize chitin more efficiently then O1. V. cholerae O139
numbers remains in stationary phase from 24-72 h, whereas V. cholerae O1
declined sharply after 24 h.
7. Mulitscale and multispatial factors may contribute to the complexity of
cholera, especially as they pertain to the ecology and evolution of epidemic
forms of V. cholerae.
112
Results of this dissertation, unfortunately, do not elucidate why and how V.
cholerae O139 has recently predominated as the etiologic agent of cholera. However,
it does demonstrate differences in resource use between V. cholerae O1 and O139
that may prove to be significant in the ecology of epidemic V. cholerae. More precise
analyses of the molecular genetic ecology of V. cholerae O1 and O139 may provide
deeper insight into this phenomenon. The ability of V. cholerae O139 to form
biofilms may enable it to aggregate more effectively in the aquatic environment, as
suggested in a study of V. cholerae O139 during an outbreak in Calcutta, where V.
cholerae O139 was found to be more abundant in surface waters than in sediment or
on plankton (Ghosh et al., 1994).
Genetic variation within V. cholerae O1 and O139 populations and the varied
responses to fluctuating conditions may also contribute to annual changes in
prevalence. Bacteria, particularly those that attach to surfaces exposed to fluctuating
environments, accommodate changes through complex regulation of genes that
enable phenotypic plasticity (Costerton et al., 1987). Furthermore, genetic variation
within populations provides plasticity to species, allowing for local extinctions while
maintaining regional persistence. V. cholerae, like any epibiont, has to adapt to the
changes in the copepod microhabitat, such as molting, growth, and temporal and
spatial changes in density. V. cholerae also has to adjust to spatial and temporal
changes in abiotic factors associated with tidal action in estuaries, for example, and
the influence that these factors have on its epibiont host. Annual fluctuations in gene
acquisition resulting in pathogenic genotypes suggest that population dynamics may
be related to the stochasticity of the aquatic environment (Faruque et al., 1997a,b).

113
Thus, genetic diversity within pathogenic and nonpathogenic V. cholerae populations,
as seen among the 206 serogroups, and the ability to adjust to changes in the
environment can affect the character of an epidemic, by influencing the intensity of
inter and intra-specific interactions.
Small shifts in genotypes, however, may go unrecognized until they change
the character of an epidemic. This was the case in the emergence of V. cholerae
O139, as human adults that were considered immune to cholera infections turned out
to be susceptible to the newly emerged V. cholerae O139 infection. Understanding
the synergism of abiotic and biotic interactions that influence aquatic persistence of
V. cholerae and transmission to humans will help provide better understanding of the
shifts in composition of genotypes and, potentially, mechanisms of endemic
existence.
114
REFERENCES
1. Ali, M., M. Emch,, M. Yunus, and R.B. Sack. 2001. Are the environmental
niches of Vibrio cholerae O139 different from those of Vibrio cholerae O1 El
Tor? Int. J. Infect. Dis. 5:214-219.
2. Albert, M.J., N.A. Bhuiyan, K.A. Talukder, A.S.G. Faruque, S. Nahar, S.M.
Faruque, M. Ansaruzzaman, and M. Rahman. 1997. Phenotypic and genotypic
changes in Vibrio cholerae O139 Bengal. J. Clin. Microb. 35:2588-2592.
3. Amarasekare, P. and R.M. Nisbet. 2001. Spatial heterogeneity, source-sink
dynamics, and the local coexistence of competing species. Am. Nat. 158: 572-
584.
4. Amako, K., Shimodori, S., Imoto, T., Miake, S., and A. Umeda. 1987. Effects
of chitin and its soluble derivatives on survival of Vibrio cholerae O1 at low
temperature. Appl. Environ. Microbiol. 53:603-605.
5. Anderson, R.M., and R.M. May. 1981. The population dynamics of
microparasites and their invertebrate hosts. Phil. Trans. R. Soc. B. Biol. Sci.
291: 451-524
6. Ayala, F.J., and C.A. Campbell. 1974. Frequency-dependent selection. Ann.
Rev. Ecol. Syst. 5:115-138.
7. Bassler, B.L., P.J. Gibbons, C. Yu, and S. Roseman. 1991a. Chitin utilization
by marine bacteria: chemotaxis to chitin oligosaccharides by Vibrio furnissii.
J. Biol. Chem. 266:24268-24275.
115
8. Bassler, B.L., C. Yu, Y.C. Lee, and S. Roseman. 1991b. Chitin utilization by
marine bacteria: degradation and catabolism chitin oligosaccharides by Vibrio
furnissii. J. Biol. Chem. 266:24276-24286.
9. Basu, A., Garg, P., Datta, S., Chakraborty,S., Bhattacharya, T., Khan,A.,
Ramamurthy, T., Bhattacharya, S.K.,Yamasaki, S., Takeda,Y., and G.
Balakrish Nair. 2000. Vibrio cholerae O139 in Calcutta, 1992-1998:
Incidence, antibiograms, and genotypes. Emerg. Infect. Dis. 6:139-148.
10. Benda, L.E., N.L. Poff, C. Tague, M.A. Palmer, J. Pizzuto, S. Cooper, E.
Stanley, and G. Moglen. 2002. How to avoid train wrecks when using science
in environmental problem solving. BioSci. 52:1127-1136.
11. Berkelman, R.L., Bryan, R.T., Osterholm, M.T., LeDuc, J.W., and J.M.
Hughes. 1994. Infectious disease surveillance" a crumbling foundation.
Science. 264: 368-370.
12. Bik, E.M., Bunschoten, A.E., Gouw, R.D., and F.R. Mooi. 1995. Genesis of
novel epidemic Vibrio cholerae O139 strain: evidence for horizontal transfer
of genes involved in polysaccharide synthesis. EMBO J. 14: 209-216.
13. Bik, E.M. A.E. Bunschoten, R.J.L. Willems, A.C.Y. Chang, and F.R. Mooi.
1996. Genetic organization and functional analysis of the otn DNA essential
for cell-wall polysaccharide synthesis in Vibrio cholerae O139. Mol.
Microbiol. 20:799-811.
14. Bhanumathi, R. Sabeena, F., Isac, S.R., Shukla, B.N., and D.V. Singh. 2003.
Molecular characterization of Vibrio cholerae O139 Bengal isolated from
116
water and the aquatic plant Eichhornia crassipes in the River Ganga,
Varanasi, India. Appl. Environ. Microbiol. 69: 2389-2394.
15. Bohannan, B.J.M., and R.E. Lenski. 2000. Linking genetic change to
community evolution: insights from studies of bacteria and bacteriophage.
Ecol. Lett. 3:362-377.
16. Bouma, M.J. and M. Pascual. 2001 Seasonal and interannual cycles of
endemic cholera in Bengal 1891-1940 in relation to climate and geography.
Hydrobiologia. 460:147-156.
17. Brownlee, D.C. and F. Jacobs. 1987. Chapter 12: Mesozooplankton and
microzooplankton in the Chesapeake Bay. In: Contaminant Problems and
Management of Living Chesapeake Bay Resources (eds. S.K. Majumdar,
L.W. Hall, Jr., and H.M. Austin), 217-269. The Pennsylvania Academy of
Science.
18. Broza, M., and M. Halpern. 2001. Chironomid egg masses and Vibrio
cholerae. Nature. 412:40.
19. Bruno, J.F., J.J. Stachowcz, and M.D. Bertness. 2003. Inclusion of facilitation
into ecological theory. Trends Ecol. Evol. 18:119-125.
20. Carlotti, F, and P. Nival. 1992. Model of copepod growth and development:
moulting and mortality in relation to physiological processes during the moult
cycle. MEPS. 84:219-233.
21. Carman, K.R. 1994. Stimulation of marine free-living and epibiotic bacterial
activity by copepod excretions. FEMS Lett. Microbiol. Ecol. 14:255-262.
117
22. Carman, K.R. and F. Dobbs. 1997. Epibiotic microorganisms on copepods
and other marine crustaceans. Microscopy Research and Technique. 37:116-
135.
23. Cash, R.A., S.I. Music, J.P. Libonati, M.J. Snyder, R.P. Wenzel, and R.B.
Hornick. 1974. Response of man to infection with Vibrio cholerae. I.
Clinical., serologic, and bacteriologic responses to a known inoculum. J.
Infect. Dis. 129:45-52.
24. Cavari, B.Z., and R.R. Colwell. 1981. Effect of salt on survival and growth of
Vibrio cholerae. Dev. Arid Zone Ecol. Environ. Quality. 31:227-231.
25. Chiavelli, D.A., J.W. Marsh, and R.K. Taylor. 2001. The mannose-sensitive
hemagglutinin of Vibrio cholerae promotes adherence to zooplankton. Appl.
Environ. Microbiol. 67:3220-3225.
26. Cholera Working Group, International Centre of Diarrhoeal Disease Research,
Bangladesh. 1993. Large epidemic of cholera like disease in Bangladesh
caused by Vibrio cholerae O139 synonym Bengal. Lancet. 342:387-390.
27. Chowdhury, M.A.R., B. Xu, R. Montilla, J.A.K. Hasan, A. Huq, and R.R.
Colwell. 1995. DFA-DVC: a simplified technique for detection of viable cells
of V. cholerae O1 and O139. J. Microbiol. Meth. 24:165-170.
28. Cockburn, T.A., and J.G. Cassanos. 1960. Epidemiology of endemic cholera.
Public Health Rep. 75:791-803.
29. Codeço, C.T. 2001. Endemic and epidemic dynamics of cholera: the role of
the aquatic reservoir. BMC Infect. Dis. 1:1.
118
30. Collins, A.E. 2003. Vulnerability to coastal cholera ecology. Soc. Sci. Med.
57: 1397-1407.
31. Colwell. R.R. 1984. In: R.R. Colwell and Morita (eds) Vibrios in the Marine
Environment.
32. Colwell, R.R. 1996. Global climate and infectious disease: the cholera
paradigm. Science. 274: 2025-2031.
33. Colwell, R. R., and A. Huq. 1994. Environmental reservoir of Vibrio
cholerae. The causative agent of cholera. Ann. N. Y. Acad. Sci. 740:44–
54.154.
34. Colwell, R.R., J. Kaper, and S.W. Joseph. 1977. Vibrio cholerae, Vibrio
parahaemolyticus, and other vibrios: occurrence and distribution in
Chesapeake Bay. Science. 198: 394-396.
35. Comstock, L.E., D. Maneval Jr., P. Panigrahi, A. Joseph, M.M. Levine, J.B.
Kaper, J.G. Morris Jr., and J.A. Johnson. The capsule and O antigen in Vibrio
cholerae O139 Bengal are associated with a genetic region not present in V.
cholerae O1. Infect. Immun. 63:317-323.
36. Costerton, J.W., K.J. Cheng, G.G. Geesey, T. Ladd, J. Nickel, M. Dasgupta,
and T. Marrie. 1987. Bacterial biofilms in nature and disease. Annu. Rev.
Microbiol. 41: 435-464.
37. Dawson, M.P., Humphey, B.A., and K.C. Marshall. 1981. Adhesion: A tactic
in the survival strategy of a marine vibrio during starvation. Curr. Microbiol.
6:195-199.
119
38. DiRita, V.J., C. Parsot, G. Jander, and J.J. Mekalanos. 1992. A regulatory
cascade controls virulence in Vibrio cholerae. In: Hook, M. and L. Switalski
(eds) Microbial Adhesion and Invasion. Springer-Verlag New York Inc. New
York.
39. Dumontet, S., K. Krovacek, S.B. Baloda, R. Grottoli, V. Pasquale, and S.
Vanucci. 1996. Ecological relationship between Aeromonas and Vibrio spp.
And planktonic copepods in the coastal marine environment in southern Italy.
Comp. Immun. Microbiol. Infect. Dis. 19:245-254.
40. Dumontier, S. and P. Berche. 1998. Vibrio cholerae O22 might be a putative
source of exogenous DNA resulting in the emergence of the new strain Vibrio
cholerae O139. FEMS Micriobiol. Lett. 164:91-98.
41. Dwyer, G. 1991. The role of density, stage, and patchiness in the transmission
of an insect virus. Ecology. 72: 559-574.
42. Dziejman, M., E. Balon, D. Boyd, C.M. Fraser, J.F. Heidelberg, and J.J.
Mekalanos. 2002. Comparative genomic analysis of Vibrio cholerae: Genes
that correlate with cholera endemic and pandemic disease. Proc. Nat. Acad.
Sci. 99:1556-1561.
43. Cholera Working Group, International Centre of Diarrhoeal Disease Research,
Bangladesh. 1993. Large epidemic of cholera like disease in Bangladesh
caused by Vibrio cholerae O139 synonym Bengal. Lancet. 342:387-90.
44. Faruque, S.M., K.M. Ahmed, A.R.M.A. Alim, F. Qadri, A.K. Siddique, and
M.J. Albert. 1997a. Emergence of a new clone of toxigenic Vibrio cholerae
120
O1 biotype El Tor replacing V. cholerae O139 Bengal in Bangladesh. J. Clin.
Microbiol. 35:624-630.
45. Faruque, S.M., K.M. Ahmed, A.K. Siddique, A.R.M.A. Alim, and M.J.
Albert. 1997b. Molecular analysis of toxigenic Vibrio cholerae O139 Bengal
strains isolated in Bangladesh between 1993-1996: Evidence for emergence of
a new clone of Bengal vibrios. J. Clin. Microbiol. 35:2299-2306.
46. Faruque, S.M., M.J. Albert, and J.J. Mekalanos. 1998. Epidemiology,
genetics, and ecology of toxigenic Vibrio cholerae. Microbiol. Mol. Biol. Rev.
62:1301-1314.
47. Faruque, S.M., N. Chowdhury, M. Kamruzzaman, Q.S. Ahmad, A.S.G.
Faruque, M.A. Salam, T. Ramamurthy, G.B. Nair, A. Weintraub, and D.A.
Sack. 2003. Reemergence of epidemic Vibrio cholerae O139, Bangladesh.
Emerg. Infect. Dis. 9: 1116-1122.
48. Faruque, S.M., M.N. Saha, Asadulghani, D.A. Sack, R.B. Sack, Y. Takeda,
and G.B. Nair. 2000. The O139 serogroup of Vibrio cholerae comprises
diverse clones of epidemic and nonepidemic strains derived from multiple V.
cholerae O1 or non-O1 progenitors. J. infect. Dis. 182:1161-1168.
49. Field, M., D. Fromm, Q. Al-Awqati, and W.B. Greenough III. 1972. Effect of
cholera enterotoxin on ion transport across isolated ileal mucosa. J. Clin.
Invest. 51:796-804.
50. Galvani, A.P. 2003. Epidemiology meets evolutionary ecology. Trends Ecol.
Evol. 18: 132-139.
121
51. Garg, P., A. Aydanian, D. Smith, J.G. Morris, G.B. Nair, and O.C. Stine.
2003. Molecular epidemiology of O139 Vibrio cholerae: mutation, lateral
gene transfer, and founder flush. Emerg. Infect. Dis. 9: 810-814.
52. Ghosh, A.R., Koley, H., De, D., Garg, S., Bhattacharya, M.K., Bhattacharya,
S.K., Manna, B., Nair, G.B., Shimada, T., Takeda, T., and Y. Takeda.
Incidence and toxigenicity of Vibrio cholerae in a freshwater lake during the
epidemic of cholera caused by serogroup O139 Bengal in Calcutta, India.
FEMS Microbiol. Ecol. 14: 285-292.
53. Gibson, G. 2002. Microarrays in ecology and evolution: a preview. Mol. Ecol.
11: 17-24.
54. Glass, R.I., S. Becker, M.I. Huq, B.J. Stoll, M.U. Khan, M.H. Merson, J.V.
Lee, and R.E. Black. 1982. Endemic cholera in rural Bangladesh, 1966-1980.
Am. J. Epidemiol. 116:959-970.
55. Glass, R.I., J.V. Lee, M.I. Huq, K.M.B. Hossain, and M.R. Khan. 1983. Phage
types of Vibrio cholerae O1 El Tor isolated from patients and family contacts
in Bangladesh epidemiologic implications. J. Infect. Dis. 148:998-1004.
56. Graf, J. and E.G. Ruby. 1998. Host-derived amino acids support the
proliferation of symbiotic bacteria. Microbiol. 95: 1818-1822.
57. Griffin, A.S., S.A. West, and A. Buckling. 2004. Cooperation and competition
in pathogenic bacteria. Nature. 430:1024-1027.
58. Guthrie, R.K. and D.Q. Cofie. 1991. Culture of Vibrio cholerae in presence of
shrimp and crab chitin. Intl. Biodeter. 27:39-48.
122
59. Geesey, G. G., R. Mutch, J. W. Costerton, and R. B. Green. 1978. Sessile
bacteria: an important component of the microbial population in small
mountain streams. Limnol. Oceanogr. 23:1214-1223.
60. Haldane, J.B.S., and S.D. Jayakar. 1963. Polymorphism due to selection
depending on the composition of population. J. Genetics. 58:318-323.
61. Halpern, M., H. Gancz, M. Broza, and Y. Kashi. 2003. Vibrio cholerae
hemagglutinin/protease degrades chironomid egg masses. Appl. Environ.
Microbiol. 69:4200-4204.
62. Hanski, I. 1983. Coexistence of competitors in patchy environment. Ecol.
64:493-500.
63. Hanski, I. 1994. Spatial scale, patchiness and population dynamics on land.
Phil. Trans. R. Soc. B. 343:19-25.
64. Hasan, J.A.K., D. Bernstein, A. Huq, L. Loomis, M.L. Tamplin, and R.R.
Colwell. 1994. Cholera DFA: An improved direct fluorescent monoclonal
antibody staining kit for rapid detection and enumeration of V. cholerae O1.
FEMS Microbiol. Lett. 120:143-148.
65. Häse, C.C., and J.J. Mekalanos. 1999. Effects of changes in membrane
sodium flux on virulence gene expression in Vibrio cholerae. Proc. Natl.
Acad. Sci. USA. 96:3183-3187.
66. Hassell, M.P., H.N. Comins, and R.M. May. 1994. Species coexistence and
self-organizing spatial dynamics. Nature. 370:290-292.
67. Haury, L.R., McGowan, J.A., and P.H. Wiebe. 1977. Patterns and Processes
in the time-space scales of plankton distribution. In: Spatial pattern in
123
plankton communities, ed. John Steele. New York, NATO Conference on
Marine Biology IV, Erice, Italy.
68. Heidelberg, J.F, J.A. Eisen, W.C. Nelson, R.A. Clayton, M.L. Gwinn, R.J.
Dodson, D.H. Haft, E.K. Hickey, J.D. Peterson, L. Umayam, S.R. Gill, K.E.
Nelson, T.D. Read, H. Tettelin, D. Richardson, M.D. Ermolaeva, J.
Vamathevan, S. Bass, H. Qin, I. Dragoi, P. Sellers, L. McDonald, T.
Utterback, R.D. Fleishmann, W.C. Nierman, O. White S.L. Salzberg, H.O.
Smith, R.R. Colwell, J.J. Mekalanos, J.C. Venter, and C.M. Fraser. 2000.
DNA sequence of both chromosomes of cholera pathogen Vibrio cholerae.
Nature. 406:477-483.
69. Heidelberg, J. F., K.B. Heidelberg, and R.R. Colwell. 2002a. Bacteria of the
{gamma}-Subclass Proteobacteria Associated with Zooplankton in
Chesapeake Bay. Appl. Environ. Microbiol. 68: 5498-5507
70. Heidelberg, J.F., K.B. Heidelberg, and R.R. Colwell. 2002b. Seasonality of
Chesapeake Bay bacterioplankton species. Appl. Environ. Microbiol. 68:
5488-5497.
71. Heilmann, C., O. Schweitzer, C. Gerke, N. Vanittanakon, D. Mack, and F.
Götz. 1996. Molecular basis of intracellular adhesion in the biofilm-forming,
Staphylococcus epidermidis. Mol. Microbiol. 20:1083-1091.
72. Heinle, D. R. 1969. Temperature and zooplankton. Chesapeake Sci., 10, 186–
209.
124
73. Herman, S., Mihursky, J.A., and A.J. McErlean. 1968. Zooplankton and
environmental characteristics of the Patuxent River Estuary 1963-1965.
Chesapeake Science. 9:67-82.
74. Hinnebusch, B.J., Gage, K.L., and T.G. Schwan. Estimation of vector
infectivity rates for plague by means of a standard curve-based competitive
polymerase chain reaction method to quantify Yersinia pestis in fleas. Am. J.
Trop. Med. Hyg. 58: 562-569.
75. Hood, M.A. and G.E. Ness. 1982. Survival of Vibrio cholerae and
Escherichia coli in estuarine waters and sediments. Appl. Environ. Microbiol.
43:578-584.Heidelberg, J.F., Heidelberg, K.B., and R.R. Colwell. 2002a.
Bacteria of the γ-subclass Proteobacteria associated with zooplankton in the
Chesapeake Bay. Appl. Environ. Microbiol. 68: 5498-5507.
76. Huq, A., Small, E.B., West, P.A., Huq, I., Rahman, R., and R.R. Colwell.
1983. Ecological relationships between Vibrio cholerae and planktonic
crustacean copepods. Appl. Environ. Microbiol. 45:275-283.
77. Huq, A., Small, E.B., West, P.A., and R.R. Colwell. 1984. Role of plankton
copepods in the survival and multiplication of V. cholerae in the aquatic
environment. In: Colwell, R.R. (ed) Vibrios in the Environment, John Wiley
and Sons, New York.
78. Huq, A., West, P.A., Small, E.B., Huq, I., Rahman, R., and R.R. Colwell.
1994. Influence of water temperature, salinity, and pH on survival and growth
of toxigenic Vibrio cholerae serovar O1 associated with live copepods in
laboratory microcosms. Appl. Environ. Microbiol. 48:420-424.
125
79. Huq, A., Colwell, R.R., Chowdhury, M.A.R., Xu, B., Moniruzzaman, S.M.,
Islam, M.S., Yunus, M., and M.J. Albert. 1995. Co-existence of Vibrio
cholerae O1 and O139 Bengal in plankton in Bangladesh. Lancet. 345:1245.
80. Islam, M.S., M.K. Hasan, M.A. Miah, F. Qadri, M. Yunus, R.B. Sack, and
M.J. Albert. 1993. Isolation of Vibrio cholerae O139 Bengal from water in
Bangladesh. Lancet. 342:430.
81. Islam, MS and KMS Aziz. 1981. Association of vibrios with some
hydrophytic plants. Bangladesh J. Microbiol. 1: 70-2.
82. Islam, M.S., Miah, M.A., Hasan, M.K., Sack, R.B., and M.J. Albert. 1994.
Detection of non-culturable Vibrio cholerae O1 associated with
cyanobacterium from an aquatic environment in Bangladesh. Trans. R. Soc.
Trop. Med. Hyg. 88: 298-299.
83. Jackson, R.B., C.R. Linder, M. Lynch, M. Purugganan, S. Somerville, and
S.S. Thayer. 2002. Linking molecular insight and ecological research. Trends
Ecol. Evol. 17:409-414.
84. Jiang, S.C., and W. Fu. 2001. Seasonal abundance and distribution of Vibrio
cholerae in coastal waters quantified by a 16S-23S intergenic spacer probe.
Microb. Ecol. 42: 540-548.
85. Johnson, J.A., Salles, C.A., Panigrahi, P., Albert, M.J., Wright, A.C., Johnson,
R.J., and J.G. Morris, Jr. 1994. Vibrio cholerae O139 Synonym Bengal is
closely related to Vibrio cholerae El Tor but has important differences. Infect.
Immun. 62:2108-2110.

126
86. Kaneko, T., and R.R. Colwell. 1975. Adsorption of Vibrio parahaemolyticus
onto chitin and zooplanktonic copepods. Appl. Microbiol. 29:269-274.
87. Keeling, M.J. and C.A. Gilligan. 2000. Bubonic plague: a metapopulation
model of a zoonosis. Proc. R. Soc. Lond. B. 267:2219-2230.
88. Khetawat, G., R.K. Bhadra, S. Nandi, and J. Das. 1999. Resurgent Vibrio
cholerae O139: Rearrangement of cholera toxin genetic elements and
amplification of rrn operon. Infect. Immun. 67:148-154.
89. Kitron, U. 1998. Landscape ecology and epidemiology of vector-borne
diseases: tools for spatial analysis. Entomol. Soc. Am. 35: 436-445.
90. Koch, R. 1884. Ueber die Cholerabacterian. Deutsche Medizinische
Wochenschrift. 10:725-728.
91. Lee, K. and E.G. Ruby. 1994. Effect of the squid host on the abundance and
distribution of symbiotic Vibrio fischeri in nature. Appl. Environ. Microbiol.
60: 1565-1571.
92. Lenski, R.E., M.R. Rose, S.C. Simpson, and S.C. Tadler. 1991. Long-term
experimental evolution in Escherichia coli. I. Adaptation and divergence
during 2,000 generations. Am. Nat. 138:1315-1341.
93. Levin, B.R. 1988. Frequency-dependent selection in bacterial populations.
Phil. Trans. R. Soc., London B. 319:459-472.
94. Levins, R. 1969. Some demographic and genetic consequences of
environmental heterogeneity for biological control. Bull. Entomol. Soc. Am.
15:237-240.
127
95. Lipp, E.K., Rivera, I.N.G., Gil, A.I., Espeland, E.M., Choopun, N., Louis,
V.R., Russek-Cohen, E., Huq, A., and R.R. Colwell. 2003. Direct detection of
Vibrio cholerae and ctxA in Peruvian coastal water and plankton by PCR.
Appl. Environ. Microbiol. 69: 3676-3680.
96. Lipp, E.K., Huq, A., and R.R. Colwell. 2002. Effects of global climate on
infectious disease: the cholera model. Clin. Microbiol. Rev. 15:757-770.
97. Lobitz, B., Beck, L., Huq, A., Wood, B., Fuchs, G., Faruque, A.S.G., and R.R.
Colwell. 2000. Climate and infectious disease: Use of remote sensing for
detection of Vibrio cholerae by indirect measurement. Proc. Natl. Acad. Sci.
97: 1438-1443.
98. Louis, V.R., Russek-Cohen, E., Choopun, N.,Rivera, I.N., Gangle, B., Jiang
S.C., Rubin, P., Patz J.A., Huq, A., and R.R. Colwell. 2003. Predictability of
Vibrio cholerae in Chesapeake Bay. Appl. Environ. Microbiol. 69: 2773-85.
99. MacDonell, M.T., Baker, R.M., Singleton, F.L., and M.A. Hood. 1984.
Effects of surface association and osmolarity on river water microcosm
populations of an environmental isolate of Vibrio cholerae. In: Colwell, R.R.
(ed) Vibrios in the Environment, John Wiley and Sons, New York.
100. Marshall, K.C. 1976. Interfaces in microbial ecology. Cambridge: Harvard
University Press.
101. Meibom, K.L., B.L. Xibing, A.T. Nielsen, C. Wu, S. Roseman, and G.K.
Schoolnik. 2004. The Vibrio cholerae chitin utilization program. PNAS. 101:
2524-2529.
102. Merrell DS, Butler SM, Qadri F, Dolganov NA, Alam A, Cohen MB,
128
Calderwood SB, Schoolnik GK, and A. Camilli. 2002. Host-induced
epidemic spread of the cholera bacterium. Nature. 417:642-645.
103. Michener, W.K., T.J. Baerwald, P. Firth, M.A. Palmer, J.L. Rosenberger, E.A.
Sandlin, and H. Zimmerman. 2001. Defining and unraveling biocomplexity.
BioSci. 51:1018-1023.
104. Miller, C.B. 1984. The zooplankton of estuaries. In: Ketchum, B.H. (ed)
Estuaries in Enclosed Seas.
105. Miller, C.B., J.K. Johnson, and D.R. Heinle. 1977. Growth rules in the marine
copepod genus Acartia. Limnol. Oceanogr. 22:326-335.
106. Miller, C.J., B.S. Drasar, and R.G. Feacham. 1984. Response of toxigenic
Vibrio cholerae O1 to physico-chemical strese in aquatic environments. J.
Hyg. (Lond). 93:475-95.
107. Moller, E.F. and T.G. Nielsen. 2001. Production of bacterial substrate by
marine copepods: effects of phytoplankton biomass and cell size. J. Plank.
Res. 23: 527-236.
108. Morris, J.G., Jr., and the Cholera Laboratory Task Force. 1994. Vibrio
cholerae O139 Bengal. In: I. Kaye Wachsmuth, P.A. Blake, and O. Olsvik
(eds). Vibrio cholerae and Cholera: Molecular to Global Perspectives.
American Society for Microbiology, Washington, D.C.
109. Morris, J.G., Jr., Losonsky, G.E., Johnson, J.A., Tacket, C.O., Nataro, J.P.,
Panigrahi, P., and M.M. Levin. 1995. Clinical and immunologic
characteristics of Vibrio cholerae O139 Bengal infection in North American
volunteers. J. Infect. Dis. 71:903-908.
129
110. Mukhopadhyay, A. K., S. Garg, Mitra, R., Basu, A., Rajendran, K., Dutta, D.,
Bhattacharya, S.K.,Shimada, T., Takeda, T., and Y. Takeda. 1996. Temporal
shifts in traits of Vibrio cholerae strains isolated from hospitalized patients in
Calcutta: a 3-year (1993-1995) analysis. J. Clin. Microbiol. 34: 2537-2543.
111. Nair, G.B., T. Shimada, H. Kurazono, J. Okuda, A. Pal., T. Karasawa, T.
Mihara, Y. Uesaka, H. Shirai, S. Garg, P.K. Saha, A.K. Mukhopadhyay, T.
Ohashi, J. Tada, T., Nakayama, S. Fukushima, T. Takeda, and Y. Takeda.
1994. Characterization of phenotypic, serological., and toxigenic traits of
Vibrio cholerae O139 Bengal. J. Clin. Microbiol. 32:2775-2779.
112. Nalin, D.R. 1976. Cholera, copepods, and chitinase. Lancet, ii, 958.
113. Nalin, D.R., V. Daya, A. Reid, M.M. Levine, and H.C. Wu. 1979. Adsorption
and growth of Vibrio cholerae on chitin. Infect. Immun. 25:768-770.
114. Neuhauser, C. 1998. Habitat destruction and competitive coexistence in
spatially explicit models and local interactions. J. Theor. Biol. 193:445-463.
115. Oppenheimer, J.R., M.G. Ahmed, and A. Huq. 1978. Limnological studies of
three ponds in Dacca, Bangladesh. Bangladesh. J. Fish. 1:1-28.
116. Ostling, J., L. Holmqist, B. Flardh, A. Jouper-Jaan, and S. Kjelleberg. 1993.
Starvation and recovery of Vibrio. In: Kjelleberg, S (ed.) Starvation in
Bacteria. Plenum Press, New York.
117. Pacini, F. 1854. Observazioni microscopiche e deduzioni patologiche sul
cholera asiatico. Gaz. Med. Ital. 6:405-412.

130
118. Palmer, R.J.Jr., K. Kazmerzak, M.C. Hansen, and P.E. Kolenbrander. 2001.
Mutualism versus independence: strategies of mixed-species oral biofilms in
vitro using saliva as the sole nutrient source. Infect. Immun. 69:5794-5804.
119. Pascual, M., M. J. Bouma, and A.P. Dobson. 2002. Cholera and climate:
revisiting the quantitative evidence. Microbes and Infection 4: 237-245.
120. Pianka, E.R. 1975. Niche relations of desert lizards. In: M.L. Cody and J.M.
Diamond (eds) Ecology and Evolution of Communities. Belknap Press,
Cambridge, MA.
121. Pollitzer, R. 1959. Cholera. World Health Organization, Geneva, pp. 1-50.
122. Pulliam, H.R., and J.B. Dunning. 1994. Demographic processes: population
dynamics on heterogenous landscapes. In Principles of Conservation Biology,
ed. G.K. Meffe and C.R. Carroll, 179-205. Sunderland, MA. Sinauer
Associates.
123. Ramamurthy, T., S. Garg, R. Sharma, S.K. Bhattacharya, G.B. Nair, T.
Shimada, T. Takeda, T. karasawa, H. Kurazano, A. Pal., and Y. Takeda. 1993.
Emergence of novel strain of Vibrio cholerae with epidemic potential in
southern and eastern India. Lancet, 341:703-704.
124. Real, L.A. 1996. Disease Ecology. Ecology, 77: 989.
125. Roughgarden, J.D. 1977. Patchiness in the spatial distribution of a population
caused by stochastic fluctuations in resources. Oikos, 29:52-59.
126. Ruxton, G.D. and P. Rohani. 1998. Fitness-dependent dispersal in
metapopulations and its consequences for persistence and synchrony. J. Anim.
Ecol. 67:530-539.
131
127. Schoolnik, G.K. 2002. Functional and comparative genomics of pathogenic
bacteria. Curr. Op. Microbiol. 5:20-26.
128. Schoolnik, G.K. and F.H. Yildiz. 2000. The complete genome sequence of
Vibrio cholerae: a tale of two chromosomes and of two lifestyles. Genome
Bio.1: reviews 1016.1-1016.3.
129. Schrag, S.J. and P. Wiener. 1995. Emerging infectious disease: what are the
relative roles of ecology and evolution? Trends Ecol. Evol. 10: 319-324.
130. Siddique, A. K., K. Akram, K. Zaman, P. Mutsuddy, A. Eusof, and R.B. Sack.
1996. Vibrio cholerae O139: how great is the threat of a pandemic? Trop.
Med. Int. Health. 1:393-398.
131. Simidu, U., and K. Tsukamoto. 1985. Habitat segregation and biochemical
activities of marine members of the family Vibrionaceae. Appl. Environ.
Microbiol. 50:781-790.
132. Singleton, F.L., Attwell, R.W., Jangi, M.S., and R.R. Colwell. 1982a.
Influence of salinity and organic nutrient concentration on survival and
growth of Vibrio cholerae in aquatic microcosms. Appl. Environ. Microbiol.
43:1080-1085.
133. Singleton, F.L., Attwell, R.W., Jangi, M.S., and R.R. Colwell. 1982b. Effects
of temperature and salinity on Vibrio cholerae growth. Appl. Environ.
Microbiol. 44:1047-1058.
134. Skelly, C. and P. Weinstein. 2003. Pathogen survival trajectories: an eco-
environmental approach to the modeling of human campylobacteriosis
ecology. Envir. Health Perspectives. 111:19-28.
132
135. Slatkin, M. 1974. Competition and regional coexistence. Ecol. 55:128-134.
136. Sochard, M.R., D.F. Wilson, B. Austin, and R.R. Colwell. 1979. Bacteria
associated with the surface and gut of marine copepods. Appl. Environ.
Microbiol. 37:750-759.
137. Souza, V., P.E. Turner, and R.E. Lenski. 1991. Long-term experimental
evolution in Escherichia coli. V. Effect of recombination with immigrant
genotypes on the rate of bacterial evolution. J. Evol. Biol. 10:743-769.
138. Speirs, D.C., W.S.C Gurney, S.J. Holmes, M.R. Heath, S.N. Wood, E.D.
Clarke, I.H. Harms, H. Hirche, and E. McKenzie. 2004. Understanding
demography in an advective environment: modeling Calanus finmarchicus in
the Norwegian Sea. J. Anim. Ecol. 73:897-910.
139. Tamplin, M.L., Gauzens, A.L., Huq, A., Sack, D.A., and R.R. Colwell. 1990.
Attachment of Vibrio cholerae serogroup O1 to zooplankton and
phytoplankton of Bangladesh waters. Appl. Environ. Microbiol. 56:1977-
1980.
140. Tarsi, R., and C. Pruzzo. 1999. Role of surface proteins in Vibrio cholerae
attachment to chitin. Appl. Environ. Microbiol. 65:1348-1351.
141. Threlkeld, S.T., D.A. Chiavelli, and R.L. Willey. 1993. The organization of
zooplankton epibiont communities. Trends Ecol. Evol. 8:317-321.
142. Threlkeld, S.T., and R.L. Willey. 1993. Colonization, interaction, and
organization of cladoceran epibiont communities. Limnol. Oceanogr. 38: 584-
591.
133
143. Turner, P.E., V. Souza, and R.E. Lenski. 1996. Tests of ecological
mechanisms promoting the stable coexistence of two bacterial genotypes.
Ecol. 77:2119-2129.
144. Venkateswaran, K., Takai, T., Navarro, I.M., Nakano, H., Hashimoto, H., and
R. Siebeling. 1989. Ecology of Vibrio cholerae non-O1 and Salmonella spp.
and the role of zooplankton in their seasonal distribution in Fukuyama coastal
waters, Japan. Appl. Environ. Microbiol. 55: 1591-1598.
145. Wahl, M. 1989. Marine epibiosis. I. Fouling and antifouling: Some basic
aspects. Mar. Ecol. Prog. Ser. 58:175-189.
146. Waldor, M.K. and J.J. Mekalanos. 1996. Lysogenic conversion by a
filamentous phage encoding cholera toxin. Science. 272:1910-1914.
147. Ward, J.P., J.R. King, A.J. Koerber, J.M. Croft, R.E. Sockett and P. Williams.
2003. Early development and quorum sensing in bacterial biofilms. J. Math.
Biol. 47:23-55.
148. Watnick, P.I., Lauriano, C.M., Klose, K.E., Croal., L., and R. Kolter. 2001.
The absence of flagellum leads to altered colony morphology, biofilm
149. Weintraub, A., G. Widmalm, P. Jansson, M. Jansson, K. Hultenby, and M.J.
Albert. 1994. Vibrio cholerae O139 Bengal possesses a capsular
polysaccharide which may confer increased virulence. Microb. Path. 16:235-
241.
150. West, P.A., and R.R. Colwell. 1984. Identification and classification of
Vibrionaceae - an overview. In: R.R. Colwell (ed.), Vibrios in the
environment. John Wiley and Sons, Inc., New York, N.Y.
134
151. Yu, C., A.M. Lee, B.L. Bassler, and S. Roseman. 1991. Chitin utilization by
marine bacteria. J. Biol. Chem. 25:24260-24267.
152. Zo, Y., I.N.G. Rivera, E. Russek-Cohen, M.S. Islam., A.K. Siddique,
M.Yunus, R.B. Sack, A. Huq, and R.R. Colwell. 2002. Genomic profiles of
clinical and environmental isolates of Vibrio cholerae O1 in cholera-endemic
areas of Bangladesh. Proc. Natl. Acad. Sci. 99:12409-12414.
153. Zobell, C.E. 1943. The effect of solid surfaces upon bacterial activity. J.
Bacteriol. 46:539-555.