abstract hoyle, jared adam. effect of mowing height in
TRANSCRIPT

ABSTRACT
HOYLE, JARED ADAM. Effect of Mowing Height in Turfgrass Systems on Pest Incidence. (Under the direction of Fred H. Yelverton.)
Field experiments were conducted to 1) determine if discrepancies occur between
multiple methods for estimating large crabgrass cover to determine the most precise,
accurate, and efficient method, 2) determine the effect of mowing height on large
crabgrass incidence in common bermudagrass, 3) determine the effect of mowing height
on large crabgrass and brown patch incidence in tall fescue, and 4) determine the effect of
mowing height on common bermudagrass encroachment in tall fescue. All experiments
were conducted at two locations in North Carolina. Mowing heights for experiments
included 2.5, 5.1, 7.6, and 10.2 cm for tall fescue and 1.3, 2.5, 3.8, and 5.1 cm for
common bermudagrass. Evaluation methods for estimating large crabgrass cover
consisted of Visual Ratings (VR), Line Intersect Analysis (LIA), and Digital Image
Analysis (DIA). All methods were compared to VR, the standard and accepted method
of data collection. It was found in two separate field experiments that there were no
differences among the three rating methods.
No effect of mowing height on large crabgrass incidence in common
bermudagrass was found at 5 months after initiation (MAI).
Increasing tall fescue mowing heights resulted in reduced large crabgrass
incidence and increased brown patch incidence. The presence of brown patch did not
affect large crabgrass incidence. As mowing height increased, percent crabgrass cover at

6 MAI decreased. With increasing mowing heights percent brown patch cover increased
in tall fescue.
Immediately following installation of common bermudagrass in tall fescue,
mowing height treatments of 2.5, 5.1, 7.6, and 10.2 cm were initiated. Research
determined that with increasing mowing heights in tall fescue, the percent of common
bermudagrass cover was significantly reduced, especially after one year of growth.
These results show that VR may be more widely accepted in weed control studies
in turfgrass systems. The mowing height of common bermudagrass will not suppress
large crabgrass. A mowing height of 7.6 cm in tall fescue can reduce large crabgrass
populations, decreasing dependence on pre-emergence herbicides, and keeping brown
patch infestations below a common threshold of 5% brown patch cover. To prevent
spread of common bermudagrass in tall fescue after contamination a mowing height of
7.6 or 10.2 cm is recommended.

Effect of Mowing Height in Turfgrass Systems on Pest Incidence
by Jared Adam Hoyle
A thesis submitted to the Graduate Faculty of North Carolina State University
in partial fulfillment of the requirements of the Degree of
Master of Science
Crop Science
Raleigh, North Carolina
2009
APPROVED BY:
___________________ ____________________ Dr. Lane Tredway Dr. Grady L Miller
___________________ Dr. Fred H Yelverton
Chair of Advisory Committee

ii
DEDICATION
This thesis is dedicated to my father, mother, and brothers.
With their support and love they helped me achieve one of my life goals.
John Hoyle
Judy Hoyle
Jonathan Hoyle
Jason Hoyle
Justin Hoyle

iii
BIOGRAPHY
I was born in Kernersville, North Carolina in 1984 where I spent my pre-college
life. I grew up on a family farm where I was able to spend time outdoors enjoying
mother-nature with my brothers. As a young boy, I enjoyed playing sports including
soccer and baseball that I carried out through my life. I also enjoy hunting and fishing
with my family and friends. It was during this time that I developed a passion for
landscaping and turfgrass.
I begin my college career at North Carolina State in the Fall of 2002. During the
Summer of 2005 I completed the North Carolina Nurserymen Internship at the J.C.
Raulston Arboretum. In December 2006 I graduated with honors and received a B.S. in
Horticulture Science with concentration in Horticulture Science Technology. Upon
graduation I immediately began in January 2007 at North Carolina State University
pursuing a M.S. degree in Crop Science under the direction of Dr. Fred H. Yelverton as a
Graduate Research Assistant. Upon graduation I plan to continue my education and
pursue a PhD.

iv
ACKNOWLEDGEMENTS
There are many individuals I would like to thank for their support in helping me
succeed in my graduate studies. First, I would like to thank my family and friends for
helping me believe in myself so I could achieve this accomplishment. Even though all of
them were not always present, their morale inspired me day after day. I would like to
thank my brothers Jonathan, Jason, and Justin for always being there to congratulate me
for any accomplishments I received. I would also like to thank my father and mother,
John and Judy, for always being my rock to lean on when I needed support. Also, thanks
to Sam Powell and Tim Davies for their friendship and support through my college
career.
I would like to professionally express my gratitude to Dr. Fred H Yelverton for
giving me the opportunity to pursue a Master’s Degree and for the guidance that he gave
during my career here. I would also like to thank Dr. Grady Miller and Dr. Lane
Tredway for their professional help and guidance as well.
Lastly, I would like to thank fellow graduate students and Research Technicians
for their assistance and support over the past several years; Travis Gannon, Leon Warren,
Adam Hixson, Gerald Henry, Kyle Briscoe, and Mark Brotherton.

v
TABLE OF CONTENTS
Page LIST OF TABLES………………………………………………………….……………vi LIST OF FIGURES……………………………………………………….……………viii CHAPTER 1 Estimating Large Crabgrass (Digitaria sanguinalis) Cover by Multiple Collection
Methods...................................................................................................................1 Abstract...............................................................................................................................1 Introduction........................................................................................................................3 Materials and Methods......................................................................................................7 Results and Discussion.....................................................................................................11 Sources of Materials .......................................................................................................17 Acknowledgments ...........................................................................................................18 Literature Cited ...............................................................................................................19 CHAPTER 2 Effect of Mowing Height on Large Crabgrass (Digitaria sanguinalis) and Brown
Patch (Rhizoctonia solani) Incidence in Turfgrass Systems ............................38 Abstract ............................................................................................................................38 Introduction .....................................................................................................................39 Materials and Methods ...................................................................................................43 Results and Discussion ....................................................................................................47 Sources of Materials .......................................................................................................52 Acknowledgements .........................................................................................................52 Literature Cited ..............................................................................................................53 CHAPTER 3 Effect of Mowing Height on Common Bermudagrass (Cynodon dactylon)
Encroachment in Tall Fescue (Lolium arundinaceum) ....................................61 Abstract ............................................................................................................................61 Introduction .....................................................................................................................62 Materials and Methods ...................................................................................................65 Results and Discussion ....................................................................................................66 Sources of Materials .......................................................................................................72 Acknowledgments ...........................................................................................................72 Literature Cited ..............................................................................................................73

vi
LIST OF TABLES
CHAPTER 1
Table 1. Comparison of digital image analysis, visual ratings, and line intersect analysis to estimate percent crabgrass cover in tall fescue in 2007.......................22
Table 2. Comparison of digital image analysis, visual ratings, and line intersect
analysis to estimate percent crabgrass cover in tall fescue in 2008. .....................23 Table 3. Comparison of digital image analysis, visual ratings, and line intersect
analysis to estimate percent crabgrass cover in tall fescue in 2007 at Raleigh, NC. ........................................................................................................................24
Table 4. Comparison of digital image analysis, visual ratings, and line intersect
analysis to estimate percent crabgrass cover in tall fescue in 2007 at Jackson Springs, NC. ..........................................................................................................26
Table 5. Comparison of digital image analysis, visual ratings, and line intersect
analysis to estimate percent crabgrass cover in tall fescue in 2008 at Raleigh, NC. ........................................................................................................................28
Table 6. Comparison of digital image analysis, visual ratings, and line intersect
analysis to estimate percent crabgrass cover in tall fescue in 2008 at Jackson Springs, NC. ..........................................................................................................30
CHAPTER 2 Table 1. Effect of mowing height on large crabgrass incidence in common
bermudagrass pooled over Jackson Springs, NC and Raleigh, NC, 5 months after initiation.........................................................................................................56
Table 2. Effect of mowing height on large crabgrass incidence in tall fescue pooled
over Jackson Springs, NC and Raleigh, NC; 2007 and 2008, 6 months after initiation. ................................................................................................................57
Table 3. Effect of mowing height on large crabgrass incidence in tall fescue at
Jackson Springs, NC and Raleigh, NC, 6 months after incitation; 2007-2008. ....58 Table 4. Effect of mowing height on brown patch incidence in tall fescue pooled
over fungicide treatments, 6 months after initiation.. ...........................................59

vii
Table 5. Effect of mowing height and fungicide application on brown patch incidence in tall fescue pooled over locations and years, 6 months after initiation. ................................................................................................................60
CHAPTER 3 Table 1. Effect of mowing height on bermudagrass encroachment in tall fescue over
multiple weeks after incitation; 2007. ...................................................................74 Table 2. Effect of mowing height on bermudagrass encroachment in tall fescue over
multiple weeks after incitation; 2008. ...................................................................75 Table 3. Effect of mowing height on bermudagrass encroachment in tall fescue over
multiple weeks after incitation; 2007-2008. .........................................................76

viii
LIST OF FIGURES
CHAPTER 1 Figure 1. Regression analysis of visual ratings verses either line intersect analysis or
digital image analysis in 2007, for the effect of mowing height on crabgrass incidence. ..............................................................................................................32
Figure 2. Regression analysis of visual ratings verses either line intersect analysis or
digital image analysis in 2008, for the effect of mowing height on crabgrass incidence. ..............................................................................................................33
Figure 3. Regression analysis of visual ratings verses either line intersect analysis or
digital image analysis in 2007 at Raleigh, NC, for the effect of various pre-emergence herbicides on crabgrass incidence. .....................................................34
Figure 4. Regression analysis of visual ratings verses either line intersect analysis or
digital image analysis in 2007 at Jackson Springs, NC, for the effect of various pre-emergence herbicides on crabgrass incidence. ...............................................35
Figure 5. Regression analysis of visual ratings verses either line intersect analysis or
digital image analysis in 2008 at Raleigh, NC, for the effect of various pre-emergence herbicides on crabgrass incidence. .....................................................36
Figure 6. Regression analysis of visual ratings verses either line intersect analysis or
digital image analysis in 2008 at Jackson Springs, NC, for the effect of various pre-emergence herbicides on crabgrass incidence. ...............................................37
CHAPTER 3 Figure 1. Plot layout for common bermudagrass installation in tall fescue.......................77

1
CHAPTER 1
Estimating Large Crabgrass (Digitaria sangunalis) Cover by Multiple Collection
Methods.1
J. A. Hoyle, F. H. Yelverton, G. L. Miller, and L. Tredway2
Herbicide efficacy research trials in turfgrass systems commonly report data
based on visual estimates. There has been much interest recently in determining how
accurate and consistent visual estimates relative to other techniques. Other popular
evaluation methodology includes line intersect analysis (LIA) and digital imaging
analysis (DIA). Two separate field experiments were conducted during 2007 and 2008 at
two locations. Both experiments were preformed to determine if rating methods differed
in estimating large crabgrass in tall fescue. Large crabgrass populations were
manipulated by either mowing height or by various pre-emergence herbicides for large
__________________________________________
1 Received for publication ________________ and in approved form ____________.
2 Graduate Research Assistanta, Professora, Professora and Associate Professorb,
respectively. North Carolina Sate University, aDepartment of Crop Science, Box
7620, Raleigh, NC 27695-7620. bDepartment of Pathology, Box 7616, Raleigh, NC
27695-7620.

2
crabgrass germination and growth. Evaluated tall fescue mowing heights included 2.5,
5.1, 7.6 or 10.2 cm, which were initiated once soil temperatures reached an optimum
(12.8° C) for crabgrass emergence. Visual ratings (VR), DIA and LIA were used to
determine percent crabgrass cover for all experiments in mid-September at each location.
No significant differences were noted between VR and DIA and VR and LIA for all
experiments. Regression analysis of VR values against DIA or LIA values was also
conducted. For all mowing height experiments of VR versus DIA expressed r2 value of
0.99 and VR versus LIA, r2 = 0.99, indicated rating methods were highly correlated. For
the pre-emergence herbicide study on large crabgrass similar results were observed.
Hence, no significant differences were detected between VR and DIA and VR and LIA.
These data support the claim that VR is a reliable evaluation method when determining
weed control efficacy.
Nomenclature: large crabgrass, Digitaria sanguinalis (L.) Scop; tall fescue, Lolium
arundinacuem Schreb.
Key Words: rating methods, subjective data, qualitative data, quantitative data
Abbreviations: VR, visual rating; DIA, digital image analysis; LIA, line intersect
analysis; RAL, Raleigh; JAC Jackson Springs, WAIT; weeks after initial treatment, fb;
followed by.

3
INTRODUCTION
Weed populations can have a negative impact on any agronomic crop.
Understanding these populations and how they can be controlled is essential in turfgrass
management. Every year in the turfgrass industry new problems arise in weed science.
This leads to an increasing demand for multiple experiments to be conducted with in the
same growing season. With the increase in research experiments, data collection must be
both accurate and efficient to satisfy all parties involved. Therefore, objective visual
ratings (VR) have become more common and accepted. In turfgrass establishment
studies, VR can be conducted in a short period of time allowing for frequent estimates
relative to DIA or LIA. VR is considered to be a subjective rating (Skogley and Sawyer
1992; Richardson et al. 2001). Subjective or qualitative data acquisition requires less
time, permits large sample size, and requires minimal equipment expenditure (Horst et al.
1984). Evaluators can reduce the frequency of data collection in a trade off for what is to
be considered more quantitative data (Skogley and Sawyer 1992; Richardson et al. 2001).
Quantitative data are usually more precise than the subjective visual ratings, however the
time and cost requirements of quantitative data acquisition often limit its use (Richardson
et al. 2001) as well as logistical and economical considerations (Horst et al. 1984).
Visual evaluation is routinely used in assessing turfgrass cultivars (Horst et al.
1984). These VR are collected by trained evaluators and allow for frequent assessments
throughout the entire growing season (Morris 2002). Visual evaluations are routinely
used to assess performance characteristics of turfgrass cultivars in field plantings (Horst

4
et al. 1984). Visual assessments using numerical scales are the most common means of
evaluating color in turfgrass cultivars (Landschoot and Mancino 2000). Horst et al.
(1984) conducted a field study where 10 trained evaluators rated quality and density in
multiple cultivars of Kentucky bluegrass (Poa pratensis L.) and tall fescue (Lolium
arundinacuem Schreb.) Results from this study showed there is more variation between
the evaluators than were in turfgrass cultivars. Although research has shown subjective
data of turfgrass plots are inadequate in most situations, they have continued to be used
for the past 15 yr (Richardson et al. 2001).
Conventional methods for measuring ground cover include point analysis and LIA
(Oosting 1956; Cook and Stubbendieck 1986; ITT 1996), which are labor intensive
(Booth 2005). Using LIA to estimate ground cover and ecological plant distribution
(Laycock and Canaway 1980; Kershaw 1973) works essentially the same for measuring
weed cover in turf. This method involves setting up a grid system over the entire plot or
quadrant and counting the number or types of plants found at each intersection
(Richardson et al. 2001). The number then is divided by the total number of intersections
and multiplied by 100 to get a percent of desired plant species for that specific area. The
spacing of intersects, size of the grid, and time allocated for counting can all determine
the precision of the resulting data. Subsequently the amount of time and labor required
for data collection of this quantitative data can limit the scope of the research (Richardson
et al. 2001).

5
Recently, new inventions have emerged using digital images to support
qualitative data with quantitative data. DIA has been successfully used to study nitrogen
differences by color in corn (Zea mays L.) (Ewing and Horton 1999) and soybean
(Glycine max L. [Merr.]) canopy coverage (Purcell 2000). This supportive approach has
developed even further to determine fractional cover of senescence and green vegetation
in rangeland (Laiberte et al. 2007). In the turfgrass field, Shaver et al. (2006) used DIA
to determine turfgrass cover when studying dormant seeding bermudagrass (Cynodon
dactylon (L.) Pers.) cultivars in a transition-zone environment. Digital image analysis
was also used to determine the recovery of bermudagrass varieties (Cynodon dactylon
(L.) Pers. x C. transvaalensis Burtt-Davy) and zoysiagrass varieties (Zoysia japonica
Steud., Z. matrella (L.) Merr, and Z. tenuifolia Wild.) from divot injury (Karcher et al.
2005a, Karcher et al. 2005b) and differences in winter injury and freeze tolerance in
zoysiagrass (Zoysia spp.) species and genotypes (Patton and Reicher 2007). Digital
image analysis has also been use to quantify turfgrass color in zoysiagrass (Zoysia
japonica Steud.) and creeping bentgrass (Agrostis palustris Huds.) (Karcher and
Richardson 2003).
Technological advances in DIA have used computer programs to analyze the
digital images by quantifying green-leaf area in large batches of digital images (Booth et
al. 2005). The “VegMeasure” software program developed at Oregon State University
(Louhaichi et al. 2001; Johnson et al. 2003) was used by Booth et al. (2005) to compare
methods of measuring ground cover. It was found there was no difference between

6
digital imaging software (VegMeasure) and a digital grid overlay (similar to LIA) in
determining percent green cover. Other computer programs have been used to quantify
wavelengths and analyze data through statistical software, as Ewing and Hortin (1999)
did to quantify color images of corn crop. Purcell (2000) and Richardson et al. (2001)
used a commercially available software program, Sigma Scan (v. 5.0, SPSS, Inc.,
Chicago IL 60611) to determine the portion of ground area covered by soybean (Glycine
max L. [Merr.]), bermudagrass (Cynodon dactylon (L.) Pers.), and zoysiagrass (Zoysia
japonica Steudel). Research conducted by Butler et al. (2004) in digital photography
using Sigma Scan, resulted in a more effective tool than visual estimates for assessment
of spring dead spot incidence in bermudagrass (Cynodon dactylon (L.) Pers. x C.
transvaalensis Burtt-Davy). Richardson et al (2001) determined that DIA was an
effective tool for measuring turfgrass cover and was significantly different from other
rating methods of LIA and VR tested on the same plots.
Our hypothesis is that DIA, LIA, and VR can all be used to evaluate weed
incidence in turfgrass. The objective of this research is to determine if there are
differences among DIA, LIA, and VR for estimating percent crabgrass cover in weed
control experiments involving different mowing heights or application of various pre-
emergence herbicides.

7
MATERIALS AND METHODS
Mowing Height Study. Experiments were conducted to determine if multiple
ratings methods differed in determining the effect of mowing height on crabgrass
incidence in tall fescue. Field experiments were initiated in RAL at Lake Wheeler Field
Labs and in JAC at Sandhills Research Station on 6 March 2007 and 3 March 2008. Soil
was a Wakulla sand (siliceous, thermic psammentic hapludults) in JAC with 0.86%
humic matter and pH 5.5. Soil in RAL was an Appling fine sandy loam (fine, kaolinitic,
thermic typic kanhapludult) with 1.19% humic matter and pH 5.8.
At initiation, areas were mown at a 5.1 cm height to remove debris and make for
ease of sowing large crabgrass seed. Large crabgrass3 was slit and broadcast seeded at
170 – 190 kg/ha. A Toro Seeder 93 (Bloomington, MN 55420) attached to a John Deere
4700 Tractor (Moline, Illinois 61265-8098) was used in at least four directions to apply
approximately 90 kg/ha of large crabgrass seed. A broadcast spreader was then used in
two directions to apply the remaining (approximately 90 kg/ha) large crabgrass seed.
Mowing height treatments (2.5, 5.1, 7.6, and 10.2 cm) were initiated once soil
temperatures reached a daily average of 12.8° C: 14 March 2007 and18 March 2008.
Treatments were replicated four times each year at both locations. Plots were 2.1 by 1.2
m and treatments applied in a randomized complete block design. Mowing treatments
were performed every 3 to 4 d with a rotary mower (Honda HRC 216, Alpharetta, GA
30005-8847) with clippings returned. Plot areas in RAL and JAC were fertilized4 with N
at 24 kg/ha and 38.4 kg/ha respectively throughout the growing season. To provide better

8
contrast between large crabgrass and turfgrass, mesotrione5 was applied to the entire plot
area at 0.24 kg ai/ ha on 24 September 2007 and 05 September 2008. Mesotrione was
applied with a CO2 pressurized hand-held spray boom equipped with four VS8003XR6
flat fan nozzles on 38 cm spacing’s calibrated to deliver 304 L/ha.
VR, LIA, and DIA were used to determine crabgrass cover and recorded at 10
October 2007 and 18 September 2008. VR utilized a 0 (no crabgrass) to 100% (complete
crabgrass cover) scale that was estimated by an evaluator looking at the research plots.
LIA (5.1 cm spacing) utilized a 0 (no crabgrass) to 100% (complete crabgrass cover)
scale after intersect counts were converted using Equation 1.
(Counted Intersects / (Total Intersects=943)) x 100 [1]
DIA utilized a 0 (no crabgrass) to 100% (complete crabgrass cover) scale after digital
images were analyzed using SigmaScan Pro (v 5.0, SPSS, Inc., Chicago, IL 60611).
Pre-emergence Herbicide Study. Experiments were conducted to determine if
multiple ratings methods differed in determining the effect of pre-emergence herbicides
on crabgrass populations in tall fescue. Field experiments were initiated in RAL and in
JAC on 6 March 2007 and 3 March 2008. Large crabgrass was sown as described above
for the mowing height study. Four replicates were included at both locations and both
years. Plots were 1.5 by 3 m and treatments applied in a randomized complete block
design.

9
Initial treatments were applied on 13 March 2007 and 2008. Treatments applied
included prodiamine7, at 0.84 or 0.57 fb 0.27 kg ai/ha, dithiopyr8, at 0.57 or 0.27 fb 0.27
kg ai/ha, oxadiazon9, at 3.36 or 1.68 fb 1.68 kg ai/ha, pendimethalin10, at 3.36 or 1.68 fb
1.68 kg ai/ha, oryzalin11, at 3.36 or 1.68 fb 1.68 kg ai/ha, and benefin + trifluralin12, at
3.36 or 1.68 fb 1.68 kg ai/ha. Eight weeks after initial treatment (WAIT) applications
were applied on 13 May 2007 and 6 May 2008. Treatments were applied with a CO2
pressurized hand-held spray boom equipped with four VS8003XR6 flat fan nozzles on 25
cm spacing’s calibrated to deliver 304 L/ha. Plots were irrigated with 0.64 cm of water
immediately after the initial treatments and 8 WAIT applications by overhead irrigation.
The tall fescue was mowed every 3 to 4 d at 6.4 cm mowing height with a rotary mower.
All tall fescue research plot areas received the same fertilizer regiment as the mowing
height study described above. Mesotrione5 was applied to entire plot area at 0.24 kg ai/
ha on 24 September 2007 and 05 September 2008.
VR, LIA, and DIA were used to determine crabgrass cover and recorded at 10
October 2007 and 18 September 2008. VR, LIA, and DIA utilized same scale as previous
mowing height study.
Digital image analysis. Digital images were obtained using a digital camera
(Nikon D80, Nikon Inc., Chiyoda-ku, Tokyo, 100-8331, Japan) mounted on an aluminum
tubing tri-pod stand (Manfrotto 190XPROB, Ramsey, NJ 07446-0506). Recent studies
by Richardson et al (2001) described digital image collection. The tri-pod stand was 122
cm high and consisted of a 90°, 24 cm horizontal arm, allowing for a photo image from

10
directly above the plot. A wired remote was used to operate the camera shutter. Images
were saved in the JPEG (joint photographic experts group, .jpg) format. Digital images
were 560 x 400 pixels with a color depth of 64,000 colors. Camera settings included
focal length of 32 mm, aperture of F7.1, and a shutter speed of 1/200 s, with the white
balance set to the natural light source.
Digital images were downloaded to a personal computer and batch analyzed by
SigmaScan Pro, (Karcher and Richardson 2005). Initial work with similar images
concluded that the hue range and saturation range to determine percent tall fescue were to
be set at 43 to 100 and 0 to 100 respectively. Equation 2 was then used to determine the
percent crabgrass cover from the digital images.
(100 - % Tall Fescue from SigmaScan Output) = % Crabgrass Cover [2]
Data analysis. Percent crabgrass cover estimates from DIA and LIA were
compared to VR by regression analysis, subjected to ANOVA and means were separated
according to Fisher’s Protected LSD (P=0.05) using SAS Statistical Software (SAS Inc.,
Cary, NC) and SigmaPlot (v 11.1, Systat Software In., San Jose, CA). A treatment by
year interaction for mowing height study prevented pooling data across years; thus data
are presented separately. A treatment by year by location interaction for the pre-
emergence herbicide study prevented pooling data across years and locations; thus data
are presented separately.

11
RESULTS AND DISCUSSION
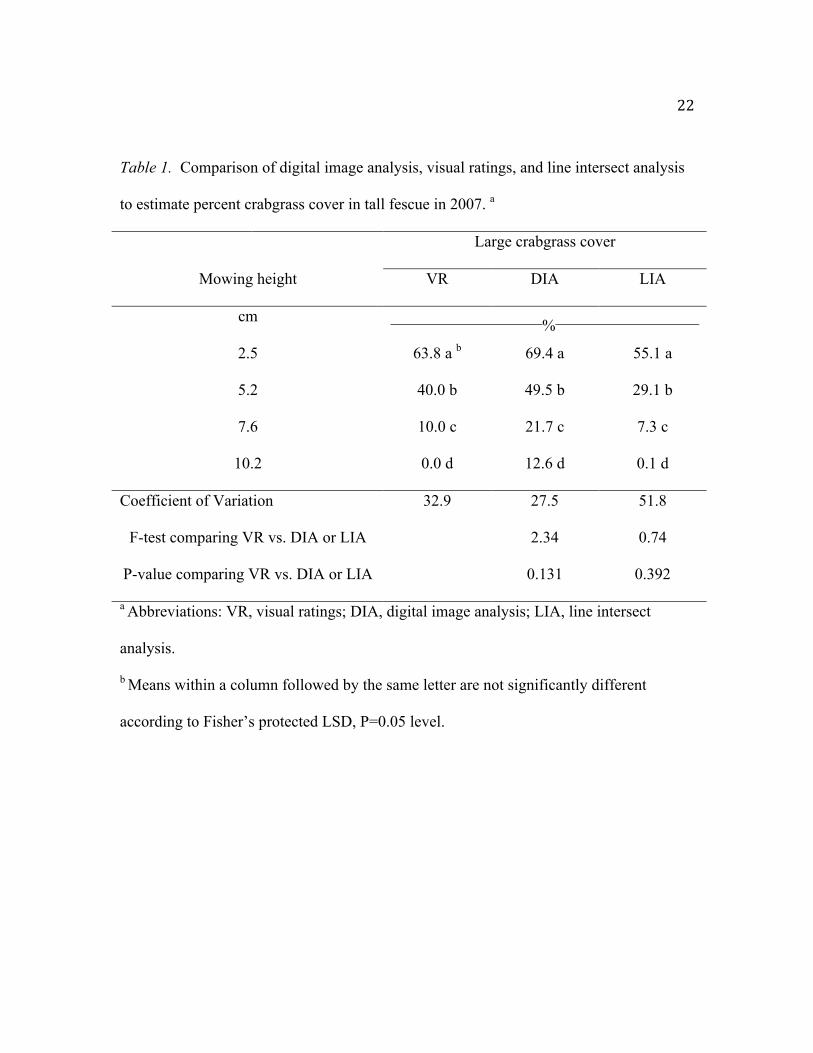
Mowing Height Study. Three rating methods were compared to estimate percent
crabgrass cover in tall fescue at various mowing heights. In 2007, DIA compared to VR
showed no significant difference between the rating methods (F-test = 2.34, P-value =
0.131) (Table 1). Likewise was the case for LIA when compared with VR, in 2007 (F-
test = 0.74, P-value = 0.392). For the 2007 data, the coefficient of variation (CV) was
32.9, 27.5, and 51.8 for VR, DIA, and LIA respectively. Four statistical groupings were
observed for each of the rating methods based upon mowing height. Note at the 10.2 cm
mowing height DIA showed 12.6 % crabgrass cover while LIA and VR showed there to
be none, 0 or 0.1 respectively. With no crabgrass present in the plots it can be said that
DIA tended to over estimate percent crabgrass at the higher mowing heights when
compared to VR and LIA underestimated percent crabgrass at lower lowing heights
compared to VR (Table 1).
In the 2008 data similar results were found (Table 2). When comparing VR to
DIA there was no significant difference between rating methods (F-test = 0.12, P-value =
0.725) and when comparing VR to LIA there was no significant difference (F-test = 0.52,
P-value = 0.471). The CV followed the same trend in 2008 as in 2007 with 35.3, 41.1,
and 64.7 for VR, DIA, and LIA respectively. VR and LIA for mowing heights of 2.5,
5.2, 7.6, and 10.2 cm resulted in all being significantly different from one another. DIA
did not statistically separate the 7.6 and 10.2 cm mowing height while LIA and VR did.
As in 2007 DIA in 2008 tended to over estimate the percent crabgrass cover in tall fescue

12
at the higher mowing heights and LIA under estimate percent crabgrass cover compared
to VR.
Because LIA (a quantitative data collection rating method) and VR (subjective
data collection rating method) were shown to be no different from one another at all
mowing heights and VR are commonly used in weed control studies, regression analysis
was applied to the measured values of percent crabgrass cover for VR to DIA or LIA. In
2007 data, regression analysis showed DIA and LIA were closely related to VR with as
noted by an r2 of 0.99 (Figure 1). Both DIA and LIA had slopes of 0.89 and 0.84
respectively. Line intersect analysis seemed to underestimate percent crabgrass cover at
the lower mowing heights (where values of crabgrass cover were higher) when compared
to VR and were very similar at the higher mowing heights. Digital image analysis tended
to over estimate percent crabgrass cover as seen in Figure 1 and in Table 1 in 2007. This
is supported by a y-intercept value of 12.97 and near parallel lines. This explains a high
correlation of these rating methods but more calibration was needed to fine-tune the
rating methods. Due to better calibration of DIA the regression line of DIA versus VR for
2008 is closer to the 1:1 relationship (Figure 2) than in 2007 (Figure 1). DIA still
overestimated percent crabgrass cover at the higher mowing heights because of shadows
but not as drastic as in 2007. DIA and LIA versus VR as noted by the r2 value of 0.99 are
closely related. Both rating methods (DIA and LIA) had slopes of 0.84 and 0.83
respectively. In both years, Figure 1 and Figure 2 indicate no difference in rating

13
methods when estimating percent crabgrass cover in tall fescue at multiple mowing
heights.
Because of the multiple mowing heights, calibration of DIA was needed to
compensate for shadows in the turfgrass system. DIA is an effective tool along with LIA
and VR to estimate percent crabgrass cover in a tall fescue research plot. Advantages of
VR and DIA are less time consuming compared to LIA, allowing evaluators more time in
the field to rate multiple research plots. VR and DIA require the same amount of time
once all initial calibration for DIA has been completed. Initial calibration of DIA is very
time consuming. LIA is time consuming if counts are conducted in the field as was the
case in this study. Disadvantages of DIA consist of equipment cost, moving equipment
to and from research site, calibration of the camera for various locations for different
weed species and turf species, calibration of Sigma Scan software to allow for thresholds
to choose a pixel that is considered a weed or considered a turfgrass species. For DIA to
be an effective methodology there must be a detectable color difference between the
weed large crabgrass, and the turfgrass species tall fescue. To achieve this difference
mesotrione was applied to the turfgrass system. In this case a color difference was
achieved but there is not always an established recipe nor method to select for a
detectable color difference by application of a chemical. These data indicate that VR can
be accepted as reliable data in weed control research.
Pre-emergence Herbicide Study. Concurrent with the mowing height study,
data were collected by three different methods in a pre-emergence herbicide study for

14
crabgrass control in tall fescue. The same analysis was preformed in this study as was
employed in the mowing height study. Performance of the various pre-emergence
herbicides varied from location and year not allowing data to be pooled because of the
wide range of percent crabgrass cover values. DIA and LIA were not different from VR
with a F-Test = 0.14 (P-value = 0.713) and F-test = 1.2 (P-value = 0.275) respectively in
2007 at RAL (Table 3). The CV among the rating methods was 40.9, 27.4, and 27.3 for
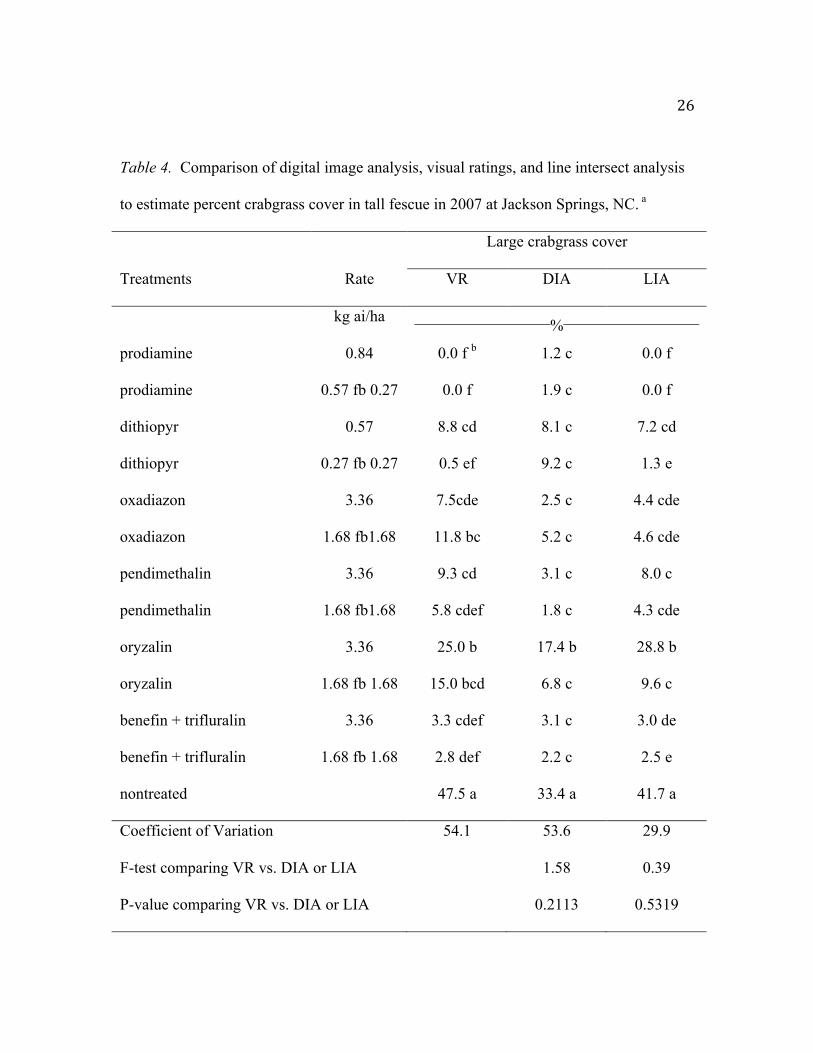
DIA, LIA, and VR, respectively. Table 4 shows the data collected in 2007 at JAC. DIA
and LIA were not different from VR as well with F-test = 1.58 (P-value = 0.211) and F-
Test = 0.39 (P-value = 0.532), respectively. CV for DIA and VR were very similar with
53.6 and 54.1 respectively and LIA had a CV of 29.9. In 2008, RAL, Table 5 shows that
there was also no difference between DIA and VR with F-Test (2.93) and P-value of
0.09. LIA was also different from VR with a F-Test of 1.11 and a P-Value of 0.294. CV
among the rating types were 53.6, 28.6, and 56.9 for VR, DIA, and LIA, respectively.
Lastly, in 2008 JAC provided the same results as all other locations, times, and
studies (Table 6). Table 6 shows that DIA was no different from VR with a P-Value of
0.375 from a F-Test of 0.79 and LIA was not statistically different from VR with a P-
Value of 0.681 from a F-Test of 0.17. The variances among VR, DIA, and LIA were
62.7, 30.4, and 71.2, respectively.
In RAL for 2007, DIA and LIA both showed a fairly high r2 value of 0.83 and
0.88, respectively when compared to VR (Figure 3). Also, DIA had a slope of 0.48 but
LIA had a slope of 0.77. For RAL in 2007 LIA more closely fit to the 1:1 relationship

15
with VR than DIA. DIA also tended to over estimate the percent crabgrass cover at the
lower values of percent crabgrass cover and under estimate percent crabgrass cover at
higher values compared to VR. LIA generally, tended to underestimate percent crabgrass
cover throughout all the pre-emergence herbicide treatments when compared to VR.
Figure 4 shows the results for the regression in 2007 at JAC and similar results were
found. DIA was more closely related to VR with an r2 value of 0.86 but LIA again was
more closely related to VR with an r2 value of 0.94. DIA and LIA in general did not
overestimate percent crabgrass cover as at RAL, but rather under estimate percent
crabgrass when compared to VR. LIA had a very close relationship to the 1:1 line with a
slope of 0.91 while DIA had a slope of 0.64 but still was not significantly different from
VR. Both DIA and LIA underestimated the control plot compared to VR at higher values
of percent crabgrass. In 2008, RAL (Figure 5) showed that DIA and LIA were closely
related to VR with an r2 value of 0.81 and 0.91, respectively. DIA tended to overestimate
percent crabgrass but had a slope of 0.69 while LIA tended to underestimate percent
crabgrass with a slope of 0.84. At JAC in 2008 (Figure 6) percent crabgrass had lower
values compared to RAL in 2008 (Figure 5). In Figure 6, DIA was related to VR as
noted by an r2 value of 0.82 but LIA was more closely related to VR as noted by an r2
value of 0.89. DIA tended to overestimate percent crabgrass at lower values. LIA was
very close to the 1:1 relationship for all values except one high value of percent
crabgrass. DIA and LIA had slopes of 0.62 and 0.78 respectively.

16
In conclusion, for both studies there are no differences among the DIA or LIA
rating methods as compared to VR. In general, DIA tended to over estimate percent
crabgrass and LIA tended to underestimated percent crabgrass when comparing to VR.
This is believed to be caused by shadows that occur when the digital images are captured.
The shadows are considered outside the threshold of green tissue selected in Sigma Scan
and in turn are counted as the pixels in the crabgrass range. In the mowing height study
the regression analysis shows that there needs to be more calibration in the rating
methods to have a 1:1 relationship. Adjusting camera settings for light conditions can
refine calibration and increase precision. Problems associated with DIA consist of being
able to apply this rating method to a wide range of weed species. Because of the time
required for data collection, LIA is time consuming and restricts the size of a research
trial and the number of data collection dates. DIA is an ideal rating method for
establishment studies where there is a greater difference between green leaf tissue and
bare ground which Sigma Scan can easily differentiate. Also, DIA is more practical for a
lower growing turf where shadows would not affect the outcome of the data. DIA and
LIA are not practical for data collection in weed control studies for the various reasons
stated herein, therefore VR can be more widely accepted and applicable for weed control
studies. However, the inherent problems associated with VR remain.
This data contradicts findings from Richardson et al. in 2001 were it was found
that DIA and subjective analysis (VR in current study) were different from one another
when estimating turfgrass cover. The data from the current study shows no different

17
between VR and DIA. Another study to estimate spring dead spot in bermudagrass
showed that DIA was a more effective tool and different from VR and LIA (Butler et al.
2004), which was also contradictory to findings in this study. These two studies also were
looking at only one species of vegetation, a turfgrass species. This research was looking
at two different vegetative species, a turfgrass species and a weed species. The multiple
species could have played a role in affecting DIA and LIA estimations by having close
color relationship even if treated with a chemical bleaching agent.
SOURCES OF MATERIALS
3 Lorenz’s Ok Seeds, 511 W Oklahoma, Okeene, OK 73763
4 Harrell’s Fertilizer – Greensboro, NC
5 Mesotrione, Callisto, Syngenta Crop Protection, Greensboro, NC 27409
6 Teejet Spraying Systems Company, North Avenue Wheaton, IL 60189-7900
7 Prodiamine, Barricade 65WG, Syngenta Crop Protection, Greensboro, NC
27409
8 Dithiopyr, Dimension Ultra 40WP, Dow AgroSciences, LLC., Indianapolis, IN
46268
9 Oxadiazon, Ronstar 2G- Bayer CropScience, Alfred-Nobel-Str.50 D-40789
Monheim am Rhein, Germany
10 Pendimethalin, Pendulum AquaCap 3.8CS, BASF Corporation, 26 Davis Drive,
Research Triangle Park, NC 27709

18
11 Oryzalin, Surflan 4FL, Dow AgroSciences, LLC., Indianapolis, IN 46268
12 Benefin + trifluralin – Team Pro 0.86G on 25-3-8, Anderson’s Lawn Fertilizer,
PO BOX 119, Mauee, OH 43537
ACKNOWLEDGEMENTS
The authors express appreciation to Travis Gannon and Leon Warren for their
technical assistance and Dr. Arellano Consuelo for statistical assistance.

19
LITERATURE CITED
Booth, D.T., S.E. Cox, C. Fifield, M. Phillips, and N. Williamson. 2005. Image Analysis
Compared with Other Methods for Measuring Ground Cover. Arid Land Research
and Management. 19:91-100.
Butler, E.L., L. Tredway, C. Peacock, and D. Shew. “Development of Novel Strategies
for Control of Spring Dead Spot in Bermudagrass”. Thesis. North Carolina State
University, 2004.
Cook, C.W. and J. Studdendieck. 1986. Range research: Basic problems and techniques.
Society for Range Management, Denver, Colorado, USA.
Ewing, R.P., and R. Horton. 1999. Quantitative color image analysis of agronomic
images. Agron. J. 76:619-622.
Horst, G.L., M.C. Engelke, and W. Meyers. 1984. Assessments of visual evaluation
techniques. Agron. J. 76:619-622.
Interagency Technical Team (ITT). 1996. Sampling Vegetation Attributes, Interagency
Technical Report 17. United States Department of Agriculture, Forest Service.
Rocky Mountain Research Station, Fort Collins, Colorado, USA.
Johnson, D.E., M. Vulfson, M. Louhaichi, and N.R. Harris. 2003. VegMeasure version
1.6 users manual. Department of Rangeland Resources, Oregon State University,
Corvallis, Oregon, USA.
Karcher, D.E. and M.D. Richardson. 2005. Batch Analysis of Digital Images to Evaluate
Turfgrass Characteristics. Crop Sci. 45:1536-1539.

20
Karcher, D.E. and M.D. Richardson. 2003. Quantifying Turfgrass Color Using Digital
Image Analysis. Crop Sci. 43:943-951.
Karcher, D.E., M.D. Richardson, J.W. Landreth, J.H. McCalla Jr. Recovery of
Bermudagrass Varieties from Divot Injury. 2005. Online. Applied Turfgrass
Science. doi:10.1094/ATS-2005-0117-01-RS.
Karcher, D.E., M.D. Richardson, J.W. Landreth, J.H. McCalla Jr. Recovery of
Zoysiagrass Varieties from Divot Injury. 2005. Online. Applied Turfgrass
Science. doi:10.1094/ATS-2005-0728-01-RS.
Kershaw, K.A. 1973. Quantitative and dynamic plant ecology. 2nd ed. Am. Elsevire
Publishing Co., New York.
Landschoot, P.J., C.F. Mancino. 2000. A Comparison of Visual vs. Instrumental
Measurement of Color Differences in Bentgrass Turf. HortScience. 35(5):914-
916.
Laycock, R.W., and P.M. Canaway. 1980 An optical point quadrant frame for the
estimation of cover in closely-mown turf. J. Sports Turf Res. Inst. 56:91-92.
Louhaichi, M., M.M. Borman, and D.E. Johnson. 2001. Spatially coated platform and
aerial photography for documentation of grazing impacts in wheat. Geocarta. 16;
63-68.
Morris, K. N. 2002. A guide to NTEP turfgrass rating. A publication of the National
Turfgrass Evaluation program, NETP. 11: 30-39.
Oosting, H.J. 1956. The study of plant communities. W.H. Freeman and Co. San

21
Francisco, California, USA.
Patton, A.J. and Z.J. Reicher. 2007. Zoysiagrass Species and Genotypes Differ in Their
Winter Injury and Freeze Tolerance. Crop Sci. 47:1619-1627.
Purcell, L.C. 2000. Soybean canopy coverage and light interception measurements using
digital imagery. Crop. Sci. 40:834-837.
Richardson, M.D., D.E. Karcher, and L.C. Purcell. 2001. Quantifying Turfgrass Cover
Using Digital Image Analysis. Crop Sci. 41:1884-1888.
Shaver, B.R., M.D. Richardson, J.H. McCalla, D.E.Karcher, and P.J Berger. 2006.
Dormant Seeding Bermudagrass Cultivars in a Transition-Zone Environment.
Crop Sci. 46:1787-1792
Skogley, C.R. and C.D. Sawyer. 1992. Field Research. pp 589-614 In D.V. Waddington
et al. (ed.) Turfgrass. Agron. Monogr. 32. ASA, CSSA, and SSSA, Madison, WI.
22
Table 1. Comparison of digital image analysis, visual ratings, and line intersect analysis
to estimate percent crabgrass cover in tall fescue in 2007. a
Large crabgrass cover
Mowing height VR DIA LIA
cm ___________________%__________________
2.5 63.8 a b 69.4 a 55.1 a
5.2 40.0 b 49.5 b 29.1 b
7.6 10.0 c 21.7 c 7.3 c
10.2 0.0 d 12.6 d 0.1 d
Coefficient of Variation 32.9 27.5 51.8
F-test comparing VR vs. DIA or LIA 2.34 0.74
P-value comparing VR vs. DIA or LIA 0.131 0.392
a Abbreviations: VR, visual ratings; DIA, digital image analysis; LIA, line intersect
analysis.
b Means within a column followed by the same letter are not significantly different
according to Fisher’s protected LSD, P=0.05 level.

23
Table 2. Comparison of digital image analysis, visual ratings, and line intersect analysis
to estimate percent crabgrass cover in tall fescue in 2008. a
Large crabgrass cover
Mowing height VR DIA LIA
cm ___________________%__________________
2.5 59.4 a b 58.6 a 49.6 a
5.2 34.8 b 36.7 b 27.4 b
7.6 10.3 c 16.4 c 8.6 c
10.2 2.2 d 10.8 c 1.9 d
Coefficient of Variation 35.3 41.1 64.7
F-test comparing VR vs. DIA or LIA 0.12 0.52
P-value comparing VR vs. DIA or LIA 0.725 0.471
a Abbreviations: VR, visual ratings; DIA, digital image analysis; LIA, line intersect
analysis.
b Means within a column followed by the same letter are not significantly different
according to Fisher’s protected LSD, P=0.05 level.

24
Table 3. Comparison of digital image analysis, visual ratings, and line intersect analysis
to estimate percent crabgrass cover in tall fescue in 2007 at Raleigh, NC. a
Large crabgrass cover
Treatments Rate VR DIA LIA
kg ai/ha _________________%_________________
prodiamine 0.84 3.8 ef b 7.5 c 4.7 efg
prodiamine 0.57 fb 0.27 1.3 f 9.9 bc 0.8 h
dithiopyr 0.57 21.3 abc 14.9 abc 15.3 bc
dithiopyr 0.27 fb 0.27 10.0 bcde 12.9 abc 11.3 bcd
oxadiazon 3.36 5.3 def 8.3 c 3.1 fgh
oxadiazon 1.68 fb1.68 3.0 ef 7.5 c 1.7 gh
pendimethalin 3.36 13.8 bcd 11.0 bc 12.7 bcd
pendimethalin 1.68 fb 1.68 8.8 cde 13.3 abc 13.7 bcd
oryzalin 3.36 31.3 a 23.6 a 26.3 a
oryzalin 1.68 fb 1.68 20.0 abc 16.2 abc 14.2 bc
benefin + trifluralin 3.36 11.3 bcde 16.4 abc 8.0 cde
benefin +trifluralin 1.68 fb 1.68 13.8 bcde 15.3 abc 7.9 def
nontreated 23.8 ab 19.8 ab 19.4 ab
Coefficient of Variation 40.9 27.4 27.3
F-test comparing VR vs. DIA or LIA 0.14 1.2
P-value comparing VR vs. DIA or LIA 0.7136 0.2756

25
Table 3. Continued.
a Abbreviations: RAL, Raleigh, NC; VR, visual ratings; DIA, digital image analysis; LIA,
line intersect analysis.
b Means within a column followed by the same letter are not significantly different
according to Fisher’s protected LSD, P=0.05 level.
26
Table 4. Comparison of digital image analysis, visual ratings, and line intersect analysis
to estimate percent crabgrass cover in tall fescue in 2007 at Jackson Springs, NC. a
Large crabgrass cover
Treatments Rate VR DIA LIA
kg ai/ha _________________%_________________
prodiamine 0.84 0.0 f b 1.2 c 0.0 f
prodiamine 0.57 fb 0.27 0.0 f 1.9 c 0.0 f
dithiopyr 0.57 8.8 cd 8.1 c 7.2 cd
dithiopyr 0.27 fb 0.27 0.5 ef 9.2 c 1.3 e
oxadiazon 3.36 7.5cde 2.5 c 4.4 cde
oxadiazon 1.68 fb1.68 11.8 bc 5.2 c 4.6 cde
pendimethalin 3.36 9.3 cd 3.1 c 8.0 c
pendimethalin 1.68 fb1.68 5.8 cdef 1.8 c 4.3 cde
oryzalin 3.36 25.0 b 17.4 b 28.8 b
oryzalin 1.68 fb 1.68 15.0 bcd 6.8 c 9.6 c
benefin + trifluralin 3.36 3.3 cdef 3.1 c 3.0 de
benefin + trifluralin 1.68 fb 1.68 2.8 def 2.2 c 2.5 e
nontreated 47.5 a 33.4 a 41.7 a
Coefficient of Variation 54.1 53.6 29.9
F-test comparing VR vs. DIA or LIA 1.58 0.39
P-value comparing VR vs. DIA or LIA 0.2113 0.5319

27
Table 4. Continued
a Abbreviations: JAC, Jackson Springs, NC; VR, visual ratings; DIA, digital image
analysis; LIA, line intersect analysis.
b Means within a column followed by the same letter are not significantly different
according to Fisher’s protected LSD, P=0.05 level.

28
Table 5. Comparison of digital image analysis, visual ratings, and line intersect analysis
to estimate percent crabgrass cover in tall fescue in 2008 at Raleigh, NC. a
Large crabgrass cover
Treatments Rate VR DIA LIA
kg ai/ha _________________%_________________
prodiamine 0.84 10.0 ab b 14.1 ab 7.2 ab
prodiamine 0.57 fb 0.27 11.3 ab 13.7 ab 7.3 ab
dithiopyr 0.57 16.3 ab 21.7 ab 14.2 ab
dithiopyr 0.27 fb 0.27 6.3 b 13.8 ab 4.3 b
oxadiazon 3.36 7.5 b 10.0 b 5.7 b
oxadiazon 1.68 fb 1.68 10 b 12.7 b 9.2 b
pendimethalin 3.36 7.5 b 13.8 ab 4.9 b
pendimethalin 1.68 fb 1.68 6.3 b 12.0 b 8.5 b
oryzalin 3.36 12.5 ab 14.1 ab 10.8 ab
oryzalin 1.68 fb 1.68 20.0 ab 19.9 ab 16.1 ab
benefin + trifluralin 3.36 13.8 ab 20.7 ab 9.2 ab
benefin +trifluralin + 1.68 fb1.68 17.5 ab 19.4 ab 16.3 ab
nontreated 26.3 a 25.3 a 21.9 a
Coefficient of Variation 53.8 28.6 56.9
F-test comparing VR vs. DIA or LIA 2.93 1.11
P-value comparing VR vs. DIA or LIA 0.0901 0.2945

29
Table 5. Continued.
a Abbreviations: RAL, Raleigh, NC; VR, visual ratings; DIA, digital image analysis; LIA,
line intersect analysis.
b Means within a column followed by the same letter are not significantly different
according to Fisher’s protected LSD, P=0.05 level.

30
Table 6. Comparison of digital image analysis, visual ratings, and line intersect analysis
to estimate percent crabgrass cover in tall fescue in 2008 at Jackson Springs, NC; a
Large crabgrass cover
Treatments Rate VR DIA LIA
kg ai/ha _________________%_________________
prodiamine 0.84 0.3 ef b 2.8 d 0.2 d
prodiamine 0.57 fb 0.27 0.0 f 2.6 d 0.0 d
dithiopyr 0.57 10.0 abc 9.9 ab 9.8 abc
dithiopyr 0.27 fb 0.27 3.0 cdef 4.1 cd 2.5 bcd
oxadiazon 3.36 2.0 cdef 3.8 cd 1.1 d
oxadiazon 1.68 fb 1.68 3.0 cde 3.9 cd 2.0 cd
pendimethalin 3.36 2.8 cdef 5.8 bcd 1.7 d
pendimethalin 1.68 fb 1.68 0.5 def 3.8 cd 0.3 d
oryzalin 3.36 10.0 ab 13.5 a 8.5 ab
oryzalin 1.68 fb 1.68 11.3 ab 8.9 abc 12.2 a
benefin + trifluralin 3.36 3.5 bcd 4.1 cd 2.5 bcd
benefin +trifluralin 1.68 fb 1.68 1.3 def 3.6 d 1.0 d
nontreated 17.5 a 11.8 a 16.1 a
Coefficient of Variation 62.7 30.4 71.2
F-test comparing VR vs. DIA or LIA 0.79 0.17
P-value comparing VR vs. DIA or LIA 0.3755 0.6815

31
Table 6. Continued.
a Abbreviations: JAC, Jackson Springs, NC; VR, visual ratings; DIA, digital image
analysis; LIA, line intersect analysis.
b Means within a column followed by the same letter are not significantly different
according to Fisher’s protected LSD, P=0.05 level.

32
Figure 1. Regression analysis of visual ratings verses either line intersect analysis or
digital image analysis in 2007, for the effect of mowing height on crabgrass incidence.a
a Abbreviations: VR, visual ratings; DIA, digital image analysis; LIA, line intersect
analysis.
b 1:1 relationship is exemplified by the dotted line within the figure.

33
Figure 2. Regression analysis of visual ratings verses either line intersect analysis or
digital image analysis in 2008, for the effect of mowing height on crabgrass incidence.a
a Abbreviations: VR, visual ratings; DIA, digital image analysis; LIA, line intersect
analysis.
b 1:1 relationship is exemplified by the dotted line within the figure.

34
Figure 3. Regression analysis of visual ratings verses either line intersect analysis or
digital image analysis in 2007 at Raleigh, NC, for the effect of various pre-emergence
herbicides on crabgrass incidence.a
a Abbreviations: VR, visual ratings; DIA, digital image analysis; LIA, line intersect
analysis; RAL, Raleigh (North Carolina).
b 1:1 relationship is exemplified by the dotted line within the figure.

35
Figure 4. Regression analysis of visual ratings verses either line intersect analysis or
digital image analysis in 2007 at Jackson Springs, NC, for the effect of various pre-
emergence herbicides on crabgrass incidence.a
a Abbreviations: VR, visual ratings; DIA, digital image analysis; LIA, line intersect
analysis; JAC, Jackson Springs (North Carolina).
b 1:1 relationship is exemplified by the dotted line within the figure.

36
Figure 5. Regression analysis of visual ratings verses either line intersect analysis or
digital image analysis in 2008 at Raleigh, NC, for the effect of various pre-emergence
herbicides on crabgrass incidence.a
a Abbreviations: VR, visual ratings; DIA, digital image analysis; LIA, line intersect
analysis; RAL, Raleigh (North Carolina).
b 1:1 relationship is exemplified by the dotted line within the figure.

37
Figure 6. Regression analysis of visual ratings verses either line intersect analysis or
digital image analysis in 2008 at Jackson Springs, NC, for the effect of various pre-
emergence herbicides on crabgrass incidence.a
a Abbreviations: VR, visual ratings; DIA, digital image analysis; LIA, line intersect
analysis; JAC, Jackson Springs (North Carolina).
b 1:1 relationship is exemplified by the dotted line within the figure.
38
CHAPTER 2
Effect of Mowing Height on Large Crabgrass (Digitaria sanguinalis) and Brown
Patch (Rhizoctonia solani) Incidence in Turfgrass Systems.1
J. A. Hoyle, F. H. Yelverton, G. L. Miller, L. Tredway2
Tall fescue and common bermudagrass are widely used in turf areas including
home lawns, commercial properties, schools, airports, etc. There are several pests that
homeowners and turfgrass managers must contend with when managing these turf
species. Large crabgrass is among the most troublesome weed in these areas and brown
patch is one of the most common diseases affecting tall fescue. These common turf
weeds and diseases become a major problem because they are able to establish quickly,
reproduce quickly, and may be enhanced by the transitional zone climate. Field
experiments were conducted during 2007 and 2008 at two locations to determine if turf
mowing height could suppress large crabgrass in common bermudagrass and the effect on
__________________________________________
1 Received for publication ________________ and in approved form ____________.
2 Graduate Research Assistanta, Professora, Professora and Associate Professorb,
respectively. North Carolina Sate University, aDepartment of Crop Science, Box
7620, Raleigh, NC 27695-7620. bDepartment of Pathology, Box 7616, Raleigh, NC
27695-7620.

39
large crabgrass and brown patch in tall fescue. Evaluated bermudagrass mowing heights
included 1.3, 2.5, 3.8, and 5.1 cm and 2.5, 5.1, 7.6, and 10.2 cm in tall fescue. These
mowing heights were initiated once soil temperatures reached an optimum for crabgrass
emergence. In bermudagrass, no significant trends were discerned among mowing
heights or locations. However, there were significant differences in crabgrass cover in
tall fescue by early-September. The presence of brown patch did not affect crabgrass
incidence. Increasing mowing height decreases crabgrass cover and increases brown
patch infection. Fungicide applications reduce the amount of brown patch cover over all
mowing heights. Results show that the growth habitat of tall fescue can be used to help
control large crabgrass by implementing the correct mowing height but may also increase
brown patch incidence.
Nomenclature: large crabgrass, Digitaria sanguinalis (L.) Scop; tall fescue, Lolium
arundinacuem Schreb.; common bermudagrass Cynodon dactylon var ‘Savannah’; brown
patch, Rhizoctonia solani Kühn
Key Words: incidence, large crabgrass cover, brown patch cover, mowing height.
Abbreviations: VR, visual rating; LIA, line intersect analysis; RAL, Raleigh; JAC
Jackson Springs, North Carolina, NC.
INTRODUCTION
There are many reasons that a turfgrass species can have an invasion of weeds of
multiple species. Ultimately, it is the reduction in turfgrass cover that will eventually

40
lead to an invasion of weeds. Turfgrass thinning can be a result of improper mowing
and/or fertilization, disease infestation, insect invasion, drought stress, shading,
nematodes, and/or other unwanted pests. Crabgrass (Digitaria spp.) is among the most
common and competitive weeds in turf (Dernoeden et al. 1993) that will invade a
turfgrass stand if turf cover is reduced. This can be caused by brown patch (Rhizoctonia
solani) one of the most destructive diseases of tall fescue (Lolium arundenaceum)
(Burpee 1995). With increasing amounts of herbicides, fungicides, and insecticides being
removed from the turfgrass market and societal pressure for organic alternatives, many
new ideas are being researched in the weed science industry to minimize the use of
pesticides.
Brown patch and crabgrass are both serious pests that can invade turfgrass
systems. Research in the past has shown that cultural factors such as mowing height can
influence brown patch or crabgrass invasion in multiple species of turfgrasses (Voigt et
al. 2001; Dernoeden 1993; Fidanza and Dernoeden 1996a, 1996b).
Brown patch is a disease that continues to limit the quality in many private and
commercial properties (Burpee 1995). In 1914, R. solani Kühn was discovered by C. D.
Piper (Piper and Coe 1919). It continues to be a problem today even with the common
fungicides available. Research was conducted with brown patch to evaluate if canopy
density plays a role in the severity of the disease where it was found that increased
canopy density increased development of brown patch (Yuen et al. 1994). Research by
Giesler et al. (1996a) used seeding rates of multiple tall fescue (Lolium arundenaceum)

41
cultivars to determine if the density of the canopy played a role in brown patch disease
severity. It was found that the least dense canopies sustained the least amount of disease.
Additional research conducted by Giesler et al. (1996b) looked more in depth at the
canopies and into the microclimate. Canopy densities were again created by different
cultivars with different canopy densities or by seeding the same cultivar of tall fescue at
different rates. It was concluded that the physical proximity of leaf blades in high-
density turfs can be more favorable for brown patch disease.
Canopy density can be influenced by mowing height. It is hypothesized that the
higher the cutting height of a turfgrass, the closer the proximity of leaf blades along with
an increase in density can hold moisture inside the canopy allowing an optimal
environment for the pathogen to grow and infect. This leaf orientation would give the
brown patch pathogen an optimum environment for infection and growth in turfgrass
species.
Research has been conducted to evaluate multiple mowing heights to determine
the severity of brown patch infestation. Burpee (1995) conducted research into three
mowing heights of 3.8, 6.4, and 8.9 cm in various tall fescue cultivars and one cultivar
blend. Across all tested cultivars it was concluded that the severity of Rhizoctonia blight
was significantly greater at the 8.9 cm mowing height in the first year. The next year
concluded severity was greater in the 3.8 cm mowing height plots. Fidanza and
Dernoedon (1996b) conducted research with comparing 1.7 and 4.5 cm mowing heights
for the severity of brown patch in perennial ryegrass (Lolium perenne L. var. ‘Caravelle’)

42
along with other cultural factor inputs. It was concluded that in the first year the lower
mowing height of 1.7 cm was blighted more than the 4.5 cm mowing height. The
following two years showed a more severe blight in the 4.5 cm mowing height compare
to the 1.7 cm mowing height. Contradictory studies have shown results of brown patch
having greater severity in low cut-turf (Rowell 1951) and others having no difference
between mowing height and disease incidence (Shurtleff 1953).
Research conducted into the effect of mowing height on cool season turfgrass has
shown that lower mowing heights increase weed density in various turfgrass species
(Busey 2003). Jagschitz and Ebdon (1985) reported that with the increase in mowing
height there are decreased crabgrass populations in chewings fescue {Festuca rubra var.
commtata Gaudin [= F. rubra subsp. fallax (Thuill.) Nyman]}. Niehus (1974) and Dunn
et al. (1981) reported the same with Kentucky bluegrass. With regard to fine fescue, a
decrease in mowing height increases percent crabgrass cover (Dernoden et al. 1998).
Experiments by Hall (1980), Dernedoen et al. (1993), and Voigt et al. (2001) resulted in a
decrease in percent crabgrass cover with increasing mowing height.
Even though there are conflicting reports of mowing height affecting the severity
of brown patch, the postulation that increasing mowing height increases the compatibility
of the environment for the pathogen of Rhizoctonia to develop and infect the turfgrass
species holds because research shows that increased canopy density increases brown
patch infestation. It is not understood if once brown patch has established in the
43
turfgrass, will the desired turf species cover be reduced allowing voids for weed
infestation, especially crabgrass?
It is known that a reduction in crabgrass results from increasing mowing height
and further there are varying reports of brown patch across a range of mowing heights.
The question is will the brown patch severity influence crabgrass infestation?
The purpose of the research was to determine the effect of mowing height on
crabgrass and brown patch incidence along with the effect of mowing height in
bermudagrass for crabgrass incidence. This research will provide evidence that can
contribute to better Integrated Pest Management strategies with reduced amounts of
pesticide inputs.
MATERIALS AND METHODS
Mowing Height Study in Tall Fescue. Experiments were conducted to determine
the effect of mowing height on crabgrass and brown patch incidence in tall fescue. Field
experiments were initiated in Raleigh (RAL), NC and in Jackson Springs (JAC), NC on 6
March 2007 and 3 March 2008. Soil was a Wakulla sand (siliceous, thermic psammentic
hapludults) in JAC with 0.86% humic matter and pH 5.5. Soil in RAL was an Appling
fine sandy loam (fine, kaolinitic, thermic typic kanhapludult) with 1.19% humic matter
and pH 5.8.
At initiation, areas were mown at a 5.1 cm height to remove debris facilitate
crabgrass seeding. Large crabgrass3 was slit and broadcast seeded at 170 – 190 kg/ha. A

44
Toro Seeder 93 (Bloomington, MN 55420) attached to a John Deere 4700 Tractor
(Moline, IL 61265) was used in at least four directions to apply approximately 90 kg/ha
of crabgrass seed. A broadcast spreader was then used in two directions to apply the
remaining crabgrass seed (90 kg / ha).
Five isolates of Rhizoctonia solani Kühn, originally isolated from tall fescue in
Knightdale, NC (ECC-A, ECC-B, ECC-C, and ECC-E)4 were grown on sterilized rye
grain for field inoculations. First, 1000 ml flasks were filled with 250 ml of rye grain,
9.86 ml of calcium carbonate power and 220 ml of warm water. Flasks were caped with
foam plugs and aluminum foil and then autoclaved for 45 minutes on fast exhaust. Eight,
approximately 0.6 cm squares from one of the five actively growing Rhizoctonia solani
cultures were then inserted into the rye grain flasks. The flasks were shaken every 3 to 4
d to encourage uniform colonization of the grain. On 7 June 2007 and 3 June 2008, 10
cm3 of the Rhizoctonia solani infested grain was applied in two locations in each plot and
brushed down through the turfgrass canopy by hand. Immediately after inoculation,
irrigation was applied to the plot area to keep the rye grain spawn moist. Irrigation was
then set to apply approximately 0.25 cm of irrigation water to cover the research plots at
0800 hour and 2000 hour to create an optimum environment for brown patch occurrence.
Split plots were treated with azoxystrobin5 at 0.628 kg ai/ha in 2007 on 9 June, 9 July,
and 13 August and in 2008 on 5 June, 8 July, and 7 August. Azoxystrobin was applied
with a CO2 pressurized hand-held spray boom equipped with four VS8008XR6 flat fan
nozzles on 38-cm spacing calibrated to deliver 818 L/ha.

45
Whole plot mowing treatments were applied when soil temperatures reached a
daily average of 12.8° C, 14 March 2007 and18 March 2008. Treatments applied to the
whole plots were 2.5, 5.1, 7.6, and 10.2 cm mowing height. Mowing height treatments
were applied with a rotary mower (Honda HRC 216, Alpharetta, GA 30005-8847) every
3 to 4 d with clippings returned. Plot areas in RAL were fertilized7 with nitrogen at 24
kg/ha for the entire growing season. Plot areas in JAC were fertilized7 with nitrogen 38.4
kg/ha for the entire growing season.
Visual Rating (VR) was used to determine crabgrass cover and recorded on 13
September 2007 and 11 September 2008. VR utilized a 0 (no crabgrass) to 100%
(complete crabgrass cover) scale that was visual estimated by an evaluator. Line
Intersect Analysis (LIA) (5.1 cm spacing) was used to determine brown patch cover
recorded on 17 September 2007 and 10 September 2008. LIA utilized a 0 (no brown
patch cover) to 100% (complete brown patch cover) scale after intersect counts were
converted using Equation 1.
(Counted Intersects / (Total Intersects=943)) x 100 [1]
Four replicates were included at both locations and years. Plots were 2.1 by 1.2 m
and arranged in a randomized split-block design. Data were arcsine square root

46
transformed to increase homogeneity of variance (Zar 1999), subjected to ANOVA and
means were separated according to Fisher’s Protected LSD (P=0.05) using SAS
Statistical Software (SAS Inc., Cary, NC). Nontransformed means are presented for
clarity.
Mowing Height Study in Common Bermudagrass. Experiments were
conducted to determine the effect of mowing height on crabgrass incidence in common
bermudagrass (Cynodon dactylon var ‘Savannah’). Experiments were initiated in RAL
and in JAC on 6 March 2007 and 3 March 2008. Soil was the same as those reported for
tall fescue mowing height study.
At initiation, plot areas were verticut with Graden Verticutter (Victoria, Australia
3061) on 2.5 cm spacing in two directions. Large crabgrass3 was sown into common
bermudagrass as reported in tall fescue mowing height study. Areas were then dragged
with a coco-mat to ensure soil seed contact.
Mowing height treatments (1.3, 2.5, 3.8, and 5.1 cm) were initiated when soil
temperatures reached a daily average of 12.8° C; 14 March 2007 and 18 March 2008. 2.5,
3.8, and 5.1 cm treatments were maintained with a rotary mower (Honda HRC 216,
Alpharetta, GA 30005-8847) whereas the 1.3 cm mowing height treatment was
maintained with a Toro reel mower (Toro Groundsmaster 1000, Bloomington, MN
55420). Mowing was performed every 3 to 4 d with clippings returned. Plot areas in
RAL were fertilized7 with nitrogen at 14.4 kg/ha throughout growing season. Fertilizer7
in JAC was applied for a total nitrogen amount of 19.6 kg/ha during growing season.

47
Visual ratings were used to determine large crabgrass cover and recorded on 16 August
2007 and 18 August 2008. VR utilized a 0 (no crabgrass) to 100% (complete crabgrass
cover) scale and evaluated visually by an evaluator. Four replicates were included at both
locations and years. Plots were 1.5 by 3 m and arranged in a randomized complete block
design. Data were arcsine square root transformed to increase homogeneity of variance
(Zar, 1999), subjected to ANOVA and means were separated according to Fisher’s
Protected LSD (P=0.05) using SAS Statistical Software (SAS Inc., Cary, NC).
Nontransformed means are presented for clarity.
RESULTS AND DISCUSSION
Mowing Height Study in Common Bermudagrass. A treatment by year
interaction prevented pooling data across years; thus data are presented separately. In
2007, 5 months after initiation mowing heights of 1.3, 2.5, 3.8, and 5.1 cm resulted in
43.1, 56.3, 61.9, and 62.5 % large crabgrass cover, respectively (Table 1). Mowing
heights of 1.3 and 2.5 cm were not significantly different from one another. Mowing
heights of 2.5, 3.8, and 5.1 cm were also not significantly different from one another. No
significant differences in crabgrass infestation were observed among mowing height
treatments in 2008 (Table 1). Mowing heights of 1.3, 2.5, 3.8, and 5.1 cm resulted in
63.1, 70.6, 66.3, and 65.0 % large crabgrass cover, respectively.
48
These results are similar to previous research by Callahan and Overton (1978)
showing that mowing height in common bermudagrass did not influence crabgrass
populations. Common bermudagrass is a horizontal spreading warm season turf that
emerges from dormancy about mid-March. This is approximately the same time the
summer annual large crabgrass emerges (when soil temperatures reach 12.8°C).
Therefore there is not a competitive edge of the common bermudagrass over the
crabgrass. The large crabgrass has growth characteristics requiring high light for
emergence. The common bermudagrass is not able to grow to heights that are needed to
compete with or shade the large crabgrass that reaches the high light requirement.
Mowing Height Study in Tall Fescue. A treatment by year by location
interaction prevented pooling data across years and locations for the crabgrass data; thus
data are presented separately. A treatment by year interaction and a treatment by
fungicide application prevented pooling data across years for brown patch data; thus data
are presented separately. Results from data showed there was no interaction between the
presence of brown patch, from a fungicide treatment to non-fungicide treatment, in
predicting the amount of large crabgrass cover (F-Value = 0.07, P-Value = 0.7922).
Therefore, the amount of brown patch did not contribute to explaining crabgrass cover,
and data was pooled over fungicide treated and non-fungicide treated. Data are presented
separately for the effect of mowing height on crabgrass incidence in tall fescue and the
effect of mowing height on brown patch incidence in tall fescue. All crabgrass data and
brown patch data were collected 6 months after initiation.

49
The main effect of mowing height on large crabgrass cover for 2007 and 2008
had an F-value (646.99; P-Value < 0.0001) over ten times greater than the interaction of
mowing height by year by location (F-value = 5.32; P-Value = 0.0020), therefore this
main effect is shown in Table 2. Mowing heights of 2.5, 5.1, 7.6, and 10.2 cm resulted in
96, 63, 22, and 3% large crabgrass cover, respectively. Table 3 shows the significant
interaction in predicting large crabgrass cover from height by location by year. In JAC in
2007, mowing heights of 2.5, 5.1, 7.6, and 10.2 resulted in percent large crabgrass cover
of 97.5, 83.8, 33.8, and 0.3, respectively. In JAC in 2008, there was 94.4, 48.2, 18.1, and
4.4% crabgrass cover, respectively for mowing heights of 2.5, 5.1, 7.6, and 10.2 cm. The
2007 data in RAL showed 98.3, 63.8, 10.1, and 0.4% crabgrass cover, respectively for
2.5, 5.1, 7.6, and 10.2 cm mowing heights. The 2008 data at the same location resulted in
97.3, 55.0, 24.4, and 6.4% large crabgrass cover, respectively for mowing heights of 2.5,
5.2, 7.6, and 10.2 cm. Through both years and at both locations all mowing height
treatments were significantly different from one another.
Results show that tall fescue is able to have a competitive edge over the large
crabgrass at higher mowing heights compared to the lower mowing heights as was the
case for previously conducted research. The vertical bunch type growth habit of tall
fescue at higher mowing heights is able to produce a high canopy density to prevent the
sun from penetrating to the soil and allowing the large crabgrass seed to emerge.
Homeowners can help suppress large crabgrass emergence by keeping a healthy lawn at
taller mowing heights. Keeping a healthy tall fescue stand can reduce the amount of

50
pressure that is applied to a pre-emergence herbicide program commonly used to prevent
large crabgrass emergence. A pre-emergence herbicide is needed to control a higher
population of emerging large crabgrass seeds at lower mowing heights. According to this
study, a pre-emergence herbicide applied on a tall fescue turf mown at 2.5 cm must
control 96% large crabgrass cover compared to a pre-emergence herbicide applied to a
tall fescue turf mown at 10.2 cm to control only 3% crabgrass cover. There is less
pressure applied to a pre-emergence herbicide program that is applied in tall fescue
mown at 10.2 cm.
The effect of mowing height on brown patch incidence in tall fescue was pooled
between locations and fungicide treatment but not years because of a mowing height by
year interaction (Table 4). Percent brown patch cover (Table 4) increased with increasing
mowing heights of 2.5, 5.1, 7.6, and 10.2 cm, resulting in 0.3, 1.8, 4.1, and 6.3%
respectively in 2007. In 2008 the same trend held with 0.0, 0.2, 0.9, and 1.7% brown
patch cover respectively for mowing heights 2.5, 5.1, 7.6, and 10.2 cm. Both years
resulted in every mowing height treatment being different from one another. A mowing
height by fungicide treatment interaction (F-Value = 23.52; P-Value = <0.0001) was also
observed. Table 5 shows the difference between mowing heights with and with out a
preventative fungicide treatment. If a fungicide was applied to the tall fescue, percent
brown patch cover resulted in 0.0, 0.2, 0.8, and 1.3% brown patch cover, respectively for
mowing heights 2.5, 5.1, 7.6, and 10.2 cm. This resulted in mowing heights of 2.5 and
5.1 cm not being significantly different and mowing heights 7.6 and 10.2 cm not being

51
significantly different. If no fungicide was applied mowing heights of 2.5, 5.1, 7.6, and
10.2 cm resulted in 0.3, 1.8, 4.3, and 6.7% brown patch cover, respectively with all
mowing height treatments being different from one another.
Increasing mowing height increases the percent brown patch cover in tall fescue.
With the increased mowing height there is more capability for the turfgrass canopy to
become denser and retain water longer to provide an optimum environment for the
Rhzoctonia pathogen to grow, develop and infect the tall fescue. At the highest mowing
height (10.2 cm) percent brown patch cover was over the accepted threshold of 5%.
Also, there is a fungicide application effect on the amount of brown patch present in all
tall fescue mowing heights. If a fungicide is applied there is less brown patch cover than
if no fungicide is applied at all mowing heights less than the common threshold for home
lawns.
In conclusion, mowing height does not have an effect on crabgrass incidence in
common bermudagrass. Brown patch does not have an effect on the amount of crabgrass
present through 2.5, 5.1, 7.6 and 10.2 cm mowing heights. This is speculated that brown
patch is not severe enough to create voids in tall fescue that would then lead to large
crabgrass emergence. Mowing height has an effect on large crabgrass incidence and
brown patch incidence. With increasing mowing heights crabgrass populations decreases
in tall fescue. This supports findings from Jagschitz and Ebdon (1985) in chewings
fescue, Niehus (1974) and Dunn et al. (1981) in Kentucky bluegrass, and Dernoden et al.
(1998) in fine fescues. With increasing mowing heights, brown patch development

52
increases in tall fescue. This is speculated by with the increase in mowing height the
increase in canopy density therefore increase brown patch severity. This supports results
that were found from Giesler et al. (1996a) that the increased turfgrass density the
increase in disease severity. This research also supports results from Burpee (1995) that
the severity of Rhizoctonia blight was significantly greater at the higher mowing heights
(8.9 cm) in tall fescue than at lower mowing heights (3.8 and 6.4 cm).
SOURCES OF MATERIALS
3 Lorenz’s Ok Seeds, 511 W Oklahoma, Okeene, OK 73763
4 Brown Patch Isolates (Rhizoctonia solani Kühl) - ECC-A, ECC-B, ECC-C,
ECC-E, Knightdale, NC
5 Azoystrobin – Heritage TL – Syngenta Crop Protection, Greensboro, NC 27409
6 Teejet Spraying Systems Company, North Avenue Wheaton, IL 60189-7900
7 Harrell’s Fertilizer – Greensboro, NC
ACKNOWLEDGEMENTS
The authors express appreciation to Travis Gannon and Leon Warren for their technical
assistance and Dr. Arellano Consuelo for statistical assistance.

53
LITERATURE CITED
Burpee, L. 1995. Interactions among mowing height, nitrogen fertility, and cultivar affect
the severity of Rhizoctonia blight of tall fescue. Plant Dis. 79:721-726.
Busey, P., 2003. Cultural management of weeds in turfgrass: a review. Crop Sci.
43:1899-1911.
Callahan, L.M. and J.R Overton. 1978. Effects of lawn management practices on a
bermudagrass turf. p.37-40. Tennessee Farm and Home Science No. 108.
Tennesee Agric. Exp. Stn., Knoxsville, TN.
Dernoeden, P.H., M.J. Carrol, and J.M. Krouse. 1993. Weed mamagement and tall fescue
quality as influenced by mowing, nitrogen, and herbicides. Crop Sci. 33:1055-
1061.
Dernoedon, P.H., M.A. Fidanza, and J.M. Krouse. 1998. Low maintenance performace of
five Festuca species in monostands and mixtures. Crop Sci. 38:434-439.
Dunn, J.H., C.J. Nelson, and R.D. Winfrey. 1981. Effects of mowing and fertilization on
quality of ten Kentucky bluegrass cultivars. p. 293-301. In R.W. Sheard (ed.) Proc
4th Int. Turfgrass Res. Conf., Guelph, ON, Canada. 19-23 July 1981. Ontario
Agric. College, Univ. Guelph, and Int. Turfgrass Soc., Guelph, ON, Canada.
Fidanza, M.A., P.H. Dernoedon. 1996a. Brown patch severity on perennial ryegrass as
influenced by irrigation, fungicide, and fertilizers. Crop Sci. 36:1631-1638.

54
Fidanza, M.A., P.H. Dernoedon. 1996b. Influence of mowing height, nitrogen source,
and iprodine on brown patch severity in perennial ryegrass. Crop Sci. 36:1620-
1630.
Giesler, L.J., G.Y. Yuen, and G.L. Horst. 1996a. Tall fescue canopy density effects on
brown patch disease. Plant Dis. 80:384-388.
Giesler, L.J., G.Y. Yuen, and G.L. Horst. 1996b. The microclimate in tall fescue as
affected by canopy density and its influence on brown patch disease. Plant Dis.
80:389-394.
Hall, J.R., III. 1980. Effect of cultural factors on tall fescue-Kentucky bluegrass sod
quality and botanical composition. p. 367-377 In J.B. Beard (ed.) Proc. 3rd Int
Turfgrass Res. Conf., Munich, West Germany. 11-13 July 1977. ASA, CSSA,
SSSA, and Int. Turfgrass Soc., Madison, WI.
Jagschitz, J.A., and J.S. Ebdon. 1985. Influence of mowing, fertilizer and herbicide on
crabgrass infestation in red fescue turf. p. 699-704. In F. Lemaire (ed.) Proc. 5th
Int. Turfgrass Res. Conf., Avignon, France. 1-5 July 1985. Institut National de la
Recherche Agronomique, Paris.
Niehaus, M.H. 1974. Effects of nitrogen fertilizer and mowing height on weed content of
a Kentucky bluegrass turf. Research Summary No. 79. Ohio Agric. Res. And Dev.
Center, Wooster, OH.
Piper, C.V. and Coe H.S. 1919. Rhizoctonia in lawns and pastures. Phytopathology 9:89-
92.

55
Rowell, J.B. 1951. Observations on the pathogenicity of Rhizoctonia solani on bent
grasses. Plant Dis. Rept. 35:240-242.
Shurtleff, M.C. 1953. Brown patch of turf caused by Rhizoctonia solani Kühn. PhD. Diss.
Department of Pathology, University of Minnesota, St. Paul (Diss. Abst. 53-
11120).
Voigt, T.B., T.W. Fermanian, and J.E. Haley, 2001. Influence of mowing and nitrogen
fertility on tall fescue turf. Int. Turfgrass Soc. Res. J. 9:953-956.
Yuen, G.Y., L.J. Giesler, and G.L. Horst. 1994. Influence of canopy structure on tall
fescue cultivar susceptibility to brown patch disease. Crop Prot. 13:439-442.
Zar, J.H. 1999. Biostatistical analysis, 4th Ed. Prentice Hall, New Jersey. pp. 273-281

56
Table 1. Effect of mowing height on large crabgrass incidence in
common bermudagrass pooled over Jackson Springs, NC and
Raleigh, NC, 5 months after initiation.
Large crabgrass cover
Mowing height 2007 2008
cm ________________%_________________
1.3 43.1 b a 63.1 a
2.5 56.3 ab 70.6 a
3.8 61.9 a 66.3 a
5.1 62.5 a 65.0 a
a Means within a column followed by the same letter are not
significantly different according to Fisher’s protected LSD, 0.05
level.

57
Table 2. Effect of mowing height on large crabgrass incidence
in tall fescue pooled over Jackson Springs, NC and Raleigh,
NC; 2007 and 2008, 6 months after initiation.
Mowing height Large crabgrass cover
cm _________%_________
2.5 96 aa
5.1 63 b
7.6 22 c
10.2 3 d
a Means within a column followed by the same letter are not
significantly different according to Fisher’s protected LSD, 0.05
level.

58
Table 3. Effect of mowing height on large crabgrass incidence in tall fescue at Jackson
Springs, NC and Raleigh, NC, 6 months after initiation. a
Large crabgrass cover
JAC RAL
Mowing height 2007 2008 2007 2008
cm __________________________%___________________________
2.5 97.5 ab 94.4 a 98.3 a 97.3 a
5.1 83.8 b 48.2 b 63.8 b 55.0 b
7.6 33.8 c 18.1 c 10.1 c 24.4 c
10.2 0.3 d 4.4 d 0.4 d 6.4 d
a Abbreviations: JAC, Jackson Springs; RAL Raleigh
b Means within a column followed by the same letter are not significantly different
according to Fisher’s projected LSD, 0.05 level.

59
Table 4. Effect of mowing height on brown patch incidence in tall
fescue pooled over fungicide treatments, 6 months after initiation.
Brown patch cover
Mowing height 2007 2008
cm ________________%_________________
2.5 0.3 d a 0.0 d
5.1 1.8 c 0.2 c
7.6 4.1 b 0.9 b
10.2 6.3 a 1.7 a
a Means within a column followed by the same letter are not
significantly different according to Fisher’s protected LSD, 0.05
level.

60
Table 5. Effect of mowing height and fungicide application on
brown patch incidence in tall fescue pooled over locations and years,
6 months after initiation.
Brown patch cover
Mowing height No Fungicide Fungicide a
cm ________________%_________________
2.5 0.3 d b 0.0 b
5.1 1.8 c 0.2 b
7.6 4.3 b 0.8 a
10.2 6.7 a 1.3 a
a Azoxystrobin applied at 0.628 kg ai/ha, early June, July, August
b Means within a column followed by the same letter are not
significantly different according to Fisher’s protected LSD, 0.05
level.

61
CHAPTER 3
Effect of Mowing Height on Common Bermudagrass (Cynodon dactylon)
Encroachment in Tall Fescue (Lolium arundinaceum).1
J. A. Hoyle, F. H. Yelverton, G. L. Miller, L. Tredway2
In 2007 and 2008 field research trials were conducted to determine the effect of
mowing height on bermudagrass encroachment in tall fescue. A standard USGA cup
cutter (10.8 cm diameter) was used to harvest common bermudagrass (Cynodon dactylon
var. ‘Riviera’) plugs. Four plugs were installed into each plot (3.05 x 3.05 meters), 0.76
meters from the corner. Evaluated mowing heights included 2.5, 5.1, 7.6 and 10.2 cm in
tall fescue, which were initiated once the bermudagrass plugs were installed. Line
intersect analysis was used to determine the percent bermudagrass cover starting 12
weeks after initiation (WAI) continuing twice monthly through 28 WAI (early/mid-
__________________________________________
1 Received for publication ________________ and in approved form ____________.
2 Graduate Research Assistanta, Professora, Professora and Associate Professorb,
respectively. North Carolina Sate University, aDepartment of Crop Science, Box
7620, Raleigh, NC 27695-7620. bDepartment of Pathology, Box 7616, Raleigh, NC
27695-7620.

62
October), when the bermudagrass entered dormancy. In 2007, at 28 WAI there were
significant differences in common bermudagrass cover resulting in 19.3, 7.4, 3.2, and
1.9%, respectively for mowing heights 2.5, 5.1, 7.6 and 10.2 cm. While in 2008, 28 WAI
contained 20.2, 6.3, 2.7, and 1.7% bermudagrass cover, respectively, with mowing
heights 2.5, 5.1, 7.6 and 10.2 cm. At 80 WAI of the 2007 initiated research trial
significant differences in common bermudagrass cover occurred in mowing heights of
2.5, 5.1, 7.6 and 10.2 cm, resulting in 79.4, 39.9, 12.2, and 2.9%, respectively. These
data indicate the growth habit of tall fescue may be used to help suppress bermudagrass
encroachment by implementing a correct mowing regime.
Nomenclature: common bermudagrass Cynodon dactylon var. ‘Riviera’; tall fescue,
Lolium arundinaceum Schreb.
Key Words: bermudagrass cover, contamination
Abbreviations: WAI, weeks after initiation; LIA, line intersect analysis
INTRODUCTION
Tall fescue (Lolium arundinaceum Schreb) and common bermudagrass (Cynodon
dacytlon var. ‘Riviera’) are common turf types in the transitional zone of the United
States. Tall fescue delivers a nice year round green color with a vertical bunch type
growth habit and thrives in the cooler seasons of the year; spring and fall. Common
bermudagrass is a warm season turfgrass species with a horizontal rhizomatous and
stonliferous growth habit, which thrives in the summer months and becomes dormant in

63
the winter. With these two types of turfgrass species grown in the transitional zone of the
United States, there is concern for contamination and a non-uniform turfgrass stand.
Common bermudagrass can commonly contaminate tall fescue stand by vegetative means
(Brede 1992). Common bermudagrass is particularly invasive in cool-season turf like tall
fescue because of its vigorous growth rate and rhizomatous-stoloniferous habit (Brede
1992). During the winter months when the tall fescue is green, the common
bermudagrass is dormant and brown. It is non-uniform in appearance and also difficult to
maintain the two species together (Decker et al. 1974). The bi-species turfgrass stand
causes problems when trying to manage for weeds because most common herbicides
have selective tolerance to the either tall fescue or common bermudagrass but not both. It
also can cause safety problems when turf is in a high traffic area. For example, in
playgrounds where children can trip on the height differences present in the bi-species
turfgrass stand. Lastly, it can cause ball playability issues, as in golf course roughs when
the mixture of turf species does not allow for golfers to anticipate the club reaction when
swung at the ball in a bi-species turfgrass stand. Most importantly the color discrepancy
causes unsightly views in the winter months in the transitional zone.
There are selective herbicidal control options to remove common bermudagrass in
tall fescue. These options are pricey and require multiple applications of multiple
products during the year. Also, application by a licensed pesticide applicator is required.
These applications include monthly applications of fenoxaprop plus triclopyr from June
through September. Fluzaifop can be applied in the spring and fall for bermudagrass

64
suppression (Yelverton et al. 2008). These applications are expensive because of tank
mixing and multiple applications.
Past studies have been conducted in an attempt to manage these two grass species
together to produce higher yields for a forage crop (Decker et al. 1974; Fribourg and
Overton 1979; Wilkerson et al. 1968). Wilkerson et al. (1968) conducted research to
determine if fertilization and mowing height could contribute to competition with tall
fescue and dormant ‘Coastal’ bermudagrass. It was found that the higher mowing height
increased tall fescue content in the dormant ‘Coastal’ bermudagrass. This indicates
raising the mowing height when there is contamination of a common bermudagrass
species in tall fescue, even in months where the bermudagrass is dormant, can increase
the desired tall fescue species.
Other research has shown cultural factors for minimizing invasion of common
bermudagrass into tall fescue (Brede 1992). The cultural factors specifically evaluated
included mowing height, seeding rate of tall fescue ‘Mustang’ and ‘Kentucky 31’, and
source of bermudagrass ‘Guymon’ introduction (seed, rhizomes, clippings). Results
showed that there was no bermudagrass invading tall fescue at the higher mowing height
(57mm) compared to the lower mowing height (19mm). Brede (1992) concluded that
cultural practices influenced the amount of bermudagrass invasion in tall fescue.
Therefore, options exist which homeowners can implement through regular
maintenance of their lawn to allow for suppression of common bermudagrass in a
contaminated tall fescue stand. The objective of this study was to determine the spread of

65
common bermudagrass in tall fescue by implementing multiple mowing heights common
in home lawn maintenance.
MATERIALS AND METHODS
Experiments were conducted to determine the effect of mowing height on
common bermudagrass ‘Riviera’ encroachment in tall fescue. Field experiments were
initiated in Raleigh, North Carolina at Lake Wheeler Field Labs on 30 March 2007 and
28 March 2008. Soil in Raleigh was an Appling fine sandy loam (fine, kaolinitic, thermic
typic kanhapludult) with 1.19% humic matter and pH 5.8.
A standard USGA cup cutter3 (10.8 cm dia) was used to harvest common
bermudagrass plugs (2.5 cm turfgrass height) from Jackson Springs, North Carolina at the
Sandhills Research Station where the soil was a Wakulla sand (siliceous, thermic
psammentic hapludults) with 0.86% humic matter and pH 5.5. Four plugs were installed
into each plot 0.76 m from the corners of the plots in holes (10.8 cm dia) augured out
with a hand auger (BT 121 STIHL Earth Auger, Virginia Beach, VA, 23352) (Figure 1).
Mowing height treatments of 2.5, 5.1, 7.6, and 10.2 cm were applied once
common bermudagrass plugs were installed. Treatments were maintained with a rotary
mower (Honda HRC 216, Alpharetta, GA 30005) at the initial mowing height with a
frequency of every 3 to 4 d with clippings returned. Plot areas in Raleigh were fertilized4
with N at 19.2 kg/ha throughout the growing season.

66
Line Intersect Analysis (LIA) (2.5 cm spacing) was used to determine common
bermudagrass cover and recorded twice monthly starting 12 WAI and continuing 28 WAI
until common bermudagrass entered dormancy in mid October. The 2007 initiated trials
were maintained at the same mowing height in 2008 and data was recorded twice
monthly from 64 WAI to 80 WAI in 2008. LIA utilized a 0 (no common bermudagrass
cover) to 100% (complete common bermudagrass cover) scale after intersect counts were
converted using Equation 1.
(Counted Intersects / (Total Intersects=1225)) x 100 [1]
Four replicates were included for both years of the study. Plots were 3.1 by 3.1 m
and arranged in a randomized complete block design. Data were arcsine square root
transformed to increase homogeneity of variance (Zar 1999), subjected to repeated
measures and ANOVA and means were separated according to Fisher’s Protected LSD
(P=0.05), using SAS Statistical Software (SAS Inc., Cary, NC). Nontransformed means
are presented for clarity.
RESULTS AND DISCUSSION
A treatment by year interaction prevented pooling data across years; thus data are
presented separately. In 2007, at 12 WAI each mowing height had similar results
showing 1.1, 0.9, 0.8, and 0.6 % bermudagrass cover respectively for mowing heights of

67
2.5, 5.1, 7.6, and 10.2 cm (Table 1). Bermudagrass cover in 2.5, 5.1, and 7.6 cm mowing
height treatments were not different from one another but all were different in the 10.2
cm height. From 14 WAI through 20 WAI bermudagrass cover in all mowing treatments
was different from one another. At 14 WAI mowing treatments of 2.5, 5.1, 7.6, and 10.2
cm height resulted in 2.2, 1.7, 1.3, and 0.9% bermudagrass cover respectively. There was
3.9, 2.5, 1.9, and 1.1% bermudagrass cover at 16 WAI in 2.5, 5.1, 7.6 and 10.2 cm
mowing height treatments, respectively. At 16 WAI, percent bermudagrass cover was
different for every mowing height treatment. At 18 WAI the 2.5, 5.1, 7.6, and 10.2 cm
mowing heights treatments resulted in 4.4, 3.0, 1.9, and 1.2% bermudagrass cover,
respectively. The mowing treatments 2.5, 5.1, 7.6, and 10.2 cm height at 20 WAI were
also different resulting in 7.6, 3.8, 2.3, and 0.9% bermudagrass cover, respectively. At 22
WAI the 7.6 and 10.2 cm mowing height treatments were not different at 2.3 and 1.5%
bermudagrass cover, respectively. These mowing height treatments were different from
the 5.1 cm mowing height with 5% bermudagrass cover that was also different from the
2.5 cm mowing height with 13.5% bermudagrass cover. The trend of percent
bermudagrass cover at the 2.5 cm mowing height treatment being different from the
percent bermudagrass cover for all other mowing height treatments started at 22 WAI and
continued through 28 WAI. The same was the case for percent bermudagrass cover at the
5.1 cm mowing height treatment. The percent bermudagrass cover for 7.6 and 10.2 cm
mowing height treatments continued the trend of not being different from one another but
different from the 2.5 and 5.1 cm mowing height treatments. At 24 WAI mowing heights

68
of 2.5, 5.1, 7.6, and 10.2 cm resulted in 14.6, 5.6, 2.8, and 1.7% bermudagrass cover,
respectively. There was 18.9, 7.1, 3.1, and 1.9% bermudagrass cover, respectively for
mowing heights of 2.5, 5.1, 7.6, and 10.2 cm at 26 WAI. Lastly, as the common
bermudagrass was proceeding to dormancy at 28 WAI there was 19.3, 7.4, 3.2, and 2.0%
bermudagrass cover, respectively for 2.5, 5.1, 7.6, and 10.2 cm mowing heights.
Note that the 2.5 cm mowing height treatment had a greater difference in growth
starting at 1.1% bermudagrass cover at 12 WAI to 19.3% bermudagrass cover at 28 WAI.
The 5.1 cm mowing height had only 7.4% bermudagrass cover at 28 WAI. Also note that
the 7.6 and 10.2 cm mowing heights had a higher competition between tall fescue and
common bermudagrass in that the 7.6 cm height had only 3.2% bermudagrass cover and
10.2 cm mowing height had 2% bermudagrass cover. From 12 WAI to 28 WAI the 10.2
cm mowing height treatment only increased a total of 1.4% bermudagrass cover.
Mowing height treatments of 2.5, 5.1, and 7.6 cm increased 18.2, 6.5, and 2.4%
bermudagrass cover, respectively from 12 WAI to 28 WAI.
The 2008 data showed similar results (Table 2). At 12 WAI each mowing height
of 2.5, 5.1, 7.6, and 10.2 cm were different in percent bermudagrass cover resulting in
2.8, 1.8, 1.5, and 1.1, respectively. The trend of percent bermudagrass cover for each
mowing height treatment being different from one another continued through 20 WAI.
At 14 WAI, mowing heights of 2.5, 5.1, 7.6, and 10.2 cm resulted in all different values
of 4.9, 2.6, 2.0, and 1.4% bermudagrass cover, respectively. The same was true for 16
WAI with 5.8, 3.4, 2.6, and 1.8% bermudagrass cover, respectively for mowing heights

69
of 2.5, 5.1, 7.6, and 10.2 cm. Mowing heights of 2.5, 5.1, 7.6, and 10.2 cm resulted in
6.6, 3.3, 2.1, and 1.6% bermudagrass cover, respectively at 18 WAI, all different. At 20
WAI there was 8.4, 3.1, 1.8, and 1.1% bermudagrass cover, respectively for mowing
heights of 2.5, 5.1, 7.6, and 10.2 cm which was the last data recording for percent
bermudagras cover being different. At 22 WAI there was no difference between percent
bermudagrass cover for mowing height treatments 7.6 and 10.2 cm with 2.3 and 1.6%
bermudagrass cover, respectively. The 2.5 and 5.1 cm mowing height treatments showed
differences at 18.3 and 5.6% bermudagrass cover, respectively but were also different
from 7.6 and 10.2 cm mowing height treatments. This trend continued through 28 WAI.
At 24 WAI mowing heights of 2.5, 5.1, 7.6, and 10.2 cm resulted in 19.7, 5.5, 2.5, and
1.6% bermudagrass cover, respectively. At 26 WAI percent bermudagrass cover was
20.8, 6.1, 2.7, and 1.6 respectively for mowing heights of 2.5, 5.1, 7.6, and 10.2 cm. At
the last data collection for 20 WAI in 2008, the mowing heights consisted of 20.2, 6.3,
2.7, and 1.7% bermudagrass cover respectively for mowing heights of 2.5, 5.1, 7.6, and
10.2 cm. There was no difference in percent bermudagrass cover between the 7.6 and
10.2 cm mowing height treatments. Both the 2.5 and 5.1 cm mowing heights were
different in percent bermudagrass cover from all other mowing heights.
As in 2007, the 2008 data showed again percent bermudagrass cover increased as
mowing height increased from 12 WAI to 28 WAI. Mowing heights 2.5, 5.1, 7.6, and
10.2 cm increased 17.4, 4.5, 1.2, and 0.6% bermudagrass cover, respectively over the
entire growing season for common bermudagrass.

70
Further research was conducted on the 2007-initiated trial in 2008. At 64 WAI
mowing heights of 2.5, 5.1, 7.6, and 10.2 cm resulted in 23.9, 7.0, 2.7, and 0.6%
bermudagrass cover, respectively with all treatment heights being different (Table 3).
Mowing heights 7.6 and 10.2 cm resulted in no differences from one another at 4.5 and
1.2% bermudagrass cover at 66 WAI. Percent bermudagrass cover for mowing heights
of 2.5 and 5.1 cm were different from one another and from 7.6 and 10.2 cm at 66 WAI.
The 34.8 and 11.4% bermudagrass cover resulted from 2.5 and 5.1 cm mowing height
treatments at 66 WAI. At 68 WAI mowing heights resulted in 37.1, 12.6, 5.1, and 1.3%
bermudagrass cover, respectively for mowing heights of 2.5, 5.1, 7.6, and 10.2 cm, all
different. This trend continued at 70 WAI for mowing heights of 2.5, 5.1, 7.6, and 10.2
cm with 47.9, 14.8, 5.6, and 1.4% bermudagrass cover, respectively. Percent
bermudagrass cover for mowing heights 7.6 and 10.2 cm at 72 WAI were not different
resulting in 5.9 and 1.7% bermudagrass cover, respectively. Response for mowing height
treatments 2.5 and 5.1 cm at 72 WAI were different from all other mowing height
treatments resulting in 58.5 and 17.7% bermudagrass cover. At 74 WAI all mowing
height treatments were different in percent bermudagrass with four separate groupings
having 64.9, 29.4, 10.6, and 2.3% cover, respectively for mowing heights 2.5, 5.1, 7.6,
and 10.2 cm. Percent bermudagrass for mowing heights 7.6 and 10.2 cm were not
different from one another at 76 WAI resulting in 10.4 and 2.4% bermudagrass cover,
respectively. Mowing heights 2.5 and 5.1 at 76 WAI resulted in 71.6 and 31.8%
bermudagrass cover respectively, and were different from mowing heights 7.6 and 10.2

71
cm and from each other. The trend continued through 78 WAI with 77.6, 37.4, 11.9, and
3.5% bermudagrass cover, respectively for mowing heights of 2.5, 5.2, 7.6, and 10.2 cm.
Lastly, at 80 WAI percent bermudagrass cover for all mowing height treatments were
different resulting in 79.4, 39.9, 12.2, and 2.9% bermudagrass cover, respectively for
mowing heights 2.5, 5.1, 7.6, and 10.2 cm.
The same trend continued from 12 WAI to 28 WAI as well as from 64 WAI to 80
WAI. From 64 WAI to 80 WAI mowing heights 2.5, 5.1, 7.6, and 10.2 cm increased
55.5, 32.9, 9.5, and 2.3% bermudagrass cover, respectively. From 12 WAI to 80 WAI
mowing heights of 2.5, 5.1, 7.6, and 10.2 cm increased 78.3, 39.0, 11.4, and 2.3%
bermudagrass cover, respectively.
The data shows that the sole cultural practice of mowing height can suppress
common bermudagrass encroachment in tall fescue. The greatest increase in
bermudagrass cover resulted after one full year of growth showing that if bermudagrass is
not controlled at lower mowing heights and that each year the problem can increase
drastically. It has been postulated that tall fescue suppresses bermudagrass through
competition for light (Wilkinson et al. 1968). This research helps to prove this postulate
presuming the lower cut height would allow for more light penetration to reach the
bermudagrass. Also, that the lower mowing heights stress the tall fescue. During the
prime growth season common bermudagrass can tolerate lower mowing heights than tall
fescue therefore giving the bermudagrass an advantage. This research shows that the
taller mowing heights give the advantage to tall fescue even if bermudagrass is present in

72
the turfgrass stand and helps suppress the spread or encroachment of the bermudagrass
even though bermudagrass is an aggressive turf species. In conclusion, cultural practices
can influence bermudagrass encroachment in tall fescue even if bermudagrass has already
been contaminated into the tall fescue stand. This research can now be used in
conjunction with chemical control options to minimize the amount of herbicidal
applications therefore allowing applications to be more cost effective to turfgrass
managers.
SOURCES OF MATERIALS
3 Par-Aide-USGA Standard Cup Cutter, John Deere Landscapes/LESCO, 650
Stephenson Hwy, Troy, MI, 48083-1110
4 Harrell’s Fertilizer – Greensboro, NC
ACKNOWLEDGEMENTS
The authors express appreciation to Travis Gannon and Leon Warren for their
technical assistance and Dr. Arellano Consuelo for statistical assistance.

73
LITERATURE CITED
Brede, A.D. 1992. Cultural factors for minimizing bermudagrass invasion into tall fescue
turf. Agron. J. 84:919-922.
Decker, A.M., H.J. Retzer, and F.R. Dudley, 1974. Cool-season perennials vs. cool-
season annuals sod seeded into a bermudagrass sward. Agron. J. 66:381-383.
Fribourg, H.A. and J.R. Overton. 1979. Persistence and productivity of tall fescue in
bermudagrass sods subjected to different clipping managements. Agron. J.
71:620-624.
Wilkinson, S.R., L.F. Welch, G.A. Hillsman, and W.A. Jackson. 1968. Compatibility of
tall fescue as affected by nitrogen fertilizer and height of clip. Agron. J. 60:359-
362.
Yelverton, F. H., B. R. Lassiter, G. G. Wilkerson, L. Warren, T. W. Gannon, J. J.
Reynolds, and B. S. Boul. "Berudagrass (Cynodon dactylon L. Pers.)." Turffiles.
15 July 2008. North Carolina State University. 24 Mar. 2009
<http://www.turffiles.ncsu.edu/Weeds/Bermudagrass.aspx>.

74
Table 1. Effect of mowing height on bermudagrass encroachment in tall fescue over multiple weeks after incitation; 2007.a
Bermudagrass cover
Mowing Height 12 WAI 14 WAI 16 WAI 18 WAI 20 WAI 22 WAI 24 WAI 26 WAI 28 WAI
cm ______________________________________%______________________________________
2.5 1.1 a b 2.2 a 3.9 a 4.4 a 7.6 a 13.5 a 14.6 a 18.9 a 19.3 a
5.1 0.9 a 1.7 b 2.5 b 3.0 b 3.8 b 5.0 b 5.6 b 7.1 b 7.4 b
7.6 0.8 a 1.3 c 1.9 c 1.9 c 2.3 c 2.3 c 2.8 c 3.1 c 3.2 c
10.2 0.6 b 0.9 d 1.1 d 1.2 d 0.9 d 1.5 c 1.7 c 1.9 c 2.0 c
a Abbreviations: WAI, weeks after initiation.
b Means within a column followed by the same letter are not significantly different according to Fisher’s projected LSD, 0.05
level.

75
Table 2. Effect of mowing height on bermudagrass encroachment in tall fescue over multiple weeks after incitation; 2008.a
Bermudagrass cover
Mowing Height 12 WAI 14 WAI 16 WAI 18 WAI 20 WAI 22 WAI 24 WAI 26 WAI 28 WAI
cm _______________________________________%______________________________________
2.5 2.8 a b 4.9 a 5.8 a 6.6 a 8.4 a 18.3 a 19.7 a 20.8 a 20.2 a
5.1 1.8 b 2.6 b 3.4 b 3.3 b 3.1 b 5.6 b 5.5 b 6.1 b 6.3 b
7.6 1.5 c 2.0 c 2.6 c 2.1 c 1.8 c 2.3 c 2.5 c 2.7 c 2.7 c
10.2 1.1 d 1.4 d 1.8 d 1.6 d 1.1 d 1.6 c 1.6 c 1.6 c 1.7 c
a Abbreviations: WAI, weeks after initiation.
b Means within a column followed by the same letter are not significantly different according to Fisher’s projected LSD, 0.05
level.

76
Table 3. Effect of mowing height on bermudagrass encroachment in tall fescue over multiple weeks after incitation; 2007-
2008.a
Bermudagrass cover
Mowing Height 64 WAI 66 WAI 68 WAI 70 WAI 72 WAI 74 WAI 76 WAI 78 WAI 80 WAI
cm _______________________________________%______________________________________
2.5 23.9 a b 34.8 a 37.1 a 47.9 a 58.5 a 64.9 a 71.6 a 77.6 a 79.4 a
5.1 7.0 b 11.4 b 12.6 b 14.8 b 17.7 b 29.4 b 31.8 b 37.4 b 39.9 b
7.6 2.7 c 4.5 c 5.1 c 5.6 c 5.9 c 10.6 c 10.4 c 11.9 c 12.2 c
10.2 0.6 d 1.2 c 1.3 d 1.4 d 1.7 c 2.3 d 2.4 c 3.5 c 2.9 d
a Abbreviations: WAI, weeks after initiation.
b Means within a column followed by the same letter are not significantly different according to Fisher’s projected LSD, 0.05
level.

77
__________________________________________________________ Figure 1. Plot layout for common bermudagrass installation in tall fescue