abhishek gupta sr. application engineer · 4 machine learning characteristics and examples...
TRANSCRIPT

1© 2014 The MathWorks, Inc.
Machine Learning with MATLAB
Abhishek Gupta
Sr. Application Engineer

2
Goals
Overview of machine learning
Machine learning models & techniques available in
MATLAB
Streamlining the machine learning workflow with
MATLAB

4
Machine LearningCharacteristics and Examples
Characteristics
– Lots of data (many variables)
– System too complex to know
the governing equation(e.g., black-box modeling)
Examples
– Pattern recognition (speech, images)
– Financial algorithms (credit scoring, algo trading)
– Energy forecasting (load, price)
– Biology (tumor detection, drug discovery)
93.68%
2.44%
0.14%
0.03%
0.03%
0.00%
0.00%
0.00%
5.55%
92.60%
4.18%
0.23%
0.12%
0.00%
0.00%
0.00%
0.59%
4.03%
91.02%
7.49%
0.73%
0.11%
0.00%
0.00%
0.18%
0.73%
3.90%
87.86%
8.27%
0.82%
0.37%
0.00%
0.00%
0.15%
0.60%
3.78%
86.74%
9.64%
1.84%
0.00%
0.00%
0.00%
0.08%
0.39%
3.28%
85.37%
6.24%
0.00%
0.00%
0.00%
0.00%
0.06%
0.18%
2.41%
81.88%
0.00%
0.00%
0.06%
0.08%
0.16%
0.64%
1.64%
9.67%
100.00%
AAA AA A BBB BB B CCC D
AAA
AA
A
BBB
BB
B
CCC
D

5
Challenges – Machine Learning
Significant technical expertise required
No “one size fits all” solution
Locked into Black Box solutions
Time required to conduct the analysis

6
Overview – Machine Learning
Machine
Learning
Supervised
Learning
Classification
Regression
Unsupervised
LearningClustering
Group and interpretdata based only
on input data
Develop predictivemodel based on bothinput and output data
Type of Learning Categories of Algorithms

7
Unsupervised Learning
Clustering
k-Means,
Fuzzy C-Means
Hierarchical
Neural
Networks
Gaussian
Mixture
Hidden Markov
Model

8
Supervised Learning
Regression
Non-linear Reg.
(GLM, Logistic)
Linear
RegressionDecision Trees
Ensemble
Methods
Neural
Networks
Classification
Nearest
Neighbor
Discriminant
AnalysisNaive Bayes
Support Vector
Machines

9
Supervised Learning - Workflow
Known data
Known responses
Model
Train the Model
Model
New Data
Predicted
Responses
Use for Prediction
Measure Accuracy
Select Model
Import Data
Explore Data
Data
Prepare Data
Speed up Computations

11
Example – Bank Marketing Campaign
Goal:
– Predict if customer would subscribe to
bank term deposit based on different
attributes
Approach:
– Train a classifier using different models
– Measure accuracy and compare models
– Reduce model complexity
– Use classifier for prediction
Data set downloaded from UCI Machine Learning repository
http://archive.ics.uci.edu/ml/datasets/Bank+Marketing
0
10
20
30
40
50
60
70
80
90
100
Perc
enta
ge
Bank Marketing Campaign
Misclassification Rate
Neur
al N
et
Logi
stic
Reg
ress
ion
Dis
crim
inant
Ana
lysi
s k-
neare
st N
eig
hbor
s
Naiv
e B
ayes
Sup
port V
M
Deci
sion
Tree
s
Tre
eBagg
er
Redu
ced
TB
No
Misclassified
Yes
Misclassified

12
Example – Bank Marketing Campaign
Numerous predictive models with rich
documentation
Interactive visualizations and apps to
aid discovery
Built-in parallel computing support
Quick prototyping; Focus on
modeling not programming
0
10
20
30
40
50
60
70
80
90
100
Perc
enta
ge
Bank Marketing Campaign
Misclassification Rate
Neur
al N
et
Logi
stic
Reg
ress
ion
Dis
crim
inant
Ana
lysi
s k-
neare
st N
eig
hbor
s
Naiv
e B
ayes
Sup
port V
M
Deci
sion
Tree
s
Tre
eBagg
er
Redu
ced
TB
No
Misclassified
Yes
Misclassified

13
ClusteringOverview
What is clustering?
– Segment data into groups,
based on data similarity
Why use clustering?
– Identify outliers
– Resulting groups may be
the matter of interest
How is clustering done?
– Can be achieved by various algorithms
– It is an iterative process (involving trial and error)
-0.1 0 0.1 0.2 0.3 0.4 0.5 0.60
0.1
0.2
0.3
0.4
0.5
0.6
0.7
0.8
0.9
1

14
Example – Clustering Corporate Bonds
Goal:
– Cluster similar corporate bonds
together
Approach:
– Cluster the bonds data using distance-
based and probability-based
techniques
– Evaluate clusters for validity
Data
Poin
t #
Hierarchical Clustering
1000 2000 3000 4000
500
1000
1500
2000
2500
3000
3500
4000
Dis
t M
etr
ic:s
pearm
an
0.2
0.4
0.6
0.8
1
1.2
1.4
1.6
Data Point #
Data
Poin
t #
k-Means Clustering
1000 2000 3000 4000
500
1000
1500
2000
2500
3000
3500
4000
Dis
t M
etr
ic:c
osin
e
0
0.2
0.4
0.6
0.8

15
Example – Clustering Corporate Bonds
Numerous clustering functions with
rich documentation
Interactive visualizations to aid
discovery
Viewable source; not a black box
Rapid exploration & development
Data
Poin
t #
Hierarchical Clustering
1000 2000 3000 4000
500
1000
1500
2000
2500
3000
3500
4000
Dis
t M
etr
ic:s
pearm
an
0.2
0.4
0.6
0.8
1
1.2
1.4
1.6
Data Point #
Data
Poin
t #
k-Means Clustering
1000 2000 3000 4000
500
1000
1500
2000
2500
3000
3500
4000
Dis
t M
etr
ic:c
osin
e
0
0.2
0.4
0.6
0.8

16
Goal:
– Develop a tool for Excel users to generate next day electricity
demand predictions
Requirements:
– Easy to use interface
– Accurate predictive model
Short-term Load Forecaster
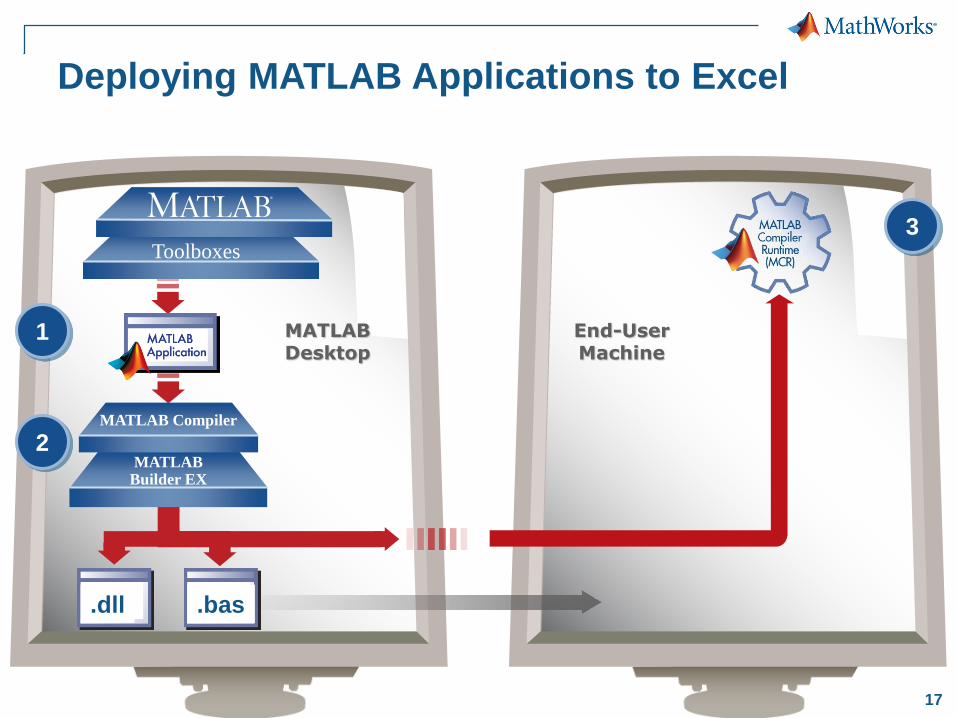
17
MATLABDesktop
End-UserMachine
1
2
3Toolboxes
Deploying MATLAB Applications to Excel
MATLABBuilder EX
MATLAB Compiler
.dll .bas

18
Deployment Highlights
Java
Excel
.NET
.exe
C
CTF
Royalty-free deployment
Point-and-click workflow
Unified process for desktop and server apps
Application Servers
Database Servers
Web Applications
Client Front End
Applications
SpreadsheetsHADOOP
Desktop Applications
Batch/Cron Jobs

19
Challenges MATLAB Solution
Time (loss of productivity) Rapid analysis and application developmentHigh productivity from data preparation, interactive
exploration, visualizations.
Extract value from data Machine learning, Video, Image, and FinancialDepth and breadth of algorithms in classification, clustering,
and regression
Computation speed Fast training and computationParallel computation, Optimized libraries
Time to deploy & integrate Ease of deployment and leveraging enterprisePush-button deployment into production
Technology risk High-quality libraries and supportIndustry-standard algorithms in use in production
Access to support, training and advisory services when
needed
MATLAB for Machine Learning

20
Learn More: Machine Learning with
MATLABmathworks.com/machine-learning

23
Training ServicesExploit the full potential of MathWorks products
Flexible delivery options:
Public training available worldwide
Onsite training with standard or
customized courses
Web-based training with live, interactive
instructor-led courses
Self-paced interactive online training
More than 30 course offerings:
Introductory and intermediate training on MATLAB, Simulink,
Stateflow, code generation, and Polyspace products
Specialized courses in control design, signal processing, parallel computing,
code generation, communications, financial analysis,
and other areas

24
Migration Planning
Component Deployment
Full Application Deployment
Co
nti
nu
ou
s Im
pro
vem
en
t
Consulting ServicesAccelerating return on investment
A global team of experts supporting every stage of tool and process integration
Supplier InvolvementProduct Engineering TeamsAdvanced EngineeringResearch
Advisory Services
Process Assessment
Jumpstart
Process and Technology
Standardization
Process and Technology
Automation

25
Technical Support
Resources
Over 100 support engineers
– All with MS degrees (EE, ME, CS)
– Local support in North America,
Europe, and Asia
Comprehensive, product-specific Web
support resources
High customer satisfaction
95% of calls answered
within three minutes
70% of issues resolved
within 24 hours
80% of customers surveyed
rate satisfaction at 80–100%

26
MATLAB Central
Community for MATLAB and Simulink
users
Over 1 million visits per month
File Exchange– Upload/download access to free files
including MATLAB code, Simulink models,
and documents
– Ability to rate files, comment, and ask questions
– More than 12,500 contributed files, 300
submissions per month, 50,000 downloads
per month
Newsgroup– Web forum for technical discussions about
MathWorks products
– More than 300 posts per day
Blogs– Commentary from engineers who design, build,
and support MathWorks products
– Open conversation at blogs.mathworks.com
Based on February 2011 data

27
Questions?