(aa’. a@lrjil qs - fas
TRANSCRIPT

‘-.3—.3
AT, . . . ,.”1.; r,.+. ,, .,% JL@G”=ii.,. ,, - .!i’ ~....,.. ; -A*,-X.-, W ,. i,, , *..-. i ,. . .. . . 4“,”.7+,; ,+ J. ;. ..” .-. . .. . . ., -
LA-9445-PNTX-G
“WE&ia&@,. -
Udz=k:u..as . u .! .--.! . . . . . . . . ,, ..- . . . . .
y-.*”@JqY&y?+%fb ~_: (AA’. 1: .% $= ~. - -
,i=n.. . .:~:,. .-._.... ....-.:-;: ;::’L: .-. .,
:,,. ,., :; ..-,.-i,$ -.-. ..— -.
,. ~, ,7,:::
-,,nn
iiill-as A@lrJil_QsLos Alamos National Laboratory....+-.*....,—,——-----..--— .....LosAlatm~.New.Mexico87545F.-,,. --*...m.=(.../—*r-~r,~$~....WW7W-,-.-+ -..V.,Lm-,x.........,>. --wm.--,., +.,.-... .,...... s...;.----.:_-.+:.Y:-!*+.-;..:: - ..-.T.-=..-...-— -,--- ..--....,.“:+----.:. . .. ...=-..... ; .. .. . ... . .-.“_&.&:.:<=::-kj;..“-.?—ti* .r”:&.x--------------,=---~.F—*:r2-&:%?:::i?&..x-kj%+..=;:-=.::.2:..:..+-..~..:. .. :.. .‘
,....._. . ...-.!=.:*&-:, .- ...--..-,_ ..—. . .. ..- ,........-----.,—a.*...---!-w.G=--.w--.----G=.-+-.”.2--:’.. “-”.-;..:.-:-:“,.. .?-w..:-- ~.”’-<. 3 - - .>. ..3..;L.‘---.“..’”: .;—... .- ..-,,....U.-.—+,-. ..&— —...——....=..-”*..... .,r-..m/.mlm:?w-r--- —,,..——..—..s..=... ......—ti--YlWw?Y+vM?zW.*@y .,.,,.—-S..—.* -em*h!“Jb’&+%w.-.J..J.!-.m->--.,.r.!-4* . - ,&. ‘.-.!:......-.....).:.., ..,.SW.~-—— . .- ..?-+w.~ --... LCW...W..-..’..—=.,—.,,—.=-. m....&-,--. -”,..+,* -..!.,.-. - .. ... .. .. ...... .. -,.,.. .,1.-r-.i-’.%+-w=-.-?<*h..k*wIO.#-..:w-.d.G.a-.--+.T_..T. u+-:.c.-.; .-%+S~- --.. -., z ;-...:.-..n.w- >,,..!L!. .. . . Jww..-.wPk+-k+
~~L-;.-+.&-+!mi*-m...l!”.p.tAt+.m+.m+-!-F.-4,-,..M.,..... ......&T;w.;+–.... . .,4 .-....4 . -.,-;.<., .,
. . : --- -. ..: --- : ,~- ,.. ,.-: :,:1- .- .:- ,-- ..- .- ,, -, .-’ q-.+.. :-—, . ..-=-=- :1 =..-. .. . . ,- —..,.,:., <. .- .,, . . . ~- .-.-, . ..— _ : .,:. . . . . . .
. ..---1

yw -.,.,-L. .,.
.,” .*
h AffinNtk ktiort/E.qud&XXtUidtyEmpbyes. ,- . . . -----
. . . . . -, -P’ :,.. h
‘h ..
. .‘ ,.
.
,..2.’ ,
./.,w~
. ... . ..,,
-- ... .-7.,.. . . . . . . . .W. -,,.. ~., ..,, ,.
-,. ?.“.” .. . . . . . .. -”” ‘
-“.”” -“. ’.. ,.. ”’”r -.- ‘,.””:,
:. . ..-
..I
. .
,. .. . ..- . . . . . . . .. ..- .. -’.
;..
..1.
,.
:.,.
. .. .,.”
,’
,,-4
,. .m. ’.-..-. ,. ..’.........<,-
.,.,-
-. *.., . . .
-,,. -! ..*...- . .,....,.!,’
\. . . “. . .. . .,
LoisSchneider,and Mary LouThis report was preparedby Kathy Derouin,“ Keigher,GroupH-8.
. .
.
. . ..
.,. - ...,-
. .. .
.>,,.-..,. .”,”.
. . ,.+..,—2 .,.
‘. .’”-.’.’,$ . ,. ~.<:.’ -,’. . . .-, ... . ...,.,, ..+
..,, .--..,.% .. .. . .
DfSCL4fMER
. ...>
This report was prepared as assacraunt of work sponsored by assagency of she United States Government.NeithertheUnitedStatesGovernment nor arty a@rcy thereof, nor any of their employees, makea anyrsnrnrrty, express or Irtrplied, or assumes any Iegaf fiability or responsibility for the accuracy, wmpletmesa,or usefulness of W’ informatiw, appamt us, produ~, or p&-cms dklosed, or repe-sents that its use wouldnot brfrirtge Prfvately owned rights. References herein to any spedilc mmnserciaf product, process, oraqvice by trad: .~e, trade~k, rrra@a@~er, or otheryiae, d= not n-y mraatitute or imply itakrrdors?inestt,kornriieis&hon-, or favoring by the United Statca Government or any agency thereof. Thewfewsand opinioru of authors expressed herein do not neccsarily state or reflect those of the UnitedStates Cotinirirent or ahy agency thereof.
. . .

LA-9445-PNTX-G
Issued: December 1982
1-
*
ml
[
Supplementary Documentation for anEnvironmental Impact Statement
Regarding the Pantex Plant
Estimated Releases and Downwind Concentrationsof Air Pollutants from
Waste Organic Solvent Evaporation,Waste High-Explosive Burning, and
High-Explosive Test Shots
(hii+ D. G. Macdonell(j)ILIKfli) J. M. De~art
... .
-. .
.- ...,-.
. . ... . . .
----- ,,
. ..
. . .-. r-T- -. - . . .
~.-,
.. ..— .. .
_-
. ..-
-. ... .-.
-.. .
.. ., ~.-
. .
. . ..
.. —- ..-
. . . >-.... . ..
.-—
.->.
. .
.. .
.
-~~ ~[a~osL.sAla..s,Ne..ex,8754~4~Los Alamos National Laboratory
..
. --.
.-, ----
----

.
-I
*
.*
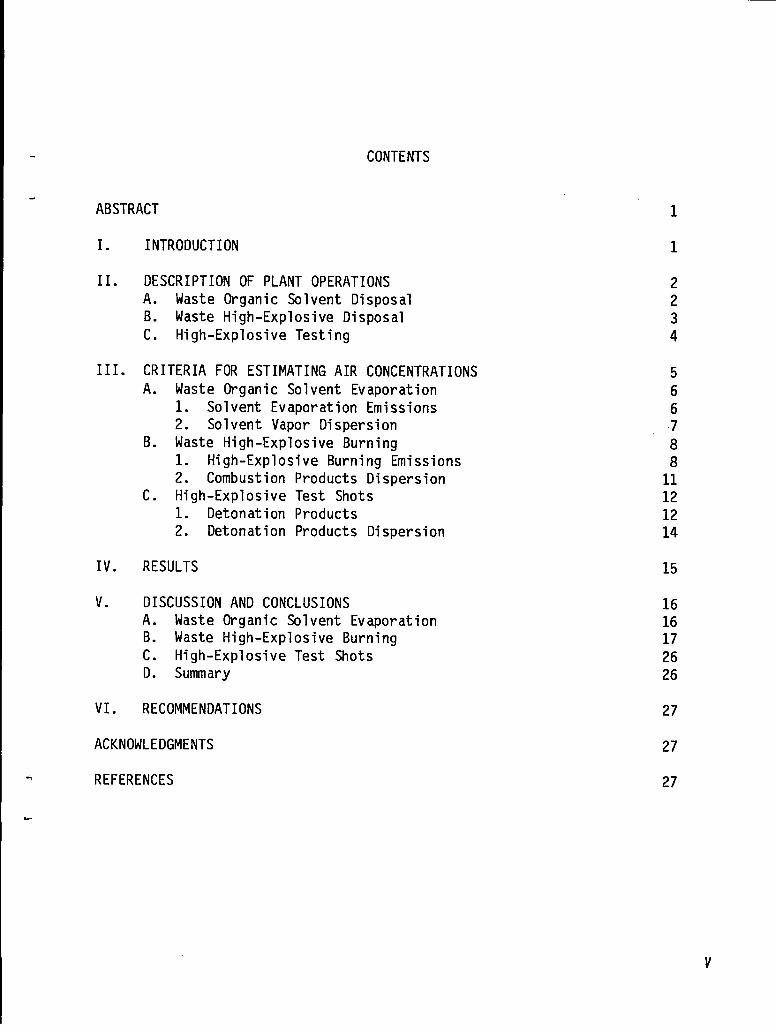
CONTENTS
ABSTRACT
I. INTRODUCTION
II. DESCRIPTION OF PLANT OPERATIONSA. Waste Organic Solvent DisposalB. Waste High-Explosive Disposalc. High-Explosive Testing
III. CRITERIA FOR ESTIMATINGAIR CONCENTRATIONSA. Waste Organic Solvent Evaporation
1. Solvent Evaporation Emissions2. Solvent Vapor Dispersion
B. Waste High-Explosive Burning1. High-Explosive Burning Emissions2. Combustion Products Dispersion
c. High-Explosive Test Shots
IV.
v.
VI.
1. Detonation Products2. Detonation Products
RESULTS
DISCUSSION AND CONCLUSIONS
Dispersion
A. Waste Organic Solvent EvaporationB. Waste High-Explosive Burningc. High-Explosive Test ShotsD. Summary
RECOMMENDATIONS
ACKNOWLEDGMENTS
REFERENCES
1
1
2234
566788
11121214
15
1616172626
27
27
27

TABLES
I.II.III.IV.v.VI.VII.VIII.IX.x.XI.XII.XIII.XIV.Xv.
XVI.
XVII.
XVIII.XIX.
WASTE ORGANIC SOLVENT DISPOSAL FOR 1981WASTE HIGH EXPLOSIVE BURNED IN 1981HIGH-EXPLOSIVES TEST FIRED IN 1981WASTE ORGANIC SOLVENT EVAPORATION AND EMISSION RATESMETEOROLOGICALDATAFOR SOLVENTDISPERSIONCOMPARISONOF HIGH EXPLOSIVESHIGH EXPLOSIVES--PER CENT COMPOSITIONBY WEIGHTMETEOROLOGICALPARAMETERSFOR HIGH-EXPLOSIVES BURNINGDISPERSIONDETONATIONPRODUCTS--CYCLOTOLDETONATIONPRODUCTS--COMPOSITIONBDETONATIONPRODUCTS--LX-04METEOROLOGICALDATAFOR HIGH-EXPLOSIVETEST SHOT DISPERSIONESTIMATEDOFFSITE SOLVENTVAPORCONCENTRATIONSESTIMATEDSOLVENTVAPORCONCENTRATIONSAT MAIN OPERATIONSAREAAIR CONTAMINANTSFR(X4WASTEHIGH-EXPLOSIVE BURNINGAT PANTEXESTIMATEDCONCENTRATIONSAT THE NEARESTSITE BOUNDARYAIR CONTAMINANTSFRCOIWASTEHIGH-EXPLOSIVE BURNINGAT PANTEXESTIMATEDCONCENTRATIONSAT THE MAIN OPERATIONSAREAHIGH-EXPLOSIVE TEST SHOT DETONATIONPRODUCTSPEAK OFFSITECONCENTRATIONSHIGH-EXPLOSIVE TEST SHOT DETONATION PRODUCTS PEAK CONCENTRATIONSTOXICITY INFORMATIONFOR HIGH-EXPLOSIVE EMISSION PRODUCTS
345679
101213131415161718
19
20
2122
4
vi

SUPPLEMENTARY DOCUMENTATION FOR AN ENVIRONMENTALSTATEMENT REGARDING THE PANTEX PLANT:
ESTIMATED RELEASES AND DOWNWIND CONCENTRATIONS OF AIR
IMPACT
POLLUTANTSFROM WASTE ORGANIC SOLVENT EVAPORATION, WASTE HIGH-EXPLOSIVE
BURNING, AND HIGH-EXPLOSIVE TEST SHOTS
by
D. G. Macdonell and J. M. Dewart
ABSTRACT
This report documents work performed in support of preparation of anEnvironmental Impact Statement (EIS) regarding the Department of Energy’s(DOE) Pantex Plant near Amarillo, Texas. Specifically, this report discussesthe following operations at the Pantex Plant that routinely anit airpollutants: evaporation of waste organic solvents contaminated with highexplosives, burning of waste high explosives, and high-explosive test shots.Available experimental data and published emission factors were used toestimate the amounts of pollutants released into the atmosphere from eachsource. Pollutant concentrations were calculated at the main plant area andat the site boundary under both typical and unfavorable meteorologicaldispersion assumptions using Gaussian plume and puff models. Theseconcentration estimates were then compared to existing air quality standards,occupational exposure limits, and, where no standards exist, to toxicologicaldata.
I. INTRODUCTION
This report documents work performed in support of preparation of anEnvironmental Impact Statement (EIS) regarding the Department of Energy’s
-1(DOE) Pantex Plant near Amarillo, Texas. That EIS addresses continuingnuclear weapons operations at Pantex and the construction of additionalfacilities to house those operations. The EIS was prepared in accordance withcurrent regulations under the National Environmental Policy Act. Regulationsof the Council on Environmental Quality (40 CFR 1500) require agencies toprepare concise EISS with fewer than 300 pages for complex projects. Thisreport was prepared by Los Alamos National Laboratory to document details ofwork performed and supplementary information considered during preparation ofthe draft EIS.
7

Air quality at the Pantex Plant is affected by a variety of sources ofair pollutants such as evaporation of waste organic solvents, burning ofwaste high explosives, high-explosive test detonations, and plant exhauststack emissions. Because nonradioactive air sampling data are not availableto verify the air quality impact of these sources, Pantex operations andmaterial use records were reviewed to determine which sources were ofpotential concern.
Because of the relatively large quantities involved and the types ofemissions that result, waste organic solvent evaporation, waste high-explosive burning, and high-explosive test shots are believed to create thegreatest potential for air pollution or adverse health effects. With noambient air-sampling data available, types and quantities of emissions fromthese operations were estimated from experimental data and published emissionfactors. Air concentrations under unfavorable and typical meteorologicaldispersion conditions were then calculated using Gaussian dispersionequations.
Potentially toxic materials such as beryllium, mercury, 4,4’-methyl enebis-(2-chloroanil ine) (MOCA), and various acids are used and, insome cases, released to the atmosphere through plant exhaust stacks. A reviewof the material usage and a site evaluation of emission control proceduresindicated that the small amounts of these materials being used are adequatelycontrolled through the use of air scrubbers or air filtering systems.Emissions that are not collected by control equipment are considered to besmall and are rapidly diluted and widely dispersed by the prevailing winds.Based on this evaluation, emissions from existing plant exhaust stacks arenot considered to cause an air quality problem and will not be discussed inthis report. Air pollution from the natural gas-fired power plant has beenpreviously addressed (USERDA 1976A).
II. DESCRIPTION OF PLANT OPERATIONS
Both high-explosives burning and waste organic solvent evaporation areperformed at the burning ground. High-explosives test firing takes place atseveral different sites around the plant.
The burning ground consists of burning pads, evaporation tanks, storagebuildings, and a control building. The burning ground is approximately 800 mfrom the nearest site boundary and 4300 m from the main operations area. The “closest test firing site to any of the site boundaries is approximately 700 mfrom the site boundary. The testing site nearest to the main operations isapproximately 3000 m distant.
A. Waste Organic Solvent Disposal
Waste organic solvents, usually contaminated with high explosives andwater, are received at the burning ground for disposal through natural

evaporation to the atmosphere. l%e waste solvent is placed in one of two
open-topped circular tanks, 2.4 m (8 ft) in diameter and 0.6 m (2 ft) deep.The rate at which a solvent evaporates varies, depending on the weatherconditions and characteristics of the particular solvent. When the organicsolvent has evaporated, the residual waste high explosive in the tank isburned. The total amount of waste organic solvent disposed of at the burningground in 1981 was approximately 69 750 2 (18 426 gal). Table I lists thevarious organic solvents and the quantities of each (Laseter 1982A).
B. Waste High-Explosive Disposal
Waste high explosives are disposed of by burning. Generally, theexplosive is spread on one of 18 open-burn pads, with no more than 682 kg(15CKllb) per pad (Laseter 1982B). Often, tw pads are used simultaneously,and occasionally, as many as four pads may be used. The thickness of theexplosive is limited to about 7.6 cm (3 in.) to allow for a rapid burn and toreduce the potential for accidental detonation. The burn is remotely ignitedby the operator from the control building. Most of the explosive is burned in2 to 5 minutes, but smoke may last for 15 to 30 minutes.
TW high explosives burned at the Pantex Plant during 1981 are Baratoland Boracitol; they do not burn completely during normal burning operations(Laseter 1982C). The explosives remaining from the first burn are piled onold railroad ties, and the ties are set afire. The ties burn for 2 to 3hours, and the Baratol or Boracitol burns and/or smolders for several days.
TABLE I
WASTE ORGANIC SOLVENT DISPOSAL FOR 1981
Solvent
AcetoneButyl acetateDimethylformamide (DMF)Ethyl acetate
nIsobutyl acetateMethanolMethyl ethyl ketone (MEK)Methyl isobutyl ketone (MIBK)Tetrahydrofuran (THF)Toluene
TOTAL
AmountGallons Liters
6 940 26 27015 57
3 410 12 908450 1 70310 38
727 2 752550 2 08250 189
1 320 4 9974 954 18 752 ,18 426 69 748

Approximately 69 000 kg (151 800 lb) of high explosives were burned atthe Pantex Plant in 1981 (Laseter 1982A). Most of the high explosives burnedin a single burn in the past several years was estimated to be 1818 kg (4000lb) (Laseter 1982C). Most of the high explosive burned was one of five types:LX-10, PBX-9502, Baratol, Comp B, or Cyclotol. Cyclotol, Comp B, and Baratolare primarily from weapons teardown; LX-10 and PBX-9502 are from high-explosive machining waste. Thus, Cyclotol, Comp B, and Baratol could beburned in large quantities in a single burn, whereas PBX-9502 and LX-10 areprobably present in nmt of the burns in small quantities. Small quantitiesof many other types of explosives were also burned (Table II). Only emissionsfrom the five high explosives comprising the bulk of explosives burned at thePantex Plant are discussed in this report.
C. High-Explosive Testing
High-explosive test firings at the Quality Test Fire sites are performedfor quality assurance testing of weapons explosives and components. Each siteis surrounded by a bunker approximately 4.6 m (15 ft) high. The types and
TABLE II
WASTE HIGH EXPLOSIVE BURNED IN 1981
Major Types ofHigh Explosives
LX-10PBX-9502BaratolComp B-3Cyclotol
Other HighExplosives Burned
BoracitolLX-04LX-09LX-17PBX-901OPBX-9011PBX-9404PBX-9501
Per Cent ofTot al*
2.57.59.0
13.567.5
.
-1
*A total of 69 000 kg was burned in 1981.

TABLE III
I
.
HIGH-EXPLOSIVES TEST FIRED IN 1981(Quality Test Fire Site)
Type
PBX-9404PBX-9407PBX-9501PBX-9502LX-04LX-09LX-10LX-13LX-14XTXComp BCyclotol
TOTAL
Weight (g)
4 1187 038
10156 513
310 559567
24 1645 7827 361
22112 02482 220
510 669 (1124 lb)
at these sites are presented in Table III.amounts of high explosives testedThere were 1378 test shots in 1981 involving 511 kg (1124 lb) of highexplosives. Less than one per cent of all tests conducted involved depleteduranium. The radiological impacts of these tests are discussed in anotherPantex report (Buhl 1982).
High-explosive skid tests occur in the High-Explosives Development TestFire Area. In 1981, these tests involved 636 kg (1400 lb) of explosives ofwhich 586 kg (1290 lb) actually detonated. These tests are performed toevaluate new explosive compounds. The types of explosives tested in 1981 werePBX-9404, PBX-9501, and LX-10, but the amount of each was unavailable.
III. CRITERIA F(N? ESTIMATINGAIR CONCENTRATIONS
Estimates of atmospheric concentrations of emissions from the previouslydiscussed operations were made by determining the emission rates of
-!pollutants from each operation. These emission rates were then used in adispersion analysis. Two separate meteorological dispersion conditions areused in the analysis: an unfavorable dispersion condition from which thehighest concentrations are expected, and a typical dispersion condition thatprovides a more realistic estimate of what air concentrations would normallybe expected.
5

Concentration estimates for each operation also were made for twolocations, at the nearest site boundary and at the main operations area.Concentrations at the site boundary were compared to Environmental ProtectionAgency (EPA) ambient air standards. Concentrations at the main operationsarea were compared to DOE-adopted occupational exposure limits to assesspotential worker exposures.
A. Waste Organic Solvent Evaporation
1. Solvent Evaporation Emissions. Oraanic so
.
vent vaDor emission rates(g/s) were calCU1ated from solvent evaporation rates (g/s-crn2) and theevaporation tank size (cm2). The evaporation rates, presented in Table IV,were derived from laboratory data (Mellan 1950, Doolittle 1954). Thecalculated emission rates (Table IV) were found to be a conservative estimate(i.e., overestimate) of the emission rate measured for a mixture of solventsat the Pantex Plant. This measured emission rate was 0.2 g/s for a 24-hourperiod with cloudless skies and temperatures ranging from 10° to 27”C.
A literature search for a convenient physical constant or formula thatcould be used to calculate relative evaporation rates for the variety ofconditions found at the Pantex Plant was unsuccessful. Various methods of
TABLE IV
WASTE ORGANIC SOLVENT EVAPORATION AND EMISSION RATES
Evaporation EmissionRate*,** Rate***
Solvent (g/cm2/h) (g/s)
AcetoneButyl acetateDMFEthyl acetateIsobutyl acetateMethanolMEKMIBKTHFToluene
11.800.870.205.031.455.034.801.51
10.242.04
3.00.3
<0.11.60.51.61.50.42.10.6
*Mellan (1950) and Doolittle (1954).**Measured at 25°C and atmospheric pressure.
***Emission rate = evaporation rate x tank size x 2 tanks.
6

I
calculating evaporation rates were found in the literature [(Doolittle 1954),(Gardner 1940), (Gray 1974), (Mel1an 1950), (Perry 1956), and (Scheflan1953)]. The estimates of evaporation that could be obtained from thesemethods were not considered to be better than the experimental data [(Mellan1950) and (Doolittle 1954)].
. 2. Solvent Vapor Dispersion. Downwind air concentrations of evaporatedsolvents were estimated using a centerline Gaussian plume dispersionequation. For a ground-level source, the equation is (Turner 1970)
~=*,
ZY
where
x is the ground-level, centerline concentration (g/m3),Q is the source emission rate (g/s),u is the wind speed (m/s), and
aYand IJzare the horizontal and vertical dispersion coefficients (m).
The meteorological parameters selected for the two dispersion cases arepresented in Table V. The unfavorable case represents nighttime conditions--low wind speeds and a stable atmosphere. The typical case represents day ornighttime conditions --moderate wind speeds and neutral atmospheric stability.
TABLE V
METEOROLOGICAL DATA FOR SOLVENT DISPERSION
Unfavorable Case Typical Case
F stability (stable) D stability (neutral)
u = 2 mfs u = 6m/s
‘Y= 27.5 m at 800 m
‘Y=56mat800m
‘z = 12.0 m at 800 maz = 26.5 m at 800 m
‘Y= 130 m at 4300 m
aY= 260 m at 4300 m
‘z = 32 m at 4300 maz = 81 m at 4300 m
Note: CSyand CSzvalues from Turner (1970).
7

B. Waste High-Explosive Burning
1. High-Explosive Burning Emissions. Experimental data characterizingthe combustion products of Comp B-3 (MHSM 1971B) and PBX-9502* were used inthis study. Emission data for the other high explosives burned at the PantexPlant during 1981 were not available. However, experimental combustion datafor a number of high explosives not currently burned at Pantex were found ina series of Atomic Energy Commission (AEC) studies performed in the early1970s (MHSM 1971A, 1971B, 1972, 1973). These studies involved burning asmall sample of high explosive in an expandable closed chamber followed bychemical analysis of the gases evolved from the burn. The emissions fromhigh-explosive burning at the Pantex Plant have been estimated from theseexperimental data.
The high explosives for which combustion product data were available andthe high explosives currently burned at Pantex are presented in Table VI. Acomparison of the composition by explosive component and binder (Table VI)shows that the explosives burned at the Pantex Plant are similar to those forwhich combustion products data are available. The per cent composition byweight of these explosives (Table VII) indicates that the m~”or differencebetween the explosives is the amount of fluorine, chlorine, or, for Baratol,barium present.
How the emissions for each of the high explosives burned were obtainedis presented next.
Emissions from the burning of Cyclotol were estimated to be the same asthe emissions measured for Comp B-3. The emissions from LX-10 were estimatedto be the same as the measured emissions from LX-07 with the exception ofhydrogen fluoride (HF). Because the fluorine composition of LX-10 is one-halfthe fluorine composition of LX-07, the HF emission rate of LX-07 wasestimated to be one-half the LX-10 emission rate.
The emissions from PBX-9502 were estimated from data collected during anexperimental open burn. The analysis of gases from the open burn provideddata on the principal combustion products (CO, C02, N02), but not othercombustion products that would be expected (HC1, HF). Emissions of HC1 wereconservatively estimated by assuming that all of the chlorine present in PBX-9502 was converted to HC1.
The HF emissions from PBX-9502 were estimated as a ratio of the LX-07emission rate. Because PBX-9502 contains only 34% as much fluorine as LX-07,the HF emission rate was estimated at 34% of the LX-07 emission rate.
.
.
*These data were supplied by T. E. Larson, Dynamic Testing Division(M Division), Los Alamos National Laboratory, May 1982.

ml
0.
-a
s-lm
.mm
aLo
.d
go
mm
m.
+“‘w
Z*1-
&l
aQsQ
N
.*U
)noC
x.N
gvw
s-i$Vm
03CA
“~07
u>wJm<1-
-1
.s-l
0001.nm
m!2.
..g
‘-m
1-
N0mmI
mCA
1-ZmC
L1-
9
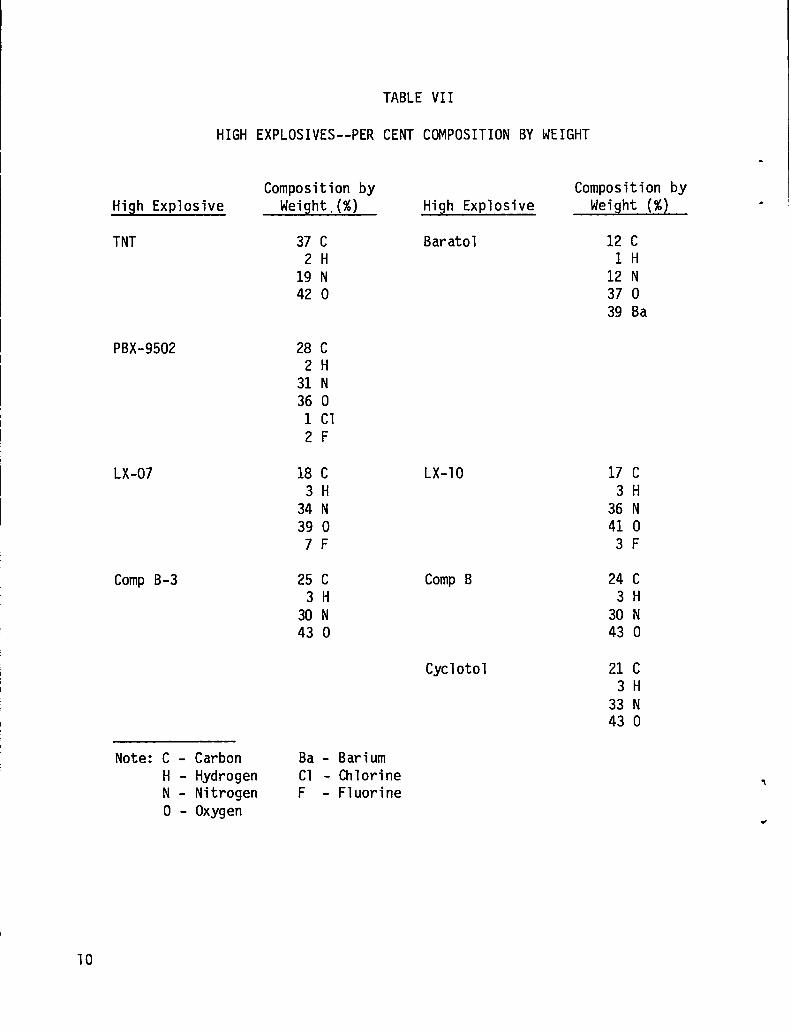
TABLE VII
HIGH EXPLOSIVES--PER CENT COMPOSITIONBY WEIGHT
Composition by Composition byHigh Explosive Weight. (%) High Explosive Weight (%)
TNT 37 c Baratol 12 c2 H 1 H
19 N 12 N42 0 37 0
39 Ba
PBX-9502
LX-07
Comp B-3
28 C2 H
31 N36 01 cl2 F
18 C3 H
34 N39 0
7 F
25 C3 H
30 N43 0
Note: C - Carbon Ba - BariumH - Hydrogen Cl - ChlorineN - Nitrogen F - Fluorineo - Oxygen
LX-10
Comp B
Cyclotol
17 c3 H
36 N41 03 F
24 C3 H
30 N43 0
21 c3 H
33 N43 0
.
.
10

Unfortunately, the PBX-9502 test data indicate two problems with the test:not all of the mass of the PBX-9502 burned was accounted for by the emissionsdata, and the burn was oxygen deficient. Thus, some gases (composed ofcarbon, hydrogen, nitrogen, and oxygen) emitted from burning PBX-9502 werenot measured, and the emission estimates for CO and hydrogen cyanide (HCN)are higher than would be expected under conditions of more completecombustion.
The emissions from burning Baratol were estimated in part fromexperimental data. Baratol is 24% TNT, for which emission data wereavailable, and 76% barium nitrate, for which emission data were calculated.All of the nitrate in the barium nitrate was conservatively assumed to bereleased as nitrogen dioxide. Ten per cent of the barium oxide produced fromthe combustion of Baratol was assumed to be aerosolized and released duringthe burn. No information was available concerning emission products from thecombustion of railroad ties containing creosote, used for burning Baratol.Therefore, no downwind air concentrations were estimated for the railroadties.
To calculate downwind air concentrations of high-explosive combustionproducts, 1818 kg (4000 lb) of one single type of high explosive were assumedto be burned, with the burn lasting 3.5 minutes. These values represent themaximum amount of high explosives burned at one time at the Pantex Plant(Laseter 1982C) and an average burn time.
2. Combustion Products Dispersion. Downwind aircombustion products were estimated using a centerlineequation for an elevated source (Turner-1970)
[ 1~.+exp — -H220Z2 ‘
where
H is the release height (m). All other symbols are as
concentrations ofGaussian dispersion
previously defined.
The effect of the release height must also be included because of thebuoyancy of the hot gases.
●
High-explosive burning takes place only during the daytime, so themeteorological parameters selected for evaluating dispersion representdaytime conditions (Table VIII). The most unfavorable dispersion conditionsare those for which the plume does not rise vertically but flows along the

TABLE VIII
METEOROLOGICALPARAMETERSFOR HIGH-EXPLOSIVES BURNING DISPERSION
Unfavorable Case Typical Case
D stability (neutral) C stability (unstable)
.
u = 6 mls u =
H =5m H =
aY=56mat800m= 26.5 m at 800m
=.;:‘z
aY= 260 m at 4300 m= 81 m at 4300 m
aY :az az
3 mls25 m85 m at 800 m49.5 m at 800390 m at 4300230 m at 4300
mmm
ground horizontally. This corresponds to relatively strong winds and neutralatmospheric stability. Although this was the typical condition for solventdispersion, the limitation of burning only during the daytime and theminimization of plume rise makes this the most unfavorable dispersioncondition for high-explosives burning. Another daytime condition was chosenfor the typical case--unstable atmosphere stability and moderate wind speeds.The height of the release was estimated for both cases.
C. High-Explosive Test Shots
Estimates of air concentrations of air pollutants from high-explosivetest shots were made using theoretically derived detonation products and aGaussian puff dispersion equation. Calculations were not made for eachexplosive type. There is generally only a small amount of explosive involvedin each shot (several grams to 20 kg), and the primary detonation productsare similar for all explosives (Ornellas 1982). Thus, only a few of the highexplosives were selected for calculation of detonation products and downwindair concentrations.
1. Detonation Products. The detonation products for Cyclotol, Comp B,and LX-04 were theoretically derived (Mader 1963, 1982A, 1982B) and presentedin Tables IX, X, and XI. The primary detonation products are water vapor,carbon dioxide, nitrogen gas, and solid carbon (particulate). Of these, onlyparticulate are regulated under EPA ambient air quality standards. Air
-
concentrations of the other primary products will not be evaluated.w
Air concentrations were calculated for an 11.4-kg (25-lb) high-explosivetest shot. This is an average size for skid testing; nnst of the qualityassurance test shots are less than 10 lb.
12

TABLE IX
DETONATION PRODUCTS--CYCLOTOL75% RDX/25% TNT, C2 05 H3 03 N2 so 03 15
. . . .
Detonation Products MolecularMole/Mole HE Weight
H~0 3.73Hz 8.16 x 10-902 3.1OX 10-3co~ 2.01co 1.61 X 10⁻³NH~ 8.46 X 10⁻⁸H+ 3.44x 10⁻¹⁰NO 2.96 X 10⁻³N2 3.44OH- 1.63 X 10⁻¹⁰CHq 1.48X 10⁻¹¹Solid carbon 3.04
182
324428171
3028171612
*Emissions less than 0.001 g/100 g HE.
TABLE X
DETONATION PRODUCTS--COMPOSITION B64% RDX/36% TNT, C
2.05 ‘3.03 ‘2.80 03.15
Detonation Products MolecularMole/Mole HE Weight
H~0 4.38Hz 6.32 X 10-1002 3.40 x 10⁻³C02 2.46co 3.60 X 10⁻³NH~ 3.19 x 10⁻⁷H+ 2.47 X 10⁻¹⁰NO 4.14 x 10⁻³N2 3.82OH- 1.92 X 10⁻¹⁰CHq 7.95 x 10⁻¹¹Solid carbon 4.39
182
324428171
3028171612
Emissions(g/100 g HE)
23.3-- *
0.03430.7
0.016----
0.03133.4
----
12.6
Emissions(g/100 g HE)
22.7-- *
0.0331.2
0.03--
--
0.0430.8
--
--
15.2
*Emissions less than 0.001 g/100 g HE.
73

TABLE XI
DETONATION PRODUCTS--LX-04
85% HMX/15% VITON A, C1.48 H2.46 ‘2.2002.2 ‘0.50
Detonation ProductsMole/Mole HE
HFCF4F2H~0H202co~coNH~H+NON2OH-CH4COF~Solid carbon
MolecularWeight
20883818
232442817
1302817166612
Emissions(g/100 g HE)
-- *
11.00.0123.8--
0.00321.3
----
--
0.00232.1
----
--
11.5
*Emissions less than ().0()1g/lDO g HE.
2. Detonation Products Dispersion. The detonation products were assumed
to be released as an instantaneous puff release. The peak concentration for apuff release assuming Gaussian dispersion is (Turner 1970)
0.127 Qt
[ 1-H2x= auu exp —
Xyz 2az2 ‘
where
Qt is the total release (g),Uy and Uz are horizontal and vertical puff dispersion coefficients (m),ax is the downwind puff dispersion coefficient (m): ax = IJy,andH is the release height (m).
.
.
The height of the release was calculated as a function of the amount of highexplosive involved in the test. The height of the cloud top is (Church 1969)
14

HC = 76 (HE)025 ,
where
HC is the height ofHE is the amount of
.
the cloud top (m) andhigh explosive (lb).
The cloud center was estimated as one-half HC and this height was used asthe release height in the puff dispersion equation. A virtual source distancewas added to the downwind distances where air concentrations were calculatedto account for the initial size of the detonation cloud. This virtual sourcedistance is the distance where the initial Cy is equal to HC/4.
Air concentrations were calculated for tw sets of daytime meteoro-logical conditions (Table XII). Because of the effect of release height,unstable atmospheric conditions were again chosen for the typical dispersioncase and neutral stability conditions were chosen for the unfavorable case.
IV. RESULTS
Downwind air concentrations at the site boundary and at the mainoperations area are presented for organic solvent evaporation (Tables XIIIand XIV), waste high-explosive burning (Tables XV and XVI), and high-explosive test shots (Tables XVII and XVIII). For comparison, the applicableEPA and state ambient air quality standards, and DOE-adopted occupationalexposure limits, are presented in the corresponding tables.
TABLE XII
METEOROLOGICAL DATA FOR HIGH-EXPLOSIVE TEST SHOT DISPERSION
Unfavorable Case
Neutral stability
H =85m
‘Y= 0.06 X0”g2
az = 0.15 x0”70
‘x =0Y
Virtual source (y) distance = 1250 m
Virtual source (z) distance = 3185 m
Typical Case
Unstable stability
H =85m
‘Y= 0.14 X“”go
az = 0.53 x0”73
ax =aY
Virtual source (y) distance = 500 m
Virtual source (z) distance = 405 m
Note: Puff dispersion coefficients from S1ade (1968).x is downwind distance (m).
15

TABLE XIII
ESTIMATEDOFFSITE SOLVENTVAPORCONCENTRATIONS
Solvent
Ethyl acetateAcetoneMEKTolueneMethanolButyl acetateMIBKDMFTHFIsobutyl acetate
Offsite Concentrations*(Pm)
Unfavorable TypicalCase Case
0.210.610.240.080.590.030.050.010.340.05
0.020.050.020.010.04.-**--
--
0.03--
*There are no applicable EPA or Texas ambient air standardsfor these solvents.
**Concentrations less than 0.005 ppm.
v. DISCUSSIONAND CONCLUSIONS
Air concentrations of the various pollutants emitted at the PantexPlant have been estimated for both offsite and onsite locations and comparedto the appropriate standard or limit (Tables XIII through XVIII). Availabletoxicological information was also reviewed and compared to the estimatedconcentrations (Table XIX).
A. Waste Organic Solvent Evaporation
Results from dispersion modeling (Table XIII) indicate thatconcentrations of waste organic solvent vapor do not exceed 1 ppm offsiteunder any of the meteorological conditions assumed. No adverse health effectswould be expected from exposure to these low concentrations. There are noapplicable EPA or Texas ambient air standards for these solvents.
.
Organic solvent vapor concentrations estimated at the main operationsarea (Table XIV) vould not exceed 0.05 ppm. No occupational exposure limitswould be exceeded for workers. No adverse health effects would be expectedfrom exposure to these low concentrations.
16

TABLE XIV
ESTIMATEDSOLVENTVAPORCONCENTRATIONSAT MAIN OPERATIONS AREA
EstimatedConcentrations (ppm)
TypicalUnfavorableSolvent Case
Ethyl acetateAcetoneMEKTolueneMethanolButyl acetateMIBKDMFTHFIsobutyl acetate
0.020.050.020.010.05.-----
0.03--
Case
--**------------------
Occupational Ex-posure Limits*
(ppm)
8h
4007502001002001505010
200150
15 min
NS***
10003001502502007520
250187
*ACGIH 1982.**Concentrations
***No standard.less than 0.005 ppm.
B. Waste High-Explosive Burning
Results from the dispersion modeling of waste high-explosive burningindicate that concentrations of combustion products range from 0.01 to 60 ppmat the nearest site boundary (Table XV) and from less than 1 ppb to 5 ppmat the main operations area (Table XVI). These concentrations werecalculated for a burn of 1818 kg (4000 lb) of one single type of explosive.The highest pollutant concentrations were calculated for carbon monoxide andhydrogen cyanide from PBX-9502 and for nitrogen dioxide from Baratol.However, the emissions for these pollutants were very conservativelyestimated and so the resulting concentrations are higher than would.realistically be expected.
* EPA ambient air standards exist for only tw of the combustion products:carbon monoxide and nitrogen dioxide. The nitrogen dioxide annual standard,the carbon monoxide l-hour standard, and the carbon monoxidewould not be exceeded by the high-explosives burning alone.concentrations from other sources of these tvm pollutants at
8-hour standardThe airthe Pantex
77

wxiii1-
O’lw
mm
m.
..
..
dtgd
omC
um
mm
mm
..
..
..
mN
N!-lcw
9-1In
+ms-1
=!+3.m
om
u-l
g&
*“:N
.●

..
!3I
5
I

—-—. —
Explosive
LX-04
Cyclotol
Comp B
DETONATION
DetonationProduct
TABLE XVII
HIGH-EXPLOSIVE TEST SHOTPRODUCTS PEAK OFFSITE CONCENTRATIONS
CFkF2NOSolid carbon
coNH3NOCHkSolid carbon
coNH~NOCHqSolid carbon
OffsiteUnfavorable TypicalDispersionCase (ppm)
1.1 x 10-’+2.7 X 10⁻⁷
--*
8.4 X 10⁻⁴
4.9 x 10⁻⁷--
9.OX 10-7--
9.2 X 10-Q
9.6x 10⁻⁷
DispersionCase (ppm)
8.4x 10-51.9 x 10-7
--
5.9 x 10-’+
3.5 x 10⁻⁷--
6.5 X 10⁻⁷--
6.5 X 10⁻⁴
6.6 x 10⁻⁷-- - -
1.1 x 10⁻⁶ 8.2 X 10⁻⁷-- --
1.1 x 10⁻³ 7.8x 10⁻⁴
.
●
EPAStandard
_@!@._
N’j**
NSo.05***0.15+
35++
NS0.05NS0.15
35NS0.05NS0.15
*Negligible concentration.**No standard.
***NOO annual standard.
~Sl$ annual standard assuming all particulate is carbon.‘+CO l-hour standard, CO 8-hour standard, 8.75 ppm.
P1ant, automobile traffic (USERDA 1976) and the power PIants (MHSM 1982),combined moth air concentrations from waste high-explosive burning, are notexpected to exceed the ambient air standards.
The State of Texas has adopted the EPA National Ambient Air Quality●
Standards (NAAQS) for sulfur dioxide, nitrogen dioxide, total suspendedparticulate, ozone, hydrocarbons, carbon monoxide, and lead. In addition, =
the State of Texas has adopted a hydrogen fluoride standard “directed to theprotection of vegetationassumptions used in this
and animal life” (Texas 1981). Based on theanalysis, the 3-hour HF standard of 6.0 ppb could be
20

TABLE XVIII
HIGH-EXPLOSIVETEST SHOT DETONATION PRODUCTS PEAK CONCENTRATIONS
.Main O~erations Area
8
Explosive
LX-04
Cyclotol
Comp B
DetonationProduct
CF4F2NOSolid carbon
coNH~NOCHqSolid carbon
coNH~NOCHkSolid carbon
UnfavorableDispersionCase (ppm)
3.8x 10-59.5 x 10-8
--**2.9 X 1-4
1.7 x 10⁻⁷--
3.2 X 10⁻⁷--
3.2 X 10⁻⁴
3.3x 10⁻⁷--
4.1 x 10⁻⁷--
3.9X 10⁻⁴
TypicalDispersionCase (ppm)
6.7 X 10-61.7 x 10-8
--
5.3 x 10⁻⁵
3.1 x 10⁻⁸--
5.8x 10⁻⁸--
5.7 x 10⁻⁵
5.8x 10⁻⁸--
7.3 x 10⁻⁸--
6.9 X 10⁻⁵
Occupational Expo-sure Limits (ppm)*8-hour 15-minute
NS** NS
1 23 5NS NS
50 40025 353 5NS NSNS NS
50 40025 353 5NS NSNS NS
*/JcGIH 1982.**No standard.
***Negligible concentration.
exceeded from the burning of LX-10 or PBX-9502. The 3.5-minute offsiteconcentrations of 5.2 and 2.5 ppm (Table XV) estimated under unfavorable andtypical dispersion conditions from LX-10 are equivalent to 101 and 49 ppb,respectively, over 3 hours. However, it is unlikely that LX-10 and PBX-9502are burned in quantities large enough [91 kg (200 lb)] in a single burn tocause a violation of the HF standard.
. Through 1985, the total annual quantity of high explosives burned at thePantex Plant is expected to be reduced by 30 to 50%. However, the mount ofhigh explosives containing fluorine burned is expected to increase. Thus, to
●
prevent a future violation of the Texas 3-hour HF standard, the mount ofhigh explosives containing fluorine burned at one time will be limited, orthe burning ground will be moved to a location farther from the site boundary(Owens 1982).

TABLE XIX
TOXICITY INFORMATIONFOR HIGH-EXPLOSIVE EMISSION PRODUCTS
.
Carbon monoxide (CO): Carbon monoxide (CO) combines with hemoglobin andreduces the oxygen-carrying capacity of the blood. ,It is reasoned that there is no dose of CO that isnot without an effect on the body. Whether thateffect is physiologic or harmful depends upon thedose of CO and the state of health of the exposedindividual. It has been suggested that workerswith heart disease or who work at high elevations,high temperatures, or at heavy labor should have alower exposure 1imit (ACGIH 1980). Carbon nmoxideat low levels may initiate or enhance deleteriousmyocardial alterations in individuals withrestricted coronary artery blood flow and decreasedmyocardial lactate production (USDHEW 1977).
Little is known about the effects of CO onvegetation, but levels necessary to cause injuryare expected to be very high (APCA 1970).
Nitrogen dioxide (N02): Daily animal exposures to 1, 5, and 25 ppn showedno chronic effect after 18 months. Transient, mildand acute effects were not noticeable at the end ofa week’s exposure. Because of an indication of apossible lung-tumor-accelerating capacity seen in agroup of lung-tumor-susceptible mice, a ceilingoccupational exposure limit of 5 ppm was set. Ratscontinually exposed to 0.8 ppm had elevatedrespiratory rates but showed no real ill effects.At 2 ppm, slight lung changes were observed but1ife spans were normal (ACGIH 1980). USDHEW(1976A) reports that a human subject was exposed to62 ppm for 1 hour on three separate occasions.The subject noted laryngeal irritation and anincrease in respiratory rate. There were no ill &
effects observed following this exposure. Patientssuffering chronic bronchitis when exposed to 1.5 to d5.0 ppm experienced increased airway resistance,significant decrease in arterial oxygen tension,and significant increase of end-expiratory arterialpressure at 4-5 ppm. No effects were noted below1.5 ppm.
22

TABLE XIX (cent)
Nitrogen dioxide (N02): Plant species vary in susceptibility to N02. (cent) exposure. Sensitive species may be injured by a 2-
hour exposure of 2.5 to 6 ppm N02 but the extent ofY injury is dependent on other climatic conditions.
Other species are extremely resistant to N02 andare not injured at concentrations of 1000 ppm for 1hour. The effects of N02 exposure can vary, butusually range from a nonspecific chlorosis,browning or bleaching, to conditions of water-soaked lesions and tissue collapse (APCA 1970).N02 is of greater significance in relation tophotochemical smog than as a phytotoxin in itself.
Hydrogen fluoride (HF): Repeated human exposure at concentrations as highas 4.7 ppm were tolerated without severe effects(ACGIH 1980). Human exposure of 2.6 to 4.8 ppn forperiods up to 50 days resulted in slight nose, eye,and skin irritation, but there were no signs ofpulmonary irritation (Proctor 1978). Mildirritation of the respiratory tract was found inrepeated daily exposures of animals to 7 ppm.Exposures of 17 pm resulted in damage to thelungs, liver, and kidney.
No quantitative correlation that relates the degreeof plant injury to the atmospheric concentrationhas been found. However, sensitive plant speciesmay be injured by exposures below 1.0 ppb, whileother species show no effects from exposure toseveral times this concentration. The injury mayvary from necrosis and chlorosis to foliar lesionsand defoliation. Fluoride injury to vegetationcommonly results from gradual accumulation offluoride in the plant tissue over a period of time.Another result of fluoride exposure is theaccumulation of fluoride in the plant, which, wheningested by livestock and other herbivores, maycause dental or skeletal fluorosis (APCA 1970,Weinstein 1977).
23
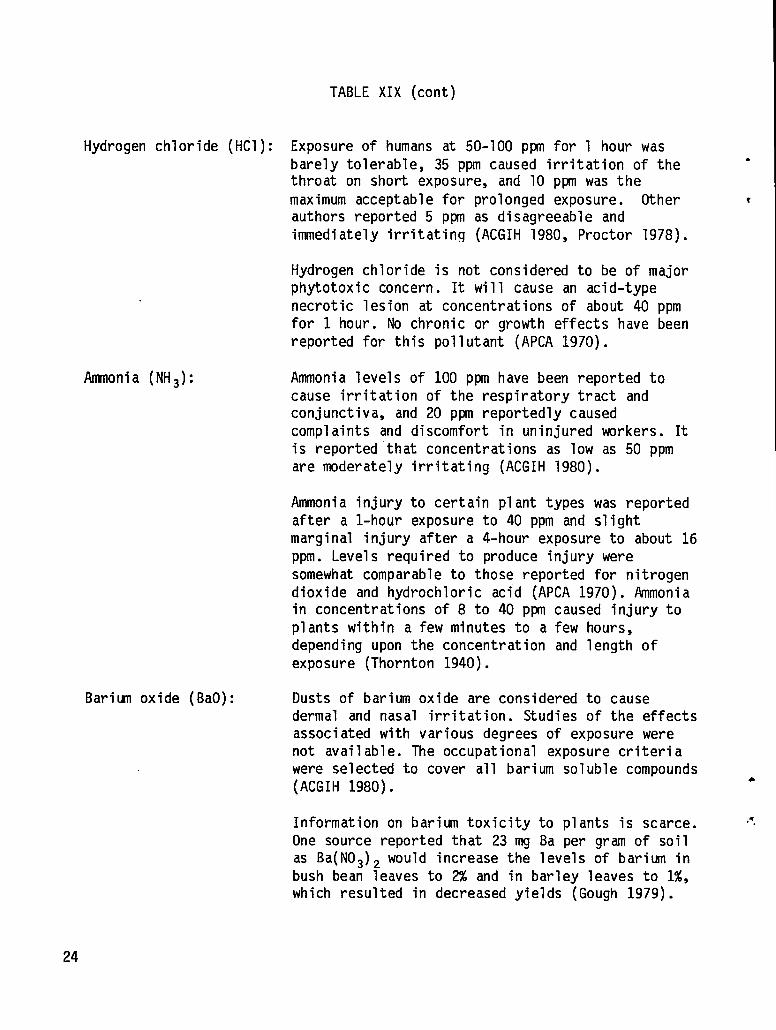
TABLE XIX (cent)
Hydrogen chloride (HC1): Exposure of humans at 50-100 pm for 1 hour wasbarely tolerable, 35 ppm caused irritation of thethroat on short exposure, and 10 ppm was themaximum acceptable for prolonged exposure. Otherauthors reported 5 ppn as disagreeable andimmediately irritating (ACGIH 1980, Proctor 1978).
Ammonia (NH3):
Bariun oxide (BaO):
Hydrogen chloride is not considered to be of majorphytotoxic concern. It will cause an acid-typenecrotic lesion at concentrations of about 40 ppmfor 1 hour. No chronic or growth effects have beenreported for this pollutant (APCA 1970).
Ammonia levels of 100 ppm have been reported tocause irritation of the respiratory tract andconjunctival, and 20 ppn reportedly causedcomplaints and discomfort in uninjured workers. Itis reported that concentrations as low as 50 ppmare nmderately irritating (ACGIH 1980).
Ammonia injury to certain plant types was reportedafter a l-hour exposure to 40 ppm and slightmarginal injury after a 4-hour exposure to about 16ppm. Levels required to produce injury weresomewhat comparable to those reported for nitrogendioxide and hydrochloric acid (APCA 1970). Iknmoniain concentrations of 8 to 40 ppm caused injury toplants within a few minutes to a few hours,depending upon the concentration and length ofexposure (Thornton 1940).
.
t
Dusts of barium oxide are considered to causedermal and nasal irritation. Studies of the effectsassociated with various degrees of exposure werenot available. The occupational exposure criteriawere selected to cover all barium soluble compounds(ACGIH 1980).
a
Information on barium toxicity to plants is scarce. .,*
One source reported that 23 mg Ba per gram of soilas Ba(N03)2 would increase the levels of barium inbush bean leaves to 2% and in barley leaves to 1%,which resulted in decreased yields (Gough 1979).
24

TABLE XIX (cent)
Hydrogen cyanide (HCN): Estimates of hydrogen cyanide (HCN) exposure that. could be fatal are 270 ppm, immediately fatal; 181
ppm, fatal after 10 minutes; 135 ppm, fatal after30 minutes; 110 to 135 ppm, fatal after 30 to 60
●
minutes. Workers exposed for 7 years toconcentrations between 4 and 12 ppm were found tosuffer only from subjective symptoms such asheadache, weakness, changes in taste and smell, andirritation to the throat (ACGIH 1980). One reportindicated the human exposure to concentrations of20 ppm or more has produced adverse effects afterseveral hours, whereas another report indicated thatan exposure of 18 to 36 ppn resulted in minimumsymptoms after several hours of exposure (USDHEW19766) .
Little information is available on thephytotoxicity of HCN. It is reported to havesimilar effects on tomato plants and soy beanplants as other pollutants such as ammonia (NH3),where injury was observed at 8 ppm to 40 ppm. Athigher concentrations, plants exposed to NH3 wouldrecover when removed from the NH3 atmosphere butthe plants exposed to HCN muld continue to dieafter removal from the HCN atmosphere (Thornton1940) .
Available human, animal, and plant toxicity information was reviewed forchose enissions for tiich no EPA or Texas anbient air standards exist(hydrogen cyanide, ammonia, barium oxide, and hydrogen chloride) as well asfor those emissions that have ambient air standards (carbon monoxide,nitrogen dioxide, and hydrogen fluoride). Basic toxicity information isprovided in Table XIX.
mHuman exposures to N02, HF, and HC1 (Table XV) at the nearest boundary
‘- under unfavorable meteorological conditions could result in respiratory tract..-irritation to exposed individuals by forming highly irritating acids uponcontact with nnisture in the respiratory tract (USDHEW 1977). However,because of the relatively short duration of the high-explosive burn, more
25
severe effects wuld be unlikely from any of these combustion products. Novegetation injury would be expected. Carbon monoxide exposures to humans andvegetation would not be expected to result in any observable effects. Acutetoxicity to humans from HCN exposure is primarily a function of concentrationand exposure time rather than just a function of concentration. Humanexposures to 20 ppm or more have produced adverse effects in humans onlyafter continuous exposures exceeding 1 hour (USDHEW 1976B). Therefore, theestimated 35 ppm HCN produced frcxnburning PBX-9502 for about 3.5 minuteswould not be expected to result in adverse health effects.
The information available to evaluate the potential effects of HCN onvegetation was too limited to predict the potential effects that couldresult. There is some evidence that potential HCN emissions from burning PBX-9502 could produce some plant damage; however, the exposure time would notlikely be of a duration to cause any effects.
Based on the estimated concentrations of pollutants resulting at themain operations area (Table XVI) from high-explosives burning, employeeexposures would not exceed occupational exposure limits.
C. High-Explosive Test Shots
Estimates of peak offsite airborne concentrations of detonation productsfrom high-explosive test shots (Table XVII) indicate that no ambient airstandards are exceeded. No occupational exposure limits would be exceeded forworkers at the main operations area (Table XVIII).
D. Summary
Routine operations at Pantex involving weapons production and weaponsretirement result in the need for disposal of fairly large quantities ofwaste organic solvents and waste high explosives. A routine program forquality assurance testing of high explosives is also conducted. Theseevaporation, burning, and testing operations employed at Pantex have thepotential for release of large quantities of air pollutants. From theevaluation of these operations, no adverse health effects would be expectedin healthy individuals. No ambient air standards muld be violated because ofair emissions from routine operations at Pantex. Predicting the healtheffects, either acute or chronic, that the exposure to these variousemissions might have on an individual with a pre-existing health anomaly(such as heart or lung disorder) is not possible. However, the lowpopulation density of the area surrounding Pantex limits the number of suchindividuals who might be exposed. Thus, the routine air emissions from Pantexoperations are not considered to be a hazard, either to the public or toemployees at Pantex.
26

VI. RECOMMENDATIONS
Many uncertainties were encountered in the estimation of emissions fromthe burning of high explosives. These included:
.
no emission data for the burning of Cyclotol, Baratol, and LX-10;v incomplete analytical results for available experimental test data (not
all combustion products were accounted for in each test); andno emission data for the burning of Baratol and Boracitol with railroadties.
Because of these uncertainties, emissions from high explosives may have beenunder- or overestimated in this study. In addition, some emissions were notconsidered. In particular, the combustion products from burning railroad tieswith Baratol and Boracitol may result in a variety of potentially toxic orcarcinogenic combustion products because of the presence of preservativessuch as creosote in the ties. It was not possible to estimate the potentialemissions.
Additional, more encompassing, experimental tests (similar to the AECstudies) are recommended to provide the emissions data needed to predict moreaccurately the impact of high-explosives burning.
ACKNOWLEDGMENTS
The authors would like to thank Bill Laseter, Tom Koger, VickyCornelius, and Walt Huddleston of Mason and Hanger, and Tom Larson of LosAlamos for their assistance in supplying data for this report. We alsoappreciate the technical advice provided by Don Rose and Roger Ferenbaugh ofLos Ali3mos.
REFERENCES
ACGIH 1980: American Conference of Governmental Industrial Hygienists,jlocumentation of the Threshold Limit Values (4th cd., ACGIH Inc., 1980)Pp. 16, 35, 72-73, 222-224, 305-306.
ACGIH 1982: American Conference of Governmental Industrial Hygienists,“Threshold Limit Values for Chemical Substances in Workroom Air Adopted
a by ACGIH for 1981,” Cincinnati (1982).
. APCA 1970: Air Pollution Control Association, “Recognition of Air PollutionInjury to Vegetation,” Pittsburgh, Pennsylvania (1970).
27

Buhl 1982: T. Buhl, J. Dewart, T. Gunderson, D. Talley, J. Wenzel, R. Romero,J. Salazar, and D. Van Etten, “Supplementary Documentation for anEnvironmental Impact Statement Regarding the Pantex Plant: RadiationMonitoring and Radiological Assessment of Routine Releases,” Los AlamosNational Laboratory report LA-9445-PNTX-C (1982).
.
Church 1969: H. W. Church, “Cloud Rise from High Explosive Detonations,” v
Sandia Laboratories report SC-RR-68-903 (May 1969).
Dobratz 1981: B. M. Dobratz (Ed.), “LLNL Explosives Handbook, ” LawrenceLivermore Laboratory report UCRL-52997 (March 1981).
Doolittle 1954: A. K. Doolittle, The Technology of Solvents and Plasticizers(John Wiley & Sons, New York, 1954), pp. 24-80, 354-356, 380-417.
Gardner 1940: G. S. Gardner, “Evaporative Index,” Ind. Eng. Chem. 32, 226-232(1940) .
—
Gough 1979: L. P. Gough, H. T. Shacklette, and A. A. Case, ElementConcentrations Toxic to Plants, Animals, and Man (US Government PrintingOffice, Washington, DC, 1979), p. 59.
Gray 1974: D. C. Gray, “Solvent Evaporation Rates,” Am. J. Ind. Hyg. 35, 695-710 (1974).
—
Laseter 1982A: W. A. Laseter to K. H. Rea, Mason & Hanger-Silas Mason Co.,Inc., letter on “Waste Solvent Disposal at Pantex,” April 27, 1982.
Laseter 1982B: W. A. Laseter to K. H. Rea, Mason & Hanger-Silas Mason Co.,Inc., letter on “Waste High Explosives Burning Procedures at Pantex,”August 3, 1982.
Laseter 1982C: W. A. Laseter to K. H. Rea, Mason & Hanger-Silas Mason Co.,Inc., letter on “Burning Ground Operations,” August 26, 1982.
Mader 1963: C. L. Mader, “Detonation Properties of Condensed ExplosivesComputed Using the Becker-Kistiakowsky-Wilson Equation of State,” LosAlamos Scientific Laboratory report LA-2900 (July 1963).
Mader 1982A: C. L. Mader to J. M. Dewart, Los Alamos National Laboratory,A
letter on “Detonation Products of Cyclotol and LX-17,” April 7, 1982.A
Mader 1982B: C. L. Mader to J. M. Dewart, Los Alamos National Laboratory,letter on “Detonation Products of LX-04,” July 7, 1982.
Mellan 1950: I. Mellan, Industrial Solvents (Reinhold Publishing Corp., NewYork, 1950), pp. 46-89.
28

MHSM
. MHSM
v
MHSM
MHSM
MHSM
1971A: J. Wichmann, F. I. Honea, W. A. Bullerdick, and T. K. Mehrhoff,“Disposal of Waste or Excess High Explosives,” Mason & Hanger-SilasMason Co., Inc., report MHSMP-71-55 (April-August 1971).
1971B: J. Wichmann and F. I. Honea, “Disposal of Waste or Excess HighExplosives,” Mason & Hanger-Silas Mason Co., Inc., report MHSMP-72-12(September-December 1971).
1972: F. I. Honea, J. Wichmann, and T. K. Mehrhoff, “Disposal of Wasteor Excess High Explosives,” Mason & Hanger-Silas Mason Co., Inc., reportMHSMP-72-47 (April-June 1972).
1973: F. I. Honea, J. L. Barnard, W. A. Bullerdick, and T. K. Mehrhoff,“Disposal of Waste or Excess High Explosives,” Mason & Hanger-SilasMason Co., Inc., report MHSMP-73-11 (January-March 1973).
1982: W. A. Laseter, “Environmental Monitoring Report for Pantex PlantCovering 1981,” Mason & Hanger-Silas Mason Co., Inc., report MHSMP-82-14(April 1982).
Ornellas 1982: D. L. Ornellas to J. M. Dewart, Lawrence Livermore NationalLaboratory, letter on “Products of Detonation and Burning of Explosivesin Air” (May 6, 1982).
Owens 1982: J. W. Owens to A. K. Stoker, Department of Energy-Amarillo AreaOffice, letter on “Limitations on the Burning of Fluorine-ContainingHigh Explosives,” October 7, 1982.
Perry 1956: J. H. Perry (Ed.), Chemical Engineer’s Handbook (McGraw-Hill BookCo. Inc., New York, 1956), pp. 545.
Proctor 1978: N.Workplace (J
Scheflan 1953: L.(Krieger Pub”
Slade 1968: D. H.
. Proctor and J. P. Hughes, Chemical Hazards of theB. Lippincott Co., Philadelphia, 1978), pp. 286, 290.
Scheflan and M. B. Jacobs, The Handbook of Solventsishing Co., New York, 1953), pp. 39-46.
Slade (Ed.), “Meteorology and Atomic Enerq.y,” USAEC re~ortTID-24190 (July 1968).
-. ---
a
Texas 1981: Texas Air Control Board, “Texas Regulation III: Control of Air. Pollution from Toxic Materials,” April 30, 1981.
Thornton 1940: N. C. Thornton and C. Sutterstrom, “Toxicity of Ammonia,Chlorine, Hydrogen Cyanide, Hydrogen Sulfide, and Sulfur Dioxide Gases,”Boyce Thompson Institute for Plant Research, Inc., Vol. II, pp. 352(1940).
29

Turner 1970: D. B. Turner, “Workbook of Atmospheric Dispersion Estimates, ”USEPA report AP-26 (1970).
USDHEW 1976A: Department of Health, Education, and Welfare, “Criteria for aRecommended Standard, Occupational Exposure to Oxides of Nitrogen
.
(Nitrogen Dioxide and Nitric Oxide) ,“ Washington, DC, pp. 29, 39 (March1976) . )
USDHEW 1976B: Department of Health, Education, and Welfare, “Criteria for aRecommended Standard Occupational Exposure to Hydrogen Cyanide andCyanide Saltsy (Washington, DC, October 1976),pp. 86-88.
USDHEW 1977: Department of Health, Education, and Welfare, “OccupationalDiseases, A Guide to Their Recognition; (Washington, DC, June 1977),pp.203-205, 418-419.
USERDA 1976: United States Energy Research and Development Administration,“Environmental Assessment, Pantex Plant, Anarillo, Texas,” (Washington,DC, June 1976).
Weinstein 1977: L. H. Weinstein, “Fluoride and Plant Life,” J. Occup.Med. 19, No. 1, 49-78 (January 1977).—
I 30

.=-
Page RangeNTfs
Prk code
001.02s0260500s I 07s
076.100101.12s126.1s0
A02A03A04A05A06A07
Ptited in the United Statesor AA ..,Awilabk fmm
Nuiod Tcchmcal Information SCWti
W Depwtmen; of Commrme
S28S Poe Royal RomiSpcinslidd.VA 22161
Wcrofiihe fAOI )
NTIS
Psse Range Price Code
151.17s AOS176.200 AW
201 12s A1O
226-2S0 All23 I 275 A12276.300 A13
PmBe Range
JO I.325
3263$0
131.375
J?6 $30
401.425
4:6450
NTISHCe C*
A14AISA16A17A18A19
NTISPage Rmge Pdce Code
4s 1.47s AIO476.51M A21SOI. S25 A22
526.5S0 A2.S
5s1.s75 A24
S76400 A25
601 up” A99
“ContactNTIS for ● pricequote.
