a water well inventory to assess potential conflicts from ... · a water well inventory to assess...
TRANSCRIPT

Illinois State Water SurveyPrairie Research InstituteUniversity of Illinois at Urbana-Champaign
Champaign, Illinois
Contract Report 2013-03
A Water Well Inventory to Assess Potential Conflicts from Development of a Well Field
in Selected Areas of McLean, Tazewell, and Woodford Counties, Illinois
Steven D. Wilson, Kevin L. Rennels, George S. Roadcap
April 2013

Contract Report 2013-03
A Water Well Inventory to Assess Potential Conflicts from Development of a Well Field in Selected Areas of McLean,
Tazewell, and Woodford Counties, IL
By
Steven D. Wilson, Kevin L. Rennels, and George S. Roadcap
Illinois State Water Survey Prairie Research Institute
University of Illinois at Urbana-Champaign

i
CONTENTS Page ABSTRACT .....................................................................................................................................1 INTRODUCTION ...........................................................................................................................1 McLean-Tazewell Aquifer Assessment (Wilson et al., 1998) .............................................1 Efforts since Wilson et al. (1998) ........................................................................................2 This Project ..........................................................................................................................2 STUDY OBJECTIVE ......................................................................................................................4 STUDY DESCRIPTION AND TASKS ..........................................................................................4 Study Area ...........................................................................................................................4 Existing Data ....................................................................................................................... 4 Soliciting Well Owner Support ........................................................................................... 6 Well Inventory .................................................................................................................... 6 Creating a Final Project Database ........................................................................................7 Cooperation and Well Access Issues .................................................................................. 7 Missing Data ....................................................................................................................... 8 Well Locations .................................................................................................................... 8 Assigning Wells to Aquifers ............................................................................................... 8 Mapping Water Levels ........................................................................................................ 9 Mapping Pump Settings ...................................................................................................... 9 Depth of Water in a Well .................................................................................................. 12 RESULTS ..................................................................................................................................... 12 Well Inventory ...................................................................................................................12 Database .............................................................................................................................13 Assigning Wells to Aquifers ..............................................................................................13 Water Level Mapping ........................................................................................................14 Comparison with Past Water Levels ..................................................................................14 Potential for Well Interference Impacts .............................................................................14 DISCUSSION/RECOMMENDATIONS ..................................................................................... 25 Well Inventory ...................................................................................................................25 Mahomet Aquifer Groundwater Flow Model ....................................................................25 Well Construction Practices ...............................................................................................27 Next Steps ..........................................................................................................................27 ACKNOWLEDGEMENTS ...........................................................................................................28 REFERENCES ............................................................................................................................. 28 APPENDIX A. 2011 Letter Report to the Long Range Water Plan Steering Committee ............29
APPENDIX B. A Completed Well Inventory Form ....................................................................51

ii
LIST OF FIGURES
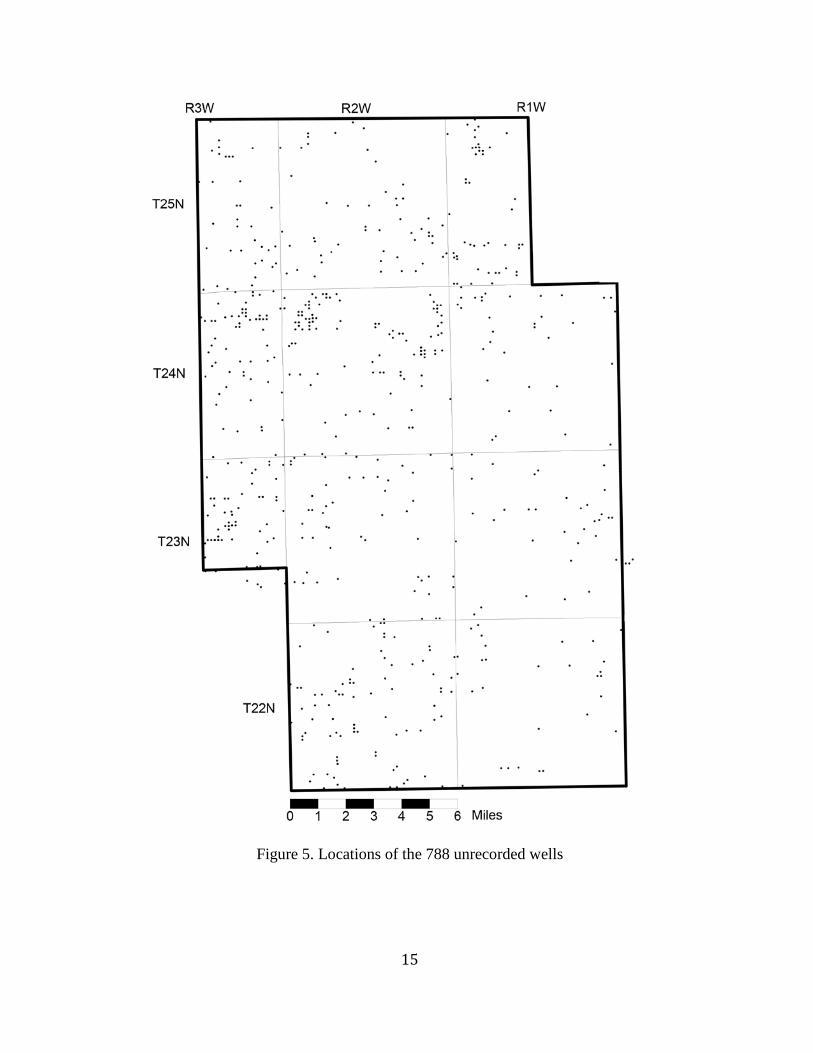
Page Figure 1. The McLean-Tazewell Aquifer assessment study area (from Wilson et al., 1998) ...... 3 Figure 2. Thickness of the Mahomet Aquifer (from Wilson et al., 1998) .................................... 5 Figure 3. Model simplification of the geology in the study area: (a) sequence of geologic materials in the study area; (b) simplification used in the hydrogeologic interpretation; (c) simplification used in the Mahomet Aquifer groundwater flow model ...................................10 Figure 4. Thickness of the Glasford Aquifer (from Wilson et al., 1998) .................................... 11 Figure 5. Locations of the 788 unrecorded wells ........................................................................ 15 Figure 6. Water level elevation in Glasford Aquifer wells (feet above mean sea level) ............ 16 Figure 7. Water level elevation in Glasford-Upper Banner Aquifer wells (feet above mean sea level) ......................................................................................................................................... 18 Figure 8. Water Level elevation in Mahomet Aquifer wells (feet above mean sea level) ......... 19 Figure 9. Difference in water levels in the Mahomet Aquifer between 1994 (Wilson et al., 1998) and 2010-2011 (this study) ....................................................................... 20 Figure 10. Depth of water above the pump in Glasford-Upper Banner Aquifer wells (feet) ..... 21 Figure 11. Depth of water above the pump in Mahomet Aquifer wells (feet)............................ 22 Figure 12. Depth of water above well bottom in Glasford-Upper Banner Aquifer wells (feet) 23 Figure 13. Depth of water above well bottom in Mahomet Aquifer wells (feet) ....................... 24 Figure 14. Depth to the top of the Mahomet Aquifer from land surface (feet), as represented by the groundwater flow model described by Wilson et al. (1998) ............................................ 26
LIST OF TABLES
Page Table 1. Well Classification Based on Inventory Outcome (1706 total) ................................. 7 Table 2. Aquifer Assignments for Wells Having Depth Information ..................................... 17


1
A Water Well Inventory to Assess Potential Conflicts from Development of a Well Field in selected areas of McLean, Tazewell, and Woodford Counties, IL
Abstract An inventory of existing private wells was conducted in a nine-township area in McLean, Tazewell, and Woodford Counties. In all, 1706 wells were identified, 788 of which had not been documented previously in the ISWS private well database. The goal of the project was to identify all existing wells and to collect water level and pump setting information for each well. A database of this information was developed and an evaluation of the potential for private wells to be affected by additional drawdown from possible future groundwater withdrawals was conducted. This potential was evaluated based on mapping the water depth above the pump and water depth above the well bottom to indicate the potential risk of well interference. Introduction
As a major water resource for east-central Illinois, the Mahomet Aquifer has been the subject of intensive study by the Illinois State Water Survey (ISWS) for decades. Numerous geologic and hydrologic studies have been completed within the study area to evaluate the size and extent of the aquifer and the groundwater chemistry and determine the long-term viability of the aquifer. McLean-Tazewell Aquifer Assessment (Wilson et al., 1998)
In 1993, a consortium of stakeholders in McLean and Tazewell Counties, the Long Range Water Plan Steering Committee (LRWPSC), provided funding to the ISWS and the Illinois State Geological Survey (ISGS) to evaluate groundwater availability in southwestern McLean and southeastern Tazewell Counties (Figure 1). The goal of the study was to determine whether the aquifer could support a regional water supply under consideration.
The completed project work included detailed geologic mapping, collection of water level data, installation of monitoring wells, and analysis of water quality. Three significant sand and gravel aquifers were identified and described. The deepest aquifer, the Mahomet Aquifer, generally rests on the bedrock surface at the base of the unconsolidated material. The Mahomet Aquifer is considered to be pre-Illinoisan, meaning that the aquifer was deposited prior to the Illinois Episode glaciation. Together, the pre-Illinoisan deposits that include the Mahomet Aquifer make up the Banner Formation in the study area.
Shallower aquifers were deposited later and on top of the Banner Formation. The shallower aquifers are generally separated from one another by clay deposits. Though they are thinner and less extensive than the Mahomet Aquifer, these shallower aquifers are supply many private wells and several community wells. The middle aquifer was determined to be a combination of discontinuous Upper Banner Formation sands and some of the initial deposits during the Illinoisan glaciation that make up the Glasford Formation. For study purposes, this aquifer was called the Glasford-Upper Banner (GUB) in Wilson et al. (1998). The shallowest of the three studied aquifers consists of the major sand and gravel deposits from the Glasford Formation, designated the Glasford Aquifer. Some highly discontinuous surficial sand and gravel deposits occur in the bottomlands of present-day rivers in the study area, but these were not mapped as part of the final study.

2
Wilson et al. (1998) constructed a digital groundwater flow model of the three aquifers based on available geologic mapping, water level data, and groundwater chemistry data gathered during the study. They used the model to evaluate the effects of pumping on the groundwater system. Four well field locations (near Armington, Emden, Hopedale, and Mackinaw) were simulated to examine the ability of the Mahomet Aquifer to provide a continuous supply of 15 million gallons per day (mgd). The model results suggest that while the aquifer is capable of providing the desired 15 mgd from any of the four well field locations, the water level drawdown and resulting impacts on existing wells vary considerably depending on well field location (Wilson et al., 1998). Efforts Since Wilson et al. (1998)
The LRWPSC provided funding to the ISWS to collect water level data from and maintain the network of observation wells drilled in the 1990s. The funding has enabled the ISWS to obtain water level measurements from these wells since the late 1990s, providing documentation of the response of water levels to climate variability and changes in pumping. In addition, the LRWPSC funded the installation and logging of an additional well in an area of poorly understood geology that provided additional insight into the size and extent of the aquifers in that area. The most recent letter report sent to the LRWPSC, which includes observation well measurements through 2011, is included as Appendix A.
Modeling of the Mahomet Aquifer has also been ongoing. Roadcap et al. (2011) described flow in the 15-county Mahomet Aquifer region and predicted the potential impacts out to 2050 of current and future water demands on the Mahomet Aquifer, based on changes in water use and predicted groundwater development.
Since the 1988 drought in central Illinois, area stakeholders have considered the consequences of developing a regional water supply, in part to serve the needs of the Bloomington and Normal water systems. Some advocate that the water authorities in the area build and operate a regional water supply themselves, and then sell water to Bloomington and/or Normal. Many residents in the area have expressed concern that the impacts to existing private wells from a large regional water supply are poorly understood. The number of private wells impacted and the degree to which those wells are impacted depend upon their proximity to the well field and construction characteristics (i.e., well depth and pump setting). Wilson et al. (1998) discussed the importance of improving the understanding of these factors in predicting pumping impacts. “A detailed inventory of the existing wells in the vicinity of these selected sites should be conducted to assess the potential conflicts that might occur from pumping a well field at each selected location.” (page 104) This Project
Three area water authorities, the Mackinaw Valley Water Authority, the Danvers Township Water Authority, and the Allin Township Water Authority, out of concern for protecting private well owners in the region, provided funding to the ISWS to inventory private wells in the area proposed for a regional water supply. This report summarizes the work completed for that project, describes the conclusions of the authors, discusses the improvements in understanding gained from the work, and recommends steps for the water authorities as they move forward in considering future regional water supply development.

3
Figure 1. The McLean-Tazewell Aquifer assessment study area (from Wilson et al., 1998)

4
Study Objective The principal goal of this project was to map the existing rural private wells in a nine-township area of southwestern McLean, eastern Tazewell, and southern Woodford Counties (Figure 1) and to construct a database to contain the geographic coordinates, depths, pump settings, and water levels for each well mapped.
Residents of the study area have expressed concern that drawdown caused by proposed large groundwater withdrawals in the area would jeopardize their water wells. The purpose of the mapping and database construction carried out for this study was to provide a complete record of the wells prior to any new high capacity withdrawals so that well interference effects can be evaluated by comparing the documented water levels from prior to development. Improved mapping of existing wells also permits more comprehensive modeling and other predictive analysis of the impacts of proposed withdrawals, examples of which are included in this report. Study Description and Tasks Study Area The study area (Figure 1) is located west of Bloomington, IL and includes the following communities: Minier, McLean, Stanford, Mackinaw, Goodfield, Deer Creek, Armington, and Danvers. The boundary includes regions of the Mahomet Aquifer that were identified by Wilson et al. (1998) as most capable of sustaining a high capacity well field where the Mahomet Aquifer is very thick. Figure 2 is a thickness map of the Mahomet Aquifer with the study area outlined by a thick black line. Modeling completed by Wilson et al. (1998) suggests that drawdown from high capacity wells may extend outside the study area, but drawdown in these areas is expected to be less than 10 feet. Minimal well impacts would accompany this drawdown. Existing Data
The ISWS maintains a repository of private water well and community water well records in Illinois. In the 1960s, Illinois began requiring permits for water wells, and since that time, drillers have been required to file a well completion report with their county health department. The county health departments then forward copies of those reports to the ISWS. The paper record is stored and the information on the reports is entered into a database. The ISWS file room contains records of more than 400,000 well completion reports, geologic logs, and reports of water sample analyses. Drillers didn’t always follow this requirement, however, and it took time for the county health departments to develop their private well programs. As a result, records on file at the ISWS do not represent all of the wells present in Illinois.
All records of wells located in the ISWS database from the study area were copied and put into binders for field staff to use. A well inventory form was developed to accompany each well record so that field personnel could document the current well owner, approximate elevation, revised construction characteristics (i.e., updated pump setting), and measured water level. The inventory form included space for field staff to draw a site map showing the location of the well on the property. The forms were placed in binders, sorted by township.

5
Figure 2. Thickness of the Mahomet Aquifer (from Wilson et al., 1998)

6
Many wells in rural areas are more than 50 years old, and are not documented because they predate the requirement to file a well completion report. Additional well inventory forms were included in each binder so that these wells could be recorded in the project database and later added to the ISWS well records.
U.S. Geological Survey (USGS) quadrangle maps were used by field staff to estimate land surface elevation at each well. These maps also sometimes show the locations of older homesteads that have been torn down. Such information is helpful when a well record indicates a well at a location where there is presently no structure. Soliciting Well Owner Support Before beginning fieldwork, a public media campaign was implemented to inform well owners that ISWS staff would be in the area and to ask for their help. This campaign was particularly necessary because many local well owners view development of the Mahomet Aquifer for Bloomington or Normal as a threat to their water supply. Contributing to this distrustful mindset was the fact that the ISWS had earlier conducted the McLean-Tazewell Aquifer Assessment (Wilson et al., 1998) to determine the availability of water for future development. The media campaign sought to show well owners and local officials that this project, like the original study, was being conducted by the ISWS as a neutral party to provide unbiased scientific results for local decision makers. Postcards were sent to rural residents in the study area, introducing the ISWS, describing the upcoming study, providing contact information, and announcing a public meeting for well owners to ask questions about the project. A press release was sent to local media outlets describing the study and announcing the public meeting, and announcements were posted in local high-traffic areas, such as banks, grocery stores, post offices, and restaurants. About 40 people attended the public meeting in Minier in May 2010. ISWS staff described the study, introduced field staff, and answered questions. ISWS staff explained to well owners the advantages of allowing water level measurements and assured the attendees that funding for the project was provided by the local water authorities. Well Inventory The ISWS hired four geology students as field staff to conduct the field portion of the well inventory. One was a recent graduate of the Illinois State University (ISU) geology program; the other three were still students in that program. For the first few days of the well inventory, ISWS staff assisted the new field staff to build confidence and prepare them to conduct the inventory independently. They worked in pairs for two weeks, and then each was assigned a portion of the study area in which to work. The field staff spent the summer 2010 inventorying wells, which consisted of interviewing a well owner, taking a water level measurement of their well, and completing the well inventory form. A completed well inventory form is included as Appendix B. Because they were unable to complete the inventory before the start of the ISU fall semester in August 2010, one field staff member that had already graduated was retained to continue the inventory through March 2011 when it was completed.

7
Creating A Final Project Database The remaining field staff member entered the data from the inventory forms into a database of all potential well locations in the study area. This included records from the ISWS database as well as those wells not in the ISWS database that were discovered during the field inventory. The database was then evaluated to determine the information that was available and information that was still missing for each well. The most serious issue was the lack of records for many of the wells inventoried. ISWS staff found 788 wells in the study area that were not on file at the ISWS, which is almost half of the 1706 wells inventoried during the study. This finding underscores the importance of the well inventory, which will allow for a more comprehensive and accurate analysis of impacts should a high capacity well field be developed in the area. Cooperation and Well Access Issues The authors assumed some well owners would not cooperate with ISWS staff and others might not know enough about their well to provide relevant information. Though the field staff did encounter some situations of that nature, they were far fewer than expected. Some well owners were willing to share information, but did not allow their well to be opened for water level measurement. Additional well access issues were encountered. Well inventory outcomes were classified into nine groups (Table 1), based on the success of locating a well, gathering information about the well, and obtaining the well owner’s cooperation. Table 1. Well Classification Based on Inventory Outcome (1706 total) Classification
Number of wells
Description
1 540 Given permission and well measured 2 132 Well in pit, could not measure 3 103 Given permission, but couldn’t obtain measurement 4 187 Cooperative well owner, but did not want us to open
well 5 94 Uncooperative well owner 6 10 Irrigation well, not measured 7 24 Working head pump, could not measure 8 49 Could not find well, no buildings, or no house but out
buildings, no contact with owner 9 567 Could not make contact with well owner after multiple
tries, or no one lives at residence, no contact with owner
Total 1706

8
Missing Data Pump settings proved to be the most difficult information to gather. Many well owners are not aware of the depth of their pump. With older wells, in fact, pump setting data may be completely lost because the name of the original driller may be unknown. Attempts by ISWS to gather pump setting information from local contractors were fruitless. Most of the drillers and pump contractors named by well owners are no longer active, and those who were either did not respond to ISWS’ requests for information or had little useful information. Well Locations While conducting the inventory, field staff used USGS topographic maps to assist in determining well locations. Wells in the ISWS database already had a legal description, and those found during the inventory without a legal description were given one and were added on the inventory form in the field. Using GIS, legal descriptions for each well were converted to coordinates for mapping purposes. The ISWS and the ISGS have in-house computer programs for calculating these coordinates. In some cases, coordinates were determined using Google Earth by inputting the address of the well and using the hand-drawn map of the well location on the property to increase accuracy of the point. Assigning Wells To Aquifers After the available information was added to the database, wells were assigned to a source aquifer. Depth information was available only for 1200 of the 1706 wells in the database. Those with depth information were separated into a computer file for input into the Mahomet Aquifer groundwater flow model (Roadcap, et al., 2011) developed at the ISWS for the purpose of assigning each well to one of the three aquifer units described in Wilson et al. (1998). The land surface elevation and well depth together provided a well bottom elevation. The authors were able to use well bottom elevations along with location to determine the likely aquifer in which each well obtained its source. Computer modeling of groundwater flow in a complex hydrogeologic system like the project study area requires simplification of the actual hydrogeology as continuous layers of geologic units that are, in reality, discontinuous in places. Figure 3 shows how the complex geology of the area was simplified for the Mahomet Aquifer groundwater flow model. The actual sequence of geologic deposits is shown in Figure 3a and includes discontinuous aquifers and confining units of highly variable thickness, as well as several soil zones. Scientists evaluate the geology to separate it into the major units of deposition that occurred over time to develop a geologic model of the system (Figure 3b). Groundwater modelers use the geologic model as the basis for the necessary simplifications required to accurately and efficiently simulate groundwater flow (Figure 3c). In this way, the groundwater flow model can simulate reality and conserve the essential elements of the system, but be simplified enough that a computer can provide the answers being sought.
The simplifications required to develop the Mahomet Aquifer groundwater flow model (Roadcap, et al., 2011) were problematic when the model was used as a basis for assigning wells to the three aquifers. In some cases, an aquifer layer in the model may represent several thin or discontinuous sand units that have been combined into a single aquifer. This simplification required that the actual vertical position of the individual units

9
be shifted upward or downward. Comparison of actual well bottom elevations with aquifer elevations from the Mahomet Aquifer groundwater flow model sometimes indicated that the well was not open to an aquifer. In these cases, additional interpretation was required to ensure the best possible assignment of the well. Geologic logs from wells drilled since the mid-1990s were not available when the Mahomet Aquifer model was developed. In several cases, these newer well logs indicated a discrepancy exists between the information on the logs and the mapped geology used for the model. Mapping Water Levels After each well was assigned to an aquifer, the 540 water level measurements obtained during the inventory, along with 42 observation well measurements obtained in August 2010, were mapped. Measurements from wells open to the Mahomet Aquifer and the Glasford-Upper Banner Aquifer were contoured to create potentiometric surface maps of the aquifers. Measurements from wells open to the Glasford Aquifer were mapped as points and were not contoured, since fewer than 50 measurements were available. A contoured map based on so few measurements would be of questionable validity, particularly for a highly discontinuous unit such as the Glasford Aquifer (Figure 4). The water level mapping process provided an opportunity to identify and correct errors in the aquifer assignments. The observation well network data (Appendix A) indicate that water levels have not changed much since 1994. This allowed the authors to screen the data for outliers and information that didn’t conform with the known data. Differences would likely be attributable to the addition of new information where it might not have been available before. It also could have been a data error, such as assignment of a water level measurement to the wrong aquifer unit, an erroneous water level measurement, an incorrect land surface elevation estimate, or an incorrectly located well. Mapping Pump Settings Pump depth information was difficult to obtain. Well owner knowledge, well log information, and driller interviews were used to obtain these data. Pump settings vary with land surface characteristics, and even driller preference, meaning there was no consistent approach involved in placing the pump in each well. Where possible, the pump elevation was subtracted from the water level elevation to calculate the depth of water over the pump, a highly relevant measure of risk posed by well interference. As discussed, however, both the pump setting and a measured water level were available for only a subset of the inventoried wells, so the depth of water above the pump was not computed in all instances. Where pump setting data were available but measured water levels were not, the depth of water above the pump was calculated by subtracting the pump elevation from the water level elevation estimated by potentiometric surface mapping for the source aquifer. A water level map was not created for the Glasford Aquifer. In this case, data were used only if both pump setting and water level data were known at the well.

10
Figure 3. Model simplification of the geology in the study area: (a) sequence of geologic materials in the study area; (b) simplification used in the hydrogeologic interpretation; (c) simplification used in the Mahomet Aquifer groundwater flow model

11
Figure 4. Thickness of the Glasford Aquifer (from Wilson et al., 1998)

12
Depth of Water In A Well When evaluating the potential for well interference, it is useful to know the total feet of water in each well. These values were calculated from the well depth and water level. Well depth can vary greatly at a location. If an aquifer is 60 feet thick, for instance, a well could be finished in the upper 10 feet of the aquifer if there is sufficient water for a supply, or it could be finished in the lower 10 feet of the aquifer. Though the water levels would be at the same elevation, there would be 50 feet more water in the well finished at the bottom of the aquifer. When evaluating the depth of water in a well, those potential differences in well construction cannot be spatially correlated and mapping must be completed as discrete points. Results Well Inventory The well inventory was successful, principally in the sense that it identified 788 wells that had not been previously recorded. Records of these wells have been added to the ISWS private well database, providing a more accurate representation of the wells in the study area. Fewer than 100 well owners were uncooperative, a surprising number given the vocal opposition to additional development of the groundwater resources and the perception that the ISWS had been working on behalf of those potential developers. The well inventory wasn’t without problems. On two occasions a well contractor had to be hired to remove measuring tapes that had become stuck in a well and to ensure the well was operating properly following removal of the tape. A number of the water level measurements were determined by the authors to be incorrect, probably due to condensation on the inside of the well, obscuring the actual water level. The well inventory took much longer than planned, since there were nearly twice as many wells as expected in the study area. Well inventory outcomes (Table 1) fell into three categories. Class 1 included wells that were verified and a water level was measured in the well. Field staff verified the presence of wells at locations assigned to Classes 2-7, but a water level was not measured in these wells for various reasons. The existence of wells at locations assigned to Classes 8 and 9 could not be verified, although records indicate a well was present or a residence suggests a well is present, but contact with the owner was never successful.
Field staff were unable or not permitted to measure water levels in wells at locations assigned to Classes 2-7. Out of concern for safety, staff were not permitted by the ISWS to enter any pit to measure a water level (Class 2). In some cases, staff were unable to measure a water level despite repeated attempts (Class 3), typically due to the presence of an unseen obstruction or of condensation inside the well, which wets the inserted measuring tape and obscures the portion of the tape that is wetted by penetrating the water column and which therefore indicates the water level in the well. In other cases, staff did not measure water levels at the request of well owners who preferred that a well not be opened (Class 4). Sometimes, as mentioned previously, well owners were not cooperative with field staff and did not share information, let alone permit measurement of a water level (Class 5). Lastly, water level measurements were not attempted in irrigation wells (Class 6) and wells with working head pumps (Class 7), which do not provide access for such measurements.

13
Wells at locations assigned to Class 8 are documented by records on file at the ISWS, but field visits to these sites established that buildings were absent or that existing structures did not include a home or other structure requiring a water supply. Since the records of wells at these locations are often dated, the authors conclude that some or all of the buildings at these locations were probably demolished, and any wells were filled or abandoned in a manner making them unavailable for water level measurement. Class 9 includes 567 locations, typically residences at which a well is almost certainly present, where repeated efforts to contact well owners were unsuccessful. Field staff visited these residences multiple times, including evenings, and multiple notices were left on the door asking for participation. Significant effort was made to ensure that area residents knew of the study.
Although verification of well presence and water level measurement was not possible at locations assigned to Classes 5 and 9, the wells at these locations that are documented by records on file at the ISWS are usually employed in the mapping products included in this study. This is possible because these records generally include well depth and/or pump setting depth, data employed in combination with estimated water levels to calculate the depth of water above the pump and above the well bottom. Database
The database constructed for this study contains entries for 1706 well locations, including 788 locations not represented by records in the ISWS files. It includes 1200 well depths, determined from well owner interviews and well records, and 540 water levels measured by ISWS field staff.
In many cases, entries for the locations of the 788 previously unknown wells (Figure 5) include few construction details, because all such data were obtained from current well owners who in some cases knew very little about their wells. To determine the source aquifer of these wells, the authors sometimes had no alternative but to compare the measured water level with water levels in wells from a known source aquifer, then assume that a close correlation in water levels signified the same source aquifer. Assigning Wells to Aquifers Twelve hundred of the inventoried wells had depth information that could be used to assign wells to an aquifer layer. These wells were assigned to the layers from the ISWS Mahomet Aquifer groundwater flow model (Wilson et al., 1998; Roadcap et al., 2011), and the assignment process assumed that all wells were finished in one of the aquifer units (Table 2).
The assignment process was iterative. The initial assignment was based entirely on a well-by-well assessment of available well log depth and location, plotted in the Mahomet Aquifer groundwater flow model. Because of simplification of the geologic layers in the model, as discussed previously, some wells were mapped as being in the non-aquifer layers of the model. A second evaluation followed, which assumed that every well had to be assigned to an aquifer. Well bottom elevation was evaluated against the proximity to a model aquifer layer, and those wells not initially assigned to an aquifer were reassigned to an aquifer layer. A final assignment was based on analysis of measured water levels, assuming that water levels in the separate aquifers differ significantly. On this basis, the

14
authors revised the secondary assignments such that water levels in wells in the same aquifer were similar. Twenty-six wells were removed from the final list. The data suggested that these wells were finished in minor sand and gravel layers not represented in the Mahomet Aquifer model.
Water Level Mapping As mentioned previously, water levels from wells open to the Glasford Aquifer were not contoured to construct a potentiometric surface map but are depicted as point data (Figure 6). Comparatively few water levels (47) were measured in Glasford Aquifer wells, too few on which to base a valid potentiometric surface for the study area. Moreover, the aquifer is highly discontinuous, and the separate deposits of sand and gravel assigned to the Glasford Aquifer likely respond to local pumping stress and recharge conditions with no response to pumping and recharge affecting the others. Contouring the water levels measured in wells open to the scattered deposits assigned to the Glasford Aquifer would yield a surface of questionable validity.
The potentiometric surface map of the Glasford-Upper Banner Aquifer (Figure 7) is based on measurements from 120 wells, including measurements from 111 inventoried wells and nine observation wells of the McLean-Tazewell network. Measurements from eight inventoried wells open to the Glasford-Upper Banner were rejected as erroneous.
Measurements from 333 wells, including 300 inventoried wells and 33 observation wells from the McLean-Tazewell network, were employed to construct the potentiometric surface map of the Mahomet Aquifer (Figure 8). Thirty-one measurements from inventoried wells open to the Mahomet Aquifer were rejected as erroneous.
Comparison with Past Water Levels In most of the study area, water levels in wells open to the Mahomet Aquifer have changed less than 10 feet since 1994 (Wilson et al., 1998) (Figure 9), corroborating observation well data that also suggest comparatively minimal changes in water levels (Appendix A). Potential for Well Interference Impacts A goal of this study was to identify where well interference problems could occur. Depth of water over the pump and depth of water in the well can be used as indicators of the relative risk of interference from a high capacity well. The depth of water above the pump is equal to the amount of drawdown a well can incur during pumping without the pump breaking suction. In the 54 wells open to the Glasford-Upper Banner Aquifer for which this calculation was possible (Figure 10), the depth of water above the pump ranged from 2.4 to 63.2 feet, with a median value of 22.0 feet and an average value of 25.5 feet. Computation of depth of water above the pump was possible for 164 wells open to the Mahomet Aquifer (Figure 11), and values ranged from 3.4 to 107.7 feet, with a median of 43.5 feet and an average of 47.3 feet in these wells.
15
Figure 5. Locations of the 788 unrecorded wells

16
Figure 6. Water level elevation in Glasford Aquifer wells (feet above mean sea level)

17
Table 2. Aquifer Assignments for Wells Having Depth Information
Layer Geologic Unit (Wilson et al., 1998)
Initial Assignment
After Geologic Evaluation
Final Assignment
1 Surficial sand and gravel 6 41 41 2 Clay and/or diamicton 94 0 0 3 Glasford Aquifer 34 168 168 4 Clay and/or diamicton 126 0 0 5 Glasford-Upper Banner Aquifer 101 248 240 6 Clay and/or diamicton 188 0 0 7 Mahomet Aquifer 539 743 725 8 Bedrock 112 0 0
If all other factors affecting drawdown have equal effects, a lower depth of water above the pump signifies an elevated risk that the pump will break suction as a consequence of interference drawdown. As long as water remains in the well, however, affected wells can often be remediated by lowering the pump within them. Of the 54 Glasford-Upper Banner wells shown in Figure 10, the pump is overlain by less than 10 feet of water in 11 wells, about 20 percent. These wells are scattered across the study area. The lack of any apparent geographic trend probably reflects the variety of factors affecting the depth of water above the pump, which include head, aquifer depth, aquifer geometry, driller preference, and preference of the owner at the time of well construction. The 164 Mahomet Aquifer wells shown in Figure 11 include four wells in which the depth to water above the pump is less than 10 feet. The distribution of these wells generally reflects the distribution of the entire population of 164 Mahomet Aquifer wells, corroborating the hypothesis that the depth to water above the pump reflects factors unrelated to hydrogeology (such as driller and owner preferences).
If drawdown exceeds the depth of water above the well bottom, the entire well is dry, and there is no simple solution. Affected wells are commonly replaced with deeper wells. Of the 90 Glasford-Upper Banner wells for which it was calculable, the depth of water above well bottoms ranged from 7.5 to 114.8 feet, with a median of 43.0 feet and an average of 45.1 feet (Figure 12). The depth of water above well bottoms in wells open to the Mahomet Aquifer ranged from 31.5 to 215.6 feet, with a median of 75.2 feet and an average of 89.2 feet (Figure 13). Data from 257 wells were available for the Mahomet Aquifer depth of water calculations.

18
Figure 7. Water level elevation in Glasford-Upper Banner Aquifer wells (feet above mean sea level)

19
Figure 8. Water Level elevation in Mahomet Aquifer wells (feet above mean sea level)

20
Figure 9. Difference in water levels in the Mahomet Aquifer between 1994 (Wilson et al., 1998) and 2010–2011 (this study)

21
Figure 10. Depth of water above the pump in Glasford-Upper Banner Aquifer wells (feet)

22
Figure 11. Depth of water above the pump in Mahomet Aquifer wells (feet)

23
Figure 12. Depth of water above well bottom in Glasford-Upper Banner Aquifer wells (feet)

24
Figure 13. Depth of water above well bottom in Mahomet Aquifer wells (feet)

25
Discussion/Recommendations Well Inventory The principal accomplishment of this project was the documentation of 788 previously unrecorded wells in the study area. Of the 1706 locations included in Table 1, 788 wells were discovered by ISWS staff at sites not documented previously as well locations. This approximately doubles the number of recorded well locations in the area and allows a significantly more comprehensive assessment of potential interference impacts than was previously possible. Documentation of these wells—and in many cases of their depth, pump setting, and water level—establishes a basis for documenting interference impacts and for justifying remedial measures in the event that future large groundwater withdrawals will be initiated in the area. The owners of these wells may contact the ISWS, which supports private well owners, with questions or concerns pertaining to their wells or groundwater conditions in the area.
Although the authors contacted local drillers for information on well depth and pump settings, none responded, and as a consequence, the database of well locations, though significantly expanded through the addition of the previously undocumented wells—and the analysis of the potential for well interference impacts that is based upon it—are not complete. The drillers may not have responded to ISWS inquiries due to busy schedules, reluctance to share information on local hydrogeology and wells with nonpaying parties, mistrust of arguments that the project would benefit the area, or other factors. Future investigations of existing wells in the area should work more aggressively to educate and gain the trust of local drillers, perhaps utilizing local stakeholders and well owners with personal or business relationships to the drillers to help justify the project and encourage collaboration with investigators.
Although many well owners were cooperative and helpful, about one-third of the potential well locations categorized in Table 1 fall into Classes 5 and 9, which include those occupied by uncooperative well owners and those in which repeated efforts at contact by ISWS field staff failed. Such outcomes might be reduced in future studies of existing wells by incorporating a strengthened educational component designed to show local well owners the benefit of participating and sharing information with investigators. Mahomet Aquifer Groundwater Flow Model The assignment to source aquifers of wells drilled after development of the ISWS Mahomet Aquifer groundwater flow model (Wilson et al., 1998), carried out by comparing well depth and log information with aquifer elevations included in the model, illustrate the importance of periodically updating such models as new data become available. The aquifers documented by these new wells do not universally correspond in elevation to those in the groundwater flow model, and this lack of correspondence, while in part an outgrowth of the simplifications required for developing the model, also reflects the scarcity of hydrogeologic information in some areas, and at some depths, prior to drilling the new wells. The Mahomet Aquifer model, like all groundwater flow models, is a work in progress that will provide increasingly accurate simulations as new data are added, to the benefit of all well owners and stakeholders in the area. The incorporation into the model of hydrogeologic information from new wells will principally affect the representation of the

26
Figure 14. Depth to the top of the Mahomet Aquifer from land surface (feet), as represented by the groundwater flow model described by Wilson et al., (1998)

27
thickness and bottom elevation of the Mahomet Aquifer, but the top elevation (Figure 14) will remain relatively unchanged. Well Construction Practices Well completion reports, together with information obtained from owner interviews, indicate that, since the mid-1990s, drillers have increasingly constructed wells that nearly fully penetrate the Mahomet Aquifer. Prior to this, wells were typically drilled into the upper part of the aquifer, taking advantage of the artesian head of the Mahomet Aquifer.
As mentioned in the preceding section, logs of the deeper wells will permit more accurate representation of the thickness and bottom configuration of the Mahomet Aquifer in the ISWS groundwater flow model. The present flow model (Roadcap, et al., 2011), based to a larger degree on logs of wells that penetrate only the top of the Mahomet Aquifer, employs an interpretation of the aquifer geometry that errs conservatively on the side of a thinner and less productive unit.
The practice of drilling wells deeper into the Mahomet Aquifer, and of setting the pump at a deeper level, may reflect the concerns of well owners and of drillers regarding drawdown resulting from proposed high capacity withdrawals in the area. This cause-and-effect relationship was how one driller explained his recent change in well construction practices to ISWS staff. This driller’s present practice, which he initiated when Bloomington-Normal commenced investigating the Mahomet Aquifer as a water supply source in the mid-1990s, is to drill wells to the bottom of the Mahomet Aquifer and set the pump 10 feet above the screen. Previously, he typically drilled wells only far enough into the aquifer to accommodate a well screen (typically 5-10 feet long) and set the pump about 40 feet below the static water level. In wells screened near the base of the Mahomet Aquifer, the depth of water above the pump typically can exceed 120 feet or more, allowing these wells to accommodate significantly more drawdown than wells finished in the upper part of the aquifer. Next Steps A significant amount of effort and funding have been invested in developing a better understanding of the flow and groundwater availability in the Mahomet Aquifer in the area west of Bloomington-Normal. Scientists have a much clearer picture of the dimensions of the aquifer and the flow relationships between aquifers, as well as hydraulic connections with the surface today, as compared to 20 years ago. Data collected for this study have reminded the authors that any new information can potentially change the conceptual understanding of the flow system or the physical size and shape of the aquifers. Collection of new data and further updating of the Mahomet Aquifer groundwater flow model is a necessary part of any long-term strategy that might include further development of the Mahomet Aquifer.
Concerned well owners in the study area would benefit from strengthened education and outreach efforts, which would improve public understanding of groundwater, wells, local hydrogeology, and proposals for high capacity aquifer development. Since the area is underlain by a highly productive aquifer, proposals will continue to be made for high capacity groundwater development in the area, and enhanced education and outreach

28
efforts would facilitate a rational process of decision-making and aquifer management rather than one based on emotion. Acknowledgements The authors thank the private well owners who allowed ISWS staff to interview them and measure water levels in their wells. Nathan Chott, Jessica Ackerman, Tom Spear, and Jonathon Love conducted the fieldwork for this project. Mr. Chott devoted an additional seven months to the project after the others had returned for fall classes at ISU. He spent many hours meeting with well owners on weekends and evenings and assisted in development of the project database. The Tazewell County Health Department provided an intern who spent several weeks assisting Jessica Ackerman in the field. The ISGS provided some of the well location coordinates. This report was reviewed by Tom Holm and Scott Meyer at the ISWS. This project was funded by the Mackinaw Valley, Allin Township, and Danvers Township Water Authorities. References Kempton, J.P., and A.P. Visocky. 1992. Regional Groundwater Resources in Western McLean and Eastern Tazewell Counties. ISWS/ISGS Cooperative Groundwater Report 13. Champaign, IL. Roadcap, G.S., H.V. Knapp, H.A. Wehrmann, and D.R. Larson. 2011. Meeting East-Central Illinois Water Needs to 2050: Potential Impacts on the Mahomet Aquifer and Surface Reservoirs. ISWS Contract Report 2011-08. Illinois State Water Survey, Champaign, IL. Wilson, S.D., G.S. Roadcap, B.L. Herzog, D.R. Larson, and D. Winstanley. 1998. Hydrogeology and Ground-Water Availability in Southwest McLean and Southeast Tazewell Counties. Part 2: Aquifer Modeling and Final Report. ISWS/ISGS Cooperative Ground-Water Report 19. Champaign, IL.

29
Appendix A. 2011 Letter Report to the Long Range Water Plan Steering Committee
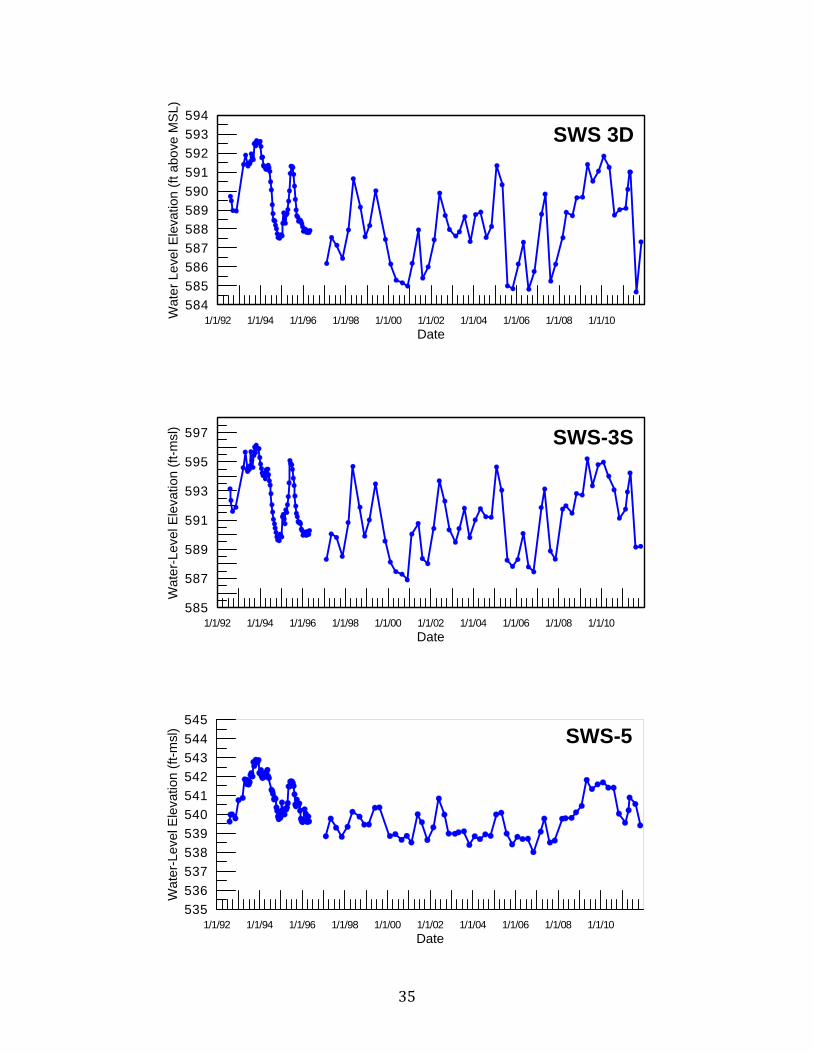
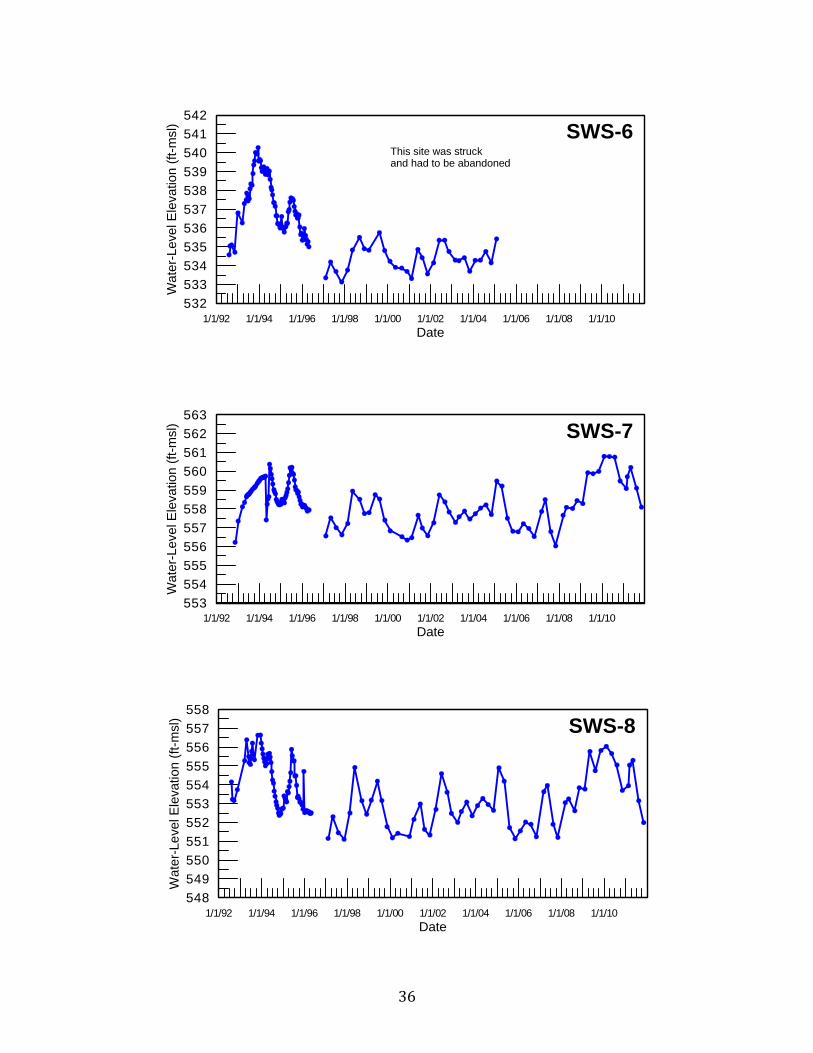
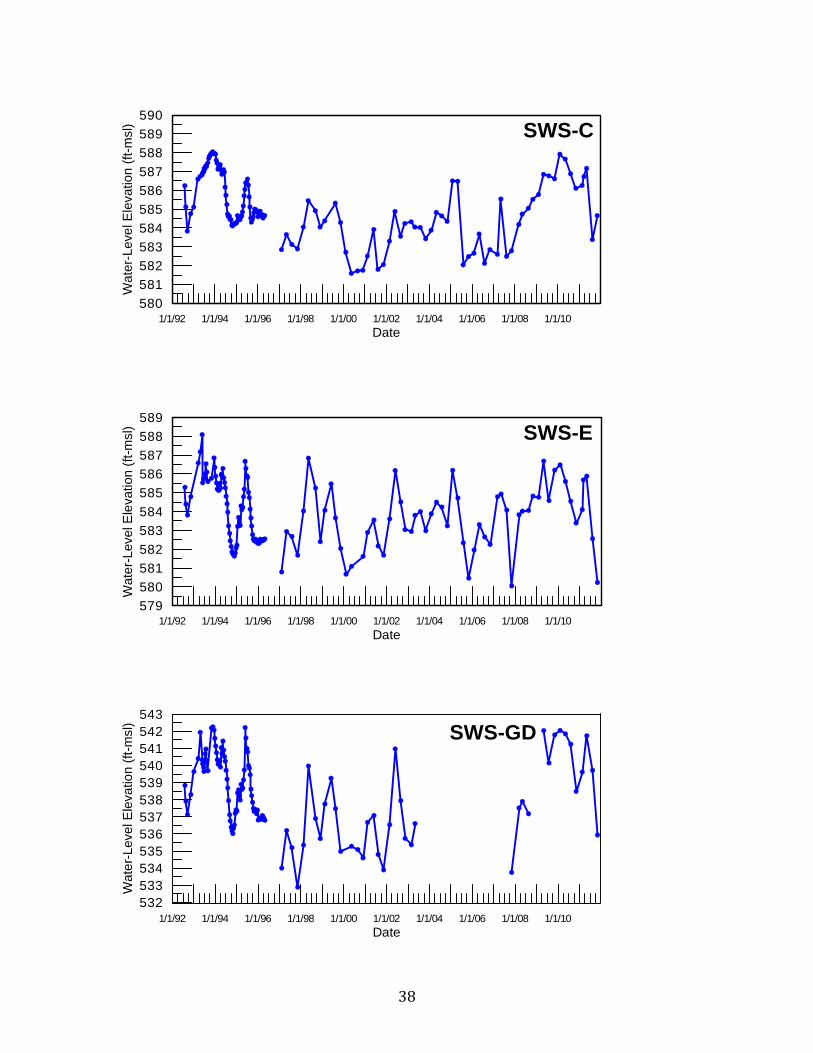
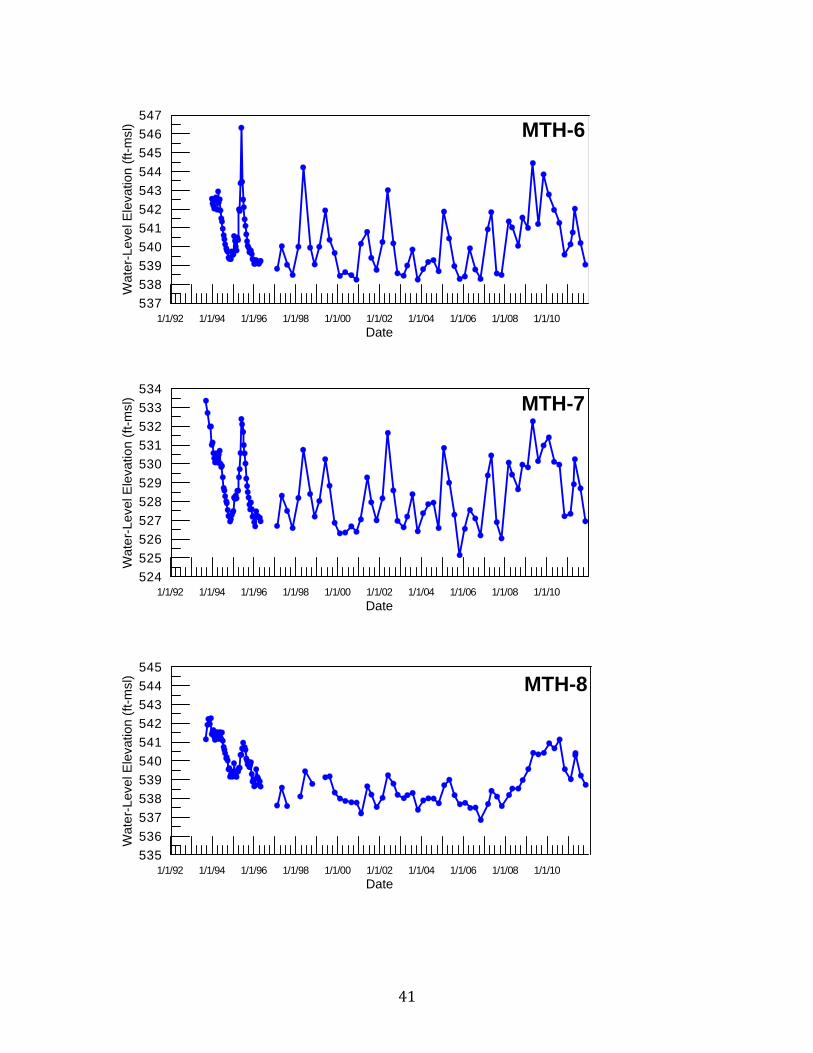
January 31, 2012 Mr. Chris Koos, Chair Long Range Water Plan Steering Committee Town of Normal 100 E. Phoenix Normal, IL 61761 Dear Mayor Koos: Enclosed are the hydrographs of the water levels for the observation wells and river stages measured as part of the monitoring project conducted for the Long Range Water Plan Steering Committee through December 2011. There are a total of 49 measuring points in the network. Three of these are measurements of river stage along the Mackinaw River. The other 46 measurements are groundwater levels in observation wells. The wells fit into two categories, with either an SWS or an MTH designation. The river measurements are denoted by RVR. The SWS wells were installed in 1992 as part of a regional assessment of the Sankoty-Mahomet Aquifer by the Illinois State Water Survey (ISWS). The project was funded by the Department of Energy and Natural Resources and the Illinois Department of Transportation's Division of Water Resources. Except for MTH-26 and MTH-27, the MTH wells were installed in 1993 as part of the comprehensive aquifer assessment funded by the Long Range Water Plan Steering Committee. MTH-26 was installed in 1994 as an aquifer test observation well and MTH-27 was installed in 1997 to verify the mapped geology in a particularly complicated region of the aquifer. In accordance with our agreement, measurements were taken four times during 2011: February 19, May 7, August 13, and November 5. In addition, the areas surrounding the wells were mowed twice during the summer to keep the sites presentable, and all wells were developed with an air compressor to ensure the screens were open to the aquifer. During 2004, SWS-Gd was struck. The well, along with another well within the well nest, was thought to be non-repairable. After a site visit by ISWS personnel during 2009, it was discovered that SWS-Gd and SWS-Gs were both reparable. SWS-Gd and SWS-Gs were repaired and developed during the summer 2009. This also happened at wells MTH-11d and MTH-17s. MTH-05 was struck during the fall 2009 and again in summer 2011. MTH-05 was repaired and re-developed a short time after each incident. SWS-6, MTH-04, MTH-14, and MTH-25 had previously been abandoned. MTH-25, near Mackinaw’s Well #6, was removed at the request of the Farnsworth Group and the Village of Mackinaw to make room for the water facilities expansion at Mackinaw.

30

31
Table 1 contains the updated precipitation data for 2011, along with all of the historical precipitation data since the wells were installed. The 2011 precipitation data were compared against a new 30-year (1981-2010) average. Given that no individual year has followed the month-to-month 30-year averages that closely, 2011 is one of the drier years we have seen. The three Mackinaw River hydrographs are numbered to correspond to the MTH wells that are closest to them. So, RVR-3, which is at Mackinaw, IL, is close to MTH-3. Comparing water level elevations to river stage, MTH-3 is at 526 mean sea level (msl), while RVR-3 is at 576 msl, a 50-foot difference. But at the other two locations, MTH-6 and MTH-7, the differences in river stage are only 7 feet and 2 feet, respectively. These data clearly indicate that the Mackinaw River is not connected to the aquifer at Mackinaw, but also suggest that it likely is connected near MTH-6 and MTH-7. A pressure transducer was installed at MTH-08 in August 2005. The data from that data logger for 2011, shown below, gives you an appreciation for the level of detailed information that using a pressure transducer can provide. The pressure transducer was installed in MTH-08 because of its close proximity to an irrigation pivot. It would appear that irrigation did not impact the aquifer significantly during 2011. Drawdown data are helpful for developing a conceptual model of the aquifer as well as for evaluating the effects of high capacity wells on the aquifer. The data collected for this report have been invaluable for staff of the ISWS when modeling the Mahomet Aquifer.
1/1/11 2/1/11 3/1/11 4/1/11 5/1/11 6/1/11 7/1/11 8/1/11 9/1/11 10/1/11 11/1/11 12/1/11 1/1/12Date
536
537
538
539
540
541
542
543
Wat
er-L
evel
Ele
vatio
n ( f
t-m
sl)
Observed Groundwater ElevationLogger Data MTH-08

32
Table 1. Monthly precipitation summaries for Lincoln, IL
Jan Feb Mar Apr May Jun Jul Aug Sep Oct Nov Dec Annual
30 Yr Ave (1971-2000)
1.70 1.55 3.11 3.63 4.42 3.97 4.35 4.00 3.13 2.81 3.00 2.63 38.30
30 Yr Ave (1981-2010)
1.93 1.82 2.60 3.61 4.16 4.32 5.06 3.92 3.21 3.08 3.25 2.64 39.60
1993 +/- 2.94 0.31 -0.13 1.61 -2.85 3.49 3.10 0.81 3.08 0.88 0.72 -1.65 12.31 1994 +/- -0.48 -0.59 -1.86 2.78 -1.24 0.35 -1.12 -0.50 -1.28 -0.76 2.06 -0.60 -3.24 1995 +/- 1.94 -0.95 -0.02 0.19 8.49 -0.57 -2.11 0.25 -2.59 1.55 -1.19 -1.94 3.05 1996 +/- -0.46 -0.94 -1.48 -1.18 1.71 -1.17 0.82 -0.99 -1.74 -0.75 0.35 -2.21 -8.04 1997 +/- 0.06 1.53 0.03 -2.29 -1.11 -0.45 -2.77 1.66 1.14 -0.96 0.26 -1.25 -4.15 1998 +/- 0.79 0.94 1.14 4.88 0.12 4.44 -0.98 2.04 -2.20 1.91 -0.69 -1.15 11.24 1999 +/- -0.11 0.75 -2.05 1.99 0.25 1.28 -0.56 2.64 -1.44 -0.80 -2.28 -0.23 -0.56 2000 +/- -0.88 -0.20 -0.96 0.15 -1.24 1.83 0.01 0.11 -0.56 -0.60 1.29 -1.46 -2.51 2001 +/- 0.71 1.88 -1.79 -1.44 -1.29 -0.93 -1.23 0.63 -1.42 3.18 -0.56 -1.12 -3.36 2002 +/- 0.79 0.68 -1.25 1.36 0.77 -1.58 3.44 4.58 -1.61 -0.58 -2.32 -1.01 3.27 2003 +/- -1.15 -0.51 -1.05 -0.12 -1.10 -1.29 5.59 -1.12 1.37 -1.26 0.64 -0.82 -0.82 2004 +/- -0.54 -1.17 1.13 -1.81 2.90 0.73 -1.05 0.34 -2.66 3.28 2.05 -1.48 1.72 2005 +/- 4.48 0.12 -1.95 -2.20 -2.94 -2.79 -2.59 -0.54 -0.14 -0.53 0.98 -1.08 -9.18 2006 +/- 1.47 -1.16 -0.20 1.22 -2.59 -1.57 3.92 0.71 -0.36 0.11 0.94 0.35 1.21 2007 +/- 0.59 0.75 -0.38 -1.29 -1.81 -0.22 -0.69 -3.11 -0.20 0.61 -1.19 0.83 -6.13 2008 +/- 4.03 2.98 -0.96 -1.17 0.18 2.98 6.65 -3.23 7.17 -0.61 -1.89 1.80 17.93 2009 +/- -1.13 1.08 1.27 2.01 0.01 0.99 0.53 0.73 -1.17 7.17 0.85 0.94 11.82 2010 +/- -0.35 0.38 -0.45 -0.92 0.19 6.82 -0.76 -0.09 2.25 -2.04 -1.22 -1.47 2.34 2011 +/- -0.90 0.44 -1.20 1.73 -0.30 1.43 -2.04 -3.37 -0.90 -1.68 0.01 -0.43 -7.21
1993 Total 4.61 1.82 3.08 5.28 1.36 7.44 7.14 4.42 6.61 3.51 3.30 1.21 49.78 1994 Total 1.19 0.92 1.35 6.45 2.97 4.30 2.92 3.11 2.25 1.87 4.64 2.26 34.23 1995 Total 3.61 0.56 3.19 3.86 12.70 3.38 1.93 3.86 0.94 4.18 1.39 0.92 40.52 1996 Total 1.21 0.57 1.73 2.49 5.92 2.78 4.86 2.62 1.79 1.88 2.93 0.65 29.43 1997 Total 1.73 3.04 3.24 1.38 3.10 3.50 1.27 5.27 4.67 1.67 2.84 1.61 33.32 1998 Total 2.46 2.45 4.35 8.55 4.33 8.39 3.06 5.65 1.33 4.54 1.89 1.71 48.71 1999 Total 1.56 2.26 1.16 5.66 4.46 5.23 3.48 6.25 2.09 1.83 0.30 2.63 36.91 2000 Total 0.79 1.31 2.25 3.82 2.97 5.78 4.05 3.72 2.97 2.03 3.87 1.40 34.96 2001 Total 2.38 3.39 1.42 2.23 2.92 3.02 2.81 4.24 2.11 5.81 2.02 1.74 34.11 2002 Total 2.49 2.23 1.86 4.99 5.19 2.39 7.79 8.58 1.52 2.23 0.68 1.62 41.57 2003 Total 0.55 1.04 2.06 3.51 3.32 2.68 9.94 2.88 4.50 1.55 3.64 1.81 37.48 2004 Total 1.16 0.38 4.24 1.82 7.21 4.70 3.30 4.34 0.47 6.09 5.05 1.57 40.33 2005 Total 6.18 1.67 1.16 1.43 1.48 1.18 1.76 3.46 2.99 2.28 3.98 1.55 29.12 2006 Total 3.07 0.39 2.91 4.85 1.83 2.40 8.27 3.29 2.77 2.92 3.94 2.98 39.62 2007 Total 2.29 2.30 2.73 2.34 2.61 3.73 3.66 0.89 2.93 3.42 1.81 3.46 32.17 2008 Total 5.73 4.53 2.15 2.46 4.60 6.95 11.00 0.77 10.30 2.20 1.11 4.43 56.23 2009 Total 0.57 2.63 4.38 5.64 4.43 4.96 4.88 3.27 2.00 9.86 3.85 3.67 50.14 2010 Total 1.35 1.93 2.66 2.71 4.61 10.79 3.59 3.91 5.38 1.57 2.54 2.09 43.13 2011 Total 1.03 2.26 1.40 5.34 3.86 5.75 3.02 0.55 2.31 1.40 3.26 2.21 32.39
Notes: 1993-2010 data compared against 1971-2000 30 Yr Average, all data presented in inches

33
In 2010, the USGS showed an interest in using one well nest within the study area as a real-time data station with instantaneous access to the data via the internet. Several well locations were considered for an additional well and Site 17 was selected. The USGS installed a water table well at Site 17 in July 2010. All three wells at Site 17 are outfitted with continuous recorders, and the data will be readable on the USGS website (http://groundwaterwatch.usgs.gov/ countymaps/IL_179.html). We are also developing an agreement with the City of Bloomington to set up five additional stations for collecting continuous measurements at six or more wells in the network. These will be wells on the eastern side of the study area that we deem important for more detailed monitoring as development occurs in the area. We anticipate adding these additional stations in the spring 2012, assuming Bloomington approves the proposal we have given them. Once set up at five existing well sites, we will be able to collect nearly continuous water level information and plan to develop the capability to display that information on the ISWS website. We would like to thank the LRWPSC for continuing to fund this project. We feel that the information we are gathering is essential as you continue to move toward utilization and proper management of the Mahomet Aquifer. If you have any questions or comments, please contact us. Sincerely, Kevin L. Rennels Steven D. Wilson Field Research Specialist Groundwater Hydrologist Illinois State Water Survey Illinois State Water Survey [email protected] [email protected] Phone: (217) 333-8466 Phone: (217) 333-0956 cc: Walt Kelly, ISWS George Roadcap, ISWS Bob Kohlhase, Farnsworth Group Mel Pleines, Pleines & Assoc. Mark Peterson, Town of Normal Pam Reese, Town of Normal Steve Gerdes, Town of Normal Steve Stockton, City of Bloomington David Hales, City of Bloomington Craig Cummings, Director of Water, City of Bloomington Rick Twait, City Of Bloomington Jay Sheley, ISWS Lisa Young ISWS (509887 740003 191100)

34
1/1/92 1/1/94 1/1/96 1/1/98 1/1/00 1/1/02 1/1/04 1/1/06 1/1/08 1/1/10Date
560561562563564565566567568569570
Wat
er-L
evel
Ele
vatio
n (f
t-m
sl)
1/1/92 1/1/94 1/1/96 1/1/98 1/1/00 1/1/02 1/1/04 1/1/06 1/1/08 1/1/10Date
546547548549550551552553554555556
Wat
er-L
evel
Ele
vatio
n (f
t-m
sl)
1/1/92 1/1/94 1/1/96 1/1/98 1/1/00 1/1/02 1/1/04 1/1/06 1/1/08 1/1/10Date
582583584585586587588589590591592593594
Wat
er-L
evel
Ele
vatio
n (f
t-m
sl) SWS-1
SWS-2S
SWS-2D
35
1/1/92 1/1/94 1/1/96 1/1/98 1/1/00 1/1/02 1/1/04 1/1/06 1/1/08 1/1/10Date
585
587
589
591
593
595
597
Wat
er-L
evel
Ele
vat io
n (f
t -m
s l)
1/1/92 1/1/94 1/1/96 1/1/98 1/1/00 1/1/02 1/1/04 1/1/06 1/1/08 1/1/10Date
584585586587588589590591592593594
Wat
er L
evel
Ele
vatio
n (f
t abo
ve M
SL)
1/1/92 1/1/94 1/1/96 1/1/98 1/1/00 1/1/02 1/1/04 1/1/06 1/1/08 1/1/10Date
535536537538539540541542543544545
Wat
er-L
evel
Ele
vatio
n (f
t-m
sl)
SWS 3D
SWS-3S
SWS-5
36
1/1/92 1/1/94 1/1/96 1/1/98 1/1/00 1/1/02 1/1/04 1/1/06 1/1/08 1/1/10Date
532533534535536537538539540541542
Wat
er-L
evel
Ele
vatio
n (f
t-m
sl)
This site was struckand had to be abandoned
1/1/92 1/1/94 1/1/96 1/1/98 1/1/00 1/1/02 1/1/04 1/1/06 1/1/08 1/1/10Date
548549550551552553554555556557558
Wat
er-L
evel
Ele
vatio
n (f
t-m
sl)
1/1/92 1/1/94 1/1/96 1/1/98 1/1/00 1/1/02 1/1/04 1/1/06 1/1/08 1/1/10Date
553554555556557558559560561562563
Wat
er-L
evel
Ele
vatio
n (f
t-m
sl) SWS-7
SWS-6
SWS-8

37
1/1/92 1/1/94 1/1/96 1/1/98 1/1/00 1/1/02 1/1/04 1/1/06 1/1/08 1/1/10Date
544545546547548549550551552553554
Wat
er-L
evel
Ele
vatio
n (f
t-m
sl)
1/1/92 1/1/94 1/1/96 1/1/98 1/1/00 1/1/02 1/1/04 1/1/06 1/1/08 1/1/10Date
582583584585586587588589590591592593594
Wat
er-L
evel
Ele
vatio
n (f
t-m
sl)
1/1/92 1/1/94 1/1/96 1/1/98 1/1/00 1/1/02 1/1/04 1/1/06 1/1/08 1/1/10Date
582583584585586587588589590591592
Wat
er-L
evel
Ele
vatio
n (f
t-m
sl)
SWS-10
SWS-A
SWS-B
38
1/1/92 1/1/94 1/1/96 1/1/98 1/1/00 1/1/02 1/1/04 1/1/06 1/1/08 1/1/10Date
579580581582583584585586587588589
Wat
er-L
evel
Ele
vatio
n (f
t-m
sl)
1/1/92 1/1/94 1/1/96 1/1/98 1/1/00 1/1/02 1/1/04 1/1/06 1/1/08 1/1/10Date
532533534535536537538539540541542543
Wat
er-L
evel
Ele
vatio
n (f
t-m
sl)
1/1/92 1/1/94 1/1/96 1/1/98 1/1/00 1/1/02 1/1/04 1/1/06 1/1/08 1/1/10Date
580581582583584585586587588589590
Wat
er-L
evel
Ele
vatio
n (f
t-m
sl) SWS-C
SWS-E
SWS-GD

39
1/1/92 1/1/94 1/1/96 1/1/98 1/1/00 1/1/02 1/1/04 1/1/06 1/1/08 1/1/10Date
533
535
537
539
541
543
545
547
Wat
er-L
evel
Ele
vatio
n (f
t-m
sl)
1/1/92 1/1/94 1/1/96 1/1/98 1/1/00 1/1/02 1/1/04 1/1/06 1/1/08 1/1/10Date
530
533
536
539
542
545
Wat
er-L
evel
Ele
vatio
n (f
t-m
sl)
1/1/92 1/1/94 1/1/96 1/1/98 1/1/00 1/1/02 1/1/04 1/1/06 1/1/08 1/1/10Date
542543544545546547548549550551552
Wat
er-L
evel
Ele
vatio
n (f
t-m
sl)
MTH-1
MTH-2
SWS-GS

40
1/1/92 1/1/94 1/1/96 1/1/98 1/1/00 1/1/02 1/1/04 1/1/06 1/1/08 1/1/10Date
523524525526527528529530531532533
Wat
er-L
evel
Ele
vatio
n (f
t-m
sl)
1/1/92 1/1/94 1/1/96 1/1/98 1/1/00 1/1/02 1/1/04 1/1/06 1/1/08 1/1/10Date
532533534535536537538539540541542
Wat
er-L
evel
Ele
vatio
n (f
t-m
sl)
1/1/92 1/1/94 1/1/96 1/1/98 1/1/00 1/1/02 1/1/04 1/1/06 1/1/08 1/1/10Date
542543544545546547548549550551552
Wat
er-L
evel
Ele
vatio
n (f
t-m
sl)
MTH-3
MTH-4
This well was struck by a snowplow and had to be abandoned
MTH-5
41
MTH-7
1/1/92 1/1/94 1/1/96 1/1/98 1/1/00 1/1/02 1/1/04 1/1/06 1/1/08 1/1/10Date
524525526527528529530531532533534
Wat
er-L
evel
Ele
vatio
n (f
t-m
sl)
MTH-6
1/1/92 1/1/94 1/1/96 1/1/98 1/1/00 1/1/02 1/1/04 1/1/06 1/1/08 1/1/10Date
537538539540541542543544545546547
Wat
er-L
evel
Ele
vatio
n (f
t-m
sl)
MTH-8
1/1/92 1/1/94 1/1/96 1/1/98 1/1/00 1/1/02 1/1/04 1/1/06 1/1/08 1/1/10Date
535536537538539540541542543544545
Wat
er-L
evel
Ele
vatio
n (f
t-m
sl)

42
1/1/92 1/1/94 1/1/96 1/1/98 1/1/00 1/1/02 1/1/04 1/1/06 1/1/08 1/1/10Date
540541542543544545546547548549550
Wat
er-L
evel
Ele
vatio
n (f
t-m
sl)
1/1/92 1/1/94 1/1/96 1/1/98 1/1/00 1/1/02 1/1/04 1/1/06 1/1/08 1/1/10Date
542543544545546547548549550551552
Wat
er-L
evel
Ele
vatio
n (f
t-m
sl)
1/1/92 1/1/94 1/1/96 1/1/98 1/1/00 1/1/02 1/1/04 1/1/06 1/1/08 1/1/10Date
545546547548549550551552553554555
Wat
er-L
evel
Ele
vatio
n (f
t-m
sl) MTH-9
MTH-10D
MTH-10S

43
1/1/92 1/1/94 1/1/96 1/1/98 1/1/00 1/1/02 1/1/04 1/1/06 1/1/08 1/1/10Date
552553554555556557558559560561562
Wat
er-L
evel
Ele
vatio
n (f
t-m
sl)
1/1/92 1/1/94 1/1/96 1/1/98 1/1/00 1/1/02 1/1/04 1/1/06 1/1/08 1/1/10Date
545546547548549550551552553554555
Wat
er-L
evel
Ele
vatio
n (f
t-m
sl)
1/1/92 1/1/94 1/1/96 1/1/98 1/1/00 1/1/02 1/1/04 1/1/06 1/1/08 1/1/10Date
540541542543544545546547548549550
Wat
er-L
evel
Ele
vatio
n (f
t-m
sl) MTH-11D
MTH-11S
MTH-13

44
1/1/92 1/1/94 1/1/96 1/1/98 1/1/00 1/1/02 1/1/04 1/1/06 1/1/08 1/1/10Date
546547548549550551552553554555556
Wat
er-L
evel
Ele
vatio
n (f
t-m
sl)
1/1/92 1/1/94 1/1/96 1/1/98 1/1/00 1/1/02 1/1/04 1/1/06 1/1/08 1/1/10Date
547548549550551552553554555556557
Wat
er-L
evel
Ele
vatio
n (f
t-m
sl)
1/1/92 1/1/94 1/1/96 1/1/98 1/1/00 1/1/02 1/1/04 1/1/06 1/1/08 1/1/10Date
575576577578579580581582583584585
Wat
er-L
evel
Ele
vatio
n (f
t-m
sl)
MTH-14
This well was hit by a car and had to be abandoned in March 1996
MTH-15
MTH-17D

45
1/1/92 1/1/94 1/1/96 1/1/98 1/1/00 1/1/02 1/1/04 1/1/06 1/1/08 1/1/10Date
556557558559560561562563564565566
Wat
er-L
evel
Ele
vatio
n (f
t-m
sl)
1/1/92 1/1/94 1/1/96 1/1/98 1/1/00 1/1/02 1/1/04 1/1/06 1/1/08 1/1/10Date
560561562563564565566567568569570
Wat
er-L
evel
Ele
vatio
n (f
t-m
sl)
1/1/92 1/1/94 1/1/96 1/1/98 1/1/00 1/1/02 1/1/04 1/1/06 1/1/08 1/1/10Date
550551552553554555556557558559560
Wat
er-L
evel
Ele
vatio
n (f
t-m
sl)
MTH-17S
MTH-18D
MTH-18S

46
1/1/92 1/1/94 1/1/96 1/1/98 1/1/00 1/1/02 1/1/04 1/1/06 1/1/08 1/1/10Date
583584585586587588589590591592593
Wat
er-L
evel
Ele
vatio
n (f
t-m
sl)
1/1/92 1/1/94 1/1/96 1/1/98 1/1/00 1/1/02 1/1/04 1/1/06 1/1/08 1/1/10Date
585
587
589
591
593
595
597
599
Wat
er-L
evel
Ele
vatio
n (f
t-m
sl)
1/1/92 1/1/94 1/1/96 1/1/98 1/1/00 1/1/02 1/1/04 1/1/06 1/1/08 1/1/10Date
583584585586587588589590591592593
Wat
er-L
evel
Ele
vatio
n (f
t-m
sl)
MTH-20
MTH-21
MTH-19

47
1/1/92 1/1/94 1/1/96 1/1/98 1/1/00 1/1/02 1/1/04 1/1/06 1/1/08 1/1/10Date
548549550551552553554555556557558
Wat
er-L
evel
Ele
vatio
n (f
t-m
sl)
1/1/92 1/1/94 1/1/96 1/1/98 1/1/00 1/1/02 1/1/04 1/1/06 1/1/08 1/1/10Date
560561562563564565566567568569570
Wat
er-L
evel
Ele
vatio
n (f
t-m
sl)
1/1/92 1/1/94 1/1/96 1/1/98 1/1/00 1/1/02 1/1/04 1/1/06 1/1/08 1/1/10Date
555556557558559560561562563564565
Wat
er-L
evel
Ele
vatio
n (f
t-m
sl)
MTH-22D
MTH-22S
MTH-24D

48
1/1/92 1/1/94 1/1/96 1/1/98 1/1/00 1/1/02 1/1/04 1/1/06 1/1/08 1/1/10Date
528529530531532533534535536537538
Wat
er-L
evel
Ele
vatio
n (f
t-m
sl)
1/1/92 1/1/94 1/1/96 1/1/98 1/1/00 1/1/02 1/1/04 1/1/06 1/1/08 1/1/10Date
548549550551552553554555556557558
Wat
er-L
evel
Ele
vatio
n (f
t-m
sl)
1/1/92 1/1/94 1/1/96 1/1/98 1/1/00 1/1/02 1/1/04 1/1/06 1/1/08 1/1/10Date
568569570571572573574575576577578
Wat
er-L
evel
Ele
vatio
n (f
t-m
sl)
MTH-24S
MTH-25
MTH-26
Well abandonedSummer 2001

49
1/1/92 1/1/94 1/1/96 1/1/98 1/1/00 1/1/02 1/1/04 1/1/06 1/1/08 1/1/10Date
555556557558559560561562563564565
Wat
er-L
evel
Ele
vatio
n (f
t-m
sl)
MTH-27

50
1/1/92 1/1/94 1/1/96 1/1/98 1/1/00 1/1/02 1/1/04 1/1/06 1/1/08 1/1/10Date
574
576
578
580
582
584
586
588
590
592
Wat
er-L
evel
Ele
vatio
n (f
t-m
sl)
1/1/92 1/1/94 1/1/96 1/1/98 1/1/00 1/1/02 1/1/04 1/1/06 1/1/08 1/1/10Date
542
544
546
548
550
552
554
556
558
Wat
er-L
evel
Ele
vatio
n (f
t-m
sl)
1/1/92 1/1/94 1/1/96 1/1/98 1/1/00 1/1/02 1/1/04 1/1/06 1/1/08 1/1/10Date
526
528
530
532
534
536
538
540
Wat
er-L
evel
Ele
vatio
n (f
t-m
sl)
RVR-3
RVR-6
RVR-7

51
Appendix B. A Completed Well Inventory Form
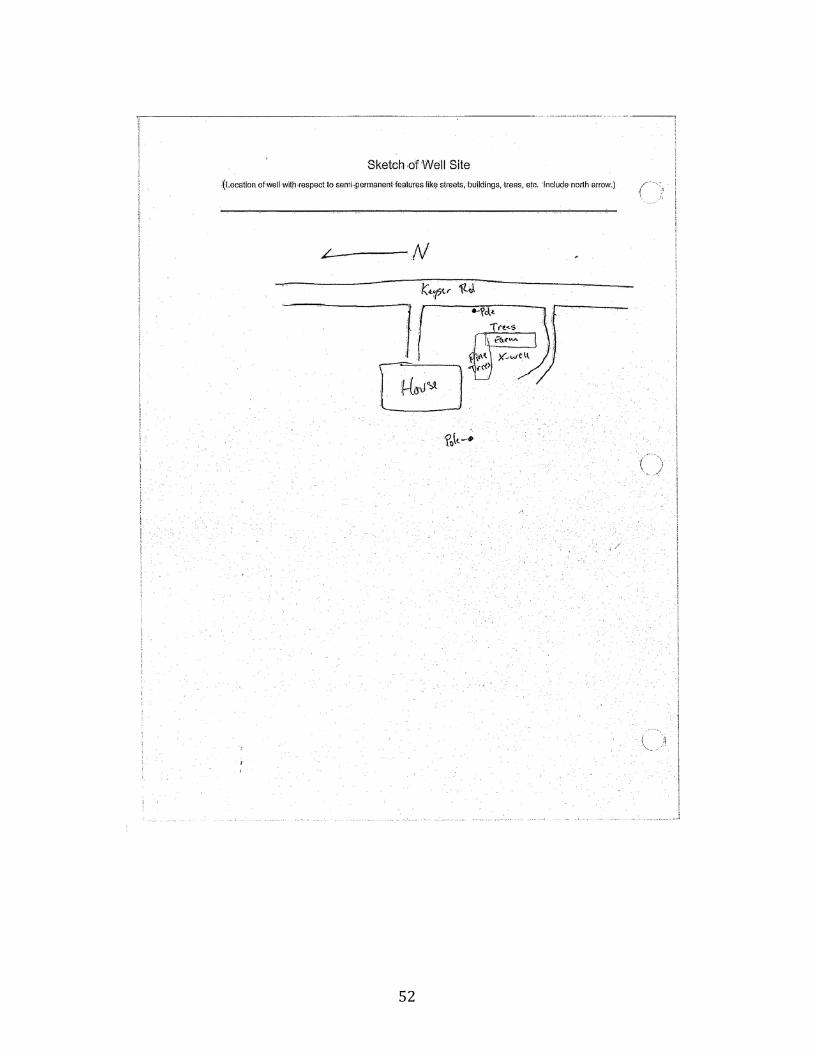
52
