potential at 22 missouri landfills inventory of landfill ... · inventory of landfill gas (lfg)...
TRANSCRIPT

1
Inventory of Landfill Gas (LFG)potential at 22 Missouri landfills
Excerpted from a presentation byJohn Noller, Energy Center
Missouri Department of Natural ResourcesMissouri Landfill Gas to Energy Workshop
Missouri Waste Control Coalition ConferenceJune 29, 2004

2
LFG inventory - June 2004
• Inventory current LFG use in Missouri• Estimate potential LFG use in Missouri
– Identify candidate landfills– Determine life cycle of LFG at these landfills– Estimate “average” & “minimum” recovery– Estimate aggregate LFG potential
• Total for new and existing LFG projects• Compare to other indigenous/renewable energy• Estimate greenhouse gas benefits of LFG projects

3
Current Missouri LFG Energy Use
• Fred Weber Sanitary Landfill– Pattonville High School– Greenhouse– Asphalt Plant
• Onyx Oak Ridge Landfill– Daimler Chrysler
• Rumble Sanitary Landfill– Greenhouse for Sugar Creek Schools

4
Table 1. Energy EquivalentRecovery from Existing Projects
*MW power generating potential assumes a heat rate of 11,000 Btu/kW-hr
Source: EPA Landfill Methane Outreach Program
Power Generating Potential
Natural Gas Equivalent
Landfill Name (cfm) (mmBTU/hr) (MW)* (mm ft3)Fred Weber 2,441 74.1 6.7 641Onyx Oak Ridge 1,600 48.6 4.4 420Rumble 2 24 0.7 0.1 6Totals 4,065 123.4 11.2 1,068
Landfill Gas Recovery - Current

5
Criteria used to select“Candidate Landfills”
• More than 1 million tons of Waste in Place• Active or closed less than 10 years
Or• Has an active landfill gas collection system
and flare• Landfill gas has not deteriorated (LFG
composition is still at least 35 percentmethane)

6
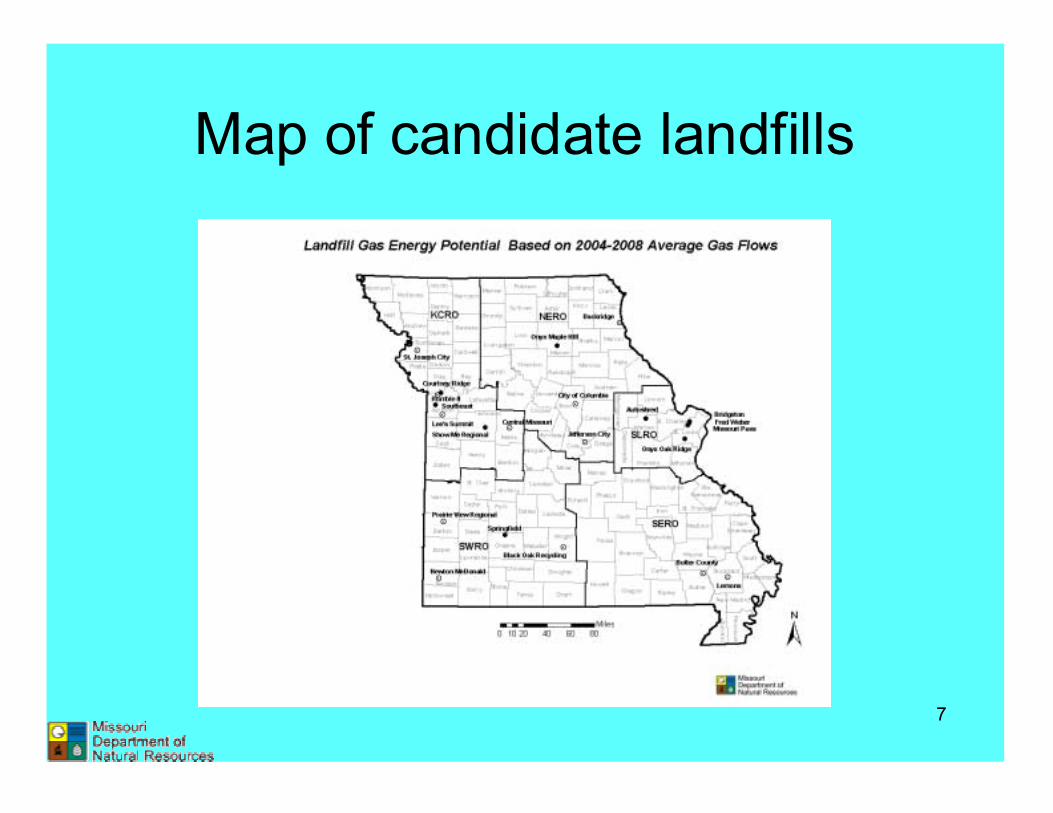
22 Candidate LandfillsSLRO Autoshred NERO Backridge
Bridgeton ColumbiaFred Weber Jefferson CityMissouri Pass Onyx Maple HillOnyx Oak Ridge
SWRO Black Oak KCRO Central MissouriNewton McDonald Courtney RidgePrarieview Lee's SummitSpringfield Rumble II
Show Me RegionalSERO Butler County Southeast
Lemons East St. Josephs
7
Map of candidate landfills
8
How LFG capture was estimated
• LandGEM model used to estimate LFGflow from 22 landfills– EPA’s Landfill Gas Generation Model, LandGEM, is
the most commonly used model for this purpose– Modeling was done by LMOP
• Input annual disposal rates in tons/year– Used volume disposal records, opening and
closing/projected closing years– EC provided data from Missouri DNR’s Solid Waste
Management Program (SWMP) and Air PollutionControl Program (APCP)

9
Key modeling assumptions
• Assumptions used to estimate LFG capture– Set LandGEM decay rate constant (k) and generation
rate constant (Lo) to EPA (AP-42) defaults:– k = 0.04/year– Lo = 100 m3/Mg (3,204 ft3/ton)
– Collection system assumed to be 85% efficient• Assuptions used to estimate energy content
– LFG assumed to be 50% methane with a heat valueof 506 Btu per cubic foot
– Heat rate of 11,000 Btu/kW-hr assumed in estimatingpower generating potential

10
LFG potential curve example #1 -peaking prior to 2005
LANDFILL GAS RECOVERY RATEMISSOURI PASS LANDFILL - Peaks in 1998
0
500
1,000
1,500
2,000
2,500
3,000
3,500
4,000
1995 2000 2005 2010 2015 2020 2025 2030
LFG
Flo
ws
(scf
m)
LFG Recovery at 85% Collection Efficiency

11
LFG potential curve example #2 -peaking during 2005 - 2014
LANDFILL GAS RECOVERY RATESHOW ME REGIONAL LANDFILL - Peaks in 2012
0
500
1,000
1,500
2,000
2,500
3,000
3,500
4,000
1995 2000 2005 2010 2015 2020 2025 2030
LFG
Flo
ws
(scf
m)
LFG Recovery at 85% Collection Efficiency

12
LFG potential curve example #3 -peaking after 2014
LANDFILL GAS RECOVERY RATEPRAIRIEVIEW LANDFILL - Peaks in 2036
0
500
1,000
1,500
2,000
2,500
3,000
3,500
4,000
1995 2000 2005 2010 2015 2020 2025 2030
LFG
Flo
ws
(scf
m)
LFG Recovery at 85% Collection Efficiency

13
LandGEM Modeling Results
• Tables show potential LFG recovery, energyequivalent, and project size that can besupported based on:
• Average LFG recovery for 2004-08• Minimum LFG recovery for 2005-2014 (flows
sufficient to meet capacity for 10 years)• Energy equivalent indicated two ways
• Generating potential in megawatts (MW) if the LFG werededicated to power generation
• Equivalent volume of natural gas (NG) in millions of cubicfeet (Mcf) - assumes LFG has half the heat value of NG

14
“Minimum” recovery”
• “Average recovery” is the average annualLFG recovery for the 5 years 2004-2008
• “Minimum recovery” indicates LFG projectsize that can be sustained from 2005-2014at constant rate of LFG use.
• “Minimum recovery” is estimated becausethe investor in a LFG project may require aconstant supply of LFG for at least 10years to recover their investment.

15
LFG potential curve example #1 -average versus minimum recovery
LANDFILL GAS RECOVERY RATEMISSOURI PASS LANDFILL - Peaks in 1998
0
500
1,000
1,500
2,000
2,500
3,000
3,500
4,000
1995 2000 2005 2010 2015 2020 2025 2030
LFG
Flo
ws
(scf
m)
LFG Recovery at 85% Collection Efficiency

16
LFG potential curve example #2 -average versus minimum recovery
LANDFILL GAS RECOVERY RATESHOW ME REGIONAL LANDFILL - Peaks in 2012
0
500
1,000
1,500
2,000
2,500
3,000
3,500
4,000
1995 2000 2005 2010 2015 2020 2025 2030
LFG
Flo
ws
(scf
m)
LFG Recovery at 85% Collection Efficiency

17
LFG potential curve example #3 -average versus minimum recovery
LANDFILL GAS RECOVERY RATEPRAIRIEVIEW LANDFILL - Peaks in 2036
0
500
1,000
1,500
2,000
2,500
3,000
3,500
4,000
1995 2000 2005 2010 2015 2020 2025 2030
LFG
Flo
ws
(scf
m)
LFG Recovery at 85% Collection Efficiency

18
Table 2. Estimated LFG energy potential fornine sites with highest potential - average flow
Power Generating Potential
Natural Gas Equivalent
Landfill Name Region (cfm) (mmBTU/hr) (MW) (Mcf)Bridgeton SLRO 3,826 116.2 10.6 1,005.5Missouri Pass SLRO 2,512 76.3 6.9 660.2Courtney Ridge KCRO 1,787 54.3 4.9 469.6Southeast KCRO 1,744 52.9 4.8 458.3Autoshred SLRO 1,200 36.4 3.3 315.4Show Me Regional KCRO 1,117 33.9 3.1 293.5Springfield SWRO 1,025 31.1 2.8 269.4Fred Weber SLRO 966 29.3 2.7 253.9Onyx Maple Hill NERO 956 29.0 2.6 251.2Totals 15,133 459.4 41.8 3,977.0
Landfill Gas Recovery - 2004-2008 Average
*MW power generating potential assumes a heat rate of 11,000 Btu/kW-hr
Source: EPA Landfill Methane Outreach Program

19
Table 3. Estimated LFG energy potential forremaining sites - average flow
Power Generating Potential
Natural Gas Equivalent
Landfill Name Region (cfm) (mmBTU/hr) (MW) (Mcf)Rumble 2 KCRO 824 25.0 2.3 216.5Jefferson City NERO 779 23.7 2.2 204.7Lee's Summit KCRO 772 23.4 2.1 202.9Central Missouri KCRO 676 20.5 1.9 177.7Lemons East SERO 629 19.1 1.7 165.3Butler County SERO 624 18.9 1.7 164.0Black Oak SWRO 592 18.0 1.6 155.6Prarieview SWRO 495 15.0 1.4 130.1St. Josephs KCRO 469 14.2 1.3 123.3Backridge NERO 347 10.5 1.0 91.2Columbia NERO 341 10.4 0.9 89.6Onyx Oak Ridge SLRO 300 9.1 0.8 78.8Newton McDonald SWRO 277 8.4 0.8 72.8Totals 6,825 207.2 18.8 1,793.6
Landfill Gas Recovery - 2004-2008 Average
*MW power generating potential assumes a heat rate of 11,000 Btu/kW-hr
Source: EPA Landfill Methane Outreach Program

20
Map (average flow)

21
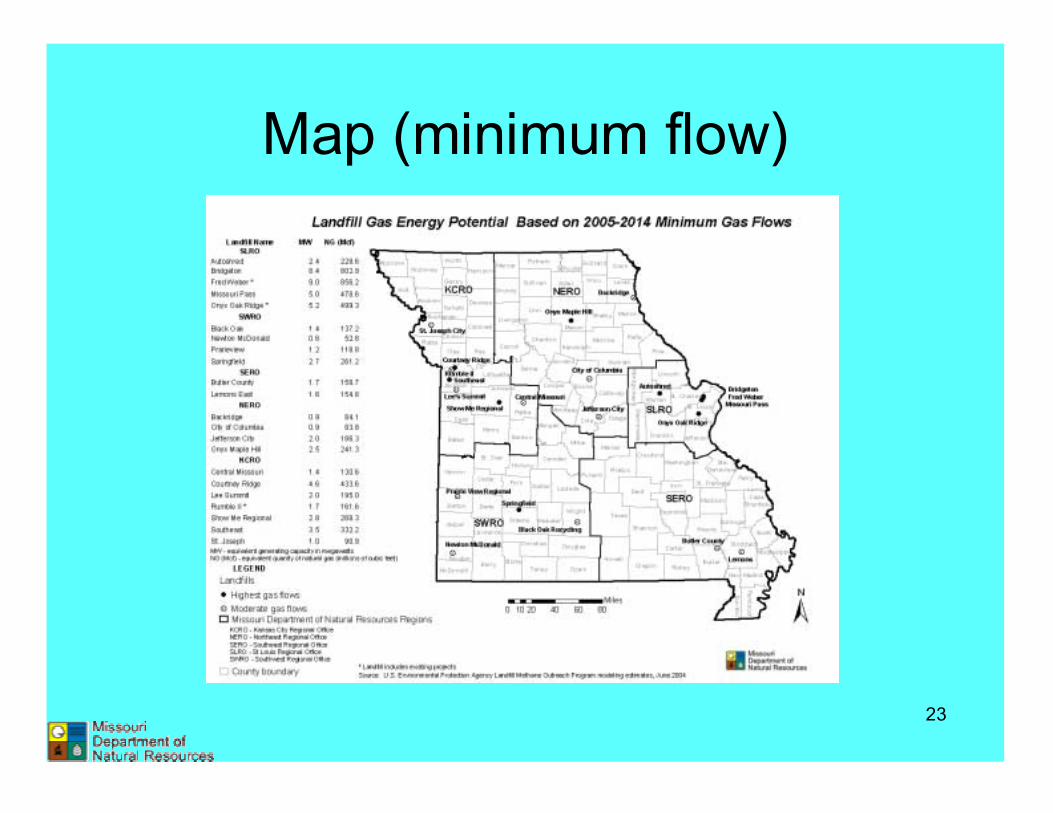
Table 4. Estimated LFG energy potential fornine sites with highest potential - minimum flow
Power Generating Potential
Natural Gas Equivalent
Landfill Name Region (cfm) (mmBTU/hr) (MW) (Mcf)Bridgeton SLRO 3,055 92.7 8.4 802.9Missouri Pass SLRO 1,821 55.3 5.0 478.6Courtney Ridge KCRO 1,650 50.1 4.6 433.6Southeast KCRO 1,264 38.4 3.5 332.2Show Me Regional KCRO 1,021 31.0 2.8 268.3Springfield SWRO 994 30.2 2.7 261.2Onyx Maple Hill NERO 918 27.9 2.5 241.3Autoshred SLRO 870 26.4 2.4 228.6Fred Weber SLRO 817 24.8 2.3 214.7Totals 12,410 376.8 34.3 3,261.3
Landfill Gas Recovery - 2005-2014 Minimum
*MW power generating potential assumes a heat rate of 11,000 Btu/kW-hr
Source: EPA Landfill Methane Outreach Program

22
Table 5. Estimated LFG energy potential forremaining sites - minimum flow
Power Generating Potential
Natural Gas Equivalent
Landfill Name (cfm) (mmBTU/hr) (MW) (Mcf)Lee Summit KCRO 742 22.5 2.0 195.0Jefferson City NERO 709 21.5 2.0 186.3Butler County SERO 604 18.3 1.7 158.7Rumble 2 KCRO 591 17.9 1.6 155.3Lemons East SERO 589 17.9 1.6 154.8Black Oak SWRO 522 15.8 1.4 137.2Central Missouri KCRO 497 15.1 1.4 130.6Prarieview SWRO 452 13.7 1.2 118.8St. Josephs KCRO 346 10.5 1.0 90.9Backridge NERO 320 9.7 0.9 84.1Columbia NERO 319 9.7 0.9 83.8Onyx Oak Ridge SLRO 300 9.1 0.8 78.8Newton McDonald SWRO 201 6.1 0.6 52.8Totals 5,892 178.9 16.3 1,548.4
Landfill Gas Recovery - 2005-2014 Minimum
*MW power generating potential assumes a heat rate of 11,000 Btu/kW-hr
Source: EPA Landfill Methane Outreach Program
23
Map (minimum flow)

24
Total LFG energy from existing andpotential new projects at 22 landfills
• Existing LFG projects at 3 landfills– 123.4 mmBtu/hr– 11.2 MW
• Potential (Based on average flow 2004-08)– 666.6 mmBtu/hr– 60.6 MW
• Potential (Based on minimum flow 2005-14)– 555.6 mmBtu/hr– 50.5 MW

25
Existing & potential LFG recovery(cfm) at 22 Missouri Landfills
4,065 4,065
12,410
6,825
5,892
15,133
0
4,000
8,000
12,000
16,000
20,000
24,000
28,000
Average flow 2004-2008 Minimum flow 2005-2014
Cub
ic fe
et p
er m
inut
e (c
fm) L
FG fl
ow
Landfill gas projects already in place Nine landfills with most unused potential Oher landfills with unused potential

26
Existing & potential LFG recovery(mmBtu/hr) at 22 Missouri Landfills
123.4 123.4
376.8
207.2
178.9
459.4
0.050.0
100.0150.0200.0250.0300.0350.0400.0450.0500.0550.0600.0
650.0700.0
750.0800.0
Average flow 2004-2008 Minimum flow 2005-2014
Mill
ion
BTU
s (m
mB
tu) p
er h
our
Landfill gas projects already in place Nine landfills with most unused potential Oher landfills with unused potential

27
Existing & potential LFG recoveryas MW of generating potential
at 22 Missouri Landfills
11.2 11.2
34.3
18.8
16.3
41.8
0.0
5.0
10.0
15.0
20.0
25.0
30.0
35.0
40.0
45.0
50.0
55.0
60.0
65.0
70.0
75.0
Average flow 2004-2008 Minimum flow 2005-2014
Pow
er G
ener
atin
g Po
tent
ial (
MW
)
Landfill gas projects already in place Nine landfills with most unused potential Oher landfills with unused potential

28
Existing & potential LFG recoveryas equivalent Mcf of natural gas
at 22 Missouri Landfills
1,068 1,068
3,261
1,794
1,548
3,977
0
1,000
2,000
3,000
4,000
5,000
6,000
7,000
Average flow 2004-2008 Minimum flow 2005-2014
Equi
vale
nt M
cf o
f Nat
ural
Gas
Landfill gas projects already in place Nine landfills with most unused potential Oher landfills with unused potential

29
Missouri LFG use (trillion BTU) compared toother Missouri energy production and use
1.08
2.17
4.28
6.92
9.84
20.85
- 3.0 6.0 9.0 12.0 15.0 18.0 21.0Existing LFG projects
Industrial & commercial wood use
Consumption of Missouri c
oal
Existing + Potential LFG (average flow)
Ethanol production, 2006 (4 plants)Utilit
y use of natural gas 2003