a unified model of consumer promotional usage
TRANSCRIPT
Loyola University Chicago Loyola University Chicago
Loyola eCommons Loyola eCommons
Dissertations Theses and Dissertations
1995
A Unified Model of Consumer Promotional Usage A Unified Model of Consumer Promotional Usage
Denise Lynn Archambault Loyola University Chicago
Follow this and additional works at: https://ecommons.luc.edu/luc_diss
Part of the Psychology Commons
Recommended Citation Recommended Citation Archambault, Denise Lynn, "A Unified Model of Consumer Promotional Usage" (1995). Dissertations. 3538. https://ecommons.luc.edu/luc_diss/3538
This Dissertation is brought to you for free and open access by the Theses and Dissertations at Loyola eCommons. It has been accepted for inclusion in Dissertations by an authorized administrator of Loyola eCommons. For more information, please contact [email protected].
This work is licensed under a Creative Commons Attribution-Noncommercial-No Derivative Works 3.0 License. Copyright © 1995 Denise Lynn Archambault

LOYOLA UNIVERSITY OF CHICAGO
A UNIFIED MODEL OF CONSUMER PROMOTIONAL USAGE
A DISSERTATION SUBMITTED TO
THE FACULTY OF THE GRADUATE SCHOOL
IN CANDIDACY FOR THE DEGREE OF
DOCTOR OF PHILOSOPHY
DEPARTMENT OF PSYCHOLOGY
BY
DENISE L. ARCHAMBAULT, M.A.
CHICAGO, ILLINOIS
MAY, 1995

Copyright by Denise L. Archambault, 1995 All rights reserved.
11
ACKNOWLEDGMENTS
The author is grateful for the special assistance provided by her husband,
Ramon Verdaguer, Ph.D. His long term support of this project and many others
has made a long road more bearable and often enjoyable along the way.
The author would also like to acknowledge the opportunities for growth
within the field of marketing and promotional research provided by two
companies. The Research Department of the Leo Burnett Company in Chicago,
Illinois provided an opportunity to explore the theoretical nature of consumer
promotions. Special thanks go to Josh McQueen and David Olsen for their insight,
expertise and moral support in the early stages of development of the Unified
Model. NCM, International, based in Arlington Heights, Illinois made this study a
reality by supporting it financially and encouraging the author to develop a deeper
understanding of promotional appeal by talking to consumers directly.
In addition, the author is grateful for the contributions of many researchers
and theoreticians to the development of an understanding of how consumer
promotions work within the greater network of marketing communications.
ll1
TABLE OF CONTENTS
ACKNOWLEDGMENTS . . . . . . . . . . . . . . . . . . . . . . . . . . . . . . . . . . . . 111
LIST OF ILLUSTRATIONS . . . . . . . . . . . . . . . . . . . . . . . . . . . . . . . . . . vu
LIST OF TABLES.......................................... vtn
Chapter
1. LITERATURE REVIEW . . . . . . . . . . . . . . . . . . . . . . . . . . . . . . . . . 1
Introduction . . . . . . . . . . . . . . . . . . . . . . . . . . . . . . . . . . . . . . . 1
The Marketing Mix . . . . . . . . . . . . . . . . . . . . . . . . . . . . . . . . . 3
Types of Consumer Promotions . . . . . . . . . . . . . . . . . . . . . . . 6
Manufacturer/Consumer Usage of Promotions. . . . . . . . . . . . 10
The Consumer Dynamics of Promotional Usage........... 13
The Perception of Costs and Benefits . . . . . . . . . . . . . 14
A Holistic Cost/Benefit Perspective Via Attitudinal Theory . . . . . . . . . . . . . . . . . . . . . . . . . . 25
The Influence of Past Behavior. . . . . . . . . . . . . . . . . . . 27
The Effects of Category Involvement and Brand Loyalty . . . . . . . . . . . . . . . . . . . . . . . . . . . . . 30
The Effects of Person Predisposition Factors. . . . . . . 35
A Unified Model of Consumer Promotional Usage . . . . . . . . 40
Areas for Further Development/Research Questions . . . . . . . 44
2. METHOD . . . . . . . . . . . . . . . . . . . . . . . . . . . . . . . . . . . . . . . . . . . . 46
Phase I. . . . . . . . . . . . . . . . . . . . . . . . . . . . . . . . . . . . . . . . . . . . 47
Purpose..................................... 47
Subjects . . . . . . . . . . . . . . . . . . . . . . . . . . . . . . . . . . . . 47
Instrumentation 47
IV
Procedure . . . . . . . . . . . . . . . . . . . . . . . . . . . . . . . . . . . 49
Phase II........................................... 50
Purpose..................................... 50
Subjects. . . . . . . . . . . . . . . . . . . . . . . . . . . . . . . . . . . . 51
Instrumentation.. . . . . . . . . . . . . . . . . . . . . . . . . . . . . . 53
Procedure . . . . . . . . . . . . . . . . . . . . . . . . . . . . . . . . . . . 60
3. RESULTS 61
Phase I............................................ 61
Overview of Phase I . . . . . . . . . . . . . . . . . . . . . . . . . . . 61
Phase II . . . . . . . . . . . . . . . . . . . . . . . . . . . . . . . . . . . . . . . . . . . 65
Overview of Phase II . . . . . . . . . . . . . . . . . . . . . . . . . . 65
Total Sample Demographics . . . . . . . . . . . . . . . . . . . . 65
Total Sample Past/Future Promotional Usage. . . . . . 68
Development of Education/Income Index . . . . . . . . . . 73
Cost/Benefit Index Construction . . . . . . . . . . . . . . . . . 7 4
Category Involvement Index Construction . . . . . . . . . 82
Deal Proneness Index Construction . . . . . . . . . . . . . . . 83
Brand Loyalty Index Construction . . . . . . . . . . . . . . . . 85
Association Between Unified Model Indices. . . . . . . . 88
Comparison of Users/Nonusers on Model Indices.... 88
Preparation for Structural Equation Modeling . . . . . . . 90
Testing the General Viability of the Unified Model . . . . 90
Testing the Model Within Promotional Types . . . . . . . 96
Testing the Model Within Product Categories. . . . . . . 98
4. DISCUSSION . . . . . . . . . . . . . . . . . . . . . . . . . . . . . . . . . . . . . . . . . 102
Phase I. . . . . . . . . . . . . . . . . . . . . . . . . . . . . . . . . . . . . . . . . . . . 102
V
Promotional Usage . . . . . . . . . . . . . . . . . . . . . . . . . . . . 102
Attitudes Toward Costs/Benefits of Promotional Usage . . . . . . . . . . . . . . . . . . . . . . . . . 103
Phase II . . . . . . . . . . . . . . . . . . . . . . . . . . . . . . . . . . . . . . . . . . . 109
Demographic Indicators . . . . . . . . . . . . . . . . . . . . . . . . 109
Total Sample Past Promotional Usage. . . . . . . . . . . . . . 111
Total Sample Intended Promotional Usage . . . . . . . . . . 114
Relationship of Past and Future Promotional Usage. . . 116
The Education/Income Hypothesis . . . . . . . . . . . . . . . . 117
Perceptions of Costs/Benefits of Promotional Usage.................................... 118
Category Involvement, Brand Loyalty, and Deal Proneness . . . . . . . . . . . . . . . . . . . . . . . . . . . . . . . . . 120
Insights from Correlation Model Matrix and User/ Nonuser Comparisons . . . . . . . . . . . . . . . . . . . . . . . 122
Total Sample Model Implications. . . . . . . . . . . . . . . . . 125
Implications of Modeling Promotional Samples . . . . . . 128
Implications of Modeling Product Category Samples . . . . . . . . . . . . . . . . . . . . . . . . . . . . . . . . . . 132
Conclusions . . . . . . . . . . . . . . . . . . . . . . . . . . . . . . . . . . . . . . . 134
Appendix
A. CATI TELEPHONE QUESTIONNAIRE ON CONSUMER PROMOTIONS: PHASE I . . . . . . . . . . . . . . . . . . . . . . . . . . . 138
B. CATI TELEPHONE QUESTIONNAIRE ON CONSUMER PROMOTIONS: PHASE II. . . . . . . . . . . . . . . . . . . . . . . . . . 142
REFERENCES............................................. 152
VITA.................................................... 159
VI

LIST OF ILLUSTRATIONS
Figure Page
1. The Tripartite Model of Promotions. . . . . . . . . . . . . . . . . . . . . . . . . . 5
2. The Reasoned Action Model . . . . . . . . . . . . . . . . . . . . . . . . . . . . . . . . 26
3. The Unified Model of Promotional Usage . . . . . . . . . . . . . . . . . . . . . . 41
4. The Study Design for Phase II . . . . . . . . . . . . . . . . . . . . . . . . . . . . . . . 52
5. The Unified Model Used for Analysis. . . . . . . . . . . . . . . . . . . . . . . . . 93
6. The Total Sample Modeling Results.......................... 97
vu

LIST OF TABLES
Table Page
1. Total Sample Demographics................................ 67
2. Past Usage of Promotions.................................. 69
3. Pearson Correlations among Past and Future Usage Indices.. . . . . . 70
4. Future Intention to Use Promotions. . . . . . . . . . . . . . . . . . . . . . . . . . . 71
5. Summary of Unified Model Component Indices . . . . . . . . . . . . . . . . . 73
6. Item Analysis of Coupon Cost/Benefit Index . . . . . . . . . . . . . . . . . . . . 78
7. Item Analysis of Refund Cost/Benefit Index . . . . . . . . . . . . . . . . . . . . 79
8. Item Analysis of Premium Cost/Benefit Index . . . . . . . . . . . . . . . . . . . 81
9. Item Analysis of Category Involvement Index . . . . . . . . . . . . . . . . . . . 83
10. Item Analysis of Deal Proneness Index. . . . . . . . . . . . . . . . . . . . . . . 84
11. Pearson Correlations among Unified Model Components . . . . . . . . . 89
12. Structural Model Results of Total and Promotional Samples.. . . . . . 95
13. Structural Model Results of Total and Product Category Samples . . . . . . . . . . . . . . . . . . . . . . . . . . . . . . . . . . . . . . . . . . . . . 100
V1ll
CHAPTER 1
LITERATURE REVIEW
Introduction
Consumer promotions have become an increasingly greater presence in
American culture in recent years. In fact, it would be difficult for an average
person to make it through a typical day without coming into contact with at least
twenty or thirty consumer promotions. Simply eating breakfast at home may bring
a multitude of promotional contacts such as a free premium gift offer shown on the
side of an orange juice carton, a small sample envelope of a new cereal found
inside a regular size cereal box, or a coupon off er printed on the back of a toaster
pastry box. Even reading a newspaper or magazine during a lunch hour can open
up an additional world of promotional opportunities ranging from advertising
containing perforated coupons and tear out samples of perfume to special
cookbook and recipe offers. Driving home from work in the afternoon, consumer
promotions can appear in the form of a billboard for a brand of soda which
announces sponsorship of the Olympic team or they can appear as a prize in a
"happy meal" purchased at a fast-food drive-thru window. Finally, while opening
the mail at the end of the day, a sweepstakes offer for a magazine clearinghouse
may just be part of the bundle of envelopes that needs to be sorted through.
Promotional contacts such as these, surprisingly, are made every hour of every day
without the average consumer ever having to sit in front of a television set or step
foot inside a store.

Given the tremendous proliferation of consumer promotions, what is truly
amazing is how little is known about their effect on consumers. Many basic
questions have yet to be adequately answered, such as: How do the various types
of promotions differ in the effect they have on a consumer's purchase decision?
Are there differences in the basic antecedents to usage of the various types of
consumer promotions? Do the different types of promotions appeal to different
segments of consumers? Answers to such questions would allow marketers to
appropriately target consumer segments with the promotional vehicle most likely
to impact their purchase decision and least likely to be a waste of valuable
marketing budget dollars.
Early attempts at understanding promotions focused on the economic
impact they have on purchase behavior. The commonly held belief was that
consumer promotions make purchasing a particular product a better economic
"deal" in the consumer's mind. Thus, much of the early research in this area
attempted to clarify the financial benefits of promotional usage to a consumer.
The problem for marketers, however, was the tunnel vision in promotional
planning engendered by this line of research. By focusing on economic benefits,
and by default economically motivating types of promotions (e.g., coupons), early
research failed to acknowledge the multifaceted nature of promotional usage and,
therefore, failed to provide marketers with a full understanding of how to create
and target promotions to have the greatest effect on consumers.
2
Encouragingly, research on consumer promotions has picked up momentum
in recent years, bringing to light the more complicated nature of promotional usage
and allowing promotion planners to make more informed budget allocation
decisions. The present research initiative will attempt to substantively add to the
marketer's understanding of the promotional usage decision by assessing consumer
3
reactions to several types of promotions via a holistic decision making model
which allows factors besides just the economic ones to have an impact on the
decision process. This research will build directly from the published fmdings and
insights provided by academics, marketers and market researchers over the past
thirty years.
The Marketing Mix
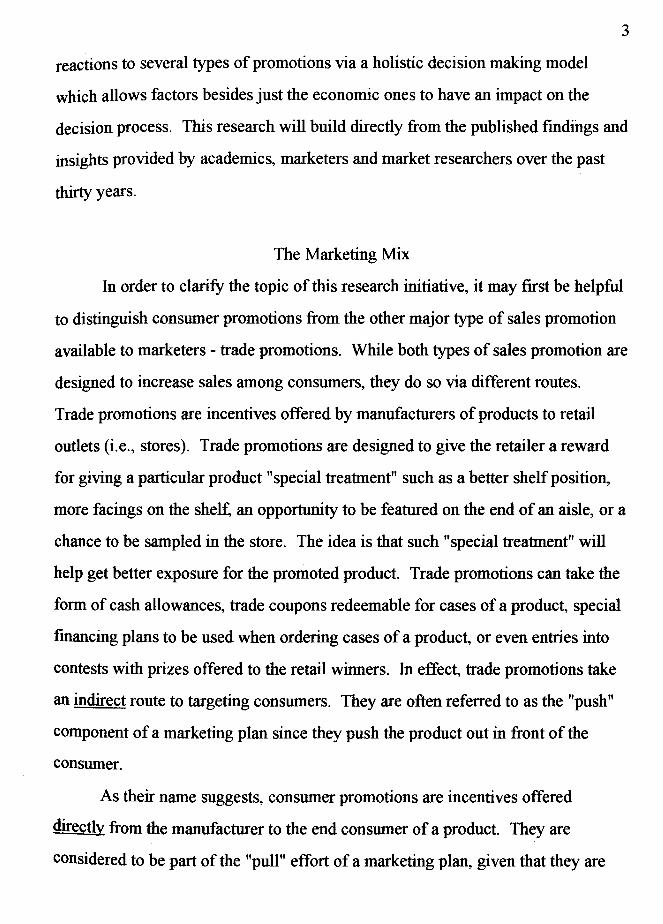
In order to clarify the topic of this research initiative, it may first be helpful
to distinguish consumer promotions from the other major type of sales promotion
available to marketers - trade promotions. While both types of sales promotion are
designed to increase sales among consumers, they do so via different routes.
Trade promotions are incentives offered by manufacturers of products to retail
outlets (i.e., stores). Trade promotions are designed to give the retailer a reward
for giving a particular product "special treatment" such as a better shelf position,
more facings on the shelf, an opportunity to be featured on the end of an aisle, or a
chance to be sampled in the store. The idea is that such "special treatment" will
help get better exposure for the promoted product. Trade promotions can take the
form of cash allowances, trade coupons redeemable for cases of a product, special
financing plans to be used when ordering cases of a product, or even entries into
contests with prizes offered to the retail winners. In effect, trade promotions take
an indirect route to targeting consumers. They are often referred to as the "push"
component of a marketing plan since they push the product out in front of the
consumer.
As their name suggests, consumer promotions are incentives offered
directly from the manufacturer to the end consumer of a product. They are
considered to be part of the "pull" effort of a marketing plan, given that they are
4
supposed to help pull the consumer into buying the promoted product. As noted
above, consumer promotions can take many forms ranging from common coupons
available in newspapers and sweepstakes advertised on packaging to charitable
sponsorship of events like the Olympics or causes such as the Ronald McDonald
House. Ideally, consumer promotions are tied to appropriate trade promotions to
optimize their leverage among consumers. For example, a sweepstakes offer to
consumers is more likely to be noticed if it is advertised with an attention getting
end-aisle display and in order to get the space for an end-aisle display a
manufacturer will likely have to provide the retailer with an appealing incentive.
Thus, a very large percentage of consumer promotions are purposefully and
strategically tied to a complementary trade promotion.
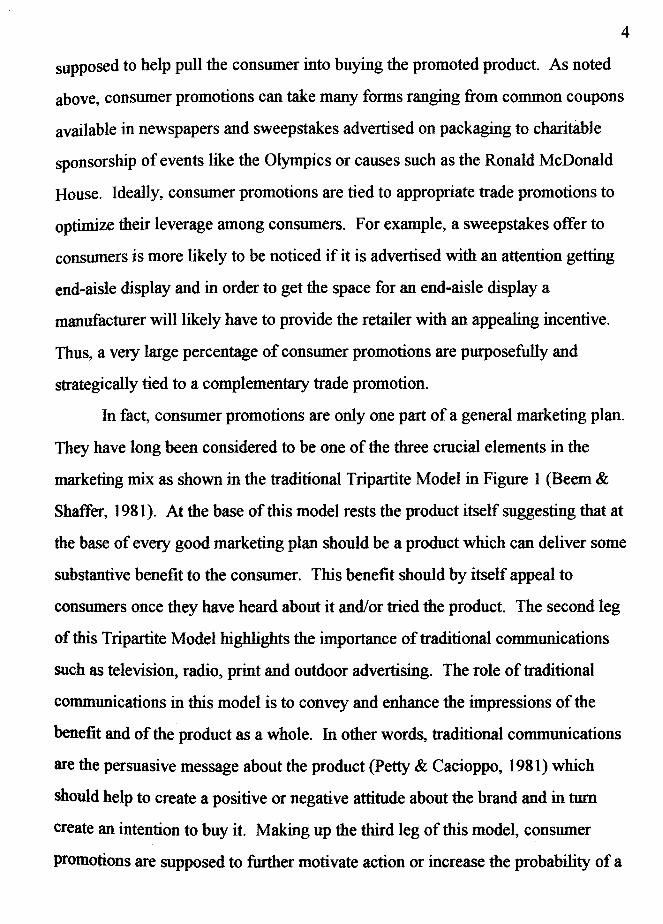
In fact, consumer promotions are only one part of a general marketing plan.
They have long been considered to be one of the three crucial elements in the
marketing mix as shown in the traditional Tripartite Model in Figure 1 (Beem &
Shaffer, 1981 ). At the base of this model rests the product itself suggesting that at
the base of every good marketing plan should be a product which can deliver some
substantive benefit to the consumer. This benefit should by itself appeal to
consumers once they have heard about it and/or tried the product. The second leg
of this Tripartite Model highlights the importance of traditional communications
such as television, radio, print and outdoor advertising. The role of traditional
communications in this model is to convey and enhance the impressions of the
benefit and of the product as a whole. In other words, traditional communications
are the persuasive message about the product (Petty & Cacioppo, 1981) which
should help to create a positive or negative attitude about the brand and in turn
create an intention to buy it. Making up the third leg of this model, consumer
promotions are supposed to further motivate action or increase the probability of a
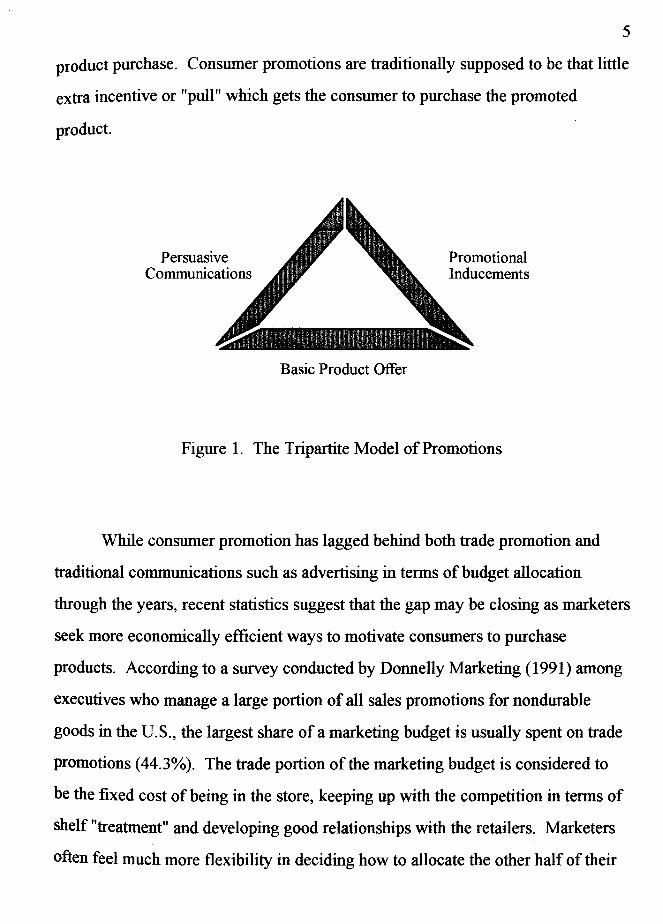
5
product purchase. Consumer promotions are traditionally supposed to be that little
extra incentive or "pull" which gets the consumer to purchase the promoted
product.
Persuasive Communications
Basic Product Offer
Promotional Inducements
Figure 1. The Tripartite Model of Promotions
While consumer promotion has lagged behind both trade promotion and
traditional communications such as advertising in terms of budget allocation
through the years, recent statistics suggest that the gap may be closing as marketers
seek more economically efficient ways to motivate consumers to purchase
products. According to a survey conducted by Donnelly Marketing ( 1991) among
executives who manage a large portion of all sales promotions for nondurable
goods in the U.S., the largest share of a marketing budget is usually spent on trade
promotions (44.3%). The trade portion of the marketing budget is considered to
be the fixed cost of being in the store, keeping up with the competition in terms of
shelf "treatment" and developing good relationships with the retailers. Marketers
often feel much more flexibility in deciding how to allocate the other half of their
6
promotional budget between traditional advertising and consumer promotions.
While advertising's share of spending surpassed consumer promotion spending by
8% as recently as 1988, that gap had closed to only 5% just two years later m 1990. This trend toward consumer promotion and away from traditional media
has been attributed to a number of factors including: the high cost of producing,
distributing and airing traditional forms of advertising, the difficulty of "breaking
through" the glut of media with a meaningful communication, and the reportedly
increasing interest in some kinds of consumer promotions among the average
shopper. Whatever the reasons, marketers today are clearly signaling their ever
increasing confidence in and use of consumer promotions, even when it means
cutting budgets for traditional advertising.
Types of Consumer Promotions
There are several types of consumer promotions widely used by marketers
today. Two types of promotions, coupons and in-store price features, generally
allow the consumer to realize a savings when they purchase a product in the store.
The most common form of a coupon requires that a consumer clip it from some
printed advertisement and redeem it at the check-out counter in the store for a
specified value. The most common in-store price feature takes the form of a
special sale price advertised right on the product shelf such that consumers know
that they are buying the product at an already reduced price. As with all consumer
promotions, these two common forms can be altered in a number of ways.
Particularly in recent years, coupons and in-store price features have been
creatively designed to appeal to consumers. For instance, rather than receiving a
product for a specified price off, either with a coupon or price feature, the product
could be sold on a "two-for-one" deal or a "buy one large size package and get

another smaller size package free." However they are designed, consumers have
become accustomed to seeing both coupon offers and in-store price feature offers.
7
Another form of consumer promotion with which shoppers have become
familiar is the refund offer. While refunds also allow a consumer to save money,
that savings is generally not realized until they write to the manufacturer and show
some proof-of-purchase in return for a check in the amount of the sale or a
voucher for a free or reduced priced product in the future. For example, Gerber
recently offered a $5.00 refund for proof-of-purchase of fifty jars of baby food.
Like coupons and price features, refunds have taken many creative forms in the
past ten years. Consumers can be required to buy more than one unit of the
product or to buy more than one product from a family of products that the
manufacturer sells. The two things that all refunds generally have in common are
the requirements that a written request must be made to the manufacturer and some
proof-of-purchase must be shown such as the UPC code from the product label or
a register receipt.
A fourth type of consumer promotion, the sample offer, has gained
widespread acceptance in the past few years. Samples are usually small amounts
of a product provided to consumers to give them a first time trial of the product or
to get them to try it again after a period of nonuse. Samples can be small amounts
of free product handed out to shoppers to taste or drink right there in the store or
they can be small size packages for consumers to use at home in their own good
time. While many samples are provided free of charge, some are sold in small
packages at a low enough price to entice consumers to give the product a try. A
few samples have even been distributed only upon request via a 1-800 number
( e.g., Cheer Free Laundry Detergent provided only to skin sensitive consumers who
called the advertised phone number and requested a sample).

8
Another type of consumer promotion, the premium offer, has long captured
the imagination of marketers. This is probably because of the opportunity a
premium can provide in terms of building a positive attitude about a product
among consumers by giving them something really "special," preferably with the
product's brand name printed all over it. A premium is a special gift offered to a
consumer who meets the requirements of a particular product purchase. The
special gift is usually not money and it is often tied in some way by its very nature
to the product it is intended to promote. For example, Tropicana recently offered
their users a "free" Tropicana branded juice pitcher in exchange for proof-of
purchase of Tropicana Orange Juice and Cheerios packed into each box a free
color change cereal spoon featuring a Lion King character on the top. Not
surprisingly, premium gifts have taken many forms from the very expensive such
as a free trip (given an enormous number of purchases of a product) to the not so
expensive such as a free baseball card in a package of Cracker Jacks. Premiums
can be included right in or on the package of a product or they can require writing
the manufacturer and sending in UPC's, cash receipts, and at times some amount
of money to defray the manufacturer's cost of the gift and/or the shipping and
handling.
Although many people consider them just another form of advertising, both
sweepstakes and contests are technically a form of consumer promotion. While
the two are often confused, they require significantly different things from
consumers. Sweepstakes are simply games of chance which require nothing on the
part of the consumer except a willingness to try their luck. In fact, by law,
manufacturers must give all individuals a chance to win a sweepstakes even if they
do not purchase the product it is supposed to promote. The hope of most
manufacturers, of course, is that only purchasers of the product will see and be
9
motivated to enter the sweepstakes. Entering a sweepstakes can require nothing
more than opening a package, scratching a game card, or matching lucky pieces to
an in-store display, but some may require sending in an entry form and waiting for
the results of a drawing to be announced. A very familiar example is the
sweepstakes promoted by the Publishers Clearinghouse. In contrast to
sweepstakes, contests require some special skill or accomplishment on the part of
the consumer such as taking a winning picture, completing a word puzzle, or
writing an essay. In general, most consumer contests are designed to be easy
enough for the user of the product to enter without having to work hard at it,
otherwise it is said the contest may decrease the likelihood of future purchase by
promoting a negative attitude toward the brand.
The last of the seven common types of consumer promotion is sponsorship
of a special event or program. This is a particularly difficult type of promotion to
define since it can take on vastly different forms. The type of event sponsorship
consumers would probably be most familiar with would be sponsorship of a
charity event such as McDonald's sponsoring the Jerry Lewis Telethon and the
Ronald McDonald House for children with illnesses or sponsorship of a sporting
event like M&M/Mars sponsoring the Olympics. Manufacturers can also sponsor
their own event like budgeting money to have the 7-up "spot" character or
Pillsbury "doughboy" character show up at a grocery store for a special occasion.
While there are many types of sponsorship of events, they are all usually designed
to help build a positive brand image, and therefore, generate greater sales among
consumers.
Although the majority of consumer promotions take the form of one of the
individual types described above, some of the most creative initiatives have been
combinations of two or more promotions. Such combinations are called "cross
10
promotions" and have been growing in use by manufacturers in the past few years.
Examples of cross promotions would include: a coupon which can be redeemed
for a regular size package at reduced price or a small trial size package for free, a
sponsored event at which prizes are offered to winners of a sweepstakes, or an in
store sampling program where the samples are passed out along with coupons for
the promoted product. Cross promotions often occur simply because of the
efficiencies inherent in running two promotions at the same time, but there is also
a strong belief that combining promotions will increase their impact on the
consumer. The logic behind this follows the old adage of "a whole is often greater
than the sum of its parts."
In addition to being combined, consumer promotions can also be delivered
in a variety of ways. Some of the more common vehicles of delivery include
newspapers, magazines, direct mail, in/ on pack, in-store displays, and traditional
advertising. There are a number of less common delivery vehicles which are used
at times to reach specific consumer target groups. Such less common vehicles
include door-to-door, mall-intercept, retail demonstration, consumer request (via
mail or phone), and electronic media (in-store coupon dispensers, computer
shareware). For a marketing executive, choice of delivery vehicle depends on the
probability of reaching the consumer group via each particular vehicle and the
average cost of delivery per consumer.
Manufacturer/Consumer Usage of Promotions
While the seven consumer promotions discussed above are the most widely
used, there are clear differences among them in the extent of their usage as a
marketing tool by manufacturers. Importantly, the three types of promotions
viewed as the most economically motivating to consumers ( coupons, price features

11
and refunds) are also the three most often used. Of those three, coupons and in
store price features are used more often by manufacturers than refund offers. In
fact, Donnelly Marketing ( 1991) noted that 95% of the manufacturers they·
surveyed reported having used coupons and 88% reported having used price
features as part of their promotional arsenal in 1990. Interestingly, smaller
companies, those with less than 1 billion dollars in annual sales, were more likely
to have used coupons (97%) and price features (92%) than had companies with
larger annual sales of which 93% said they had used coupons and 82% said they
had used price features. This may reflect the fact that larger companies tend to
divert more of their promotional dollars into traditional advertising or into more
creative types of promotions such as premiums and samples. Refunds were used
about equally by both large and small companies, averaging about 75% reported
usage as a consumer promotional tool.
Each of the other types of consumer promotions, samples, sweepstakes and
contests find their greatest usage among larger companies. In general, over half of
these manufacturers reported using samples ( 68% ), sweepstakes ( 68% ), and
premiums (62%) in 1990. Not surprisingly given the more complicated demands
they make on both the manufacturer and participating consumer, contests were
reportedly used by fewer companies (31%). No current reliable estimates of usage
are available for event sponsorship. This is due in large part to their rather
undefined nature as well as their extremely short term duration in many cases.
Many companies use available estimates of general manufacturer usage of
the various types of consumer promotions to help guide their own promotional
allocation decisions. This results in what is tantamount to a "follow the leader
approach" to budgeting. Unfortunately, accurate estimates of the number and type
of consumers who actually choose to participate in many of the various

promotions offered to them are not available. Obviously, marketers could make
better allocation decisions if they were able to evaluate their choices based on
consumer reactions as well as industry usage trends.
12
Unlike most other promotions, estimates of consumer use of coupons are
readily available due to the fact that coupons must be processed through one of the
few large coupon clearinghouses in the United States. Recent estimates show that
of the 292 billion coupons distributed in 1991, approximately 2.5% or 7.5 billion
were redeemed by consumers, resulting in a total savings of over 4 billion
consumer dollars. A.C. Nielsen's coupon control center has reported that 77% of
respondents to a national survey of primary grocery shoppers classified themselves
as coupon users. In fact, on average these respondents reported redeeming about 8
coupons per week. These numbers are, of course, inflated by the 29% of coupon
users who are actually very heavy users, redeeming nine or more coupons on
average each week (Nielsen Clearing House Promotional Services, 1992).
In general, accurate estimates of participation are unavailable for most other
types of consumer promotions. A.C. Nielsen has reported that redemption rates
for refund offers that pass through their clearinghouse have ranged from about 1 %
to 5% depending on the delivery vehicle and size of the refund offer (Nielsen
Clearing House Promotional Services, 1992). However, this underestimates
product purchase stimulated by interest in refunds given that many consumers
purchase a product with the intention of mailing in for the refund, but never quite
get around to it. Few other published estimates exist which help to document
redemption or participation rates by consumers. As unbelievable as it may seem,
many manufacturers simply do not spend the extra money to keep track of the
consumer response to their promotions (Gardner & Shuman, 1987). Even when
13
such estimates of participation are determined, they are seldom made available to
the marketing or research communities at large.
Most marketers would probably agree that what they lack most in terms of
making their consumer promotional design and budget decisions is a basic
understanding of how often and why promotions affect shoppers. As noted,
simple participation rates are often unavailable. When they are available, they are
often incomplete or inaccurate. Even more difficult to obtain is a unified theory or
set of principles about consumer reactions to promotions to help guide the decision
making process. While most of the research in this area has focused on minute
aspects of consumer reactions to promotions ( e.g., What should the face value of a
coupon be? What size coupon elicits the greatest redemption?), a few general
theories have been put forth to help form a more comprehensive explanation of
consumer promotional usage. Taken in combination, past research on specific
aspects of consumer reactions to promotions and general marketing and
psychological theories about those reactions can provide good direction for future
research.
The Consumer Dynamics of Promotional Usage
A review of the literature on consumer reaction to promotions revealed that
the focus of past research has been on four major determinants of promotional
usage. Those determinants include: 1) the perception of costs and benefits, 2) the
influence of past behavior, 3) the effects of preexisting category involvement and
brand loyalty, and 4) the influence of person predisposition factors. Coupons and
point-of-purchase (POP) price reductions have been the dominant stimuli of
interest in each of these research areas because in the past they have been the most
widely used forms of promotion by manufacturers.

14
The Perception of Costs and Benefits
Taken as a whole, past research has shown that the psychology of
promotional usage can be at least partially understood via an information
processing approach to the determination of behavior. That is, many promotional
usage decisions have been shown to be heavily motivated by the outcome of a
decision process which weighs the costs against the benefits of participating in a
promotion. Specifically, promotions are more likely to be used by a consumer
when the perceived rewards of usage outweigh by some acceptable margin the
perceived risk or trouble involved in usage. While there are a variety of costs and
benefits which have been demonstrated to be factors in the consumer decision
making process, most studies have attempted to isolate the effects of only one of
them at a time. The following discussion will outline those key studies and their
various findings.
As noted, a number of published reports have shown that consumer
promotional decisions can be heavily negatively influenced by the perceived costs
involved in participation. Those costs can be classified into four major types
including: 1) financial, 2) cognitive time and effort, 3) physical time and effort,
and 4) opportunities lost or bypassed. Of course, not all of these costs come into
play in every situation or for every consumer, which in addition to the many
varieties of promotions used as stimuli, is one of the reasons that research findings
have not always been consistent.
The most obvious cost that can be incurred by promotional participation is a
financial cost. While coupons and POP price reductions rarely require that the
consumer incur a direct financial cost beyond purchasing the product, other forms
of promotion often do. A few examples would include: a mail-in premium offer
which requires submitting money along with proof-of-purchase, a sweepstakes
15
which requires postage for sending in entries, and a telephone request for a free
trial size which can only be obtained by calling a 1-900 number. As expected,
promotions which involve lower financial costs usually result in the greatest
participation rates (Donnelly, 1991; Nielsen Clearing House Promotional Services,
1992). So, coupons for free products result in greater redemption than coupons
which provide cents-off the regular price, free premiums sell out faster than
premiums which require an additional cost, and 1-800 numbers generate a greater
response than 1-900 numbers. In other words, the numbers show that when
seeking a good "deal," consumers want to spend as little money as possible.
Research has also shown that consumers want to incur as few non-financial
costs as possible, costs such as the expenditure of cognitive effort and time. A
quick trip to the supermarket will confirm the considerable cognitive cost which
can be involved in shopping, in general, and in promotional usage, in particular.
Just deciding when, where and what to buy can require the consumer to make
decisions about how far they want to travel, how much time they want to devote
and how much they want to spend. Promotional decisions can significantly add to
that expenditure of cognitive effort and time as consumers evaluate and decide
which promotions to use and try to remember to collect or redeem proofs-of
purchase, coupons, refund slips or entry forms.
The fact is, however, that consumers often do not want to commit such
valuable cognitive resources to choosing which loaf of bread to buy this week.
The average consumer seems unwilling or unable to carefully process every detail
of every purchase decision, even to find a good deal. In their study of consumers'
search for products and knowledge of prices, Dickson and Sawyer (1990) found
that consumers seem to expend surprisingly little cognitive effort while grocery
shopping. Trained observers in four stores, posing as employees stationed at the
16
point-of-purchase in four product categories, found that only 55% of consumers
said they had checked the prices of the product they put in their shopping cart.
Only 3 2% bothered to compare prices to help choose between brands. Dickson
and Sawyer also found that neither shoppers who were aware of specially priced
items ( via store advertising) nor those who actually purchased the "special" items
spent any more time at the point-of-purchase comparing brands than unaware
shoppers. Many of the shoppers it seemed, were relying on the store to determine
the best deal for them and then to cue them to that deal through shelf signage or in
store circulars.
Inman and McCalister (1991) and others (Buzas & Marmorstein, 1988;
Dickson & Sawyer, 1990; Inman, McCalister & Hoyer, 1990) have shown that
many consumers do, in fact, rely on the presence of an explicit price promotion as
an easy cue to finding the best deal. In a field test conducted in a campus grocery
store in nine product categories over a ten week period, Inman and McCalister
noted a tendency for some consumers to react to any P-O-P promotion signal such
as a sale sign as if it were an indication of significant savings, even when there
was no actual reduction in the shelf price of the advertised brand. In their product
search and price knowledge study, Dickson and Sawyer (1990) noted that even
when promotions did offer some savings, consumers typically overestimated their
savings by 10%. A number of authors have agreed that this promotion signal
effect may indicate the existence of a cognitive short cut or heuristic for
consumers (Grover & Srivinisan, 1989; Guidagni & Little, 1983). Such a short cut
could be used by manufacturers to increase profit margins by as much as 11 % if a
viable interspersion of significant and nonsignificant discount promotions could be
identified (Inman & Mccalister, 1991).

17
Consumers have used similar short cuts to reduce cognitive processing costs
when considering participation in other types of promotions such as sweepstakes
and contests. In their review and synthesis of information processing research and
gaming research, Ward and Hill ( 1991) noted that rather than computing the actual
odds of winning a contest or sweepstakes, consumers usually use heuristics or
simplifying rules to help them determine whether or not to participate. The
authors suggested that consumers rely heavily on the Availability and
Representativeness Heuristics (Kahneman & Tversky, 1982) which is why
advertising for these two types of promotions may work best when descriptions of
the odds of winning are designed to create top of mind examples ( e.g., 5000
people will win!) or familiar/similar examples (e.g., Joe Average won last month!).
Again, it seems that consumers prefer to rely on manufacturers to help them get a
good "deal," this time a better chance to win something for nothing.
Overall, studies have shown again and again that given a choice, consumers
prefer promotional practices which help decrease their cognitive resource
expenditure. In a study which investigated the effect of price reductions at two
different levels, each expressed in two different forms ( absolute price and price per
unit) on the relative market share of brands, Anderson (197 4) showed that when
there was little else to differentiate between brands in a category, consumers
would choose the brand where savings were expressed in absolute terms rather
than in per unit terms. In fact, in this study less than 10% of shoppers reported
ever using the unit price information in store. Bearden, Lichtenstein and Teel
( 1984) noted a similar tendency to prefer simplistic comparison information in two
separate studies of over 500 primary grocery shoppers. Their results confirmed
the earlier report by Blair and Landon ( 1981) that consumer reactions to retail
newspaper advertisements were enhanced when both a regular and sale price were
included rather than just the sale price alone. Inclusion of both prices seemed to
make it easier for consumers to calculate their overall savings and, therefore, to
simplify their cognitive workload.
18
Of course, setting out to find a good promotional deal can add significantly
to physical time and effort costs as consumers begin reviewing/sorting offers,
saving/clipping/organizing coupons and refunds, buying/trying samples, and
playing sweepstakes or contests. All of these activities require time and effort that
consumers are loathe to spend. A variety of studies have found that participation
in promotions of all types significantly decreases as physical costs increase (Jain,
1990; Nielsen Clearing House Promotional Services, 1985). Chakraborty and
Cole ( 1991) investigated the effects of coupon characteristics on brand choice
among 120 college students who were asked to purchase candy bars on ten
separate occasions. On the seventh occasion students were randomly given a
coupon which characterized one of four conditions (high value/low effort, high
value/high effort, low value/low effort, low value/high effort). Redemption rates
were found to be highest for the high value/low effort condition and lowest for the
low value/high effort condition. In another study among 232 adult consumers,
Gould (1987) found participation highest in sweepstakes and contests which were
perceived to be easier to enter. These findings were supported by Nielsen
Clearing House Promotional Services (1985) two years later in a national
telephone survey of 2000 primary grocery shoppers. Similar results have been
reported for both premiums (Seipal, 1971) and rebates (Jolson, Wiener & Rosecky,
1987). Interestingly, Jolson, Wiener and Rosecky reported that the perception of
physical effort and time costs was a better discriminator between frequent, light
and non-users of rebates than the actual physical costs incurred. Overall, studies

19
seem to suggest that consumers strive to spend as little cognitive and physical time
and effort on promotional participation as possible.
The fourth type of cost involved in promotional participation is the
perception of opportunities lost or bypassed during the decision process and once a
decision has been made. While there has been little research in this area it would
seem that the choice of one product over another or one brand over another would
create a perception of a lost opportunity. For example, choosing a specially priced
bottle of ketchup over a bottle which offers a free sample of barbecue sauce with
every purchase could be considered an opportunity lost. For many brand loyalists,
choosing a promoted brand over their favorite brand would clearly create the loss
of opportunities to enjoy the product they have come to know and trust.
Marmorstein, Grewal and Fishe ( 1992) recently developed a model of the
subjective value of time in an effort to explain the additional opportunity costs of
time spent comparison shopping for a good deal. As with all decisions, the
purchase and promotional decision involves some gains and some losses
(including opportunities lost). In the end, the question becomes do the perceived
losses outweigh the perceived gains in the consumer's mind.
As consumer participation has increased in recent years, quite a few studies
have been published concerning the perceived gains or benefits of the decision to
use a promotion. In a review of relevant research, Schindler (1989) noted that
there are two major types of benefits which can be derived from promotional
usage, financial benefits and psychological benefits. Financial benefits refer
simply to the utility of the money saved by using a promotion. A few examples
would include the future usefulness of money saved by: a) using a $.50 coupon on
the purchase of a box of cereal, b) receiving a free coffee mug for the purchase of
a pound of coffee, or c) winning a free vacation in a sweepstakes sponsored by a

20
cigarette manufacturer. Each of these examples demonstrate either a direct
financial savings when purchasing a product (e.g., $.50 price reduction) or an
indirect savings due to receipt of a "free" gift from a manufacturer (e.g., free mug,
free trip). The second type of benefit, the psychological benefit, refers to the
effect of a promotional decision on a consumers affect or self-concept.
Specifically, how does participation in a promotion make the consumer feel?
Winning a free vacation is likely to make most people feel wonderful, but the
psychological effect of getting a $.50 reduction on the price of a box of cereal or
receiving a free coffee mug can also make consumers feel pretty good.
One major point made by Schindler (1989) in his review paper on the
excitement of getting a bargain is that both financial and psychological benefits are
acknowledged only to the extent that the consumer feels responsible for them.
Forced purchase of a promoted brand due to the unavailability of a regular brand
will likely incur little benefit as will an unknowing purchase of a promoted brand
(Kahneman & Tversky, 1982; Schindler, 1984a). Studies have shown clearly that
consumers were more satisfied when they took some action, either mental or
physical, to find a discount (Schindler, 1984a; 1984b). It seems interesting,
indeed, that in order to gain a benefit from some types of promotional
participation, consumers have shown a need to incur at least a minimal level of
mental or physical cost. Scott (1976) noted a similarly surprising finding in a
study on the effects of trial and incentive on repeat purchase behavior. He found
that small incentives were often more effective than either no trial incentive or a
very large trial incentive. In other words, in weighing the benefits against the
costs of promotional usage, research has shown that the scale should not be too
lopsided in either direction.
21
In an investigation specifically of financial benefits, Diamond and
Campbell ( 1989) demonstrated that consumers perceive two types, reduced losses
and value added. In their study, 103 students from a marketing class were
assigned to one of four groups. Each group was exposed to a different
promotional history for the same laundry detergent brand via a 20 week pricing
and promotion information packet. Each page of the packet represented the
price/promotion status of the detergent on a given week. In the control group, the
weekly price ranged from $3.30 to $3.62. In each of the other groups, a promotion
was offered every 3 weeks. In group 2 the promotion was $1. 00 off of the retail
price (compared to control), group 3 was offered extra amounts of the product
(28% more - a $1.00 value) and group 4 was offered a premium (a free fabric
softener - valued at $1.00). After exposure to the 20 week history, students were
asked several questions regarding the price and quality of the product. Findings
from the study indicated that the three types of promotions produced no significant
differences in the perception of product quality as compared to the control group,
but did produce some differences in the perception of price. Price of the laundry
detergent was perceived to be significantly lower in group 2 where the monetary
discount promotion was offered. Price perceptions were found to be statistically
similar for the premium offer group, the extra product group and the control group.
The authors suggested that both the "value-added" promotions (premiums and
extra product) were perceived by consumers as gains, while the monetary price
reduction was viewed as a reduced loss. This investigation was the first to indicate
that different kinds of promotions are perceived by consumers to provide different
kinds of financial benefits. Prior to this, the heavy use of monetary promotions as
research stimuli had created an overwhelming belief that all promotions were
perceived by consumers as reduced losses.

22
A variety of studies on the perception of reduced loss have been conducted
over the years using monetary promotions as stimuli. Fairly consistently the
results have shown participation to be positively correlated with the face value of a
promotion (Jolson, Wiener & Rosecky, 1987; Nielsen Clearing House Promotional
Services, 1992). In a prototypical field experiment designed to determine the
effect of different coupon face values on sales of an established brand, Bawa and
Shoemaker ( 1987) reported that higher face values generally yielded greater
redemption rates. They also showed, however, that at some point a threshold level
was reached where the redemption rate stabilized. NCH Services, which has
reported similar findings over the years, recently published product category
specific threshold levels of coupon redemption to help manufacturers determine
the most efficient face values for their coupons.
The increase in redemption which occurs as face values rise has been at
least partially explained by the fact that more valuable monetary promotions attract
a wider audience of consumers. Shoemaker and Tibrewala (1985) conducted
personal interviews with 280 shoppers in the greater New York metropolitan area
in order to assess the relationship between past purchasing of a brand, face value
and redemption rate. Consumers were asked about their past five purchases of
brands in four product categories. They were then asked to assess the likelihood
that they would save and use a coupon with a specific face value. The findings
corresponded with later work by Neslin and Clarke (1987) in that the percentage
increase in redemption was greater among non-regular brand buyers than among
regular buyers as face values increased. Similar findings have been reported for
redemption of rebates (Jolson, Wiener & Rosecky, 1987). Results from studies
such as these have served to highlight the importance of the derivation of financial
benefits as a key factor considered in any promotional usage decision.

23
As noted previously, however, another key factor can weigh in on the plus
side of a promotional usage decision. That factor is the perception of
psychological benefits which can be derived from promotional participation. In
their most recognizable form, psychological benefits can be simple rewards which
positively effect a consumers immediate affective state. A few such simple
psychological benefits would include the "fun" of attending a promotional event,
the "excitement" of scratching the silver coating off of a sweepstakes game card or
the "mental challenge" of competing in a promotional contest. In a number of
studies and reviews, researchers have shown the value to consumers of such
simple motivators (Schindler, 1989; Ward & Hill, 1991 ).
Research has also shown that the promotional usage decision can be heavily
influenced by a more complex type of psychological benefit, a benefit which
impacts a consumer's self-concept (Schindler, 1989). That is, by participating in
promotions consumers may be able to find outlets for demonstrating some
desirable personality characteristics which they can not demonstrate easily in other
aspects of their life. For example, in interviews with over 200 adult consumers on
their experience with promotional games, Gould (1987) found that games with
charitable sponsors had greater participation (35%) than those sponsored by
businesses (20%). Gould also noted that consumers reported feeling good about
their donation, even when they lost the game. All else being equal, it would seem
that participation in sweepstakes with charitable sponsors provided some benefit to
the participants beyond that provided by other sweepstakes. It could be argued
that charitable sponsorship allowed Gould's consumers to feel a little like "good
Samaritans" through participation. If this were true, the perceived costs of
participation may be small for some consumers in comparison to the ego-boost
which could be derived.
24
Another self-concept related benefit which has been reported to be derived
from promotional participation is much less humanitarian in nature. A number of
studies have shown that consumers may get an ego boost from perceiving
themselves as getting a good deal and, therefore, perceiving themselves as "smart
shoppers" (Conover, 1989; Jain, 1990; Schindler, 1984a, 1984b, 1989). In a study
examining the impact of three factors on coupon usage (attention/awareness,
discount information and price choice), Schindler (1984a) coined the phrase
"coupon effect" to refer to the fact that participants in his study preferred coupons
to other types of promotions because they said coupons made them feel as if they
had acted intelligently to win a discount. In this study, a laboratory shopping
game was devised in which players made 48 brand choices based on value and
quality perceptions. In each experiment, two opponents began with equal amounts
of money. The participants were told that the one with the most money after the
game ended was the winner. Each was given a list of 12 grocery categories and
the prices of five brands within each category as well as corresponding coupon
offers. The coupon offers were available for half of the brands in each category.
Other promotions such as shelf talkers ( ads without dealing) and sale signs were
also available. In addition to shopping for price value, players also received $.25
for selecting the highest quality brand in each category. The findings clearly
showed that players preferred coupons over low POP shelf prices, shelf talkers and
"on sale" signs because coupons created more of a perception of "actively
winning" a discount by being a smart shopper.
In their field studies on coupon and POP sale usage, both Schindler (1984a,
1989) and Jain (1990) reported that consumers often had a positive ego related
reaction to searching for and getting a good deal. That is, when a deal was
obtained, consumers said they often felt thrifty, satisfied, proud of their
25
accomplishments and fulfilled in their role as either a consumer or as a
homemaker. In comparison, when consumers felt a better deal existed that they
were not able to take advantage of, they felt wasteful, gullible, incompetent;
resentful and even "taken for a ride." In fact, it has been suggested that for some
full-time homemakers, getting a bargain may be one of the few available
opportunities to demonstrate intelligence and competence outside the home. In
essence, providing some consumers with the ability to feel like "smart shoppers"
may be one of the most powerful benefits of promotional participation.
A Holistic Cost/Benefit Perspective Via Attitudinal Theory
While most of the studies discussed above have focused on only one or two
specific costs or benefits of promotional usage, a few others have taken a more
holistic approach to the promotional participation decision, at least as it relates to
coupons. These studies have generally used attitudinal theory as a basis for
understanding how consumers process cost and benefit information to arrive at a
valent attitude and eventually a behavioral intention. Several studies, in fact, have
been conducted on the application of the Theory of Reasoned Action (Fishbein &
Ajzen, 1975) to couponing behavior (Miniard & Cohen, 1983; Ryan, 1982; Ryan
& Bonfield, 1980; Shimp & Kavas, 1984). In short, the Reasoned Action Model is
an information processing model which suggests that attitudes and subjective
norms are direct predictors of behavioral intent, which in turn is the best predictor
of actual behavioral.
What makes the Fishbein and Ajzen model particularly well suited for at
least partially understanding the coupon usage decision is the fact that both of the
two antecedents to behavioral intention, the attitude toward the object and the
subjective norm, have costs and/or benefits at their root as shown in Figure 2.

26 Outcome
Beliefs Attitude
Toward
Valence of the
Beliefs Object
~ Behavioral
/ Intention Behavior
Reterent
Group Subjective
Motivation Norm
to Comply
Figure 2. The Reasoned Action Model.
In this model, attitude toward a behavioral object such as coupons is determined
by a consumer's beliefs about the behavioral outcomes of coupon usage as well as
by the consumers beliefs about the valence of those outcomes. Outcomes with a
positive valence ( e.g., saves money on the grocery bill) are perceived as benefits
and outcomes with a negative valence (e.g., takes time to clip coupons) are
perceived as costs. The overall attitude toward the object is then determined by
the weighted perceptions of the outcomes of usage or, in other words, the sum of
those perceived costs and benefits in the consumer's mind. The subjective norm
component of the model, on the other hand, incorporates the social costs and
benefits which can be derived from interaction with the attitude object. In the case
of coupons, the subjective norm component includes the social costs and benefits
which are incurred from coupon usage due to how other people in a consumer's
life feel about coupon usage. In essence, the subjective norm component allows

27
for the impact of social pressure on behavioral intentions. For a consumer
considering coupon usage, how others (e.g., family, friends, neighbors, society)
feel about using coupons may be an important determinant of future intention.
The importance of the social component in this arena can be attested to by the
positive change in attitudes toward coupon usage and the resulting change in
redemption rates which have been reported over the past decade.
Early work in this area was largely concerned with extending and
validating Fishbein and Ajzen's original model (Fishbein & Ajzen, 1975). Market
researchers including Ryan and Bonfield (1980), Ryan (1982), Miniard and Cohen
(1983) and Shimp and Kavas (1984) probed thousands of shoppers about their use
of coupons in order to analyze the proposed relationships between the original
model's components. Of particular interest to most of these investigators was the
existence of a nonrecursive relationship between the attitude toward the act and
subjective norm components of the model. Their efforts proved fruitful in that the
major constructs and relationships defined by the Reasoned Action Model ( which
all in some way help identify costs and benefits of behavior) were shown to be
moderately useful in predicting people's intentions to use coupons in the future.
Clearly, however, the predictive power of the original model, which did not
directly account for consumer predispositions to use promotions or past usage of
promotions (habits) was not strong enough to warrant widespread notice by
marketers or market researchers.
The Influence of Past Behavior
In a logical extension of work on the original Fishbein and Ajzen theory,
Bagozzi, Baumgartner and Yi ( 1991) heightened significantly the explanatory
power of the Reasoned Action Model for the promotional arena by adding the
28
important factor of past behavior. The addition of this variable, of course, follows
similar work in other behavioral areas by researchers such as Triandis (1979),
Bentler and Speckart (1979) and Ajzen and Madden (1986). In their study on
coupon use and the Theory of Reasoned Action, Bagozzi, Baumgartner and Yi
asked a sample of 149 female staff members between the ages of 18 and 63 at a
major university to complete two consumer questionnaires one week apart. The
first questionnaire measured each of the Reasoned Action constructs including:
attitudes toward coupons, attitudes of relatives, friends and society toward coupon
usage, and behavioral intention to use coupons. The second questionnaire
measured interim coupon usage. The findings suggested that when past usage
(habit) was included, the model proved to be a fairly good predictor of claimed
intent to use coupons, accounting for roughly 65% of the total variance measured.
Importantly, past coupon usage was the single best direct determinant of intention
to use coupons, exceeding the direct individual influence of both the attitude
component and the subjective norm component. One explanation of this finding is
that moderate to heavy past usage may actually tap into habitual patterns of usage
(Triandis, 1980). Habits would be expected to bypass the active decision process
to have a direct influence on behavior.
The importance of prior experience using promotions has been documented
time and time again in a variety of other less attitudinally based studies (Conover,
1989; Nielsen Clearing House Promotional Services, 1985; Price, Feick &
Federovich, 1988). In one such study, Bawa and Shoemaker (1987), who
examined 300,000 purchase records from the purchase diaries of 3000 households
over a year, noted that heavy coupon users in one product category were likely to
be heavy coupon users in other product categories. In another purchase record
based study of 8,500 households, designed to explore the effectiveness of
29
manufacturer's coupons on stimulating trial among consumers, Shababb (1987)
reported that coupon redemption was highest among previously heavy coupon
redeemers, suggesting the existence of a habitual behavior pattern. In fact, he
found that 25% of households in his study accounted for 70% of the total coupon
usage. Shoemaker and Tibrewala ( 1985) similarly found that in 280 personal
interviews 61 % of consumers who had made five or more previous brand
purchases with a coupon definitely planned to use a coupon to purchase that brand
in the future. This was compared to only 7% of consumers who had never
previously purchased that brand with a coupon, but planned to do so in the future.
Parallel findings have been reported for other types of promotions including
rebates, sweepstakes and contests (Gould, 1987; Jolson, Wiener & Rosecky,
1987).
Kalwani and Yim (1992) recently published the results of an interactive
computer shopping experiment among 200 undergraduate students which
suggested another logical reason why prior promotional experience may be fairly
predictive of future use. Findings from this research, which exposed students to
price and promotion information for two competing brands of laundry detergent,
corroborated a previous report by Shoemaker and Shoaf ( 1977) that as consumers
became used to receiving the financial benefits of monetary promotions, they
became unwilling to pay full price. In fact, their results indicated that as both the
number of price promotions and the level of discount offered by those price
promotions increased, consumer willingness to pay full price proportionally
decreased. Taken more generally, it may be reasonable to hypothesize that as
consumers become accustomed to receiving either reduced financial costs or an
increase in other types of benefits from participation in promotions of all types,
they become increasingly less likely to buy products which do not provide those

30
benefits. In essence then, past promotional usage may indirectly effect future use
or intent to use promotions by impacting expectations about the costs and benefits
which can be derived from their use.
The Effects of Category Involvement and Brand Loyalty
Two additional factors which have been shown to heavily influence
promotional usage are category involvement and brand loyalty. Both have been
demonstrated to be better predictors of usage than any purely demographic profile
devised thus far. While these factors have generally been explored separately,
they should be understood to function similarly. Each seems to function primarily
as a mediator of the cost and benefit decision by defining the acceptable set of
brands that a consumer would be willing to consider buying or the acceptable
range of brand related costs and benefits a consumer would be willing to incur.
Buying outside that acceptable set of brands would theoretically cause the
opportunity costs (lost opportunity to use acceptable brands) to be too great. In
the end, by determining the range of brands to be considered, category
involvement and brand loyalty eventually define the set of promotions available to
a consumer.
The first of these two factors, category involvement, refers to a true interest
on the part of the consumer in the products available in a category and the
products purchased for personal use. A category involved individual generally
wants to find the "best" available product. Of course "best" may mean different
things to different consumers. In the cereal category, for example, best could be
defined by nutritional value, taste, fruit and nut content, texture, legitimacy of
parent brand name and a multitude of other dimensions. For each consumer,
category involvement is probably best determined within the context of each
31
individual category. It seems unlikely that consumers are equally involved in all
categories of their purchases. While a consumer may be highly involved in the
cereal category, he or she may care very little about the purchase of a type or
brand of yogurt. In essence then, the factor of category involvement depends
heavily on the specific individual and the specific category of interest.
Research has suggested that in some ways strong category involvement
should serve to increase a consumer's propensity to use promotions. In consumer
research, the assumption is made that consumers are more likely to attend to
information that is useful to them in making a product judgment (Lynch & Srull,
1982). Specifically then, interest in a product category should result in a
heightened awareness or attention to category relevant information. It would make
sense for category involved consumers to be more likely to seek information which
would help them choose the "best" product to purchase. Highly involved
consumers could seek such purchase relevant information prior to a store visit,
compare products while at the store, and discuss products and deals with friends
and family (Holmes & Lett, 1977). The increase in exposure to promotions
resulting from this information search may translate into a greater likelihood to use
promotions.
However, strong category involvement has also been shown to
simultaneously translate into a decreased likelihood to use promotions. In a study
designed to investigate the relationship between category involvement and the
importance of product related deals (i.e., price cues) in making purchase decisions
in the wine category, Zaichowsky (1988) noted that highly involved consumers
relied heavily on product attributes unrelated to pricing/dealing. However, these
highly involved consumers, who responded to the self-administered questionnaire
which presented prices and grape variety information for nine wine brands, did not
32
completely ignore pricing information. Their ability to later recall prices was as
accurate as consumers less involved in the category. In comparison, less involved
consumers were reported to have made a simplified decision based solely on price
as shown by their inability to recall grape varieties with the same accuracy as
involved consumers.
Studies have shown, however, that when the category of interest has few
product attribute differences by nature, all consumers, including highly category
involved consumers, are forced to simplify their purchase decision by focusing
solely on price. In a study which investigated the effect of price reductions on the
relative market share of brands in two categories, one with product attribute
differentiation ( canned chili) and one with very minimal attribute differential
( canned peas), Anderson ( 197 4) noted that price became more important to the
overall decision process when there was little else available on which to evaluate
brands. This would suggest that for all consumers, including those that are highly
involved, promotions may be most effective in categories where prices and dealing
are the only factors which distinguish between brands.
Generally speaking, however, past research has made it increasingly clear
that category involved consumers make more complex decisions about what
brands to purchase (Jain, 1990) than the average consumer. In addition to
considering product attributes more heavily, as shown by Zaichowsky (1988),
category involved consumers have also been shown to consider the issue of getting
a good deal more thoroughly. In a study which examined the difference between
coupon proneness and value consciousness, Lichtenstein, N etemeyer and Burton
(1990) reported that involved consumers tended to make more sophisticated
judgments about getting the most for their money. In a survey of 350 shoppers,
the authors found that category involved consumers tended to be comparison

33
shoppers who used coupons when coupons actually provided the "best value"
( compared to other types of price deals) instead of relying on coupons as signals to
the best deal (the coupon effect). In sum, research seems to suggest that category
involved consumers evaluate many more dimensions before making a purchase
decision than non-involved consumers. In addition to simply being exposed to
more product information and promotions from the very start as a consequence of
actively searching for the "best" brand, involved consumers also take the time and
expend the energy to evaluate a range of product attribute and deal/value options.
Like category involvement, brand loyalty functions primarily as a mediator
of the cost and benefit decision by defining the acceptable set of brands that a
consumer would be willing to review or consider. Compared to category involved
individuals who seek out information about many brands within the category,
brand loyalists probably only consider information relevant to their purchase
decision of a much smaller set of acceptable brands due to the brand attachments
they develop. Brand loyalty has been operationalized in many ways, but in its
broadest sense it refers to a preference for one or more brands over other brands in
the category. This preference has been measured in the industry in a variety of
ways including strength of brand appeal, history/length of prior usage and share of
total requirements ( amount of one brand's usage as a percent of total category
usage). Measures which rely on actual previous behavior rather than attitudes may
be most appropriate given the dual nature of brand loyalty, a nature which can
stem from an active belief that the best brand has been found or from the sheer
habit of buying a particular brand.
Obviously, some consumers may become loyal because they have evaluated
all product alternatives based on some set of personal preference criteria and
determined that a particular brand or set of brands rise above the rest of the

34
category. Unlike category involvement, however, brand loyalty may not always be
based on this search for the "best" brands or types of product. Instead, it may be
based on sheer habit. Some of the most ardent coffee brand loyalists have ·
probably used their particular brand of coffee for years simply because it is what
they have always used. Such loyal coffee drinkers give new meaning to the phrase
"good to the last drop." In any case, little active decision making or information
searching is necessary to maintain this type of brand loyalty. In fact, it may just be
that some consumers become brand loyal to decrease the cognitive costs incurred
when engaging in an active decision process requiring a review of available
information about a variety of brands and deals in a category.
Early support for the thesis that brand loyalists selectively attend to
promotions available within their set of acceptable brands was provided in a
landmark study on deal proneness conducted by Webster (1965) which combined
four consumer variables including brand loyalty into a deal proneness index
through the use of regression analysis. Unfortunately, the four variables combined
explained only a small percentage of the total variation in deal usage observed.
More recent work by Brown ( 197 4 ), Guidagni and Little ( 1983) and Shoemaker
and Tibrewala (1985) has served to reaffirm the finding that brand loyalty is an
important determinant of a consumer's response to promotions. In personal
interviews among 280 shoppers, Shoemaker and Tibrewala assessed both prior use
of a brand and future intent to use the brand when provided with a coupon.
Results of the study indicated that as the number of previous brand purchases
increased, the probability of future purchases also increased. Specifically, only
7% of those who had never purchased the brand before claimed that they would
definitely purchase the brand given a coupon. This compared poorly to the 61 %
35
who had purchased the brand five or more times previously and said that they
would buy the brand with a coupon given a chance in the future.
Additional support for the selective attention hypothesis was provided by
Jain (1990) who reported that brand loyalty was negatively correlated to total deal
use. In fact, in a study which investigated the cost and benefit factors associated
with coupon usage based on data from a panel of 530 households in the greater
Buffalo area, Jain noted that usage was positively influenced by the
availability/opportunity for consumers to use coupons and negatively influenced
by two factors including: brand loyalty and the time/effort costs involved in
coupon usage. Similar reports of the limited range of promotions considered by
loyals have been made by Bawa and Shoemaker (1987) and Fader and McCalister
(1990). In addition, unlike category involvement, the influence of brand loyalty
has been so well accepted by the marketing community that it often determines the
strategy of brands with a significant loyalist user base or brands which have a
competitor with a large loyalist base (Raju, Srinivasan & Lal, 1990).
The Effects of Person Predisposition Factors
As seen in research on both category involvement and brand loyalty, the
cost/benefit decision for promotional usage seems to be influenced by some
relevant consumer characteristics or predispositions. A fair amount of research, in
fact, has demonstrated the moderately influential effects of a few consumer
characteristics which can be categorized as either person predispositions or
demographic factors. Theoretically, like brand loyalty and category involvement,
person predispositions and demographic factors should have a largely indirect
impact on the usage decision by influencing the perception of costs and benefits.
As time goes on, however, the active decision making process involved in category
36
and brand purchases may give way to the formation of habits which in turn may be
less related to the original consumer characteristics from which they came than
would be expected. This is due to the fact that some consumer characteristics are
subject to change over time (e.g., age, marital status). Overall, a few person
predispositions and demographic factors have been demonstrated to be related,
albeit moderately at times, to the promotional usage decision.
The person predisposition factor which has proven to be most fruitful in
terms of predicting promotional usage is that of "deal proneness." Deal proneness
refers to a tendency on the part of the consumer to be favorably disposed to use
promotions. Generally, this construct has been measured behaviorally in that deal
proneness has been identified via an index of the percentage of purchases made on
deal (Montgomery, 1970; Wieranger, 1974) sometimes adjusted for the relative
prevalence of deals (Carmen, 1969; Webster, 1965). Historically, these studies
have failed to present a cohesive definition or portrait of the deal prone consumer.
In fact, investigators of the proneness construct have failed to agree on
much except the fact that there is a group of consumers ( although there has been
little agreement on how to identify them) who seem more likely to use consumer
promotions ( although there has been little agreement on which promotions and
why). As noted previously, Webster (1965) coined the phrase "deal prone" in his
early work which combined the four factors of age, percentage of most frequently
purchased brand, number of different brands purchased and total units purchased
into an index of proneness using weights derived from a regression analysis. A
variety of authors since that time including Tat and Cornwell (1992), Bawa and
Shoemaker (1987), and Lichtenstein, Netemeyer, and Burton (1990) have focused
on consumers who are prone to use coupons specifically. Again, while each of
these studies has served to suggest the existence of a deal prone segment,

37
researchers have had trouble clearly defining that segment of consumers and its
value to marketers.
Henderson (1990) suggested that inconsistent findings concerning the deal
proneness construct may be the direct result of failing to consider the inherent
differences in consumer product categories. Henderson pointed to the results of
studies by Carmen (1969) and Blattberg, Peacock and Sen (1976) which produced
within study differences between product categories. She argued that such
findings should be expected given that the motivation (costs/benefits) to use deals
probably differs between categories just as the availability of deals differs between
categories. This argument gains strength in light of very recent work by Krishna,
Currin and Shoemaker ( 1991) which suggested that deals on frequently promoted
brands were not surprises to consumers. Instead, deals on specific brands were
expected, especially by frequent users who seemed to have been trained to
purchase from deal to deal. Could it also be that consumers have become trained
to expect deals overall and to use deals in categories where dealing is common or
cyclical in nature ( e.g., cereal, yogurt, ice cream)?
Henderson also suggested that generalizing across deal types may not be a
very good idea. She noted work by Dodson, Tybout and Stemthal (1978) in which
the purchasing patterns of 459 households in a Chicago area diary panel were
analyzed for two product categories (margarine and flour) across three different
types of deals (media distributed coupons, POP price reductions and on-pack
coupons). The authors found support for their hypothesis that the different types
of deals would have differing effects on consumers. They found that only the
media distributed coupons and POP price reductions resulted in greater brand
switching than if no deal was offered. They also found that on-pack coupons were
more likely to attract current users while media distributed and cents-off POP
38
coupons attracted more triers of a product. Unfortunately, while the results of this
study highlighted the importance of not generalizing across types of promotions, it
limited itself to only price-oriented consumer promotions. Other types of
promotions such as sweepstakes, contests, events and premiums have rarely been
included in studies of deal proneness.
In a study designed to investigate the effects of different consumer
promotions and different product categories on defining a deal prone segment,
Henderson ( 1984 ), focused mainly on price promotions. In this study which used
scanner panel data from 2463 households reporting purchases of the two product
categories of coffee and bathroom tissue, Henderson reported finding five distinct
consumer groups which responded differently to three types of promotions
including coupons, POP price reductions and special deal packs such as extra
product, reusable containers, and premarked discounts. She also included local
advertising as a type of "promotion." Each of the four derived consumer groups
was made up of consumers who were more or less "prone" to use one or more of
the four promotion types. While her study has its own problems of limited
categories and promotion types, Henderson's point remains clear. Deal proneness
must be defined within the context of the categories and promotions of interest.
In general, the second category of consumer characteristics, demographics,
has not been found to be a reliable indicator of promotional usage. In fact, even
summarizing across the bulk of research on demographics is difficult given the
conflicting findings which have been reported. Two demographic factors,
however, have demonstrated a fairly consistent positive relationship to
promotional usage. The first is a combination variable of educational level and
household income and the second is gender.

39
Several studies have found that higher income and better educated
consumers use more promotions (Teel, Williams & Bearden, 1980) or at least use
them for reasons which differ from lower income and less educated consumers
(Ward & Hill, 1991 ). In an analysis of diary data (299 households) for the paper
towel category, Levedahl (1988), evaluated the validity of two competing
hypotheses designed to explain the higher educational levels and income levels of
coupon redeemers compared to non-redeemers. The first hypothesis, the
efficiency hypothesis, suggested that households with larger incomes and/or a
higher educational level are efficient and organized, so they are better able to use
coupons. The second hypothesis, the preference hypothesis, suggested that
households with higher incomes and educational levels are already more likely to
prefer to purchase brands that :frequently offer coupons (i.e., higher priced,
national brands), and, therefore, are able to redeem coupons more often. In an
analysis of the diary data, both the preference and the efficiency hypotheses were
supported. Higher income, higher achieved educational level households already
purchased more often promoted brands, but they also tended to use more coupons
just to organize and increase shopping efficiency.
The second demographic variable which has shown some semblance of a
consistent pattern in terms of promotional usage is that of gender. In the majority
of studies in this area, women have been shown to be more likely to use
promotions than men, but again most of these studies have focused primarily on
price promotions (Feick & Price, 1987; Price & Feick, 1988) and most of these
studies have been conducted with nonrepresentative gender samples. That is, the
majority of studies have analyzed data gathered solely from female primary
grocery shoppers (i.e., women who do the 'majority', defined as 75% - 100%, of
grocery shopping for the family), or from diary panels where it has not been
40
determined whether the males, females, or both determine whether or not to use
promotions on any given purchasing occasion. In fact, until very recently, men did
very little of the household grocery shopping. As women have found their time
divided between home and office, men are finding themselves in the grocery store
with more opportunity than ever before to use promotions. As this trend
continues, the pattern of heavier female than male promotional usage may
disappear.
A Unified Model of Consumer Promotional Usage
As a whole, past research has painted an insightful, yet fragmented picture
of the motivations behind consumer promotional usage. That is, while each of the
various motivators reviewed was shown to be correlated with or predictive of
promotional usage to some degree, in isolation the extent of each motivator's
association with usage was shown to be fairly limited. Taken in combination,
however, it was believed that the explanatory power of the various motivators
could be greatly enhanced. In fact, the previous review and organization of
research in this area strongly suggested that each of the major determinants of
promotional usage could be effectively represented by a single predictive model in
which each determinant functioned as either a direct or indirect influence on usage
behavior. The success of tests of the enhanced Reasoned Action Model in the
promotional arena served as a strong indication of the predictive power of a more
"holistic" model of consumer promotions. The Reasoned Action Model itself
served as a structural blueprint for the development of an expanded model which
included each of the factors shown to be valuable predictors of promotional usage
behavior.
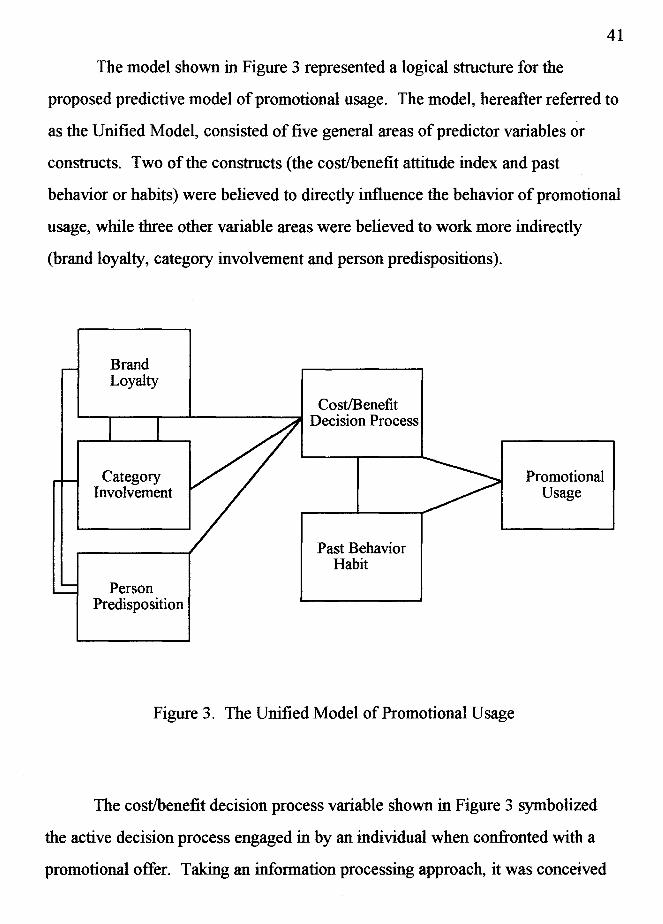
41
The model shown in Figure 3 represented a logical structure for the
proposed predictive model of promotional usage. The model, hereafter referred to
as the Unified Model, consisted of five general areas of predictor variables or
constructs. Two of the constructs (the cost/benefit attitude index and past
behavior or habits) were believed to directly influence the behavior of promotional
usage, while three other variable areas were believed to work more indirectly
(brand loyalty, category involvement and person predispositions).
Brand Loyalty
Cost/Benefit .__~---r----'-----""2 Decision Process
Category Involvement
Person Predisposition
Past Behavior Habit
Figure 3. The Unified Model of Promotional Usage
Promotional Usage
The cost/benefit decision process variable shown in Figure 3 symbolized
the active decision process engaged in by an individual when confronted with a
promotional offer. Taking an information processing approach, it was conceived
42
of as the summed value of the perceptions of costs and benefits of a particular
promotion. As discussed, many promotional usage decisions have been shown to
be heavily motivated by the outcome of a decision process weighing the costs
against the benefits of participating in a promotion. It was believed that
promotions were more likely to be used by a consumer when the perceived
rewards of usage outweighed the perceived risk or trouble involved in usage by
some acceptable margin. Five major types of costs and benefits were identified as
influencing the participation decision including: financial costs, cognitive
time/effort costs, physical time/effort costs, financial benefits, and psychological
benefits. In theory, the five major costs and benefits, taken in combination and
weighted for importance (much like the attitude component of the Reasoned
Action Model (Fishbein & Ajzen, 1975)) were believed to represent the results of
a well considered decision. In fact, it should be noted that this portion of the
Unified Model of Consumer Promotional Usage relied heavily on the Reasoned
Action Model for its theoretical underpinnings and basic structure.
The position of prior behavior in the Unified Model shown in Figure 3
reflected both the directness and strength of the relationship of past behavior,
particularly habitual behavior, to promotional usage. As noted previously, past
promotional usage has been reported to be the single best direct determinant of
intention to use future promotions (Bagozzi, Baumgartner & Yi, 1991 ). One
explanation for this finding, which was formerly discussed, is that moderate to
heavy past usage may actually tap into habitual patterns of usage and habits.
Thus, within the model, habits would be expected to bypass the active decision
process at times to have a more direct influence on behavior. This portion of the
Unified Model stems directly from the expanded model of Reasoned Action set
43
forth by Bagozzi, Baumgartner and Yi ( 1991) which was heavily influenced by the
holistic model work of Triandis (1979).
Three additional variable areas included were believed to influence tlie
behavior of promotional usage indirectly. Brand loyalty, category involvement
and person predisposition were each believed to indirectly effect usage behavior.
It was believed that they do so by influencing consumer perceptions of the costs
and benefits of promotions.
As noted previously, both brand loyalty and category involvement were
shown to function primarily as mediators of the cost and benefit decision by
defining the acceptable set of brands that a consumer would be willing to consider
buying or the acceptable range of brand related costs and benefits a consumer
would be willing to incur. By narrowing the range of brands to be considered,
category involvement and brand loyalty eventually define the set of promotions
available to a consumer for consideration.
To review, the category involvement construct referred to a true interest on
the part of a consumer in the products available in a category and the products
purchased for personal use. A category involved individual was generally
described as a consumer who wanted to find the "best" available product from
among all alternatives available at any given time. The construct of brand loyalty,
on the other hand, referred to a consumer preference for one or more brands over
other brands in the category. In theory, the brand loyalist believes that he or she
has already found the "best" or personally acceptable brand(s).
Person predisposition was included in the model as a general category of
variables that identifies characteristics of the individual consumer. Variables
within the person predisposition category were believed to be indirect
determinants of usage behavior via their effect on perceptions of costs/benefits.
44
Variables which fell under the heading of person predispositions included: deal
proneness, education, and income level. Either individually or in combination
these person predispositions were believed to impact the behavior of promotional
usage only to the extent that they influence the perception of costs and benefits of
promotions. Consistent with previous research therefore, the Unified Model
predicted that consumers who are deal prone and have higher income/educational
levels are more likely to have weighed the costs and benefits of promotional
activities positively. Gender was not included in the Unified Model given the
ambiguous nature of previous findings on this variable.
Areas for Further Development/Research Questions
A thorough review of the literature on the dynamics of consumer
promotions suggested four main areas for further research development. Each of
the four areas related to the idea of developing a Unified Model of Consumer
Promotional Usage. Clearly, while there had been a significant amount of
investigation into a variety of facets of promotional usage, little work had been
done to construct a multifaceted view of this important part of the total marketing
mix. The following four questions were designed to develop a deeper
understanding of the motivations behind consumer promotional participation
across a variety of categories, promotional types, and consumer types.
Of course, the first question to be explored concerned the proposed
predictive model of promotional usage shown in Figure 3. Was the proposed
model, a fair representation or valuable predictor of a consumer's use of
promotions? Did each of the variables included in the model add significantly to
the predictive power of the model? Were the relationships between variables in
the model represented accurately? In particular, were the direct and indirect

45
relationships of variables in the model with promotional usage fairly represented?
In essence, the question was: how helpful would the proposed Unified Model be in
helping marketers understand the underlying motivators to promotional
participation?
In order for the proposed model to truly be "unifying" model, it needed to
provide insight across a variety of categories and a variety of promotional types.
In particular, two questions needed to be answered. The first question was: Could
the proposed model be fairly predictive across categories with different price
points (average price per package/unit) and buying cycles (average time between
purchase occasions)? The second question was: Could the model be equally
predictive for promotions considered by consumers to be value added ( e.g.,
premiums) versus reduced loss (e.g., refunds) and those perceived to require less
effort (e.g., coupons) versus more effort (e.g., refunds) for participation? In sum,
the question was: Could the model be applied to a variety of promotional
situations?
The final question related to the value of the explanatory power of the
proposed Unified Model. In order for this model to be truly useful to marketing
practitioners it needed to provide keen insight into what distinguishes a user from a
non-user of promotions. The final question then related to the previous three
questions in that the model could only provide significant insight into consumers if
it proved to be predictive. If the model proved to be predictive, the most revealing
question would be: How does a promotional participant differ from a non
participant in terms of the major components of the model? Of course, an answer
to this question would give marketers clear direction for targeting and designing
future promotions.

CHAPTER2
METHOD
In order to explore each of the four main questions related to developing a
Unified Model of Consumer Promotional Usage, a two phase study was conducted
among primary grocery shoppers who regularly purchase products within the two
categories of cereal or cigarettes. The purpose of phase I, completed as a national
telephone survey, was to identify appropriate questions for inclusion to the final
telephone survey used in phase II. In the national telephone survey of phase II,
respondents were asked questions covering each of the six major content areas of
the Unified Model of Consumer Promotional Usage. Those areas included: the
cost/benefit ratio involved in the decision, reported past behavior, brand loyalty,
category involvement, person predisposition, and, of course, intention to use
promotions in the future. Planned analyses, following final data collection,
focused on providing clear evidence for the predictive value of the model in
general as well as across the two category ( cereal and cigarettes) and three
promotional ( coupons, refunds and premiums) types. Additionally, the variables
of the model were used to distinguish between users and non-users of the two
promotional types included in the study. Specifically, descriptions of users and
non-users were developed on the basis of comparison of the two groups on each of
the variables of the Unified Model.
46
Phase I
Purpose
Phase I of this study, which was completed six months before Phase II,
served two very specific purposes. First, it allowed estimates to be made of the
total number of telephone calls which would need to be made to achieve the
desired cell sizes for phase II of the study. Second, it provided very specific
feedback on the types of costs and benefits which consumers perceive to be
involved in using each of the three types of promotions under investigation
(coupons, refunds, and premiums). That information, elicited from consumers,
was used to construct relevant questions about costs and benefits for use in the
telephone survey in phase IL
Subjects
47
A total of 505 male and female primary grocery shoppers were contacted
via a computer assisted telephone interview ( CATI) using a modified random digit
dialing (RDD) technique. The dialing procedure was modified to extract blocks of
unused and business-oriented telephone numbers. In order to elicit a list of
category-general rather than category-specific costs and benefits, the consumers
contacted were not screened for usage of any particular product categories.
Shoppers, both male and female, were, however, screened to be between the ages
of 18 and 54.
Instrumentation
In order to serve the dual purposes of phase I, two sets of questions were
included in the questionnaire for the telephone survey. One set of questions,

specifically focused on estimating the extent of consumer usage of each of the
three promotional types under consideration ( coupons, refunds, and premiums).
The second set of questions served to elicit directly from consumers their
perceptions of the costs and benefits involved in usage of these three types of
promotions.
48
This survey was conducted as a 'tag-on' to another national telephone
survey which was being conducted. This allowed the data to be collected at a
minimal cost. The survey to which the questions for this study were attached had
nothing to do with grocery products. Its focus was on describing some at-home,
advertising related behaviors of primary grocery shoppers.
An outline of the order and specific wording of the questions included in
this survey is included in Appendix A. The overall appearance of the survey, was
much different, however, given that it was adapted for use on a CATI System. As
part of that system, each question, the accompanying set of responses and some
relevant interviewer directions appeared directly on the computer screen. Some
directions which would normally appear on a traditional paper and pencil
questionnaire, however, did not appear on the computer screen, but were directly
built into the programming for the computerized interview. One example would
be instructions for the branching of questions. Allowing the computer to handle
tasks such as branching, made the job of the interviewer much more simple, and
may therefore, have reduced human error.
The questions included to estimate consumer participation in each of the
three types of consumer promotions were straightforward. Consumers were given
a brief set-up which explained that they would be asked to respond to a few
questions about their 'participation in three types of promotional offers for grocery
products.' They were then asked to respond to three questions, each of which
49
measured the length of time since the consumer had: 'redeemed a coupon at the
checkout counter in your grocery store,' or 'responded to a manufacturer rebate
offer where you mail in proofs-of-purchase in return for a cash or check rebate,' or
'responded to a manufacturer premium offer where you mail in proofs-of-purchase
in return for a special gift which was advertised on the package.' Respondents in
this first phase were asked about their general use of coupons, refunds, and
premiums rather than their use within specific product categories ( e.g., cereal and
cigarettes) to avoid biasing or limiting their responses to the cost and benefit
elicitation questions which followed. The response options available for each of
those three questions included: 'within the last month,' 'within the last 2 to 3
months,' 'within the last 4 to 6 months,' 'within the last 7 to 12 months,' and 'not at
all in the past year.'
Using the same descriptions noted above, the six questions which followed
asked respondents specifically for information about their perceptions of the costs
and benefits of using coupons, refunds, or premiums. Because these questions
were intended to elicit the full spectrum of possible costs and benefits, they were
designed to be open-ended in nature. Thus, for each of the three promotional
types, a question was asked about the 'sorts of positive things or benefits (which)
come to mind when you think of using (a specific promotion with description)' and
a question followed about the 'sorts of negative things or costs (which) come to
mind when you think of using (a specific promotion with description).' Two
demographic questions about gender and age directly followed.
Procedure
As noted, respondents were contacted as part of a 'tag-on' survey. They
were given the brief introduction to this promotional topic and asked specific

50
questions about their use of the three specific promotional types over the last year.
Interviewers were instructed to read the entire list of time options after each of
these three questions and then record one response from the respondent for each
question.
Respondents were then asked consecutive questions pertaining to the
perception of costs and benefits involved in each specific promotion. Interviewers
were instructed to probe 'anything else' and type in verbatim responses until
probing became unproductive. Questions about the costs and benefits of using the
three promotional types were randomized by type of promotion to insure that a
fatigue bias in the productivity of the elicitation, if it emerged, would be spread
across the three types of promotions. Following the elicitation procedure,
respondents were asked two final demographic questions about gender and age and
then thanked for their assistance with the survey.
Phase II
Purpose
The purpose of phase II of this study was to develop a deeper or
multifaceted understanding of the motivations behind consumer promotional
participation across a variety of categories, promotional types, and consumer
types. Four specific research questions were addressed. Could the proposed
Unified Model of Consumer Promotional Usage be a fair representation or
valuable predictor of a consumer's general use of promotions? Could the model be
predictive across categories with different price points ( average price per
package/unit) and buying cycles (average time between purchase occasions)?
Could the model be equally predictive for different types of promotions including

51
those considered by consumers to be value added (e.g., premiums) versus reduced
loss (e.g., refunds) and those perceived to require less effort (e.g., coupons) versus
more effort (e.g., refunds) for participation? In other words, could the model
generalize to a variety of promotional situations? The final question was: How
useful would the components of the model be in differentiating between users and
non-users of promotions?
Subjects
Exactly 300 primary grocery shoppers were recruited in the CATI
telephone interview in phase II of this study. Once again, the nationally
representative RDD procedure was modified to extract blocks of unused and
business-oriented telephone numbers. A primary grocery shopper was defined as
someone who does at least half of the grocery shopping for a household. The
sample was allowed to naturally represent males and females without a quota
system, but respondents were screened to be between the ages of 18 and 54.
Consumers were also screened to be regular purchasers of the cereal or
cigarette category based on respondents' own perceptions of whether or not they
"regularly purchase products" within those categories. Previous experience had
shown that consumers differ in their volume of purchases and time lapse between
purchases within specific product categories. Therefore, it was believed to be
counterproductive to dictate to them what constitutes a "regular" user. Instead, it
was believed best to allow each consumer to determine whether he or she
perceived himself/herself to be a regular purchaser within a product category. As
shown in Figure 4, a quota system was instituted to insure that at least 150 regular
cereal purchasers were recruited and 150 regular cigarette purchasers were
recruited.

CEREAL CATEGORY
CIGARETTE
CATEGORY
COUPONS REFUNDS PREMIUMS
25 USERS 25 USERS 25 USERS
25NONUSERS 25 NONUSERS 25 NONUSERS
25 USERS 25 USERS 25 USERS
25NONUSERS 25NONUSERS 25NONUSERS
100 100 100
Figure 4. The Study Design for Phase II.
52
150
150
Quotas were also used to insure that within each product categocy ( cereal
and cigarettes) and promotion type ( coupons, refunds, and premiums) 50
interviews were completed. In other words, this study provided for six
promotional situations or cells in that there were two product categocy and three
promotional types about which respondents were asked. Within each of those
cells, 50 respondents were asked about their attitudes and usage of that particular
promotion within that particular product categocy. In the interest of time and in
order to eliminate any cross-over response effects, respondents were not
interviewed about more than one product categocy or more than one promotional
type. This also served to meet the statistical assumptions of the intended modeling
analyses by creating a completely between subjects design.

53
Quotas were also instituted to insure that an appropriate percent (25%) of
respondents within the cereal category cells were also regular purchasers of
cigarettes (Mediamark Research Inc., 1993). This was done to reduce the ·
possibility of confounding which may have occurred if interviewers were allowed
to assign all respondents reflecting usage in the lower incidence product category
(i.e., cigarettes) to the cigarette category cells. In effect, the quotas were used to
be sure that the cereal respondent groups were not different from the general
population in their cigarette consumption simply because all smokers had been
assigned to the harder to fulfill quota groups - the regular cigarette purchasing
groups.
As shown in Figure 4 and mentioned above, respondent quotas were
instituted to insure that at least one half of the respondents in each of the six cells
were prior users of the particular promotion within that cell and one half were non
users. Prior usage for the purposes of this study was defined as having used a
promotion type at least once a year or more. While the actual number of users and
non-users within each cell was rather small for analytic purposes at this level (25
prior users and 25 non-users), it allowed for some analysis of the differences
between these two types of consumers. In sum, the design of this study allowed
data collection from 300 total respondents, 100 respondents for each of the three
promotion types, 50 for each of the six possible promotion/product category
combinations.
Instrumentation
In order to understand the motivations behind consumer promotional usage
across a variety of categories, promotional types, and consumer types, a
questionnaire was designed to measure each of the key component areas of the
54
proposed Unified Model. As noted above, the questionnaire was structured such
that qualified respondents were, for the most part, funneled through a series of
questions about one of the three types of consumer promotions, (i.e., coupons,
refunds, and premiums) and only one of the two product categories (i.e., cereal or
cigarettes).
An outline of the order and specific wording of the questions included in
this survey can be found in Appendix B. Again, the overall appearance of the
survey, was much different on the computer screen given that it was adapted for
use on a CATI System. As part of that system, each question, the accompanying
set of responses, and relevant interviewer directions appeared directly on the
computer screen. Some directions which would normally have been shown on a
traditional paper and pencil questionnaire, however, were not shown on the
computer screen. Rather, they were built directly into the programming for the
computerized interview. As noted previously, branching questions were one of the
most important types of directions not readily apparent on the computer screen,
but built into the internal programming of the computerized interview as were
directions for randomization, termination of the interview, and tracking of quota
specification fulfillment. Mechanization of some of these directions, should have
reduced the level of interviewer error in the survey process.
A brief set-up was given during the initial phone contact which identified
the interviewer, the research company making the call and the purpose of the call
to potential respondents between the ages of 18 and 54. A series of qualifying
questions followed. The first qualifying question was designed to insure that
respondents were "typical" consumers with no particular expertise (beyond that of
the general public) in market research. The format of both the question and the
response set (yes or no) is fairly standard in the industry. The second qualifying
55
question, also using a yes/no format was designed to screen for respondents who
had enough experience purchasing grocery and convenience type items to have
formed opinions about the consumer promotions which sometimes accompany
them. The third qualifying question was designed to determine whether or not the
potential respondent was a "regular purchaser" of at least one of the two product
categories of interest. In order to avoid cueing potential respondents to the
specific product categories of interest, a brief list of five categories was read. This
was done to help discourage respondents who make a "profession" of participating
in every study with which they come in contact. If the respondent was not a
regular purchaser of either cereal or cigarettes, the interview was terminated. If
the potential respondent was a regular purchaser of one or both of the categories,
the CATI system determined which of the two product categories to continue to
ask the respondent about on the basis of need for quota fulfillment. Following a
question about age, interviewers were instructed in the fifth question to record (not
ask) the respondent's gender by tenor of voice if possible, or by first name if
necessary. As noted, both age and gender were recorded, but were not used as
qualifying or quota satisfying questions.
The sixth question referred specifically to the three types of consumer
promotions of interest. That is, respondents were asked about their future intent to
use each of the three types of consumer promotions within one of the two product
categories. This did not serve as a qualifying question. After cueing the
respondent to the subject of the question (e.g., consumer promotions) and the
nature of the response that was required ( e.g., likelihood of future use within that
product category), interviewers read the short description (used with success in
phase I) of each of the three consumer promotions one at a time. The descriptions
were randomly rotated by the CATI System for each interview. Following each
56
promotional description, interviewers prompted the respondent to identify their
future usage intent on a 6 point scale where 6 meant extremely likely to use, 5
meant very likely to use, 4 meant somewhat likely to use, 3 was somewhat
unlikely to use, 2 was very unlikely to use, and 1 was extremely unlikely to use. A
scale without a neutral midpoint was consciously chosen to encourage respondents
to make a choice. A no response option was included, but not read to respondents.
This allowed interviewers to record the responses of consumers unwilling or
unable to make a choice. For coding purposes, a positive intention to use was
defined as a response of extremely, very or somewhat likely to use. A negative
intention to use was defined as a response of extremely, very or somewhat unlikely
to use.
Respondents were then probed in the seventh question for past behavioral
usage of each of the three promotions within the product category using much the
same format as for intended usage above. This question served as the final
qualifying question. Responses to this question were used to satisfy the user/non
user quota within each of the six cells. Respondents were read the same
description of each promotion and then prompted to use a 6 point scale to indicate
the extent of their past usage of the promotion. The promotion descriptions were
read in the same order as the random order determined for the previous future
intent question. As noted, respondents were asked to use the following 6 point
scale to indicate the extent of their past usage: 6 meant use the promotion nearly
every week, 5 meant use it several times a month, 4 meant about once a month, 3
was several times a year, 2 was about once a year, and 1 was less often than that
(once a year). Again, the don't know or no answer option was provided for the
interviewer on the screen, but was not read to respondents. Users were identified

57
as respondents who said they engaged in a particular promotional activity at least
once a year or more.
Respondents were then asked to answer only one of the following questions
outlined in Appendix B (questions 8, 9 and 10). Which question a respondent was
asked to answer depended entirely on which of the six cells they had been
assigned to on the basis of their responses to the qualifying questions outlined
above. Respondents satisfying coupon, refund, and premium cell quotas were
asked to respond to questions eight, nine, or ten respectively.
Specifically, these three questions provided information on the relative
importance of the major costs and benefits of each of the three types of consumer
promotions. The costs and benefits for inclusion to these questions were derived
directly from the elicitation procedure conducted in phase I. For each promotion,
a series of statements about two factors, relevant costs and relevant benefits, were
constructed in such a way that respondents were able to determine whether they
agreed or disagreed with them. The statements were randomly rotated and read to
respondents. Respondents were then asked to use a 5 point scale to indicate how
strongly they agreed or disagreed with each statement. Once again, the don't know
or no answer option was provided for the interviewer on the screen, but was not
read to respondents. Given that there were exactly 9 statements to be read for each
promotion, the interviewer was encouraged to read the entire response scale after
each statement until it no longer became necessary. It was expected that
respondents would become accustomed to using the scale at some point without
having it read each time in its entirety. At the very least, interviewers were
expected to remind the respondent of the total response scale at the beginning of
each full question.
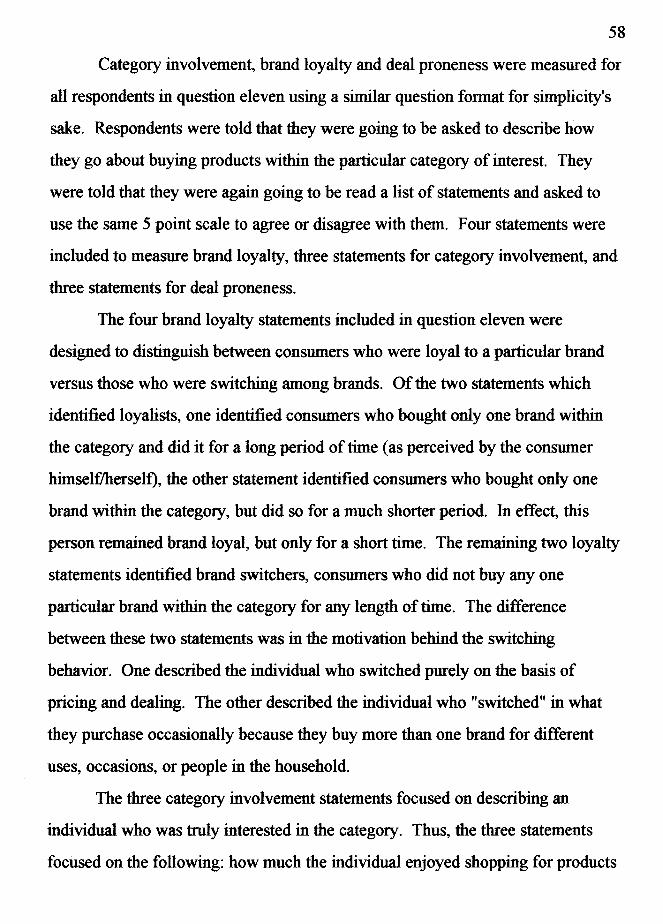
58
Category involvement, brand loyalty and deal proneness were measured for
all respondents in question eleven using a similar question format for simplicity's
sake. Respondents were told that they were going to be asked to describe how
they go about buying products within the particular category of interest. They
were told that they were again going to be read a list of statements and asked to
use the same 5 point scale to agree or disagree with them. Four statements were
included to measure brand loyalty, three statements for category involvement, and
three statements for deal proneness.
The four brand loyalty statements included in question eleven were
designed to distinguish between consumers who were loyal to a particular brand
versus those who were switching among brands. Of the two statements which
identified loyalists, one identified consumers who bought only one brand within
the category and did it for a long period of time ( as perceived by the consumer
himself/herself), the other statement identified consumers who bought only one
brand within the category, but did so for a much shorter period. In effect, this
person remained brand loyal, but only for a short time. The remaining two loyalty
statements identified brand switchers, consumers who did not buy any one
particular brand within the category for any length of time. The difference
between these two statements was in the motivation behind the switching
behavior. One described the individual who switched purely on the basis of
pricing and dealing. The other described the individual who "switched" in what
they purchase occasionally because they buy more than one brand for different
uses, occasions, or people in the household.
The three category involvement statements focused on describing an
individual who was truly interested in the category. Thus, the three statements
focused on the following: how much the individual enjoyed shopping for products

59
within that category, how interested they were in comparing products and
information within that category to find the "best" product/brand, and how likely
they were to tty new products within that categoty.
The last three statements which were included in question eleven pertained
to the degree of deal proneness evident in each respondent. Each of the statements
referred to the level of enthusiasm the respondent had for "getting the best deal,"
"comparing prices and deals" before making a purchase decision, and "looking
through newspapers and fliers for sales and deals." These statements were
randomly rotated with the brand loyalty and category involvement statements and
read to respondents one at a time. As described above, respondents were
prompted to respond using the same 5 point agree/disagree scale which with they
had become familiar. Once again, the don't know or no answer option was
provided for the interviewer on the screen, but was not read to respondents.
The final few questions which respondents were asked to answer were
demographic questions pertaining to: level of education (less than high school
graduate through post graduate), employment status (unemployed, part-time
employed, full-time employed), number of children living at home, and level of
household income (under $20,000 through over $100,000). Each of these
questions had been designed to be as non-intrusive as possible and were included
at the end of the interview to decrease the chance of the respondent becoming
threatened prior to completion of the majority of the interview. In addition,
respondents were told that their responses to these questions would be used only
for statistical purposes. Following completion of the 5 demographic questions,
respondents were thanked for their assistance with the survey and the interview
was terminated.

60
Procedure
As noted, respondents were randomly contacted by a trained interviewer via
a CATI System. Following a brief introduction to the interviewer, the research
company and the project, respondents were asked a series of questions which were
used to qualify them for the survey and for assignment to one of the six cells
included in the survey design. After being assigned to one of the six cells,
respondents were asked questions which were designed to measure each of the key
component areas of the Unified Model within the context of only one of the two
product categories, and one of the three consumer promotions of interest.
Interviewers read each question outlined in the survey (Appendix B) to
respondents and read the appropriate response set when necessary. They repeated
anything that respondents did not hear the first time or found confusing in any
way. They were allowed to offer further explanation, but were trained not to
introduce bias into respondents' answers. Interviewers recorded (keypunched)
appropriates number corresponding to respondents' answers following each
question. They also recorded any additional relevant comments or trouble spots
encountered during the course of the interview. Once all questions had been
answered, interviewers thanked respondents and terminated the interview. The
CATI System, of course, alerted interviewers of questions which had not been
adequately answered so that interviewers were able to clear up any confusion
before respondents hung up. The CATI system routinely orchestrated the skip
patterns inherent in the interview, so there was no way in which an interviewer
could accidentally skip questions or probe for answers to questions not required.
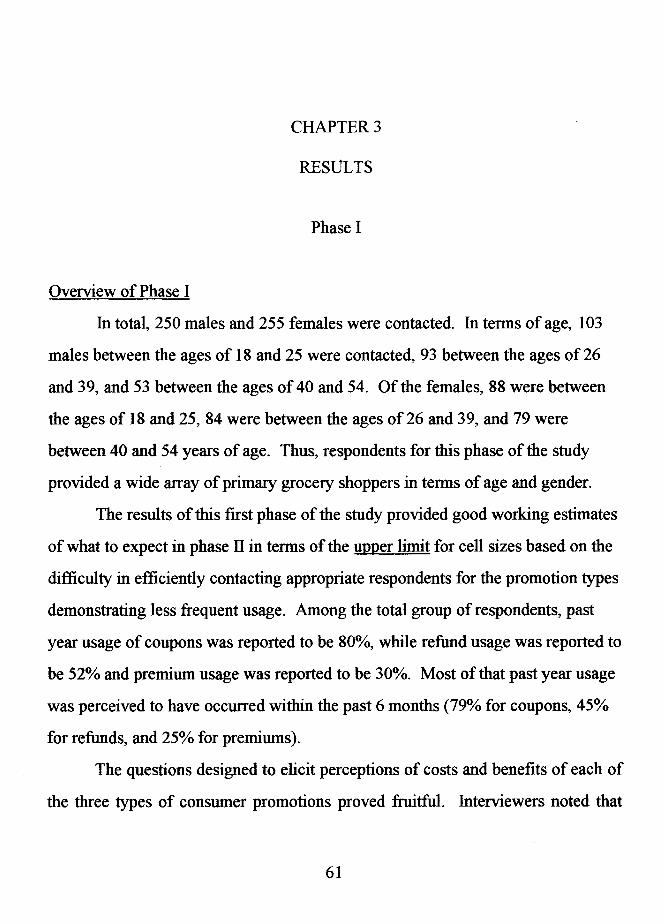
Overview of Phase I
CHAPTER3
RESULTS
Phase I
In total, 250 males and 255 females were contacted. In terms of age, 103
males between the ages of 18 and 25 were contacted, 93 between the ages of 26
and 39, and 53 between the ages of 40 and 54. Of the females, 88 were between
the ages of 18 and 25, 84 were between the ages of 26 and 39, and 79 were
between 40 and 54 years of age. Thus, respondents for this phase of the study
provided a wide array of primary grocery shoppers in terms of age and gender.
The results of this first phase of the study provided good working estimates
of what to expect in phase II in terms of the upper limit for cell sizes based on the
difficulty in efficiently contacting appropriate respondents for the promotion types
demonstrating less frequent usage. Among the total group of respondents, past
year usage of coupons was reported to be 80%, while refund usage was reported to
be 52% and premium usage was reported to be 30%. Most of that past year usage
was perceived to have occurred within the past 6 months (79% for coupons, 45%
for refunds, and 25% for premiums).
The questions designed to elicit perceptions of costs and benefits of each of
the three types of consumer promotions proved fruitful. Interviewers noted that
61

62
respondents had little or no difficulty outlining their reasons either for or against
using each of the promotional types. While respondents' answers varied in
terminology or phraseology, for the most part a consistent pattern emerged. · That
is, for each of the promotions ( coupons, refunds, and premiums) a fairly specific
and compact set of costs and benefits were identified for inclusion to the telephone
survey in phase II.
Respondents provided a good number of answers to the two open-ended
questions inquiring about the perceived costs and benefits of using coupons.
Almost unanimously (99%), respondents mentioned financial value or "money
saved" as a benefit of using coupons. It was usually the first benefit they
mentioned. A distant second place benefit, in terms of the percent of respondents
who mentioned it (35%), was that coupon usage could make them "feel"
something good about themselves such as feeling "smart," "competent," or just
plain "good." Two other benefits of using coupons were mentioned with some
consistency. The first, mentioned by 14% of all respondents, was the fun involved
in cutting coupons, organizing them or looking for the coupons with the highest
face values. The second, mentioned by 12% of all respondents, was the positive
side of the social norm benefit. Specifically, that using coupons could make
respondents appear "smart" or "sly" to other people including husbands, wives,
children, and other people in the grocery checkout line.
In terms of the costs of coupon usage, respondents were equally clear with
their responses. In rank order of the percent of respondents who mentioned them,
the following factors were perceived by respondents to be the primary costs of
using coupons: (a) time spent cutting, organizing, comparing and cashing them in
(76%), (b) effort or work involved in cutting, organizing, and cashing them in
(41%), (c) often requires purchase of more expensive brands/products/sizes

63
( 25%), (d) makes you "look cheap" to others including husbands, wives, children,
and other people in the grocery checkout line (21%), (e) often means losing or
"missing out" on another sales/couponed product purchase (11%), and (f) may
require going to a specific store to use the coupon - particularly in-store coupons
(3%).
Not surprisingly, respondents perceived refund promotions to have many of
the same costs and benefits. In order of the percent of respondents who mentioned
them, the major benefits of refunds included: (a) their financial value or "money
they save you" ( 100%), (b) their ability to make a person feel "smart,"
"competent," or "like a good consumer" ( 41 % ), ( c) their ability to make a person
look "smart" to others (9%), and (d) the fact that it can be fun to cut, organize, and
send them in (7%). In terms of costs, four major factors were mentioned by
respondents including: (a) the effort or work involved in cutting, saving proofs,
sending in, and cashing in (73%), (b) the time spent cutting, saving, sending in,
waiting for response, and cashing them in (52%), (c) the cost of postage and
envelopes (19%), and finally, the negative social norm component of making you
look "cheap" or "like a tightwad" (11%).
Premiums probably showed a slightly different pattern of costs and benefits
from coupons and refunds because of the nature of the average premium offer
(a value-added offer) which requires sending in several proofs of purchase and
possibly a financial payment to the manufacturer. A majority of the respondents
(87%) mentioned the item itself as the major benefit of the promotion. The
strength of that benefit lay in the perceived value of the item. Many respondents
were skeptical about the value of items you "send away for." A number of
respondents described receiving items that had not met expectations either
financially, aesthetically, or in their utility. If the item met expectations, however,

64
it was seen as the key benefit of the promotion. The second benefit of this type of
promotion, in terms of the number of mentions it received (25%), was the savings
that could be realized by purchasing items at a believed to be reduced price by
trading in proofs-of-purchase. The next most mentioned benefit of premium usage
was the "fun" or "excitement" (anticipation) generated when sending away and
waiting for a premium (21 % ). Many respondents talked about this type of
promotion with almost childlike wonder at times. One such respondent said:
I remember sending away for a spy glass when I was a kid. I was so
excited about it ... but I don't think it ever came. I think about it when
I send away for things with my own kids.
The final benefit mentioned with any consistency was the feeling of competency
connected with getting "a bargain." This benefit was noted by 15% of all
respondents.
Not surprisingly, the financial cost often involved with sending away for a
premium offer, was perceived by many to be a major cost of this type of
promotion. In fact, 63% of all respondents specifically mentioned having to send
money or a check with the offer as a negative thing about participating in most
premium offers. In terms of the number of mentions it received, the risk involved
in sending away for a promotion that may or may not meet expectations was the
second biggest cost involved in premium participation (47%). In addition,
approximately 31 % of all respondents noted that the effort involved in cutting,
organizing, saving and sending in proofs-of-purchase was a cost of premium
usage, as was the time involved in those same activities (21%).

65
In all, the cost/benefit elicitation procedure provided solid information for
use in the construction of the final questionnaire for phase II of this study. It
demonstrated that while there were similarities in the costs and benefits involved
in each of the three types of promotions under investigation, there were some
important differences in how consumers talked about them, the order of their
importance ( or at least top-of-mind importance), and how they related to the very
nature of the premium itself. In the final questionnaire, questions about costs and
benefits were clearly tailored for each promotional type based on the information
gathered in the elicitation procedure of phase I.
Phase II
Overview of Phase II
Data were collected as planned with responses from exactly 300
respondents recorded. Of those 300, 150 classified themselves as regular cereal
purchasers and 150 classified themselves as regular cigarette purchasers.
Additionally, those 300 consumers were classified as either users (within the past
year) or non-users of one of the three promotions ( coupons, refunds and
premiums). In sum, data was collected from 50 consumers (25 users and 25 non
users) within each of the six planned category/promotion type cells as shown in
Figure 4. The number of respondents included in each analysis varied because
some respondent records contained missing or nonproductive responses.
Total Sample Demographics
The demographic breakdown of the total sample group held few surprises
as shown in Table 1. Approximately three quarters of the interviews were
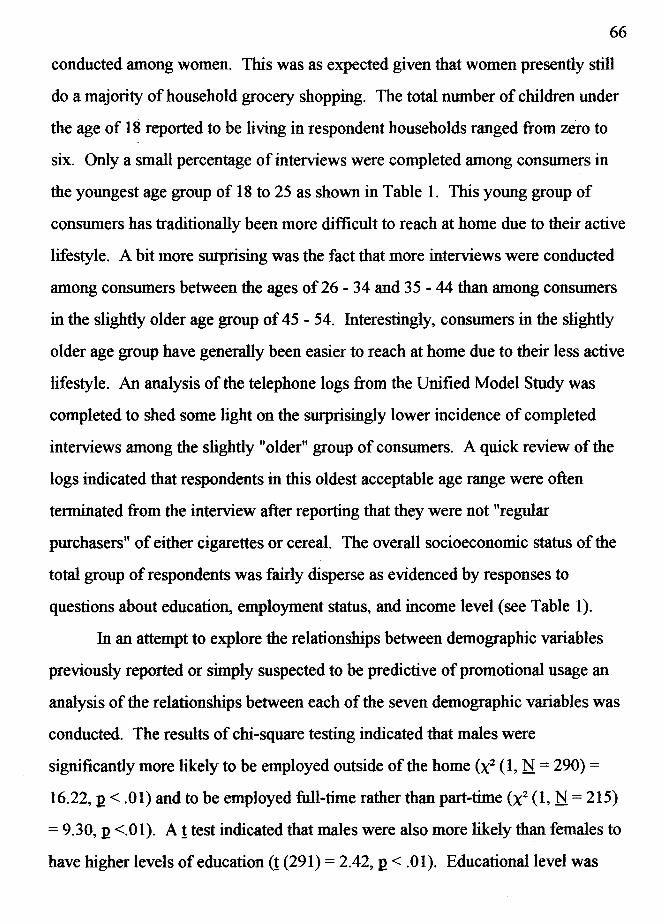
66
conducted among women. This was as expected given that women presently still
do a majority of household grocery shopping. The total number of children under
the age of 18 reported to be living in respondent households ranged from zero to
six. Only a small percentage of interviews were completed among consumers in
the youngest age group of 18 to 25 as shown in Table 1. This young group of
consumers has traditionally been more difficult to reach at home due to their active
lifestyle. A bit more surprising was the fact that more interviews were conducted
among consumers between the ages of26 - 34 and 35 - 44 than among consumers
in the slightly older age group of 45 - 54. Interestingly, consumers in the slightly
older age group have generally been easier to reach at home due to their less active
lifestyle. An analysis of the telephone logs from the Unified Model Study was
completed to shed some light on the surprisingly lower incidence of completed
interviews among the slightly "older" group of consumers. A quick review of the
logs indicated that respondents in this oldest acceptable age range were often
terminated from the interview after reporting that they were not "regular
purchasers" of either cigarettes or cereal. The overall socioeconomic status of the
total group of respondents was fairly disperse as evidenced by responses to
questions about education, employment status, and income level (see Table 1).
In an attempt to explore the relationships between demographic variables
previously reported or simply suspected to be predictive of promotional usage an
analysis of the relationships between each of the seven demographic variables was
conducted. The results of chi-square testing indicated that males were
significantly more likely to be employed outside of the home (x2 (1, N = 290) =
16.22, I!< .01) and to be employed full-time rather than part-time (x2 (1, N = 215)
= 9.30, I! <.01). A 1 test indicated that males were also more likely than females to
have higher levels of education(! (291) = 2.42, I!< .01). Educational level was
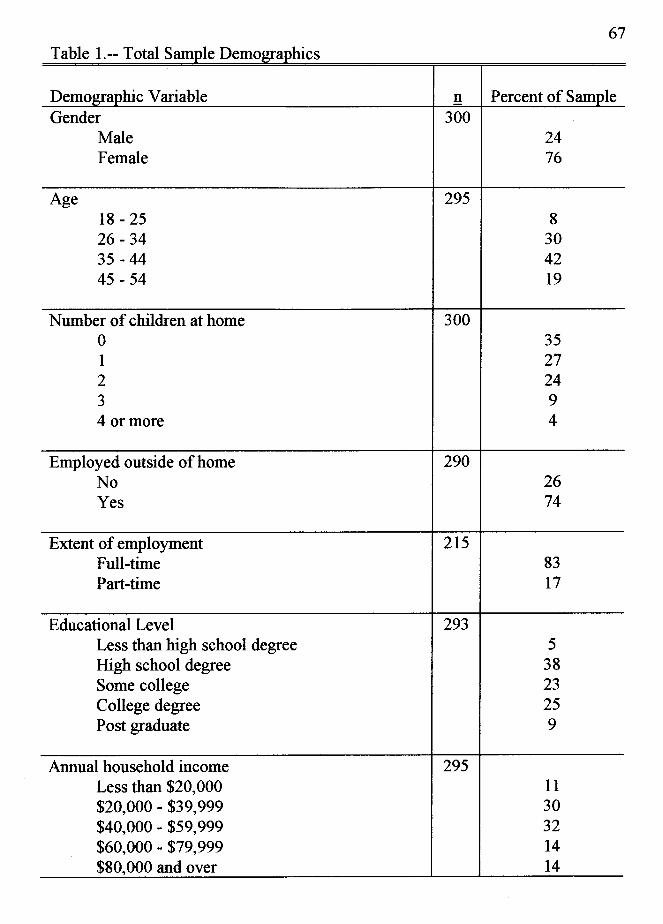
Table 1.-- Total Sample Demographics
Demographic Variable Gender
Age
Male Female
18 - 25 26- 34 35 -44 45 - 54
Number of children at home 0 1 2 3 4 or more
Employed outside of home No Yes
Extent of employment Full-time Part-time
Educational Level Less than high school degree High school degree Some college College degree Post graduate
Annual household income Less than $20,000 $20,000 - $39,999 $40,000 - $59,999 $60,000 - $79,999 $80,000 and over
67
n Percent of Sample 300
295
300
290
215
293
295
24 76
8 30 42 19
35 27 24 9 4
26 74
83 17
5 38 23 25 9
11 30 32 14 14

positively correlated to respondent age (r (293) = .16, I!< .01) and to household
income(! (293) = .43, I!< .01) and, as expected, respondent age was positively
correlated to household income(! (289) = .25, I!< .01).
68
In order to identify any demographic differences between the two product
categories, ! tests using a Bonf erroni adjustment were conducted. Probability
adjustments were made separately for each analysis. Findings indicated that, as
expected, there were demographic in the promotional user groups for each of the
categories. Specifically, the two category user groups differed significantly in
educational level(! (291) = 5.48, I!< .01) and household income level(! (293) =
3.49, I! <.01) with cereal product users reporting higher levels of both education
and household income. There were no differences between the two groups in
terms of age or number of children in the household.
Total Samu le Past/Future Promotional Usage
As outlined, all 300 respondents were asked to report their past usage and
future intention to use all three types of promotions. Past promotional usage was
used as a qualifying question to help assign respondents to one of the six cells in
the research design. Early in the project it was also intended that past usage would
serve as the predicted variable in the proposed modeling analysis. Reported usage
in the second phase of the study (see Table 2) seemed at least visually consistent
with usage reports from the first phase in which 80% of respondents reported
using coupons in the past year, 52% reported using refunds in the past year, and
30% reported using premiums in the past year. In the second phase of the study,
the vast majority of respondents (79%) reported past usage of coupons at least
once a year. In comparison, refund usage was reported by only 40% of
respondents while premium usage was reported by 28% of respondents.
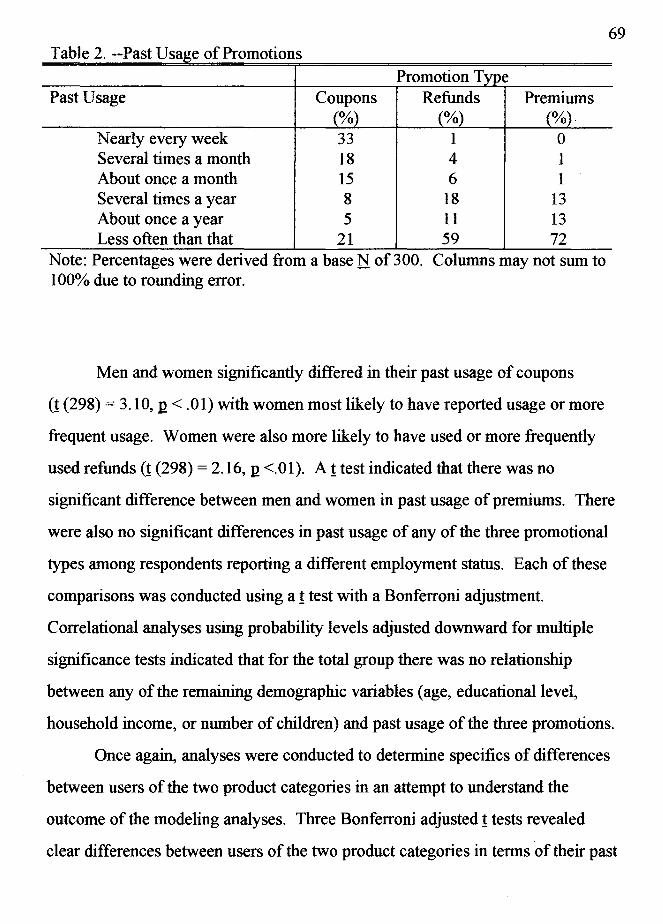
T bl 2 P tU f P a e . -- as sage o romot1ons Promotion Type
Past Usage Coupons Refunds Premiums (%) (%) (%).
Nearly every week 33 1 0 Several times a month 18 4 1 About once a month 15 6 1 Several times a year 8 18 13 About once a year 5 11 13 Less often than that 21 59 72
Note: Percentages were derived from a base N of 300. Columns may not sum to 100% due to rounding error.
Men and women significantly differed in their past usage of coupons
69
(! (298) = 3.10, I!< .01) with women most likely to have reported usage or more
frequent usage. Women were also more likely to have used or more frequently
used refunds(! (298) = 2.16, I! <.01). A! test indicated that there was no
significant difference between men and women in past usage of premiums. There
were also no significant differences in past usage of any of the three promotional
types among respondents reporting a different employment status. Each of these
comparisons was conducted using a ! test with a Bonferroni adjustment.
Correlational analyses using probability levels adjusted downward for multiple
significance tests indicated that for the total group there was no relationship
between any of the remaining demographic variables ( age, educational level,
household income, or number of children) and past usage of the three promotions.
Once again, analyses were conducted to determine specifics of differences
between users of the two product categories in an attempt to understand the
outcome of the modeling analyses. Three Bonferroni adjusted ! tests revealed
clear differences between users of the two product categories in terms of their past

70
promotional usage. Cereal purchasers reported using coupon promotions
significantly more often than cigarette purchasers(! (298) = 2.69, I!= .01). There
were no differences in frequency of past usage of refunds or premiums.
For the total group, past usage of each of the three promotional types was
highly and significantly intercorrelated as shown in Table 3. The acceptable
probability level was adjusted downward to compensate for the multiple
significance tests reported in this table. Past usage of coupons was strongly
associated with past usage of both refunds and premiums. Interestingly, the
strongest association was between past usage of refunds and premiums. This was
demonstrated by the fact that the correlation coefficient for that relationship
significantly differed from the correlation coefficient for past usage of coupons
and refunds(~= 3.33, I!< .01) and the correlation coefficient for past usage of
coupons and premiums(~= 3.90, I! <.01).
T bl 3 P a e -- earson C 1 . orre anons among p ast an dF uture u Past Past Past
Coupon Refund Premium Use Use Use
Past Refund Use .33 * --- ---Past Premium Use .30 * .49 * ---Future Coupon Use .64 * .23 * .12
Future Refund Use .24 * .61 * .40*
Future Premium Use .22 * .47 * .64 * Note: Correlations were derived from a base N of 300.
*I!< .0001
sage Ind. ices Future Future
Coupon Refund Use Use --- ------ ------ ---
.31 * ---
.20 * .59 *
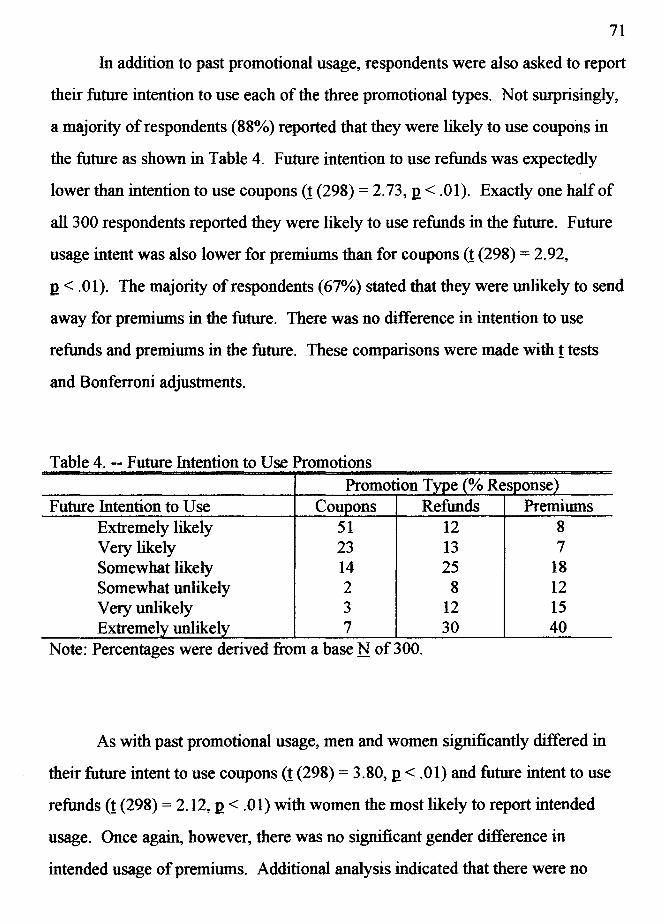
71
In addition to past promotional usage, respondents were also asked to report
their future intention to use each of the three promotional types. Not surprisingly,
a majority of respondents (88%) reported that they were likely to use coupons in
the future as shown in Table 4. Future intention to use refunds was expectedly
lower than intention to use coupons(! (298) = 2.73, .Q < .01). Exactly one half of
all 300 respondents reported they were likely to use refunds in the future. Future
usage intent was also lower for premiums than for coupons (! (298) = 2. 92,
.Q < .01). The majority of respondents (67%) stated that they were unlikely to send
away for premiums in the future. There was no difference in intention to use
refunds and premiums in the future. These comparisons were made with ! tests
and Bonferroni adjustments.
Table 4. -- Future Intention to Use Promotions Promotion Type (% Response)
Future Intention to Use Coupons Refunds Premiums Extremely likely 51 12 8 Very likely 23 13 7 Somewhat likely 14 25 18 Somewhat unlikely 2 8 12 Very unlikely 3 12 15 Extremely unlikely 7 30 40
Note: Percentages were derived from a base N of 300.
As with past promotional usage, men and women significantly differed in
their future intent to use coupons(! (298) = 3.80, .Q < .01) and future intent to use
refunds(! (298) = 2.12, .Q < .01) with women the most likely to report intended
usage. Once again, however, there was no significant gender difference in
intended usage of premiums. Additional analysis indicated that there were no
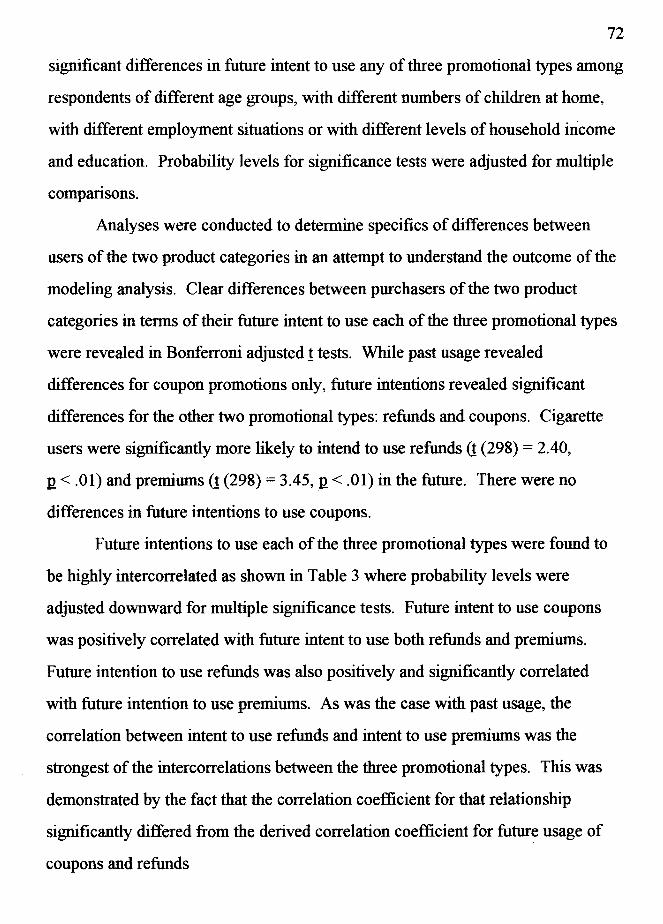
72
significant differences in future intent to use any of three promotional types among
respondents of different age groups, with different numbers of children at home,
with different employment situations or with different levels of household income
and education. Probability levels for significance tests were adjusted for multiple
compansons.
Analyses were conducted to determine specifics of differences between
users of the two product categories in an attempt to understand the outcome of the
modeling analysis. Clear differences between purchasers of the two product
categories in terms of their future intent to use each of the three promotional types
were revealed in Bonferroni adjusted ! tests. While past usage revealed
differences for coupon promotions only, future intentions revealed significant
differences for the other two promotional types: refunds and coupons. Cigarette
users were significantly more likely to intend to use refunds(! (298) = 2.40,
u < .01) and premiums(! (298) = 3.45, I!< .01) in the future. There were no
differences in future intentions to use coupons.
Future intentions to use each of the three promotional types were found to
be highly intercorrelated as shown in Table 3 where probability levels were
adjusted downward for multiple significance tests. Future intent to use coupons
was positively correlated with future intent to use both refunds and premiums.
Future intention to use refunds was also positively and significantly correlated
with future intention to use premiums. As was the case with past usage, the
correlation between intent to use refunds and intent to use premiums was the
strongest of the intercorrelations between the three promotional types. This was
demonstrated by the fact that the correlation coefficient for that relationship
significantly differed from the derived correlation coefficient for future usage of
coupons and refunds
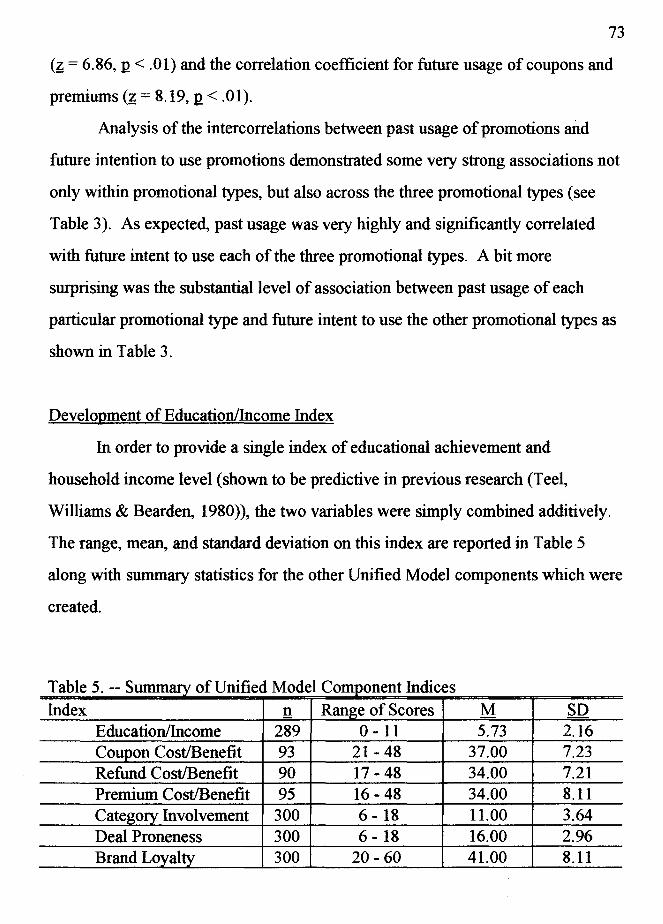
73
(~ = 6.86, .Q < .01) and the correlation coefficient for future usage of coupons and
premiums(~= 8.19, .Q < .01).
Analysis of the intercorrelations between past usage of promotions and
future intention to use promotions demonstrated some very strong associations not
only within promotional types, but also across the three promotional types ( see
Table 3). As expected, past usage was very highly and significantly correlated
with future intent to use each of the three promotional types. A bit more
surprising was the substantial level of association between past usage of each
particular promotional type and future intent to use the other promotional types as
shown in Table 3.
Develo,Qment of Education/Income Index
In order to provide a single index of educational achievement and
household income level (shown to be predictive in previous research (Teel,
Williams & Bearden, 1980)), the two variables were simply combined additively.
The range, mean, and standard deviation on this index are reported in Table 5
along with summary statistics for the other Unified Model components which were
created.
T bl 5 S a e . -- ummary o fU "fi dM d 1 C me o e omponent lndi ces
Index n Range of Scores M SD Education/Income 289 0- 11 5.73 2.16 Coupon Cost/Benefit 93 21- 48 37.00 7.23 Refund Cost/Benefit 90 17-48 34.00 7.21 Premium Cost/Benefit 95 16-48 34.00 8.11 Category Involvement 300 6 - 18 11.00 3.64 Deal Proneness 300 6- 18 16.00 2.96 Brand Loyalty 300 20-60 41.00 8.11
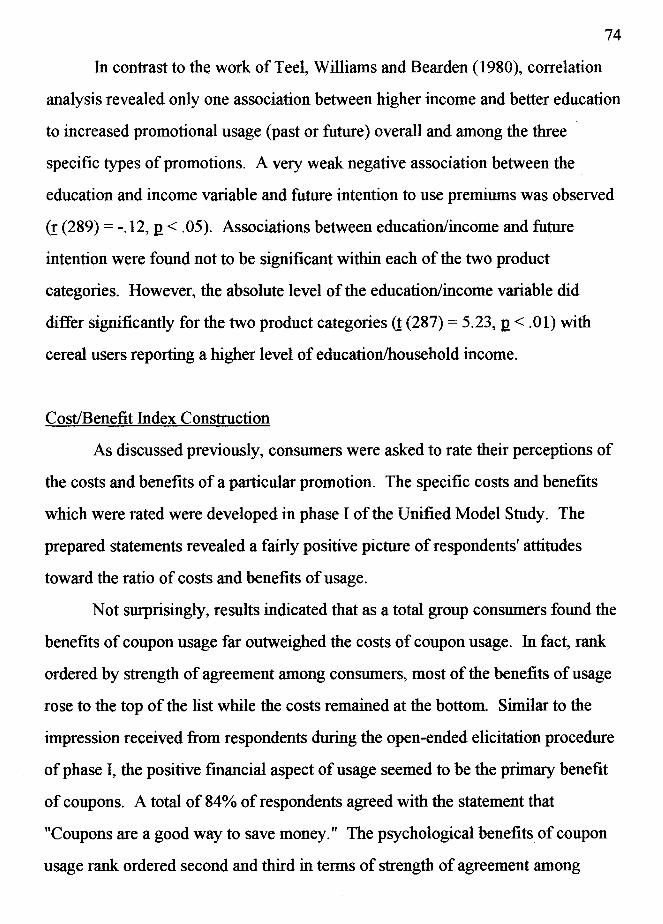
74
In contrast to the work of Teel, Williams and Bearden (1980), correlation
analysis revealed only one association between higher income and better education
to increased promotional usage (past or future) overall and among the three
specific types of promotions. A very weak negative association between the
education and income variable and future intention to use premiums was observed
(! (289) = -.12, I!< .05). Associations between education/income and future
intention were found not to be significant within each of the two product
categories. However, the absolute level of the education/income variable did
differ significantly for the two product categories(! (287) = 5.23, I!< .01) with
cereal users reporting a higher level of education/household income.
Cost/Benefit Index Construction
As discussed previously, consumers were asked to rate their perceptions of
the costs and benefits of a particular promotion. The specific costs and benefits
which were rated were developed in phase I of the Unified Model Study. The
prepared statements revealed a fairly positive picture of respondents' attitudes
toward the ratio of costs and benefits of usage.
Not surprisingly, results indicated that as a total group consumers found the
benefits of coupon usage far outweighed the costs of coupon usage. In fact, rank
ordered by strength of agreement among consumers, most of the benefits of usage
rose to the top of the list while the costs remained at the bottom. Similar to the
impression received from respondents during the open-ended elicitation procedure
of phase I, the positive financial aspect of usage seemed to be the primary benefit
of coupons. A total of 84% of respondents agreed with the statement that
"Coupons are a good way to save money." The psychological benefits of coupon
usage rank ordered second and third in terms of strength of agreement among

75
consumers. That is, 77% of consumers agreed with the statement that "When I use
coupons, I feel like a smart shopper" and 67% agreed that "When I use coupons, I
feel good." The benefit statement of "It's fun to cut, organize and compare
coupons rated only seventh in terms of strength of agreement among consumers
(37%). In terms of the costs rated, only 39% of consumers agreed that "Using
coupons often means I have to buy more expensive brands or larger sizes," only
38% agreed that "It takes too much effort to cut, organize and cash-in coupons"
and only 37% felt that "Coupons take too much time to cut, organize and cash-in."
Additionally, the statements "Using coupons for one brand often means missing
out on deals for other brands" and "Using coupons can make me look a little cheap
to other people" were agreed with by as few as 31 % and 16% respectively.
Like coupons, the primary benefit of refunds as evidenced by strength of
agreement among the total group of consumers was the financial benefit. In all,
81% of respondents agreed that "Refunds are a good way to save money." And
like coupons, the psychological benefits of feeling like a smart shopper and feeling
good ranked second ( 68%) and third ( 64 % ) respectively in terms of strength of
agreement among respondents. The other two benefit statements, however, were
agreed with by only about a third of the respondent group. Those statements
included "When I send in for a refund, I look smart or efficient to other people"
(35%) and "Its fun to cut, organize, and send in for refunds" (28%). Both the
effort and time costs involved in redeeming refunds were considered to be too
much by 52% of respondents. While about 32% of respondents agreed that "It
generally costs too much in postage and envelopes to send in for refunds, only 4%
of respondents believed that "Sending in for a refund can make me look a little
cheap to other people."

76
As was the case for both coupons and refimds, the benefits associated with
premium usage rose to the top of the list of cost and benefit statements rank
ordered by strength of agreement among respondents. A total of 73% of
respondents agreed that "Premium offers can help save money by allowing me to
trade in proofs-of-purchase for special items at a reduced price" while 64 % agreed
that "Premium offers allow me to purchase useful or valuable items." Once again
the psychological benefits followed the financial benefits in the rank ordered list
with 59% agreement with the statement that "When I send away for a premium
gift, I feel good" and 58% agreement that "When I send in for a premium gift, I
feel like a smart shopper." Additionally, 53% agreed with the benefit statement
that "It's fim to send away for premium gifts." The costs associated with
premiums, however, were not forgotten by respondents. The two statements
reflecting the time and effort costs involved in premium usage were agreed with by
56% and 46% of respondents respectively. A full 45% of respondents agreed that
"It's too risky to send away for premium gifts that may not be what you expected,"
while 40% believed that "It generally costs too much in cash, postage and
envelopes to send away for a premium gift."
In order to construct appropriate indices of consumer's perceptions of the
costs and benefits of a particular promotion, an initial item analysis was
conducted. The item analysis consisted of tabulating the interitem correlations
between each of the nine cost or benefit statements rated for a particular promotion
type. Thus, three separate item analyses were conducted, one for each of the
promotion types ( coupons, refimds and premiums). As stated, an internal
consistency estimate was computed for the nine items using Cronbach's coefficient
alpha to determine which items should be removed from the index in order to
develop a more reliable estimate of the construct under consideration. As noted

77
previously, cost/benefit statements were rated along a 5 point scale ranging from
strongly agree which carried a rating of 6 to strongly disagree which carried a
rating of 2. All items reflecting a negative attitude were recoded to reverse the
weighting of the scale. All "don't know" responses were coded as missing values
and were not included in the item analysis.
The results of the coupon item analysis shown in Table 6 were very
encouraging in that only one item was dropped from the nine cost/benefit
statements rated for each of the three promotional types. Each of the other
cost/benefit statements elicited during phase I proved to be both important to
consumers and to be consistent with ratings of the other cost/benefit items for that
particular promotional type. In addition, in each case the total internal consistency
index was fairly high given the wide range of costs and benefits included. In fact,
Cronbach's coefficient alpha was over .81 in all three cases.
Cronbach's coefficient alpha for the nine original statements included in the
cost/benefit attitude component for coupons was .80. Analysis of the change in
Cronbach's alpha as each item was deleted suggested that one item be removed
from further analysis (see Table 6). Removal of the item "Using coupons often
means I have to buy more expensive brands or larger sizes" increased the overall
alpha to .82. Removal of additional items would not have increased internal
consistency of the cost/benefit index for coupons.
The overall Cronbach's coefficient alpha for the nine original statements
included in the cost/benefit attitude component for refunds was . 79. As in the case
of coupon promotions, review of the individual items suggested the removal of one
item from further analysis (see Table 7). Once the item "Sending in for a refund
can make me look a little cheap to other people" was removed from analysis,
Cronbach's alpha increased to . 81. Removal of any additional items would
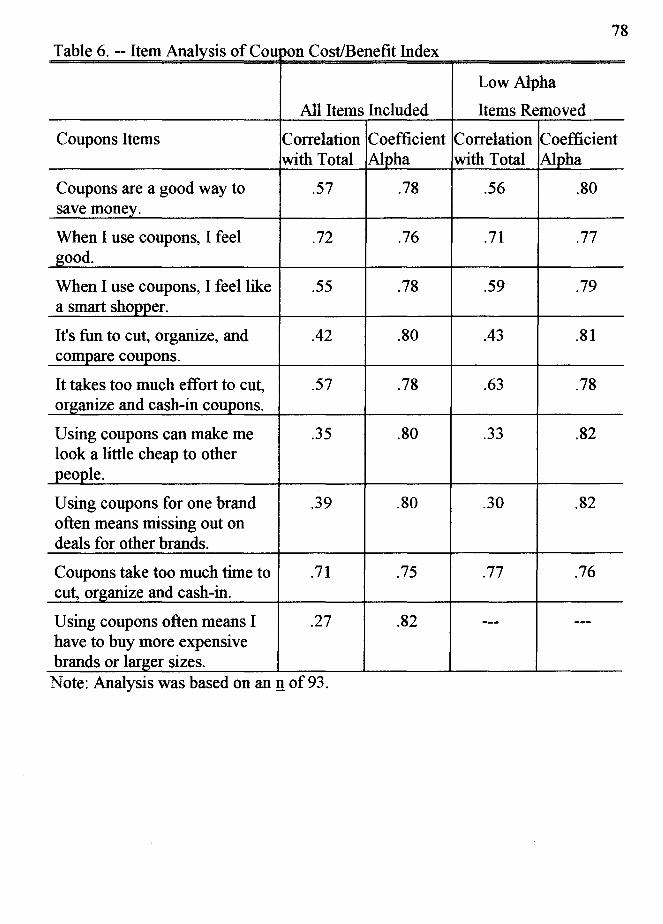
78 T bl 6 It Anal . f C a e -- em tys1s o OU )On OS ene 1t C t/B fi Ind ex
Low Alpha
All Items Included Items Removed
Coupons Items Correlation Coefficient Correlation Coefficient with Total Alpha with Total Alpha
Coupons are a good way to .57 .78 .56 .80 save money.
When I use coupons, I feel .72 .76 .71 .77 good.
When I use coupons, I feel like .55 .78 .59 .79 a smart shopper.
It's fun to cut, organize, and .42 .80 .43 .81 compare coupons.
It takes too much effort to cut, .57 .78 .63 .78 organize and cash-in coupons.
Using coupons can make me .35 .80 .33 .82 look a little cheap to other people.
Using coupons for one brand .39 .80 .30 .82 often means missing out on deals for other brands.
Coupons take too much time to .71 .75 .77 .76 cut, organize and cash-in.
Using coupons often means I .27 .82 --- ---have to buy more expensive brands or larger sizes. Note: Analysis was based on an !! of 93.
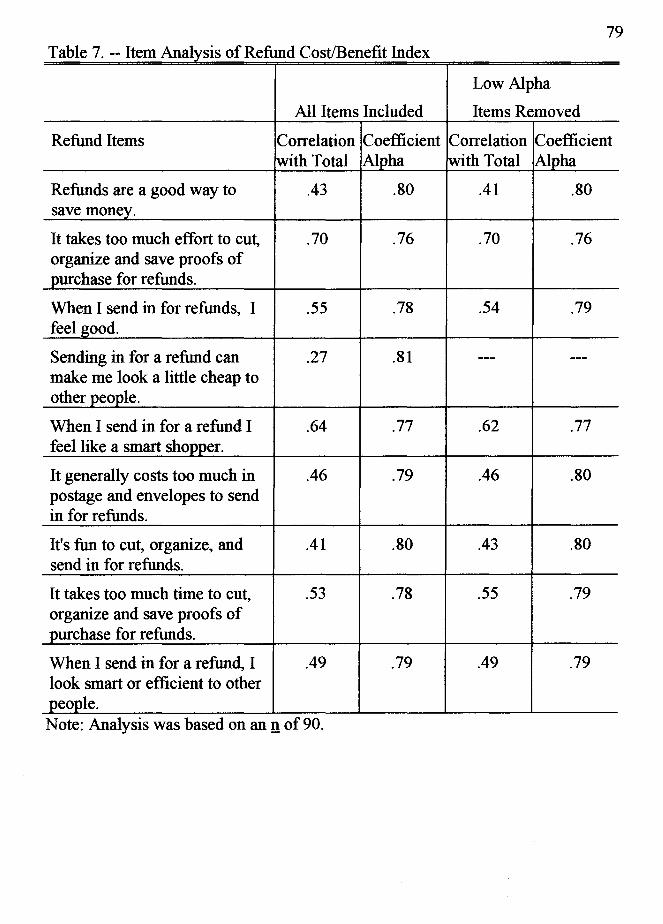
79 T bl 7 I An 1 . f R fund C t/B fi Ind a e -- tern atys1s o e OS ene 1t ex
Low Alpha
All Items Included Items Removed
Refund Items Correlation Coefficient Correlation Coefficient ~ith Total Alpha with Total Alpha
Refunds are a good way to .43 .80 .41 .80 save money.
It takes too much effort to cut, .70 .76 .70 .76 organize and save proofs of purchase for refunds.
When I send in for refunds, I .55 .78 .54 .79 feel good.
Sending in for a refund can .27 .81 --- ---make me look a little cheap to other people.
When I send in for a refund I .64 .77 .62 .77 feel like a smart shopper.
It generally costs too much in .46 .79 .46 .80 postage and envelopes to send in for refunds.
It's fun to cut, organize, and .41 .80 .43 .80 send in for refunds.
It takes too much time to cut, .53 .78 .55 .79 organize and save proofs of purchase for refunds.
When I send in for a refund, I .49 .79 .49 .79 look smart or efficient to other people. Note: Analysis was based on an n of 90.
80
not have increased the internal consistency index for the cost/benefit attitude index
for refunds.
Cronbach's coefficient alpha for the nine original cost/benefit statements for
premiums was .82. As shown in Table 8, removal of the item "It's too risky to
send away for premium gifts that may not be what you expected" increased the
coefficient alpha to .84. Removal of any additional items would not have
increased the internal consistency index for the cost/benefit attitude index for
premium promotions.
Following the item analysis, a separate cost/benefit index was constructed
from the eight remaining cost/benefit statements rated for each promotional type.
As noted, items had been rated on a 5 point scale where 2 indicated strong
disagreement with the statement and 6 indicated strong agreement with the
statement. As stated previously, items that reflected a more negative attitude
toward using a particular promotion were recoded in reverse order in preparation
for creating the summed index. That is, items reflecting a negative attitude such as
"coupons take too much time to cut, organize and cash-in" were recoded so that a
response of 2 was recoded to a response of 6, a rating of 3 was recoded to a rating
of 5 and so on.
A single cost/benefit index was then constructed for each promotional type
by summing respondent ratings for the eight cost/benefit statements.
Theoretically, respondent scores on the cost/benefit index for the promotion rated
could have ranged from 16 to 48 with a higher rating indicating a more positive
attitude toward using a promotion. Higher scores indicated greater agreement with
benefit statements and lower agreement with cost statements. The mean, standard
deviation, and range of cost/benefit scores for each individual promotional type are
shown in Table 5. An analysis of differences between the two product categories

81 T bl 8 It Anal . f P a e -- em lySIS 0 remmm C t/B fit Ind OS ene 1 ex
Low Alpha
All Items Included Items Remov~d
Premium Items Correlation Coefficient Correlation Coefficient with Total Alpha with Total Alpha
Premium offers allow me to .59 .80 .60 .82 purchase valuable items.
It takes too much effort to cut, .59 .80 .57 .83 save and send in proofs of purchase for premiums.
When I send away for a .. 52 .81 .56 .83 premium gift, I feel good.
It's too risky to send away for .20 .84 --- ---premium gifts that may not be what you expected.
When I send in for a premium .57 .81 .57 .82 ~ift, I feel like a smart shopper.
It generally costs too much in .52 .81 .49 .84 cash, postage and envelopes to send away for a premium gift.
It's fun to send for premiums. .67 .79 .69 .81
It takes too much time to cut, .63 .80 .62 .82 save and send in proofs of purchase for premium offers.
Premium offers can help save .49 .81 .51 .83 money by allowing me to trade proofs of purchase for special items at a reduced price. Note: Analysis was based on an n of 95.

revealed that cigarette users reported a significantly higher level of total
promotional benefits to costs (! (276) = 3 .17, I! < . 01 ). The average cigarette
purchaser score was 36.92 with a standard deviation of 7.24 while the average
cereal purchasers score was 34.07 with a standard deviation of 7.77.
Category Involvement Index Construction
82
A simple review of the frequency distributions of responses to the three
category involvement items indicated that a fair number of respondents appeared
to be involved in the category of interest. That is, 42% agreed that "I like to tty
new kinds of (the product category) when they come out" and 28% agreed that "I
like to compare different brands of ( the product category) to make sure I am
getting the best one." Additionally, 23% reported that "I like shopping and picking
out (product category)."
Results of a simple item analysis conducted of the three statements included
in the questionnaire to measure each respondent's degree of personal involvement
with the product category of interest are shown in Table 9. All "don't know"
responses were coded as missing values and were not included in the item
analysis. Cronbach's coefficient alpha for the three items was . 70. Removing any
of the three items would not have increased the internal consistency by enough to
warrant reducing the index to only two items.
An index of each respondent's personal involvement with the category of
interest was constructed by summing the ratings of the three individual category
involvement statements. The mean, standard deviation, and range of this score are
reported in Table 5. Subjects who rated the category involvement items as "don't
know," of course, received scores of 0 on this index and their responses were not
included in further analysis utilizing the category involvement construct.
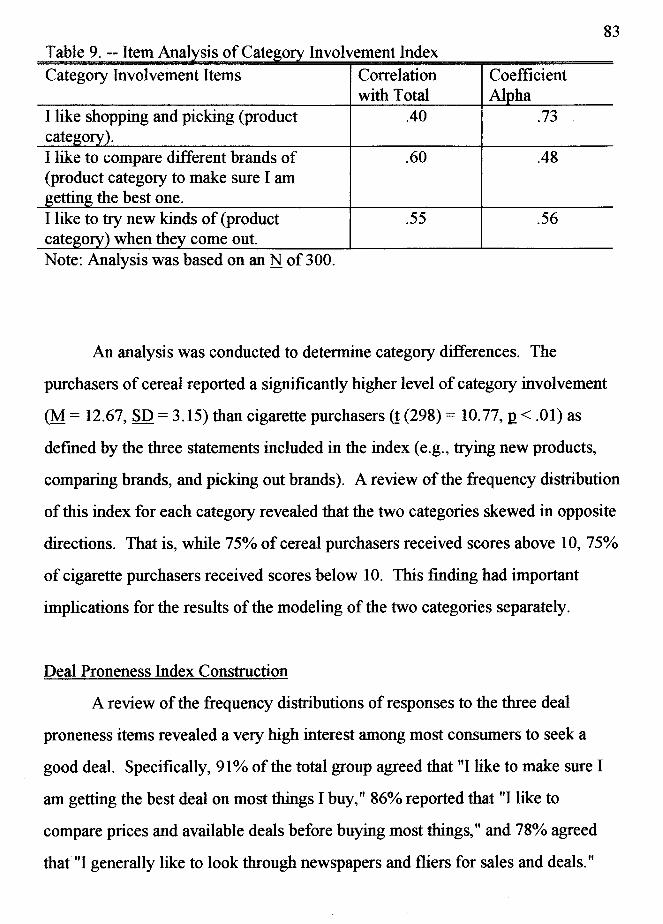
Table 9. -- Item Anal sis of Cate o Involvement Index Category Involvement Items Correlation
with Total I like shopping and picking (product .40 cate o I like to compare different brands of . 60 (product category to make sure I am
ettin the best one. I like to try new kinds of (product .55 cate o when the come out. Note: Analysis was based on an N of 300.
Coefficient Al ha
.73
.48
.56
83
An analysis was conducted to determine category differences. The
purchasers of cereal reported a significantly higher level of category involvement
(M = 12.67, SD= 3.15) than cigarette purchasers(! (298) = 10.77, I!< .01) as
defined by the three statements included in the index ( e.g., trying new products,
comparing brands, and picking out brands). A review of the frequency distribution
of this index for each category revealed that the two categories skewed in opposite
directions. That is, while 75% of cereal purchasers received scores above 10, 75%
of cigarette purchasers received scores below 10. This finding had important
implications for the results of the modeling of the two categories separately.
Deal Proneness Index Construction
A review of the frequency distributions of responses to the three deal
proneness items revealed a very high interest among most consumers to seek a
good deal. Specifically, 91 % of the total group agreed that "I like to make sure I
am getting the best deal on most things I buy," 86% reported that "I like to
compare prices and available deals before buying most things," and 78% agreed
that "I generally like to look through newspapers and fliers for sales and deals."

84
Another simple item analysis was conducted of the three statements
included in the questionnaire to measure each respondent's overall degree of deal
proneness (see Table 10). All "don't know" responses were coded as missing
values and were not included in the item analysis. Using Cronbach's coefficient
alpha, it was determined that the total internal consistency for the three items rated
was . 77. Removing any of the three items would not have increased the internal
consistency index significantly.
T bl 10 I a e . -- tern An 1 . fD 1 P atys1s o ea roneness Ind ex Deal Proneness Items Correlation Coefficient
with Total Alpha I like to make sure I am getting the best .51 .78 deal on most thing I buy. I like to compare prices and available deals .72 .55 before buying most things. I generally like to look through .61 .70 newspapers and fliers for sales and deals.
An index of each respondent's overall degree of deal proneness was
constructed by summing the ratings of the three individual deal proneness
statements. The mean, standard deviation and range of this index are reported in
Table 5. The average score of 16 on this index again demonstrated the pervasive
interest in deals and promotions among the total group of respondents.
An analysis to identify category specific differences determined that while
users within both categories were highly deal prone, cigarette purchasers were a
bit more deal prone than the cereal purchasers interviewed(! (298) = 2.16, 1! <.01).
The average cigarette user received a deal proneness score of 16.26 with a

85
standard deviation of 2.61 while the average cereal user received a deal proneness
score of 15.49 with a standard deviation of 3.30. Unlike the category involvement
index, scores on deal proneness for both product categories were skewed
positively.
Brand Loyalty Index Construction
The brand loyalty component was constructed a bit differently due to the
unique nature of the four statements used to measure brand loyalty. In essence,
the four statements rated by respondents represented four different categories of
loyalty behavior. According to the literature, some consumers show strong long
term loyalty to a brand. This group of consumers, therefore, should theoretically
receive the highest brand loyalty scores in any analysis of the data. Other
consumers were reported in the literature to show loyalty to more than one brand
within a product category. Such consumers were said to show a rotating pattern of
purchases as they tried to keep several brands in stock in the household. Given
this definition, this group of consumers could be said to have a moderately high
level of brand loyalty. A third group of consumers was shown in the literature to
have short bursts of loyalty to brands within a category. Such a short loyal
consumer could be said to have a moderately low level of brand loyalty. The
fourth group of consumers discussed in the brand loyalty literature was said to
show little loyalty in that they will choose their brand purchases on the basis of
price and promotional availability. This consumer group could be said to have the
lowest level of brand loyalty. Under those theoretical assumptions weights were
assigned to the four brand loyalty statements to reflect the degree of brand loyalty
associated with each. Thus, the statement reflecting long loyalty to a particular
brand within a particular product category was assigned the weight of 4, the
86
statement reflecting rotation among brand purchases was assigned the weight of 3,
the statement reflecting short loyalty was assigned a 2, and the price/promotion
sensitivity statement was assigned a 1.
In constructing an index of brand loyalty for each respondent, self-ratings
for each of the four statements were first multiplied by the appropriate loyalty
rating for each statement. Of course, the response of 1 or "don't know" had
previously been recoded to 0. The products of the four weighted ratings were then
summed to arrive at a total brand loyalty score which reflected not only an
individual's self-perceptions of loyalty, but also reflected the theoretical
underpinnings of the categorization of loyalty. For example, using the scale of 2
to 6 where a 2 meant strongly disagreed with a statement and 6 meant strongly
agreed with a statement, a respondent could have rated himself or herself as a 6 on
long loyalty, a 4 on rotation, a 2 on short loyalty, and a 2 on price sensitivity. As
part of the brand loyalty index construction, those self-ratings would have been
multiplied by the weights of 4, 3, 2 and 1 respectively. The products of the
weighting would have been 24 on long loyalty, 12 on rotational purchasing, 4 on
short loyalty, and 4 on price sensitivity. The summed products of the weighted
ratings would have been 42. The mean, standard deviation, and range of this score
are reported in Table 5.
This method of constructing the brand loyalty index was chosen over two
alternative methods. Obviously, respondent ratings on the four statements could
not have been summed without weights. Such a non-weighted summation would
have led to an inability to discriminate between the four statements since degree of
brand loyalty would not have been reflected clearly. Thus, a respondent who
strongly agreed (6) with the long loyalty statement and strongly disagreed (2) with
the other three statements would have received the same summed brand loyalty

87
score of 12 as someone who agreed strongly with the price sensitive statement ( 6),
but strongly disagreed with the other three statements. The weighted method
chosen was, therefore, considered preferable to an non-weighted method. The
weighted method was also considered preferable to a forced choice between the
four statements either on the respondent's part at the time of completion of the
questionnaire or on the part of the investigator during the course of analysis.
Allowing respondents to rate themselves on the four statements allowed for the
very likely possibility that consumers did not always fall neatly into only one
category. It seemed entirely possible that a consumer could see themselves as
being long loyal to one brand, but rotating purchases among a couple of additional
brands. The summed multiple weighted rating system used allowed respondents to
express mixed loyalty types while allowing the degree of loyalty to be expressed
through the weights assigned to the statements. This system also avoided the
necessity of having to remove from further analysis respondents who gave
themselves the same exact rating on one or more of the four brand loyalty
statements. The alternative method of assigning loyalty on the basis of the
statement which received the highest rating would have posed the problem of
being unable to assign a clear loyalty rating to individuals with identical statement
ratings.
Once again an analysis was conducted to determine if category specific
differences existed. Results of a t test revealed that the purchasers of cereal
reported a significantly higher level of brand loyalty than cigarette purchasers
(! (298) = 10.83, n < .01). The average cereal purchaser score on the brand
loyalty index was 45.93 with a standard deviation of 8.09 while the average
cigarette purchaser score was 37.06 with a standard deviation of 5.25.
88
Association Between Unified Model Indices
Results of an analysis of the correlations between the predictor indices
constructed for the Unified Model for each promotional type including: perception
of costs and benefits, category involvement, brand loyalty, deal proneness and the
combination education/income index are shown in Table 11. Probability levels in
this table were adjusted downward to compensate for multiple significance tests.
This table fairly reflects the predicted model matrix for the structural equation
modeling on the total group data. As expected, deal proneness was significantly
and positively correlated to each of the three indices of costs and benefits of
promotional use. Deal proneness was also significantly negatively related to the
combined education and household income variable. It was not significantly
related to category involvement or brand loyalty, however. In fact, brand loyalty
was related mainly to category involvement. That correlation was positive and
fairly strong. Besides deal proneness, the combination variable of education and
income positively correlated with brand loyalty.
Comparison of Users/Nonusers on Model Indices
An analysis of the differences between identified users and nonusers of
each of the three types of consumer promotions within the two product categories
proved interesting. Significant differences between users and nonusers when
considering all five of the key Unified Model components were found in the
cigarette category for the two promotional types of coupons (E (22, 23) = 2.28,
p < .05) and premiums CE (22, 22) = 4.59, I!< .05). Significant differences
between users and nonusers on the model components were also found in the
cereal category for coupon promotions (E (22, 22) = 6.82, I!< .05) and premium
promotions (E (22, 23) = 4.26, I!< .05). Specific Bonferroni adjusted paired

T bl 11 P a e -- earson C 1 ti orre a ons among m 1e o e U "fi d M d 1 C t omponen s Category Brand Deal Education Involvement Loyalty Proneness Income
Coupon .10 -.14 .61** -.16
Cost/Benefit (93) (93) (93) (93)
Refund -.02 -.11 .25* -.20
Cost/Benefit (90) (90) (90) (90)
Premium .13 -.06 .30* -.15
Cost/Benefit (95) (95) (95) (95)
Category 1.0 .48** .13 .08
Involvement (300) (300) (300) (300)
Brand Loyalty 1.0 .07 .15* (300) (300) (300)
Deal Proneness 1.0 -.14* (300) (300)
Notes: Figures in parentheses are base n's for the adjacent correlations.
* 12 < .01 ** 12 < .0001
comparison tests within the cereal product category cells indicated significant
differences between users and nonusers of coupons in terms of brand loyalty
89
(! (44) = 2.54, 12 < .01), deal proneness(! (44) = 4.09, 12 < .01) and attitudes toward
the costs/benefits of usage(! (44) = 5.01, 12 < .01) and significant differences
between users and nonusers of premiums in terms of category involvement
(! (45) = 3.15, 12 < .01) as well as attitudes toward the costs/benefits of usage
(! (45) = 3.02, 12 < .01). Within the cigarette category, users and nonusers of
coupons differed in level of deal proneness(! (45) = 2.30, 12 < .01) and attitudes
toward the costs/benefits of usage(! (45) = 2.74, 12 < .01) while users and nonusers
of premiums significantly differed only in the cost/benefit attitude component
(! (44) = 4.52, 12 < .01).

90
Preparation for Structural Equation Modeling
Early analyses focused on "cleaning" the data in preparation for structural
equation modeling. Frequency distributions and scatter diagrams were used to
identify and correct several outliers from the dataset which may have resulted in
poor estimates or grossly incorrect standard errors and hypothesis testing. Three
respondent records were corrected for data entry errors which caused variable
values to be abnormal and extreme in some cases. A total of 22 respondent
records were not used because respondents had not provided usable information on
one or more of the key model components. Many of these missing values were
nonresponses or "Don't know" responses on the cost/benefit statements or the
education and income variables. As part of the screening process, variables were
examined for normality to reduce the possibility of kurtosis which may have led to
poor estimation of relationships between variables. As mentioned previously, the
variable of deal proneness in particular showed signs of kurtosis which needed to
be addressed in choosing the particular robust type of modeling procedure
( CALIS) and interpretation. In order to facilitate the modeling procedure chosen,
all variables were converted to ~-scores with a mean of O and a standard deviation
of 1.
Testing the General Viability of the Unified Model
The first objective of the modeling analysis was to establish the general
viability of the proposed Unified Model of Consumer Promotional Usage. That is,
an analysis was conducted to assess the potential for the Unified Model as shown
in Figure 3 to accurately describe the relationship between the proposed key
variables involved in promotional usage regardless of type of promotion or product

91
category. This analysis was conducted on the total respondent sample of which
278 possessed data for each of the variables in the model.
While the model shown in Figure 3 served as the theoretical outline or"what
motivates consumers to use promotions, it was expected that it would be difficult
for respondents to differentiate past behavior from future intention due to the
single point in time and self report nature of the data collected. Actual behavior
was not measured due to the length of time which would have been needed as well
as the extreme difficulty in obtaining permission to obtain such an accurate
measurement within stores. Given that respondents were asked about both past
and future behavior at the same point in time, the two responses, and therefore the
two model components, were expected to be so highly correlated in all three
promotional cases that there would have been little variance remaining to the other
variables in the model. While past usage or habit was believed to be a strong
direct determinant of the predicted variable of future intention, theoretically it
should not have dominated the entire process. As anticipated, extremely high
correlations between past usage and future intention were observed and were
believed to have been inflated by measurement error due to the single point in
time, self-response measurement used in this study. To avoid introducing this
measurement artifact into the modeling analysis, it was necessary to choose
between future intention and past behavior as the dependent variable.
Based on previous research in the area of the attitude and behavior
relationship, past behavior was chosen as the preferred dependent variable for the
modeling analysis. Triandis (1980) provided the clearest rational for this choice in
explanation of his theoretical model of attitudes, values, behavioral dispositions,
and behavior. Triandis hypothesized that the probability of any specific act
occurring may be a function of the sum of behavioral intentions (multiplied by
92
several other factors). Habits in Triandis' tenninology refer to actions or patterns
of actions that occur frequently, causing people to learn to rely on automatic
processing rather than direct self-instruction (i.e.: intention). Triandis argue·s that
such learned behaviors or "habits" can be measured by asking how frequently the
behavior has occurred in the past. Triandis hypothesized that as the frequency of
an act increases, reports of past behavior (habits) become most predictive of future
behavior. He further hypothesized that reported intentions of behavior become
less predictive of past behavior for two reasons: 1) cues that elicit verbal responses
to questions about behavior (e.g., intentions) may not be the same as cues that
elicit actual actions (e.g., past behavior) and, 2) intentions may be more crucial
when active cognitive processing is required (e.g., novel situations) versus
situations requiring little active processing ( e.g., repetitive/routine situations such
as grocery shopping). A large body of empirical support for Triandis' hypothesis
has developed (Brinberg, 1979; Landis, Triandis & Adamopoulos, 1978; Mobley,
Homer & Hollingsworth, 1978; Pomazal, 1974; Ryan, 1970; Schachter, Festinger,
Willerman & Hyman, 1961). Given the repetitive nature of promotional behaviors
for users and the repetitive nature of grocery shopping for consumers, past
behavior was deemed a more appropriate dependent variable for the modeling
analysis as shown in Figure 5.
For modeling purposes, each of the variables outlined in the content area of
person predisposition were entered separately into the predictive equation. That
is, deal proneness and education/income level were each entered into the model as
a separate variable on par with the brand loyalty and category involvement
variables.
The modeling analysis involved structural equation modeling using the
robust CALIS procedure outlined under the LINEQS statement in the
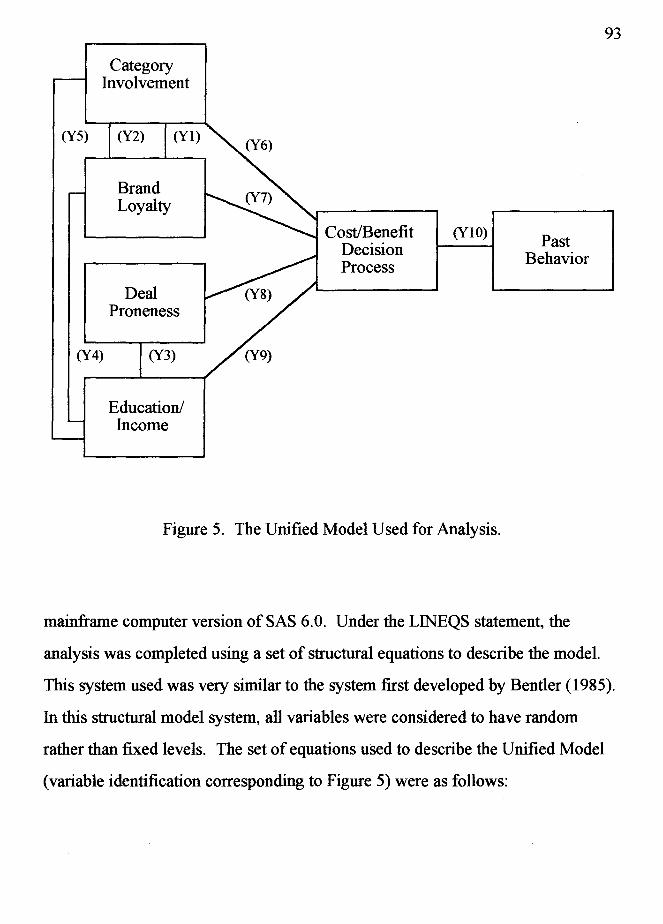
(Y5)
Category Involvement
(Y2)
Brand Loyalty
(Yl)
Deal Proneness
(Y4) (Y3)
Education/ Income
Cost/Benefit Decision Process
(YlO)
Figure 5. The Unified Model Used for Analysis.
Past Behavior
93
mainframe computer version of SAS 6.0. Under the LINEQS statement, the
analysis was completed using a set of structural equations to describe the model.
This system used was very similar to the system first developed by Bentler (1985).
In this structural model system, all variables were considered to have random
rather than fixed levels. The set of equations used to describe the Unified Model
(variable identification corresponding to Figure 5) were as follows:
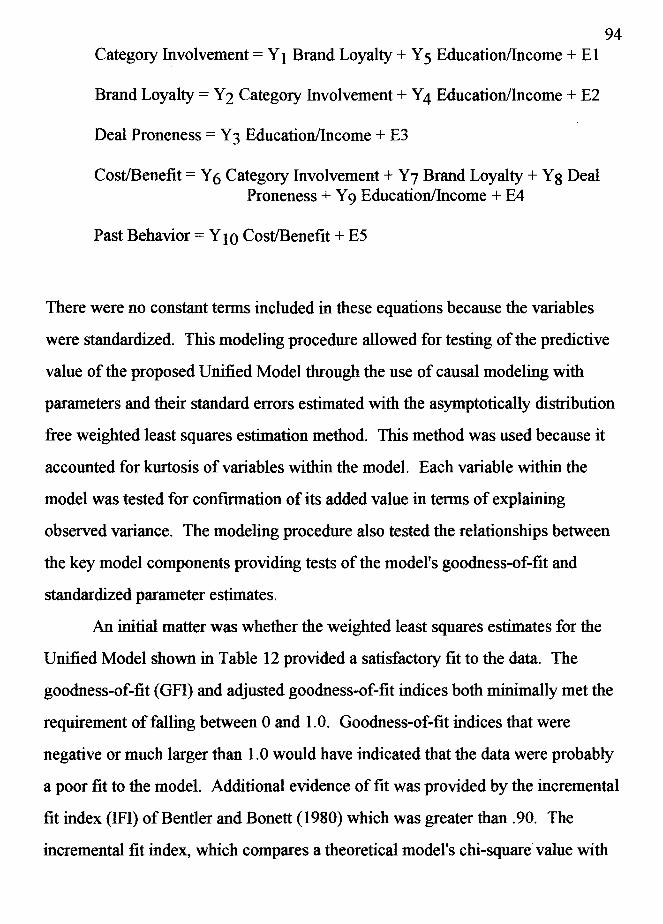
Category Involvement= Y 1 Brand Loyalty+ Y 5 Education/Income + El
Brand Loyalty = Y 2 Category Involvement + Y 4 Education/Income + E2
Deal Proneness = Y 3 Education/Income + E3
Cost/Benefit = Y 6 Category Involvement + Y 7 Brand Loyalty + Y g Deal Proneness + Y 9 Education/Income + E4
Past Behavior = Y 1 o Cost/Benefit + E5
94
There were no constant terms included in these equations because the variables
were standardized. This modeling procedure allowed for testing of the predictive
value of the proposed Unified Model through the use of causal modeling with
parameters and their standard errors estimated with the asymptotically distribution
free weighted least squares estimation method. This method was used because it
accounted for kurtosis of variables within the model. Each variable within the
model was tested for confirmation of its added value in terms of explaining
observed variance. The modeling procedure also tested the relationships between
the key model components providing tests of the model's goodness-of-fit and
standardized parameter estimates.
An initial matter was whether the weighted least squares estimates for the
Unified Model shown in Table 12 provided a satisfactory fit to the data. The
goodness-of-fit (GFI) and adjusted goodness-of-fit indices both minimally met the
requirement of falling between 0 and 1.0. Goodness-of-fit indices that were
negative or much larger than 1.0 would have indicated that the data were probably
a poor fit to the model. Additional evidence of fit was provided by the incremental
fit index (IFI) of Bentler and Bonett (1980) which was greater than .90. The
incremental fit index, which compares a theoretical model's chi-square value with

95 Table 12. -- Structural Model Results of Total and Promotional Samples
Standardized Path Coefficients Model
Path Coeffi- Total Coupons Refunds Premiums cient
Exou:enous Paths Education/Income - Deal Y3 -.17* -.25* -.10 -.03 Proneness Education/Income - Y4 .11* .28* -.04 .06 Brand Loyalty Education/Income - Y5 .04 .07 .09 -.03 Category Involvement Education/Income - Y9 -.16* -.18* -.23* -.10 Cost/Benefit Endog:enous Paths Category Involvement - Y1 .26* .15* .22* .37* Brand Loyalty Brand Loyalty - Y2 .27* .22* .23* .37* Category Involvement Category Involvement - Y6 .13* .17* .05 .20* Cost/Benefit Brand Loyalty - Y7 -.18* .09 -.17 -.30* Cost/Benefit Deal Proneness - y8 .30* .60* .22* .25* Cost/Benefit Cost/Benefit - Y10 .43* .72* .39* .48* Past Behavior
Goodness of Fit (GFI) .99 .99 .99 .99 Adjusted Goodness of Fit (AGFI) .98 .99 .99 .98 Incremental Fit Index (IFI) .92 .90 .93 .98 Root Mean Squared Residuals .06 .10 .06 .10
* p < .05
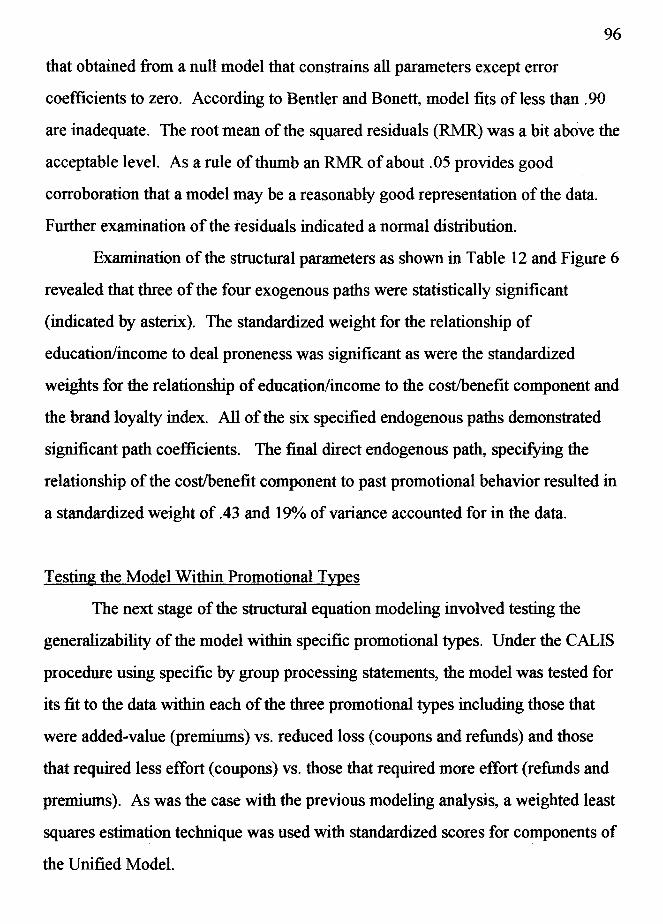
96
that obtained from a null model that constrains all parameters except error
coefficients to zero. According to Bentler and Bonett, model fits of less than .90
are inadequate. The root mean of the squared residuals (RMR) was a bit above the
acceptable level. As a rule of thumb an RMR of about . 05 provides good
corroboration that a model may be a reasonably good representation of the data.
Further examination of the residuals indicated a normal distribution.
Examination of the structural parameters as shown in Table 12 and Figure 6
revealed that three of the four exogenous paths were statistically significant
(indicated by asterix). The standardized weight for the relationship of
education/income to deal proneness was significant as were the standardized
weights for the relationship of education/income to the cost/benefit component and
the brand loyalty index. All of the six specified endogenous paths demonstrated
significant path coefficients. The final direct endogenous path, specifying the
relationship of the cost/benefit component to past promotional behavior resulted in
a standardized weight of .43 and 19°/o of variance accounted for in the data.
Testing the Model Within Promotional Types
The next stage of the structural equation modeling involved testing the
generalizability of the model within specific promotional types. Under the CALIS
procedure using specific by group processing statements, the model was tested for
its fit to the data within each of the three promotional types including those that
were added-value (premiums) vs. reduced loss (coupons and refunds) and those
that required less effort (coupons) vs. those that required more effort (refunds and
premiums). As was the case with the previous modeling analysis, a weighted least
squares estimation technique was used with standardized scores for components of
the Unified Model.

Category Involvement
(.04) (.27) *
Brand Loyalty
Deal Proneness
(.11)* (-.17)*
Education/ Income
Cost/Benefit Decision Process
(.43) *
Figure 6. The Total Sample Modeling Results.
Past Behavior
97
Results of the modeling analysis for each of the three promotional types are
shown in Table 12. As was the case in the modeling analysis for the total data,
when the model was run separately for the data of each of the three promotional
types, the goodness-of-fit indices fell minimally below the cutoff point of 1.0.
Additionally, each of the three models met the Bentler and Bonett (1980)
incremental fit index criterion of .90. The root mean squared residuals for the
models of each of the three promotional types were low, but not as low as
expected.
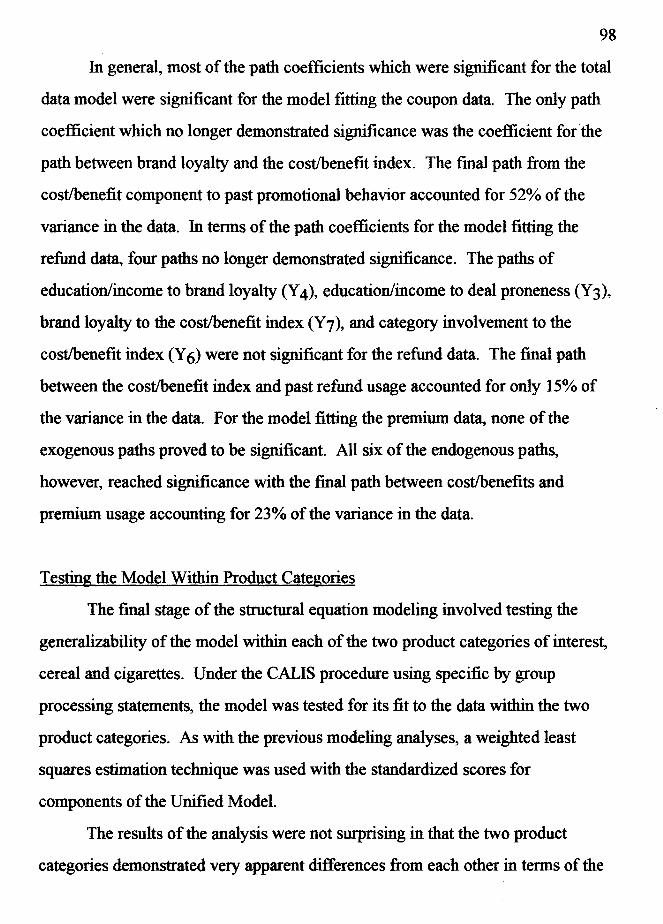
98
In general, most of the path coefficients which were significant for the total
data model were significant for the model fitting the coupon data. The only path
coefficient which no longer demonstrated significance was the coefficient for ·the
path between brand loyalty and the cost/benefit index. The final path from the
cost/benefit component to past promotional behavior accounted for 52% of the
variance in the data. In terms of the path coefficients for the model fitting the
refund data, four paths no longer demonstrated significance. The paths of
education/income to brand loyalty (Y 4), education/income to deal proneness (Y 3),
brand loyalty to the cost/benefit index (Y 7 ), and category involvement to the
cost/benefit index (Y 6) were not significant for the refund data. The final path
between the cost/benefit index and past refund usage accounted for only 15% of
the variance in the data. For the model fitting the premium data, none of the
exogenous paths proved to be significant. All six of the endogenous paths,
however, reached significance with the final path between cost/benefits and
premium usage accounting for 23% of the variance in the data.
Testing the Model Within Product Categories
The final stage of the structural equation modeling involved testing the
generalizability of the model within each of the two product categories of interest,
cereal and cigarettes. Under the CALIS procedure using specific by group
processing statements, the model was tested for its fit to the data within the two
product categories. As with the previous modeling analyses, a weighted least
squares estimation technique was used with the standardized scores for
components of the Unified Model.
The results of the analysis were not surprising in that the two product
categories demonstrated very apparent differences from each other in terms of the
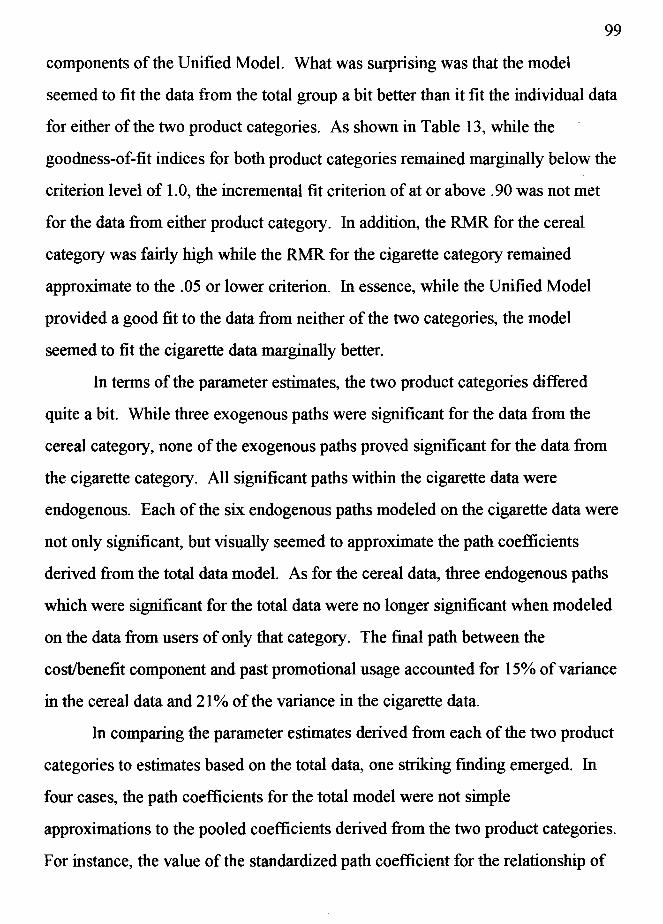
99
components of the Unified Model. What was surprising was that the model
seemed to fit the data from the total group a bit better than it fit the individual data
for either of the two product categories. As shown in Table 13, while the
goodness-of-fit indices for both product categories remained marginally below the
criterion level of 1.0, the incremental fit criterion of at or above .90 was not met
for the data from either product category. In addition, the RMR for the cereal
category was fairly high while the RMR for the cigarette category remained
approximate to the .05 or lower criterion. In essence, while the Unified Model
provided a good fit to the data from neither of the two categories, the model
seemed to fit the cigarette data marginally better.
In terms of the parameter estimates, the two product categories differed
quite a bit. While three exogenous paths were significant for the data from the
cereal category, none of the exogenous paths proved significant for the data from
the cigarette category. All significant paths within the cigarette data were
endogenous. Each of the six endogenous paths modeled on the cigarette data were
not only significant, but visually seemed to approximate the path coefficients
derived from the total data model. As for the cereal data, three endogenous paths
which were significant for the total data were no longer significant when modeled
on the data from users of only that category. The final path between the
cost/benefit component and past promotional usage accounted for 15% of variance
in the cereal data and 21 % of the variance in the cigarette data.
In comparing the parameter estimates derived from each of the two product
categories to estimates based on the total data, one striking finding emerged. In
four cases, the path coefficients for the total model were not simple
approximations to the pooled coefficients derived from the two product categories.
For instance, the value of the standardized path coefficient for the relationship of

100 Table 13. -- Structural Model Results of Total and Product Category Samples
Standardized Path Coefficients Model
Path Coeffi- Total Cereal Cigarettes cient
Exmzenous Paths Education/Income ➔ Y3 -.17* -.19* -.12 Deal Proneness Education/Income ➔ Y4 .11* -.04 .09 Brand Loyalty Education/Income ➔ Y5 .04 -.15* -.03 Category Involvement Education/Income ➔ Y9 -.16* -.18* -.05 Cost/Benefit Endmzenous Paths Category Involvement ➔ Y1 .26* -.04 .19* Brand Loyalty Brand Loyalty ➔ Y2 .27* -.06 .19* Category Involvement Category Involvement ➔ Y6 .13* .17* .13* Cost/Benefit Brand Loyalty ➔ Y7 -.18* -.08 -.21* Cost/Benefit Deal Proneness ➔ Y8 .30* .20* .36* Cost/Benefit Cost/Benefit ➔ Y10 .43* .39* .46* Past Behavior
Goodness of Fit Index (GFI) .99 .99 .99 Adjusted Goodness of Fit (AGFI) .98 .99 .99 Incremental Fit Index (IFI) .92 .83 .87 Root Mean Squared Residuals .06 .15 .06
* p < .05

101
education/income to brand loyalty derived from the total data did not fall between
the values of the path coefficients for the two separate product categories. The
same unusual situation occurred for the exogenous path of education/income· to
category involvement (Y 5) and for the two endogenous reciprocal paths between
category involvement and brand loyalty (Y 1, Y 2). This finding was the direct
result of the fact that users of the two product categories differed very significantly
on the variable of deal proneness which was critical to these paths.

Promotional Usage
CHAPTER4
DISCUSSION
Phase I
The promotional usage findings were consistent with previously reported
research as well as consistent with expectations of usage based on the kinds of
costs and benefits involved in each of the three promotional types. The greatest
percentage of respondents reported usage of coupons which were hypothesized to
be the easiest to use, followed distantly by usage of refunds and then usage of
premiums. While comparable numbers have not been identified for refunds and
premiums, the percentage of respondents reporting usage of coupons was
extremely similar to the percentage of respondents (77%) Nielsen Clearing House
Promotional Services ( 1992) reported from their national survey which allowed
respondents to classify themselves as coupon users or nonusers. The moderately
large numbers of consumers who reported usage of refunds and premiums was
somewhat surprising. Given the time and energy costs involved in each, their
overall usage was expected to be somewhat lower.
Of interest regarding the promotional usage numbers was the fact that when
asked to rate themselves as users or nonusers of a specific promotion in terms of
the last time the promotion was personally used, most users reported having used a
specific promotion within the last six months. That is, while users in phase II were
102

103
operationalized to be consumers reporting usage of a specific promotion within the
last year, most users tended to report usage within half of that time. In particular,
the most commonly used form of promotion, coupons, was reported to be used
within the past six months by 98% of those who were operationalized as users.
Refunds and premiums were respectively reported to be used within the past six
months by 86% and 83% of respondents eventually defined as users. This finding
suggested that users of a particular promotional type were very likely to be fairly
consistent users rather than very seldom users - users who redeem a coupon once
every year or send away for a premium once "in a blue moon." Users of the most
simple, accessible, and familiar form of promotion (coupons) seemed most likely
to be regular or conscientious users. This may be due to the relatively favorable
balance of the perceived benefits of coupon usage compared to the perceived costs
as discussed later.
Attitudes Toward Costs/Benefits of Promotional Usage
Each of the costs and benefits reported by consumers during this phase were
anticipated in light of previous research or surmised from the theoretical
framework of a practical information processing approach to promotional usage.
Given the top-of-mind, open-ended elicitation procedure used, it was somewhat
surprising that the pattern of costs and benefits was so consistent within the total
group of respondents. As mentioned, a fairly specific and compact set of costs and
benefits were identified for each promotional type by the total group of
respondents despite the fact that answers often varied in terminology or
phraseology. This fact not only made construction of the cost and benefit
statement section of the fmal questionnaire much easier, it also served to provide
strong assurance that all of the key costs and benefits of usage of each of the

104
promotional types were included in the questionnaire for phase II and in the
resulting modeling analysis.
Less surprising than the consistency among respondents were the similarities
and differences in the types of costs and benefits identified for each of the three
promotions. As expected, the two promotional types of coupons and refunds
showed the greatest similarities in the specific costs and benefits elicited from
consumers. Both of these promotions were believed to be of the "reduced loss"
type which were previously reported by Diamond and Campbell (1989) to be
perceived by consumers to be monetary price reductions. In contrast, the premium
type of promotion while still similar to some extent, showed the greatest
differences in terms of specific costs and benefits mentioned by respondents.
Diamond and Campbell's work had noted that consumers perceive premiums to be
of the "value-added" type in which they gain something above and beyond the
specific product they purchase. The observed pattern of similarities and
differences between promotional types in terms of consumer perceptions of costs
and benefits supported the selection of the three specific promotions included in
the study ( coupons, refunds and premiums). The three types provided a much
broader view of the promotional field than most previous work which focused on
one specific promotion at a time.
As expected, respondents perceived the greatest benefit of the two types of
reduced loss promotions, coupons and refunds, to be the financial benefit. This
was not only the most often mentioned benefit of both of these promotions, it was
also the first top-of-mind response of most respondents. The almost unanimous
perception of the financial benefits of these two promotions further supported the
work of Diamond and Campbell (1989) in which coupons and refunds were
categorized as reduced loss promotions.

105
While a distant second in terms of the number of top-of-mind mentions
received, the psychological benefits inherent in usage of both coupons and refunds
were very apparent. Nearly one third to one half of all respondents mentioned
without prompting the good feelings they got from redeeming coupons or refunds.
Those good feelings included feeling smart, feeling like a good consumer or just
having a little fun. While mentions of each of these psychological benefits had
been expected, the number of top-of-mind responses received was somewhat
surprising. That is, given the expectedly strong financial nature of these two types
of promotions, it was somewhat surprising that so many respondents mentioned
their less tangible benefits so readily. This finding supported the work of
Schindler ( 1989) outlining the psychological benefits of promotional usage
separately from the more often researched financial benefits. It also legitimized
the inclusion of several specific benefit statements in the cost/benefit section of the
questionnaire for phase II.
In addition to the good self-directed psychological feelings engendered by
these two types of promotions, respondents also indicated that they perceived a
social normative component to promotional usage. As hypothesized, respondents
noted, albeit at a low level, that promotional usage may make them appear to
others to be smart or sly consumers. This was spontaneously mentioned as a
benefit by about 10% of consumers on average across the two promotions of
coupons and refunds. The flip side of this social component was that about 15%
of consumers on average believed that usage of coupons or refunds could make
them appear to others to be cheap or penny pinching. As theorized from the work
of Fishbein and Ajzen (1975), the findings from phase I suggested that the
psychological aspects of promotional usage were produced both by what the
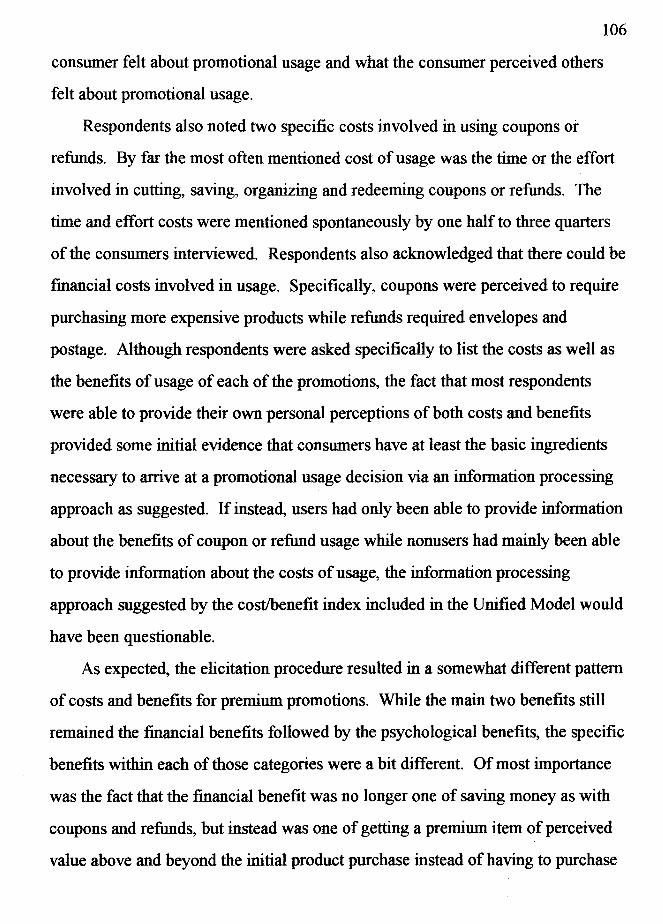
106
consumer felt about promotional usage and what the consumer perceived others
felt about promotional usage.
Respondents also noted two specific costs involved in using coupons or
refunds. By far the most often mentioned cost of usage was the time or the effort
involved in cutting, saving, organizing and redeeming coupons or refunds. The
time and effort costs were mentioned spontaneously by one half to three quarters
of the consumers interviewed. Respondents also acknowledged that there could be
financial costs involved in usage. Specifically, coupons were perceived to require
purchasing more expensive products while refunds required envelopes and
postage. Although respondents were asked specifically to list the costs as well as
the benefits of usage of each of the promotions, the fact that most respondents
were able to provide their own personal perceptions of both costs and benefits
provided some initial evidence that consumers have at least the basic ingredients
necessary to arrive at a promotional usage decision via an information processing
approach as suggested. If instead, users had only been able to provide information
about the benefits of coupon or refund usage while nonusers had mainly been able
to provide information about the costs of usage, the information processing
approach suggested by the cost/benefit index included in the Unified Model would
have been questionable.
As expected, the elicitation procedure resulted in a somewhat different pattern
of costs and benefits for premium promotions. While the main two benefits still
remained the financial benefits followed by the psychological benefits, the specific
benefits within each of those categories were a bit different. Of most importance
was the fact that the financial benefit was no longer one of saving money as with
coupons and refunds, but instead was one of getting a premium item of perceived
value above and beyond the initial product purchase instead of having to purchase
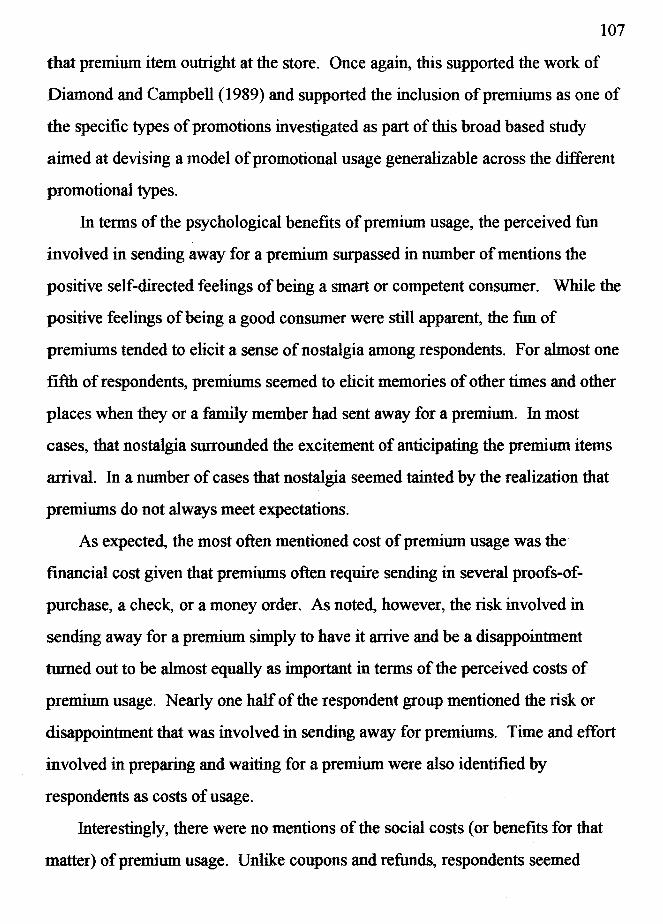
107
that premium item outright at the store. Once agai~ this supported the work of
Diamond and Campbell (1989) and supported the inclusion of premiums as one of
the specific types of promotions investigated as part of this broad based study
aimed at devising a model of promotional usage generalizable across the different
promotional types.
In terms of the psychological benefits of premium usage, the perceived fun
involved in sending away for a premium surpassed in number of mentions the
positive self-directed feelings of being a smart or competent consumer. While the
positive feelings of being a good consumer were still apparent, the fun of
premiums tended to elicit a sense of nostalgia among respondents. For almost one
fifth of respondents, premiums seemed to elicit memories of other times and other
places when they or a family member had sent away for a premium. In most
cases, that nostalgia surrounded the excitement of anticipating the premium items
arrival. In a number of cases that nostalgia seemed tainted by the realization that
premiums do not always meet expectations.
As expected, the most often mentioned cost of premium usage was the
financial cost given that premiums often require sending in several proofs-of
purchase, a check, or a money order. As noted, however, the risk involved in
sending away for a premium simply to have it arrive and be a disappointment
turned out to be almost equally as important in terms of the perceived costs of
premium usage. Nearly one half of the respondent group mentioned the risk or
disappointment that was involved in sending away for premiums. Time and effort
involved in preparing and waiting for a premium were also identified by
respondents as costs of usage.
Interestingly, there were no mentions of the social costs ( or benefits for that
matter) of premium usage. Unlike coupons and refunds, respondents seemed
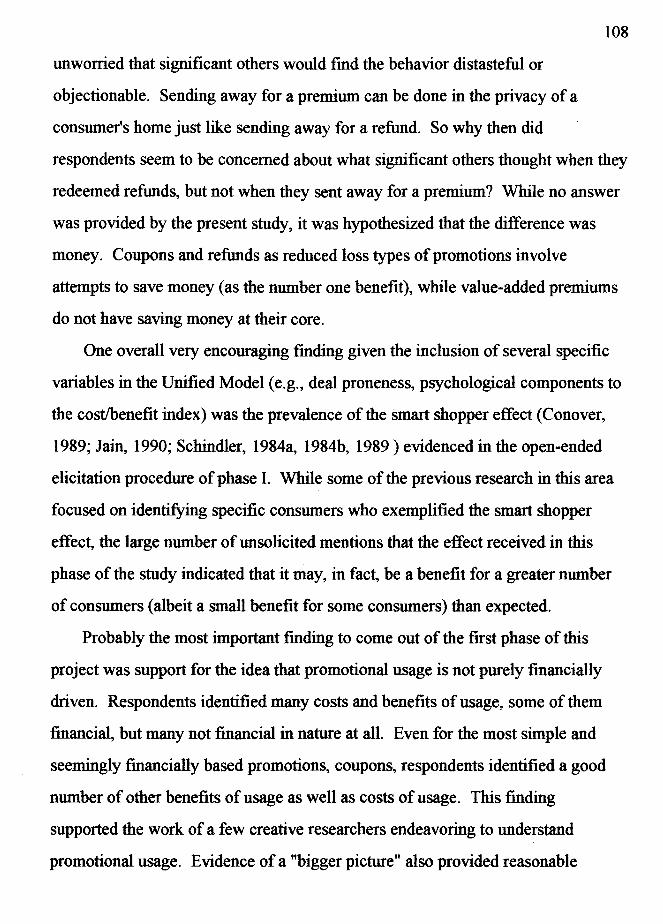
108
unworried that significant others would find the behavior distasteful or
objectionable. Sending away for a premium can be done in the privacy of a
consumer's home just like sending away for a refund. So why then did
respondents seem to be concerned about what significant others thought when they
redeemed refunds, but not when they sent away for a premium? While no answer
was provided by the present study, it was hypothesized that the difference was
money. Coupons and refunds as reduced loss types of promotions involve
attempts to save money (as the number one benefit), while value-added premiums
do not have saving money at their core.
One overall very encouraging finding given the inclusion of several specific
variables in the Unified Model ( e.g., deal proneness, psychological components to
the cost/benefit index) was the prevalence of the smart shopper effect (Conover,
1989; Jain, 1990; Schindler, 1984a, 1984b, 1989) evidenced in the open-ended
elicitation procedure of phase I. While some of the previous research in this area
focused on identifying specific consumers who exemplified the smart shopper
effect, the large number of unsolicited mentions that the effect received in this
phase of the study indicated that it may, in fact, be a benefit for a greater number
of consumers ( albeit a small benefit for some consumers) than expected.
Probably the most important finding to come out of the first phase of this
project was support for the idea that promotional usage is not purely financially
driven. Respondents identified many costs and benefits of usage, some of them
financial, but many not financial in nature at all. Even for the most simple and
seemingly financially based promotions, coupons, respondents identified a good
number of other benefits of usage as well as costs of usage. This finding
supported the work of a few creative researchers endeavoring to understand
promotional usage. Evidence of a "bigger picture" also provided reasonable

110
dynamics of promotional usage as later discussed (gender was not included as a
key component to the Unified Model). The fact that more females reported being
at home a greater percentage of the time, may have resulted in females having a
greater opportunity to be promotional users and possibly having a different value
structure for the costs and benefits involved in promotional usage. Theoretically,
the time and effort costs as well as the psychological perks provided by being a
smart shopper should be perceived differently by consumers who have more
domestic time on their hands or who have the responsibility to make the household
finances efficient.
Additionally, analysis of the association between demographic factors
indicated that older respondents and those from households with higher levels of
income had higher levels of education. The fairly strong association between
education and income, in particular, provided strong support for the creation of the
education and income combination variable included in the Unified model and
supported the work of several researchers (Levedahl, 1988; Teel, Williams &
Bearden, 1980).
As part of an effort to illuminate possible category specific differences in
terms of the modeling analysis, several interesting and very revealing demographic
differences were noted. As discussed, the two categories of interest, cereal and
cigarettes, were chosen because they were expected to differ in terms of their
consumer purchasing dynamics. Previous work by Carmen ( 1969), Blattberg,
Peacock and Sen (1976), and Henderson (1990) highlighted the importance of
within study differences attributed to product category differences. Henderson
suggested that between category differences should be expected given that the
motivation (cost/benefits) to use promotions probably differs between categories
just as the availability of deals differs between categories. Demographic
111
differences noted between users of the two product categories investigated
provided initial evidence that the two categories chosen were indeed different in
some very important ways. Specifically, significant differences between users of
cereal and cigarettes were noted for the two variables of education and income.
Cereal users were significantly more educated and reported higher levels of
household income. Once again, the consistent pattern of findings for these two
variables provided support for the creation of the combination education and
income variable included in the model. This pattern of findings also served as an
initial indicator that differences between users of the two categories existed and
that those differences would have a significant effect on the outcome of the
modeling results.
Total Sample Past Promotional Usage
It was highly encouraging that reported usage numbers for each of the three
types of promotions were visually consistent in phase II with the results of the
national telephone survey in phase I of the study as well as consistent with
available outside estimates of usage (Nielsen Clearing House Promotional
Services, 1992). Once again, coupon usage within the past year was very high at
80% of all respondents and frequency of coupon usage within a significant
percentage of respondents was also very high. One third of coupon users reported
using coupons on a weekly basis. This large percentage of regular coupon users
provided some peripheral evidence to support the concept of a deal prone
consumer, one who reportedly uses deals very frequently. The numbers of
consumers who used refunds or premiums were also surprisingly high. In fact,
one third of consumers admitted usage of premiums while over one half reported
usage of refunds within the past year. Again, given the time and energy costs

112
involved in each, the overall usage of refunds and premiums was unexpectedly
high. The similarity in the lower reported frequencies of usage of refunds and
premiums partially explained the surprisingly close association between the two
types of promotions versus the third type of coupons.
The only demographic difference identified in past promotional usage was
gender related. While previous reports suggested that there would be no
differences, women reported higher past usage of coupon and refund promotions.
The same was not true for premium promotions. Women showed no more
likelihood of premium usage than men. The fact that women showed the most
likelihood of usage may once again have provided support for the idea that women
may on average have the greatest opportunity to come into contact with
promotions given a higher percentage of time spent domestically and the greatest
motivation to use promotions given a larger responsibility for household finances.
Interestingly, differences between men and women in likelihood of usage was
greater for the two types of promotions categorized by Schindler as reduced losses
whereas the value-added promotion of premiums showed no differences. The fact
that female usage patterns were most similar for the two reduced loss types of
promotions highlighted the specific relationship between these two promotions
versus the categorically and theoretically different premium promotions. For
women, the benefit of reduced losses may have outweighed the benefit of gains
made through value-added promotions. Given that gender had shown
inconsistencies in predicting promotional usage in previous research, the decision
was made not to include gender as a key variable in the Unified Model. This
decision may, however, have reduced the explanatory power of the model.
Analysis of the differences between the cereal and cigarette purchasers in
terms of past promotional usage provided evidence that the two product categories

113
differed significantly in promotional dynamics. While quotas were established
which insured that the absolute numbers of users and nonusers of each
promotional type were approximately equal, those quotas did not fix as a constant
the frequency of participation within the promotional user groups. The fact that
reported past coupon usage differed significantly for the two product categories
highlighted once again the possibility for significant differences between the two
categories to effect dramatically the modeling analysis. It was not surprising that
the differences in usage occurred for coupon promotions given that coupons have
proliferated in the cereal category in the past few years while coupons have been
much less common in the cigarette category. Although no differences in
frequency of usage of refunds or premiums were noted, that may have been due to
the fact that overall usage of these two promotions tended to be restricted in
frequency in general.
The analysis of the intercorrelations between the past usage indices for the
three promotional types brought to light some interesting contrasts and some
insight to the later results of the modeling analysis for the separate promotions. Of
course, usage indices for all three promotional types were significantly and fairly
strongly correlated. Given that by nature all three provided consumers with a deal
of one sort or another, this was not surprising. The promotions were also expected
not to be perfectly correlated because of the inherent differences between them.
What was surprising (given some of the earlier findings regarding gender
differences in usage) was the fact that while the highest correlation between usage
of the three promotional types would have been expected for the relationship
between coupons and refunds (both reduced losses), the highest correlation was
actually found between refunds and premiums. Several noncompeting
explanations for this finding can be offered. The first explanation would be that

114
these two types of promotions have been perceived to be most similar because they
were the two types which required the most costs ( e.g., time, effort, financial).
Second and perhaps the most important, coupons have been the most frequently
offered promotion historically, thus setting them apart from other promotions in
terms of past usage. Finally, the cereal user group demonstrated very high usage
of coupons and their responses may have skewed the overall differences in usage
of the three promotional types.
Overall, the findings concerning past usage of the three types of promotions
provided much needed insight into 1) the absolute levels of usage, 2) the
frequency of usage, 3) the demographic differences in usage, and 4) the
similarities and differences in usage of coupons, refunds and premiums. While
much research had been available regarding coupon usage, little light had been
shed on consumer usage of refunds and premiums. Clearly, coupon usage should
not be interpreted as absolutely indicative of overall promotional usage. As noted,
promotions demonstrated different patterns of usage and that usage seemed very
likely related to different patterns of costs and benefits of usage as well as
different profiles of users and nonusers.
Total Sample Intended Promotional Usage
In general, the fmdings concerning intended future usage of the three
promotional types were extremely similar to the findings for past usage of the
promotions. In terms of absolute percentages of respondents reporting any
intention to use promotions in the future, coupons were the most likely to be used
by far, followed by refunds, and premiums. Visual inspection suggested that those
percentages were slightly higher than those reported for past usage indicating that
a small group of respondents who reported no past usage thought or felt that they
115
should have been using promotions and reported an intention to do so in the
future. This finding supported extensive work by researchers such as Fishbein and
Ajzen (1980) documenting differences in intentions and actual behavior.
As noted for past usage, the only significant demographic difference in
intention to use each of the promotions was a gender related difference. Once
again, females reported being significantly more likely to intend to use coupons
and refunds in the future. They were not, however, more likely to intend to use
premiums. The fact that females showed a greater intention than males to use
coupons and refunds in the future may once again have reflected the similarities
between those two types of promotions, both hypothesized to be of the reduced
loss type rather than the value-added type. As previously suggested, female
respondents may have perceived the benefit of reducing the costs of a product to
far outweigh the benefit of a value-added promotion.
Once again, specific category differences were apparent. Previously
discussed findings concerning past usage indicated that cereal purchasers were
significantly more likely to have used coupons. There were no category related
differences in past usage of refunds or premiums. Interestingly, the category
differences observed for future intentions were specific only to refunds and
premiums. Cigarette purchasers were significantly more likely to intend to use
refunds and premiums in the future. There were no category related differences in
future intentions to use coupons. Several reasons exist to explain the observed
category differences in intention to use refunds and premiums. The most likely
explanation would be that refund and premium promotions have been the most
common form of promotions for cigarettes while coupons have seemed to
dominate the cereal category. Purchasers may simply have reflected their
perceptions of what has been and what will be available to them within each

116
category. It should also not be forgotten that coupons, refunds and premiums each
has been perceived to involve some costs and while past usage seems to have
reflected that reality, future intentions may have been more idealistic and less
practical.
As was the case with past promotional usage, intercorrelations of the indices
of future intention to use each promotion were all significantly positively, but not
perfectly correlated reflecting the inherent similarities and differences between the
promotions. Also as was the case with past promotional usage, the strongest
correlation between the three types of promotions was between refunds and
premiums (the two types of promotions requiring more effort) rather than among
the two reduced cost promotions of coupons and refunds. The association
between refunds and premiums may have been enhanced by the responses of
cigarette users who reported being much more likely than cereal users to intend to
use both refunds and premiums in the future.
Relationship of Past and Future Promotional Usage
In terms of the planned modeling analysis, the relationship of the past
promotional usage and the future intention to use indices was vital. The
theoretical Unified Model was designed to predict future usage via a number of
independent variables including past usage of promotions. As discussed, actual
promotional behavior data would have been extremely difficult to collect. As
expected given previous research (Bagozzi, Baumgartner & Yi, 1991), however,
the correlation between past usage and intended usage given the methodology of
the study was much too high to include both variables in the model. Past usage of
each of the promotional types was fmmd to be correlated with future intention to
use that promotion at approximately the . 60 level. It was determined that such a
117
strong correlation would have made the modeling nearly impossible since past
promotional usage would have accounted for a majority of the observed,
measurable variance. Other variables in the model would have been given short
shrift. Therefore, solid evidence was provided for revising the model to include
and predict only past promotional behavior as shown in Figure 5.
In addition to the modeling insight provided by correlations between past and
future use within each promotional type, interpretive insight for the modeling
analysis was provided by the correlations between past and future use across
promotional types. Not surprisingly, all such correlations were significant
suggesting that the similarities in the decision process regarding usage between the
three promotions were probably fairly strong.
The Education/Income Hypothesis
While as discussed above many of the fmdings of the study supported the
creation of an education/household income variable, that variable proved not to be
highly associated with promotional usage. Clearly, the two variables of education
and income were positively associated. In fact, as discussed above many findings
true of one variable proved true of the other. However, the correlational analysis
demonstrated no significant associations between the individual variables and
promotional usage or between the combination variable and promotional usage,
either actual past behavior or future intention to behave. Although previous work
by Teel, Williams and Bearden (1980) had suggested that higher income and
higher educated consumers used more promotions or at least used them for
different reasons, that finding was not replicated in the present study. This, of
course, made the inclusion of this combination variable in the Unified Model
118
questionable. While making theoretical sense, the variable may have contributed
little to the overall explanatory power of the model within the total dataset.
In comparing across models based on each category of interest, however, the
variable helped to explain differences in specific paths outlined. One rational
explanation for a couple of specific differences found in modeling each of the two
categories was that cereal users reported significantly higher levels of
income/education than cigarette users. Any specific paths outlined in Figure 5
containing the income/education variable were expected to have been effected by
the category differences observed.
Perceptions of Costs/Benefits of Promotional Usage
Overall a very positive picture of consumer perceptions of costs and benefits
emerged. For all three promotional types, the benefits of usage generally
outweighed the costs of usage as evidenced by the fact that rank ordered by
strength of agreement among respondents (percent of respondents agreeing with
the statement) benefits rose to the top of the list while costs remained toward the
bottom. In fact, for each promotional type, the strength of agreement with the
highest rated benefit was at least 20% higher than the strength of agreement with
the highest rated cost.
Both phase I and phase II of the present project supported Schindler's (1989)
work which suggested that promotional usage has two types of benefits, those that
are financial and those that are psychological. While responses to the open-ended
elicitation procedure elicited the strongest evidence of this categorization ( all
responses fell neatly into the two categories), responses to the cost/benefit ratings
from phase II provided further substantiation. Interestingly, the patterns of
financial and psychological benefits for each of the three promotional types were

119
remarkably similar. In all three cases, financial benefits were the primary benefits
of usage according to 70% - 80% of respondents, followed by psychological
benefits according to 60% - 80% of respondents. The most important of the
psychological benefits was reportedly the "smart shopper" feelings engendered by
usage. The strong showing of this particular benefit supported the work of several
researchers (Conover, 1989; Jain, 1990; Schindler, 1989).
Costs on the other hand tended to break into the two categorizations of
financial and personal investment. While the financial costs were perceived to be
the biggest costs of coupon usage (e.g., buying more expensive items), personal
investment costs in terms of time and effort were seen as the biggest costs of
refund and premium usage. This break down of the perception of costs involved
in each of the three types of promotions provided insight into the similarities in
reported past and future usage of refunds and premiums as well as similarities in
the fitted_ models for refunds and premiums. As hypothesized, these two
promotional types were perceived by consumers as requiring more work.
One important finding in terms of the average cost/benefit scores was revealed
through a comparison of the two product categories. Purchasers of the cigarette
category scored significantly higher on the cost/benefit index than purchasers of
the cereal category, once again highlighting the extreme differences in the
purchasing and promotional dynamics between those two categories.
The high internal consistency estimates derived from the cost/benefit indices
for the three promotions suggested stability in the cost/benefit construct included
in the Unified Model. The Cronbach's alpha coefficients which were all
approximately equal to .80 were fairly high. The stability of this construct was
critical given its placement in the model as the predicted variable of four other
constructs (brand loyalty, deal proneness, category involvement, and
education/income level).
Category Involvement, Brand Loyalty, and Deal Proneness
120
The category involvement, brand loyalty, and deal proneness indices revealed
some interesting as well as critical insights to the promotional dynamics under
investigation. Each of the constructs was theorized to influence the cost/benefit
decision in some way. Category involvement referred to the desire on the part of
the consumer to look around for and identify the "best" available product, while
brand loyalty referred to a preference on the part of the consumer for one or more
brands within the category. Both category involvement and brand loyalty were
believed to impact the promotional decision by defining the acceptable set of
brands a consumer was willing to consider and, therefore, the set of promotions
that would be considered. Deal proneness was defmed as a tendency to be
favorably disposed toward deals or promotions. The degree of deal proneness
exhibited by a consumer was believed to directly impact the cost/benefit decision
in that consumers more favorably oriented toward promotions would perceive the
benefits of usage to outweigh the costs.
Respondent scores on each of the three indices were moderate to high. For
the total group, average scores on both the category involvement and brand loyalty
indices were moderately high. The average deal proneness score, however, was
very high for the total group. A total of 78% - 91 % of all respondents agreed to
each of the three individual items within the index and the average score on the
index was a 16 on a scale ranging from 6 to 18. This high average score revealed
an unexpectedly high interest among the total group of consumers to seek a good
121
deal. This highly positively skewed index was problematic and partially prompted
the use of a robust estimation technique for the modeling analysis.
An analysis of the differences between the two categories in terms of category
involvement, brand loyalty, and deal proneness highlighted a very important trend
that was first noted among the demographic variables and then among the usage
and cost/benefit components. In the case of each index, the two categories
differed significantly. In terms of category involvement, in particular, the category
difference was critical. As shown in the analysis, cereal purchasers reported a
significantly higher degree of category involvement than cigarette purchasers,
indicating that they were much more likely to have looked around and compared
products within the category, particularly new products. Cigarette purchasers
reported having been much less interested in trying out new brands. The absolute
average size of this difference as well as the fact that the two categories skewed on
this index in different directions were expected to cause significant differences in
the modeling analyses conducted separately on the two categories. The expected
effects were that the category involvement variable's parameters would differ
across the two categories and that the variable ( as a predictor of other variables)
would effect the parameters of other variables differently across the two
categories. Once again, the highly skewed category involvement indices within
each of the two categories was problematic and prompted the use of a robust
estimation technique for the modeling analysis.
Category comparisons revealed that while both brand loyalty and deal
proneness demonstrated significant differences, those differences were not as large
and were certainly not skewed in different directions. Surprisingly, given their
propensity toward category involvement, cereal purchasers reported being
significantly more brand loyal than cigarette purchasers. This finding may be
122
explained by the fact that cigarette purchasers generally use only one brand at a
time while cereal purchasers often use more than one brand at a time. Thus, when
cigarette purchasers buy another brand to get a promotion or switch brands just to
try something new, their loyalty index fell. Cereal purchasers, who often keep
more than one brand in the cupboard, could switch brands to try something new,
but still may have perceived themselves as loyal since they still have half of a box
of their regular brand at home. In terms of willingness to participate in
promotions, however, cigarette purchasers reported higher levels of deal proneness
than cereal purchasers. This fmding supported Henderson's (1990) hypothesis that
inconsistencies in previous research on deal proneness were caused by a disregard
for category and promotional specification. The fact that cigarette purchasers
reported higher levels of deal proneness may have reflected the fact that
expenditures on cigarettes may far surpass expenditures on cereal. Thus, the need
to reduce losses or at least get value-added purchases may have become highly
salient to cigarette purchasers.
Insights from Correlation Model Matrix and User/Nonuser Comparisons
A review of the predicted model matrix provided some early insight to the
findings of the modeling analysis for the total sample group. That is, the model
matrix supported some of the very basic structure or paths outlined by the Unified
model in Figure 5. As expected, the construct of deal proneness was significantly
associated with the constructs for cost/benefits and education/household income.
The association between deal proneness and the cost/benefit indices supported the
theory that deal prone consumers perceived the benefits of promotional usage to
outweigh the costs. The association between deal proneness and the combination
education/income variable was also significant, but not as strong as expected and

123
not in the direction expected. The two constructs were, in fact, negatively related
which disputed the findings of Teel, Williams and Bearden (1980) and Levedahl
(1988) which suggested that the relationship should be a positive one. Levedahl
had reported that consumers with higher education/income levels were either more
efficient (so could organize and use promotions better) or had preferences for
national brands that tended to promote more often. The weak negative association
between deal proneness and the combination education/household income variable
was consistent, of course, with previously noted negative correlations between
educational level and future intent to use refunds and future intent to use
premiums. Among the total group, respondents with lower education/income
levels tended to report greater levels of deal proneness, possibly due to need.
Overall, however, the model matrix provided good early support for the general
path structure between deal proneness and the cost/benefit construct as well as the
combination education/income construct.
As expected, deal proneness showed no association to brand loyalty. It had
been hypothesized that as brand loyalty increased the number of acceptable brands
considered by a consumer decreased, the number of available promotions
decreased, and therefore, total deal proneness would be dependent on a more
limited number of promotions. This limitation suggested that no association
between deal proneness and brand loyalty would exist and the data substantiated
that assertion.
Deal proneness also showed no association to category involvement.
Category involved individuals had been reported to make purchase decisions based
on product attributes rather than on price considerations unless no significant
product attribute differences existed within the category (Anderson, 1974;
Zaichowsky, 1988) which was not the case for either the cereal or cigarette

124
category. The data from the model matrix substantiated the decision not to include
a path in the Unified Model to account for the existence of a relationship between
deal proneness and category involvement. It was believed that the effect of greater
exposure to promotions would generally cancel the effect of making decisions on
the basis of product attributes.
Category involvement was found to be related to brand loyalty. While the
direction of this relationship had been unclear during the theoretical development
of the Unified Model, the strong positive relationship between the two variables
evidenced within the total sample data left little room for doubt. Respondents that
reported higher levels of category involvement also reported higher levels of brand
loyalty. In effect, consumers that reported that they really cared about a specific
product category, also reported that they were very likely to have become loyal to
one or more brands. These consumers looked for the best products continuously
and having found such a product( s ), they were loyal until a better product( s) was
found. The matrix data, therefore, provided strong evidence for the general path
structure between category involvement and brand loyalty.
Analysis of the differences between users and nonusers of each of the three
promotions within each of the two product categories provided additional early
insight into the results of the modeling procedures. Differences among users and
nonusers were apparent for the two promotions of coupons and premiums, which
foreshadowed the existing differences between the promotional types. In most
cases, users and nonusers differed significantly in their perceptions of the
costs/benefits of usage. These differences provided evidence for the strength of
the relationship between the cost/benefit construct and past usage as specified in
the Unified Model tested.
125
Total Sample Model Implications
The modeling analysis seemed to clearly suggest that the data collected across
two product categories and three promotional types were a reasonable fit to the
Unified Model tested. All indicators of the fit between the model and the data
were fairly encouraging. The general goodness-of fit, adjusted goodness-of-fit and
incremental fit indices all met minimal criterion levels. Additionally, the residuals
were moderately minimal and normally distributed. Overall, the Unified Model as
shown in Figure 5 seemed to accurately describe at least a reasonable amount of
the variance involved in the past usage of promotional behavior. As further
evidence of the general viability of the model, all but one of the ten paths specified
between key model components demonstrated significance.
Three of the four exogenous paths emanating from the combination
education/household income construct proved to be significant, although each
demonstrated only a weak association. Of interest was the fact that the
education/household income construct was negatively related to both deal
proneness and the overall cost/benefit construct. Once again, the negative
direction of these path coefficients was in opposition to the findings of previous
researchers who had suggested that consumers with higher educational levels and
household incomes demonstrated higher promotional usage (Levedahl, 1988; Teel,
Williams & Bearden, 1980). The negative path coefficients derived from the total
sample suggested that respondents with higher education/household income levels
tended to be much less deal prone in general and, in fact, perceived the costs of
usage to outweigh the benefits of usage. According to the parameter estimates,
both factors served to decrease the likelihood of past promotional usage.
Interestingly, the derived parameter estimates also indicated that to a small degree
brand loyalty increased with educational/household income level. Whether these

126
households became more habitual or sincerely invested in a specific brand or
brands was not determined within the course of the study. The fourth exogenous
path of education/household income to category involvement failed to reach ·
significance. This was not surprising in light of the failure to replicate the findings
of Teel and his colleagues.
Encouragingly, in support of the model, all six endogenous paths outlined
within the Unified Model demonstrated significance for the total sample group.
The first two specified recursive paths between the two predictor variables of
category involvement and brand loyalty. Both resulted in moderately sized
parameter estimates providing insight into the close relationship between these two
variables. As previously discussed, to a moderate degree category involved
respondents communicated their brand loyalty. In effect, consumers that reported
that they really cared about a specific product category, also often reported that
they were very likely to have become loyal to one or more brands. These
consumers combed the category for the best products regularly and having found
those products, they became loyal until better products were found. The structural
modeling, therefore, substantiated the general path structure between category
involvement and brand loyalty.
The third endogenous path demonstrated that category involvement was
slightly predictive of the cost/benefit construct. In theory, the relationship
between category involvement and the cost/benefit index was very similar to the
relationship between category involvement and deal proneness. The significant
parameter estimate of the relationship of category involvement to the cost/benefit
construct may have been due to the fact that category involved consumers had
been exposed to more promotions because they had attended to more category
relevant information in their search for the "best" product (Holmes & Lett, 1977;
127
Lynch & Srull, 1982). As part of this exposure, they may have been more likely
(just due to sheer numbers) to run across promotions where benefits were
perceived to outweigh costs. The correlation may have been weakened, however,
by the fact that category involved consumers have been reported in purchase
decisions to weigh product attributes more heavily than price considerations
(Anderson, 1974~ Zaichowsky, 1988).
The fourth endogenous path, brand loyalty to the cost/benefit index, was
slightly and negatively predictive of the cost/benefit construct. It had been
theorized that as brand loyalty increased the number of acceptable brands
considered by a consumer decreased, and therefore, the number of available
promotions decreased. In contrast to category involved consumers, brand loyal
consumers would have had much more limited exposure to promotions and may
have been less likely to have seen promotions where they would have perceived
the benefits to outweigh the costs. This point becomes even more poignant in light
of the fact that one of the costs of promotional usage has traditionally been
purchasing a different brand, different form, or different size. Brand loyals would
have been more sensitive to such trade-offs.
Very encouragingly, the final two endogenous paths were both moderately
strong. The fifth path which specified the effect of deal proneness on the
cost/benefit construct was both positive and highly significant. This parameter
estimate was expected to be significant given the straightforward nature of the
relationship. As discussed previously, the association between deal proneness and
the cost/benefit index substantiated the theory that deal prone consumers perceived
the benefits of promotional usage to outweigh the costs. It was not surprising that
the final endogenous path of the cost/benefit construct to past promotional usage

128
was also significant. This path accounted for the combined explanatory power of
all of the predictive constructs included in the Unified Model.
Overall, the Unified Model seemed to be a fair predictor of promotional -usage
across a variety of promotions and at least a couple of very different product
categories. Each variable included in the model demonstrated its importance in
the promotional decision. The total model should be useful to researchers in
marketing and practitioners wishing to better understand the dynamics of
promotional usage in that it expands the knowledge base by considering each of
the key predictor constructs within the scope of a holistic model across a variety of
promotional and category situations. As noted, many of the inconsistencies in
previous research have been attributed to the isolational approach taken by many
researchers who studied one variable, one promotion, or one category at a time.
Studying one variable within one category at a time may have provided a basis for
reaching exact conclusions, but practitioners in the real world of marketing need to
make more holistic judgments based on general principles applied to their
particular promotional situation.
Implications of Modeling Promotional Samples
As with the total sample, the modeling analysis seemed to suggest that the
data collected for each of the three promotional types were a reasonable fit to the
Unified Model proposed. All indicators of the fit between the model and the three
separate datasets were fairly encouraging. The general goodness-of-fit, adjusted
goodness-of-fit and incremental fit indices all met minimal criterion levels. While
normally distributed, the residuals for the coupon and premium data were
unfortunately somewhat larger than those for the total modeling analysis
suggesting a slightly poorer overall fit. In general, the Unified Model as shown in
129
Figure 5 seemed to accurately describe at least a reasonable amount of the
variance involved in the past usage of each of the three types of promotional
behavior. However, as shown in Table 5, coupons, refunds, and premiums ·
differed dramatically in the pattern of significant structural paths defined within
the Unified Model. This pattern of differences provided insight into the slightly
poorer fit of the promotional samples to the general model.
The categoiy of coupon promotions was identified for inclusion to the study
because coupons represented the reduced loss type of promotions. Coupons were
also identified as the most simple, least taxing form of promotion. According to
respondents, they were additionally the most frequently used, veiy likely because
they have been the most frequently offered by manufacturers. Clearly, the
analysis suggested that of the estimated structural models for the three promotional
types, the estimated model for the simple to use coupon most closely resembled
the estimated model for the total sample.
As discussed, all but one of the paths found significant among the total data
were found significant for the coupon data suggesting that the relationship among
variables for coupon promotions may have heavily influenced the total estimated
model parameters. As substantiation for that premise, visual inspection of the data
demonstrated that many of the parameter estimates derived from the coupon data
were larger than those derived from the total data. One additional interesting point
about the model derived from the coupon data was that the path of brand loyalty to
the cost/benefit construct which was significant and negative for the total model
failed to reach significance within the coupon data. The prevalence and simplicity
of coupons may have had an effect in that even for brand loyals with their limited
set of acceptable brands, deals have been available frequently allowing for the

130
development of a clear belief that at times (when the coupon is for an acceptable
brand) the benefits of coupon usage outweigh the costs.
The categories of refund and premium promotions were identified for
inclusion to the study because while one represented the reduced loss type of
promotions and the other represented the value-added type, both were more taxing
or complicated in terms of cost expenditures. According to respondents, they were
the least frequently used, very likely due to the fact that in addition to requiring
greater perceived costs, they have also been the least frequently offered by
manufacturers. Clearly, the analysis suggested that of the estimated structural
models for the three promotional types, the estimated models for refunds and
premiums were more similar to each other than to the estimated model for
coupons. This suggested that in categorizing promotional types, distinctions made
on the basis of perceived costs and complexity may be more insightful than those
made on the basis of reduced losses versus value-added.
Unlike coupons, none of the four exogenous paths emanating from the
education/household income variable were significant for the refund and premium
models which suggested the decreased importance of the socioeconomic status of
consumers in predicting the precursors to usage of those two promotions. In
general, all of the significant paths in the models derived from the refund and
premium data were endogenous in nature. Two critical differences between the
models derived from the refund, premium and coupon data provided actionable
insights for marketers.
The first critical difference observed between the three promotional models
involved the negative direction of the relationship between brand loyalty and the
cost/benefit construct for the models derived from the refund and particularly
premium data. This negative relationship substantiated the premise that increased

131
brand loyalty led to a decreased acceptable set of brands and a decreased
likelihood to find promotions within the refund and premium genre where the
benefits of usage outweighed the costs of usage. For a loyalist the costs of usage
would have very likely involved switching brands, flavors or sizes. The negative
relationship was most clearly established for premiums suggesting that premiums
may be even less likely to entice brand loyalists. While refunds have typically
involved a universally appealing benefit of cash-back, premiums have generally
been branded item offers. For a brand loyalist, the costs of switching from their
usual brand to receive a premium item with another brand's logo or name on it may
be too high. The negative direction of this relationship did not appear for the
model derived from the coupon data. As discussed previously, this may have been
due to the simplicity involved in coupon usage as well as the recent proliferation
of coupons.
The second critical difference observed between the three promotional models
involved the relationship between the category involvement construct and the
cost/benefit construct. While the parameter estimate for this path was significant
for each of the other models, it failed to reach significance for the model derived
from the refund data. This finding suggested that for category involved consumers
while the benefits of usage outweighed the costs of usage for both coupons and
premiums, they did not necessarily do so for refund usage. In theory, the
simplicity of coupons may have made them somewhat attractive to category
involved consumers interested in trying new brands anyway. Premium offers
(e.g., mug offers for coffee category) may have been somewhat attractive to
consumers with a sincere interest in the benefits of the category ( e.g., sipping a
good tasting cup of coffee early in the morning) because they have often been tied
to product experiences, uses or attributes. Refund offers on the other hand, while
132
worth more financially, have also been perceived to be more complex and time
consuming. For category involved consumers, the results suggested that the
increased effort and time involved in refund usage outweighed the increased ·
financial benefit.
Overall, the results of the modeling analysis across the three types of
promotions provided some very actionable insights for marketers in that the
individual models provided a clarity of understanding of the dynamics of usage of
coupons, refunds, premiums, and possibly some of the other related promotional
types. That clarity of understanding can be evidenced through several very specific
indications which were elicited from the modeling analysis. For example, when
dealing in a product category where a large number of category involved
consumers has been identified, premium offers may be more effective than
coupons and especially refunds in promoting usage. In categories where large
numbers of brand loyalists exist, refunds and particularly premiums may be less
effective in promoting usage, unless the target is a brand's own loyalist base.
Coupons may be the best bet among promotions when soliciting brand switching
behavior, although even that relationship may be weak.
Implications of Modeling Product Category Samples
Evidence from the modeling of the two product category samples provided
strong support for Henderson's (1990) assertion that in order to avoid confounding
factors promotional research must consider category differences. The fact that the
total sample data provided a better fit to the model than data from either product
category suggested that the total sample model represented the general idea of
promotional usage across categories better than it represented the specifics of
promotional usage within each category. The goodness-of-fit indices, incremental

133
fit indices and root squared means revealed that the data was not a very reasonable
fit to either of the two categories alone. While neither model was interpreted as
accurately reflecting the dynamics of promotional usage, a review of the
differences between the two models provided some initial useful insights into the
differences alluded to by Henderson's work.
Of course, the categories seemed to differ dramatically in terms of
promotional dynamics. In fact, the two categories had been chosen specifically to
show such differences. They were expected to vary in terms of such variables as
brand loyalty, category involvement, deal proneness, types of deals offered, types
of deals used, perceptions of costs/benefits of usage and demographic profiles of
user groups. Many such differences have been noted and discussed at length
within the present research. While, not surprisingly, the results of the modeling
analysis failed to provide reasonable holistic models for each of the two
categories, the results did highlight the fact that differences can be extreme.
The results of the modeling conducted on the two product categories
substantiated Henderson's notion that promotional research should be conducted
across a variety of categories in order to increase its generalizability. As noted
previously, the two categories differed significantly in the direction and
significance of the parameter estimates derived from their respective data. While
the exact parameter estimates derived may not have been stable enough to consider
using to make promotional decisions or budgetary allotments, the pattern of
differences taken as a whole and supported by previously reported significance
tests suggested that the two categories worked very differently in terms of
promotional usage by consumers. At times those differences were extreme in
nature. For example, the paths which involved the construct of category
involvement were heavily influenced by the fact that cereal users tended to have
134
higher scores on the category involvement index while cigarette users tended to
have lower scores. Paths which depended on this variable in combination with
other variables demonstrating category differences tended to demonstrate extreme
category discrepancies which were obscured in the total sample model.
In sum, the results of the modeling analysis across the three types of
promotions provided a very important lesson for market researchers and
practitioners alike. Research conducted across several categories will provide the
most generalizable results, results that can be translated into real world guides for
decision making. Promotional decisions for one category based on research or
even experiences in other categories should be carefully made. Just as buying
cycles, price elasticities and shelf presence differ across categories, promotional
dynamics differ across categories. While the construct of costs and benefits ( along
with prior promotional usage) may predict promotional usage across categories,
the precursors of the cost/benefit decision clearly differ across categories, or at
least they did across the two categories of cereal and cigarettes.
Conclusions
As discussed, consumer promotions have become an increasingly important
marketing tool. The present research project attempted to address some of the
previously unanswered questions such as: How do the various promotions differ in
their ability to effect consumer purchasing decisions? Are there basic differences
in the precursors to promotional usage across the various promotional types? Are
there significant differences in the promotional dynamics across different
categories and across different consumer groups? The present investigation
attempted to provide initial answers to such questions in order to allow marketers
to appropriately target consumer segments with the promotional vehicle most
135
likely to impact their purchase decision and least likely to be a waste of valuable
marketing budget dollars. It also provided valuable, previously unavailable
information about two less commonly used types of promotions (refunds and ·
premiums).
While a fair amount of research had been previously conducted in the area of
consumer promotions, few projects had attempted to provide a holistic perspective.
Many had concentrated on one aspect of consumer promotional usage ( e.g., What
should the face value of a coupon be?) at a time. Ultimately, while the past
research conducted in this area provided a useful guide for understanding the
dynamics of promotional usage, it first needed to be pieced together like the pieces
of a jigsaw puzzle. The present project took each of the key pieces developed and
substantiated by numerous market researchers and combined them into a single
Unified Model. That model included each of the key determinants reported by
other researchers to be a predictor of promotional usage including: the perception
of costs and benefits, the influence of past behavior, the effects of preexisting
category involvement and brand loyalty, and finally the effects of person
predispositions such as deal proneness and demographics. The goal of the Unified
Model was to provide a single, interpretable framework from which marketers
could make decisions about promotional expenditures and through which
marketing researchers could design future consumer based studies to expand the
field's understanding of the dynamics of promotional usage. To that end, the
project was considered a success.
The study extended its perspective by taking into account the inherent
differences between promotional types and product categories. As noted by
Henderson (1990), many seemingly inconsistent findings reported in previous
studies may have resulted from a failure to recognize those basic differences. The

136
findings of the current investigation highlighted the importance of recognizing the
similarities and differences between promotional types. Similarities and
differences were demonstrated to exist between promotions providing different
types of benefits (reduced loss vs. value-added) and particularly between
promotions requiring different levels/types of costs (simple vs. complex/more
time/effort). The study also demonstrated the dramatic differences that can exist
in the promotional dynamics of two different product categories due to differences
in the users of those categories. The implications were clear for marketers and
marketing researchers alike. Decisions about the types of promotions to use must
be made within the context of a category and with a basic understanding of the
promotional dynamics as they pertain to the specific promotions being considered.
Gleaning insights about general promotional usage from one category or one
specific type of promotions can be costly.
While the current project provided an initial holistic framework from which to
understand promotional dynamics, much research still needs to be done. In terms
of the model itself, clearly a number of relationships should be better understood:
Are there truly any demographic variables besides education/income which would
assist in predicting promotional usage? Would the theoretical model (which
includes past behavior as a predictor variable) be more viable? How did use of
past behavior as the dependent variable in the model create or obscure important
differences between the three promotional types? Given that past (habitual)
behavior would be expected to be most predictive of future use of coupons ( the
most often used promotion), results of the modeling analysis in this study may be
more representative of coupon promotions than refund or premium promotions. In
addition, future research should continue to extend findings across promotional
types and product categories. The broader the network of research experiences in

terms of promotions and categories, the more stable and generalizable the
framework of findings.
137
APPENDIX A
138

139 CATI TELEPHONE QUESTIONNAIRE ON CONSUMER PROMOTIONS:
PHASE I
(INTERVIEWER READ) The following questions ask about your participation in three types of promotional offers for grocery products.
Q 1. Approximately when was the last time you redeemed a coupon at the checkout counter in your grocery store? (READ LIST. RECORD RESPONSE.)
A. Within the last month B. Within the last 2 to 3 months C. Within the last 4 to 6 months D. Within the last 7 to 12 months E. Not at all in the past year
Q2. Approximately when was the last time you responded to a manufacturer rebate offer where you mail in proofs-of-purchase in return for a cash or check rebate? (READ LIST. RECORD RESPONSE.)
A. Within the last month B. Within the last 2 to 3 months C. Within the last 4 to 6 months D. Within the last 7 to 12 months E. Not at all in the past year
Q3. Approximately when was the last time you responded to a manufacturer premium offer where you mail in proofs-of-purchase in return for a special gift which was advertised on the package or in an ad? (READ LIST. RECORD RESPONSE.)
A. Within the last month B. Within the last 2 to 3 months C. Within the last 4 to 6 months D. Within the last 7 to 12 months E. Not at all in the past year
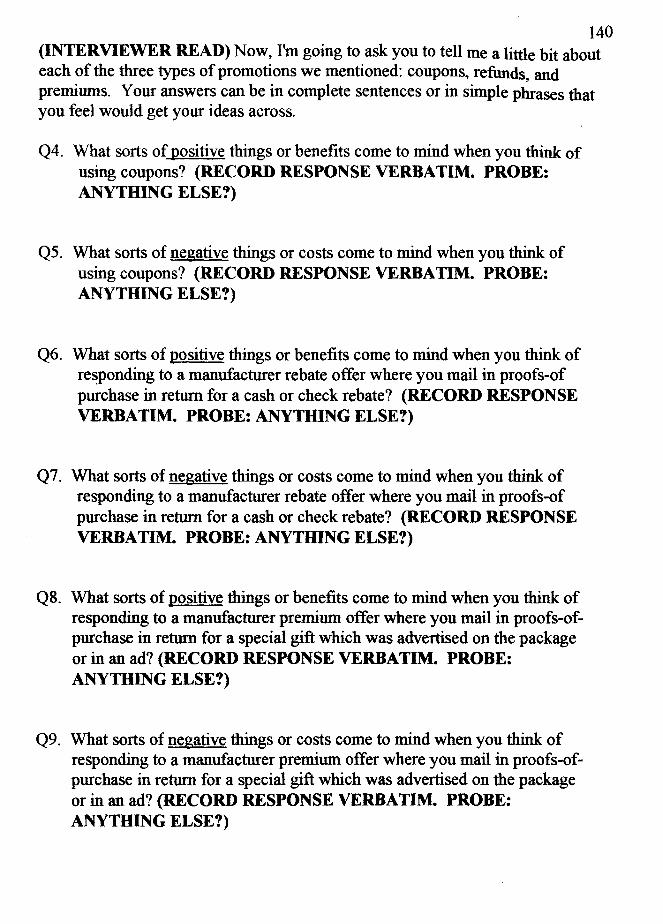
140 (INTERVIEWER READ) Now, I'm going to ask you to tell me a little bit about each of the three types of promotions we mentioned: coupons, refunds, and premiums. Your answers can be in complete sentences or in simple phrases that you feel would get your ideas across.
Q4. What sorts of positive things or benefits come to mind when you think of using coupons? (RECORD RESPONSE VERBATIM. PROBE: ANYTHING ELSE?)
Q5. What sorts of negative things or costs come to mind when you think of using coupons? (RECORD RESPONSE VERBATIM. PROBE: ANYTHING ELSE?)
Q6. What sorts of positive things or benefits come to mind when you think of re~ponding to a manufacturer rebate offer where you mail in proofs-of purchase in return for a cash or check rebate? (RECORD RESPONSE VERBATIM. PROBE: ANYTHING ELSE?)
Q7. What sorts of negative things or costs come to mind when you think of responding to a manufacturer rebate offer where you mail in proofs-of purchase in return for a cash or check rebate? (RECORD RESPONSE VERBATIM. PROBE: ANYTHING ELSE?)
Q8. What sorts of positive things or benefits come to mind when you think of responding to a manufacturer premium offer where you mail in proofs-ofpurchase in return for a special gift which was advertised on the package or in an ad? (RECORD RESPONSE VERBATIM. PROBE: ANYTHING ELSE?)
Q9. What sorts of negative things or costs come to mind when you think of responding to a manufacturer premium offer where you mail in proofs-ofpurchase in return for a special gift which was advertised on the package or in an ad? (RECORD RESPONSE VERBA TIM. PROBE: ANYIBING ELSE?)
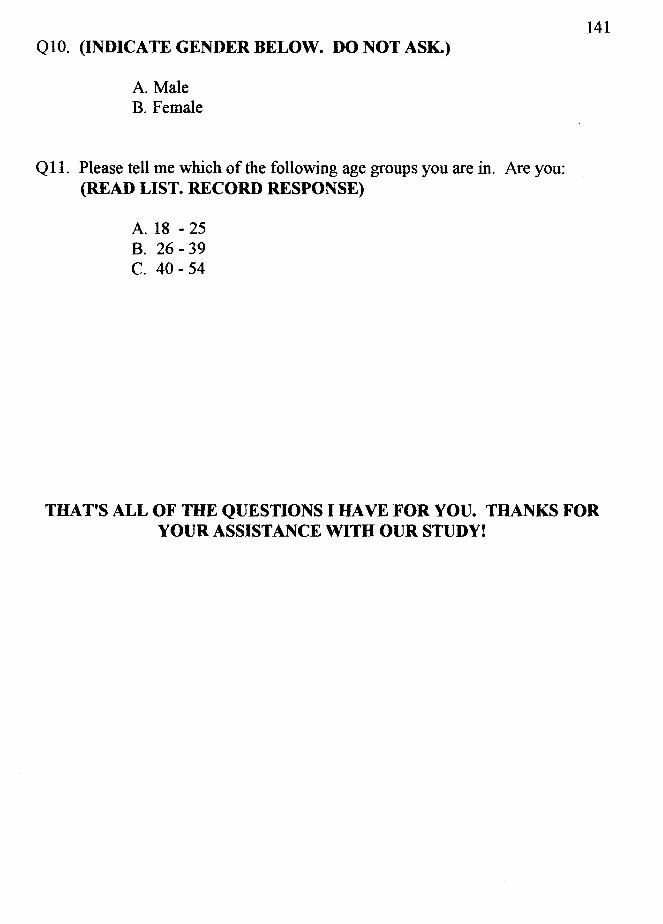
141 QlO. (INDICATE GENDER BELOW. DO NOT ASK.)
A. Male B. Female
Q 11. Please tell me which of the following age groups you are in. Are you: (READ LIST. RECORD RESPONSE)
A. 18 - 25 B. 26 - 39 C. 40 - 54
THAT'S ALL OF THE QUESTIONS I HA VE FOR YOU. THANKS FOR YOUR ASSISTANCE WITH OUR STUDY!

APPENDIXB
142

143 CATI TELEPHONE QUESTIONNAIRE ON CONSUMER PROMOTIONS:
PHASE II
(INTERVIEWER READS) Hello, my name is (INSERT NAME) and I'm· calling from (INSERT COMPANY NAME), a consumer opinion company in Chicago.
Today we're calling people all over the country and asking their opinions about a variety of topics. May I please talk to someone in your household who is 18 years or older? (IF NO, TERMINATE OR RESCHEDULE. IF YES, ENGAGE APPROPRIATE RESPONDENT.)
Q 1. Do you, or does anyone in your household, work in marketing research or for an advertising agency? ( DO NOT READ LIST. RECORD RESPONSE.)
1. Yes - TERMINATE INTERVIEW
2. No - CONTINUE INTERVIEW
Q2. Do you do one half or more of the grocery or convenience store shopping for your household? (DO NOT READ LIST. RECORD RESPONSE.)
1. Yes - CONTINUE INTERVIEW
2. No - TERMINATE INTERVIEW
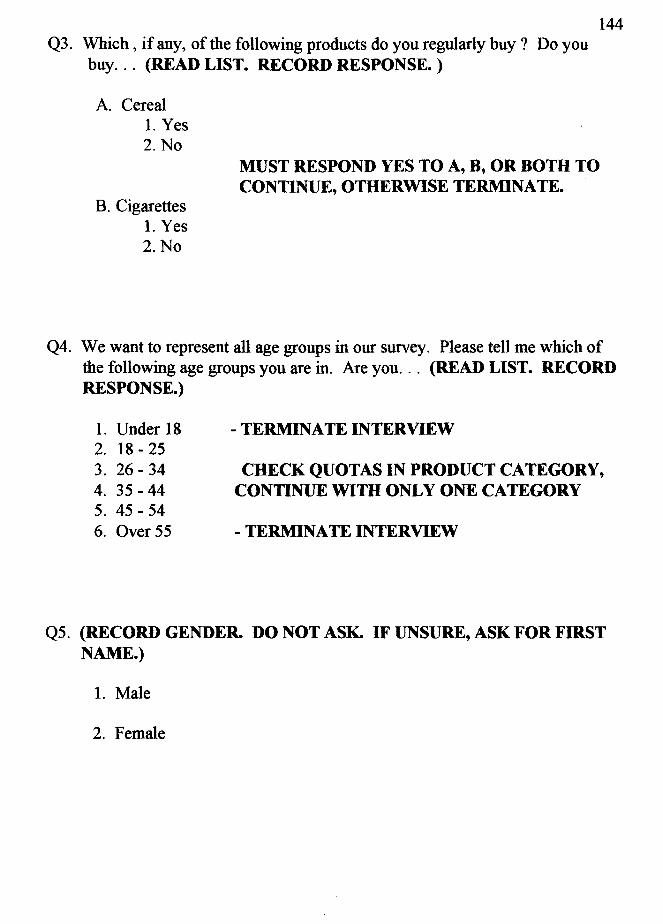
144 Q3. Which , if any, of the following products do you regularly buy ? Do you
buy. . . (READ LIST. RECORD RESPONSE. )
A. Cereal 1. Yes 2. No
B. Cigarettes 1. Yes 2.No
MUST RESPOND YES TO A, B, OR BOTH TO CONTINUE, OTHERWISE TERMINATE.
Q4. We want to represent all age groups in our survey. Please tell me which of the following age groups you are in. Are you. . . (READ LIST. RECORD RESPONSE.)
1. Under 18 2. 18 - 25 3. 26 - 34 4. 35 -44 5. 45 - 54 6. Over 55
- TERMINATE INTERVIEW
CHECK QUOTAS IN PRODUCT CATEGORY, CONTINUE WITH ONLY ONE CATEGORY
-TERMINATE INTERVIEW
Q5. (RECORD GENDER. DO NOT ASK. IF UNSURE, ASK FOR FIRST NAME.)
1. Male
2. Female
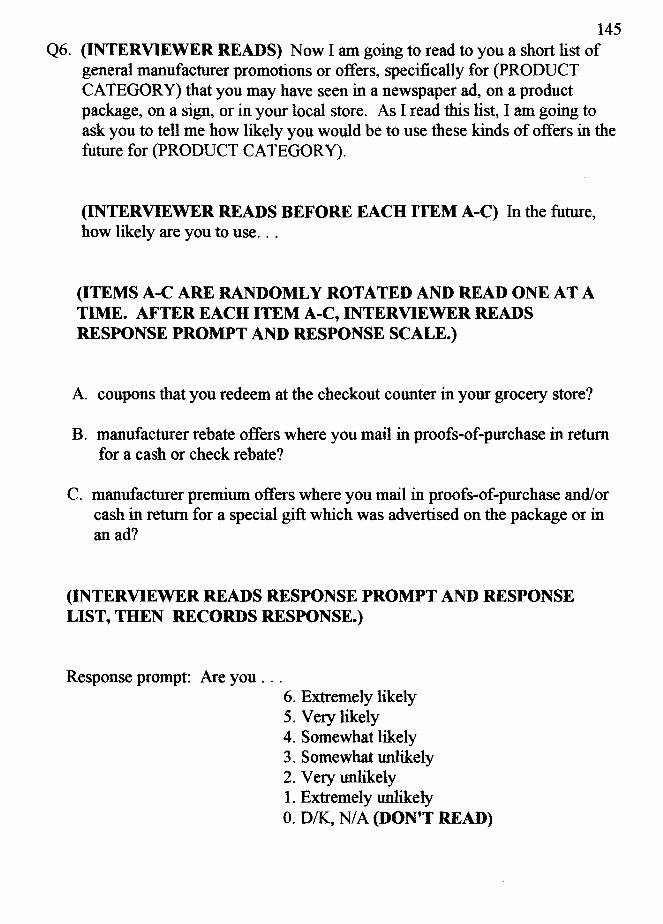
145 Q6. (INTERVIEWER READS) Now I am going to read to you a short list of
general manufacturer promotions or offers, specifically for (PRODUCT CATEGORY) that you may have seen in a newspaper ad, on a product package, on a sign, or in your local store. As I read this list, I am going to ask you to tell me how likely you would be to use these kinds of offers in the future for (PRODUCT CATEGORY).
(INTERVIEWER READS BEFORE EACH ITEM A-C) In the future, how likely are you to use ...
(ITEMS A-CARE RANDOMLY ROTATED AND READ ONE AT A TIME. AFTER EACH ITEM A-C, INTERVIEWER READS RESPONSE PROMPT AND RESPONSE SCALE.)
A. coupons that you redeem at the checkout counter in your grocery store?
B. manufacturer rebate offers where you mail in proofs-of-purchase in return for a cash or check rebate?
C. manufacturer premium offers where you mail in proofs-of-purchase and/or cash in return for a special gift which was advertised on the package or in anad?
(INTERVIEWER READS RESPONSE PROMPT AND RESPONSE LIST, THEN RECORDS RESPONSE.)
Response prompt: Are you ... 6. Extremely likely 5. Very likely 4. Somewhat likely 3. Somewhat unlikely 2. Very unlikely 1. Extremely unlikely 0. D/K, NIA (DON'T READ)
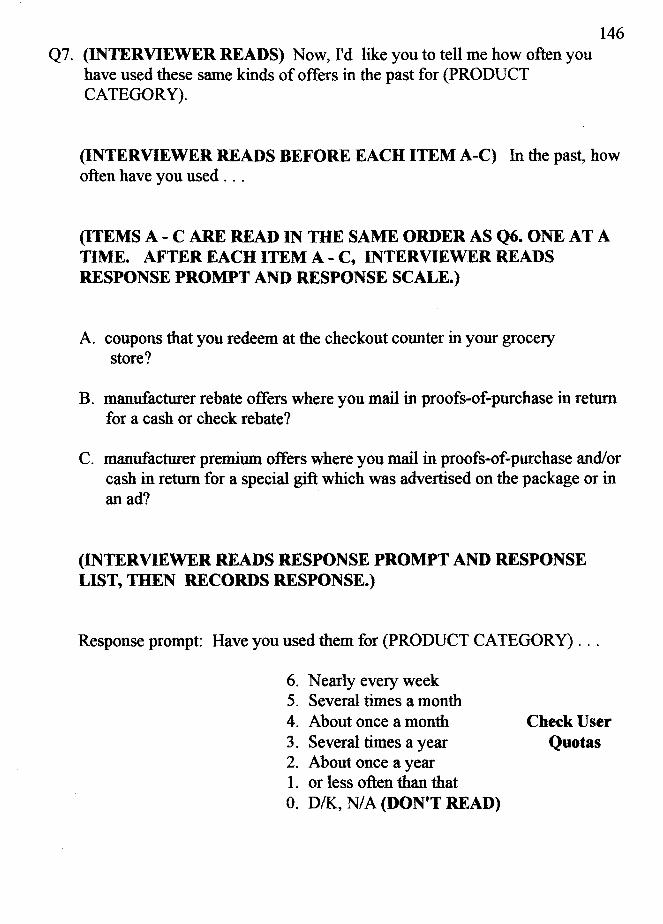
Q7. (INTERVIEWER READS) Now, I'd like you to tell me how often you have used these same kinds of offers in the past for (PRODUCT CATEGORY).
146
(INTERVIEWER READS BEFORE EACH ITEM A-C) In the past, how often have you used ...
(ITEMS A-CARE READ IN THE SAME ORDER AS Q6. ONE AT A TIME. AFTER EACH ITEM A - C, INTERVIEWER READS RESPONSE PROMPT AND RESPONSE SCALE.)
A. coupons that you redeem at the checkout counter in your grocery store?
B. manufacturer rebate offers where you mail in proofs-of-purchase in return for a cash or check rebate?
C. manufacturer premium offers where you mail in proofs-of-purchase and/or cash in return for a special gift which was advertised on the package or in anad?
(INTERVIEWER READS RESPONSE PROMPT AND RESPONSE LIST, IBEN RECORDS RESPONSE.)
Response prompt: Have you used them for (PRODUCT CATEGORY) ...
6. Nearly every week 5. Several times a month 4. About once a month Check User 3. Several times a year Quotas 2. About once a year 1. or less often than that 0. D/K, NIA (DON'T READ)
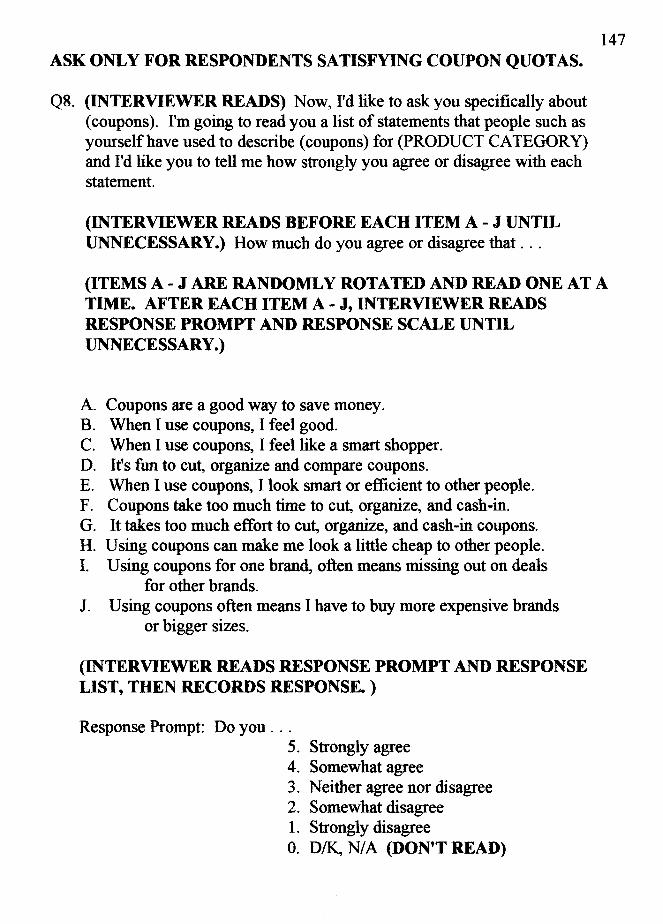
ASK ONLY FOR RESPONDENTS SATISFYING COUPON QUOTAS.
Q8. (INTERVIEWER READS) Now, I'd like to ask you specifically about (coupons). I'm going to read you a list of statements that people such as yourself have used to describe (coupons) for (PRODUCT CATEGORY) and I'd like you to tell me how strongly you agree or disagree with each statement.
(INTERVIEWER READS BEFORE EACH ITEM A - J UNTIL UNNECESSARY.) How much do you agree or disagree that ...
147
(ITEMS A- J ARE RANDOMLY ROTATED AND READ ONE AT A TIME. AFTER EACH ITEM A - J, INTERVIEWER READS RESPONSE PROMPT AND RESPONSE SCALE UNTIL UNNECESSARY.)
A. Coupons are a good way to save money. B. When I use coupons, I feel good. C. When I use coupons, I feel like a smart shopper. D. It's fun to cut, organize and compare coupons. E. When I use coupons, I look smart or efficient to other people. F. Coupons take too much time to cut, organize, and cash-in. G. It takes too much effort to cut, organize, and cash-in coupons. H. Using coupons can make me look a little cheap to other people. I. Using coupons for one brand, often means missing out on deals
for other brands. J. Using coupons often means I have to buy more expensive brands
or bigger sizes.
(INTERVIEWER READS RESPONSE PROMPT AND RESPONSE LIST, THEN RECORDS RESPONSE. )
Response Prompt: Do you ... 5. Strongly agree 4. Somewhat agree 3. Neither agree nor disagree 2. Somewhat disagree 1. Strongly disagree 0. D/K, N/ A (DON'T READ)
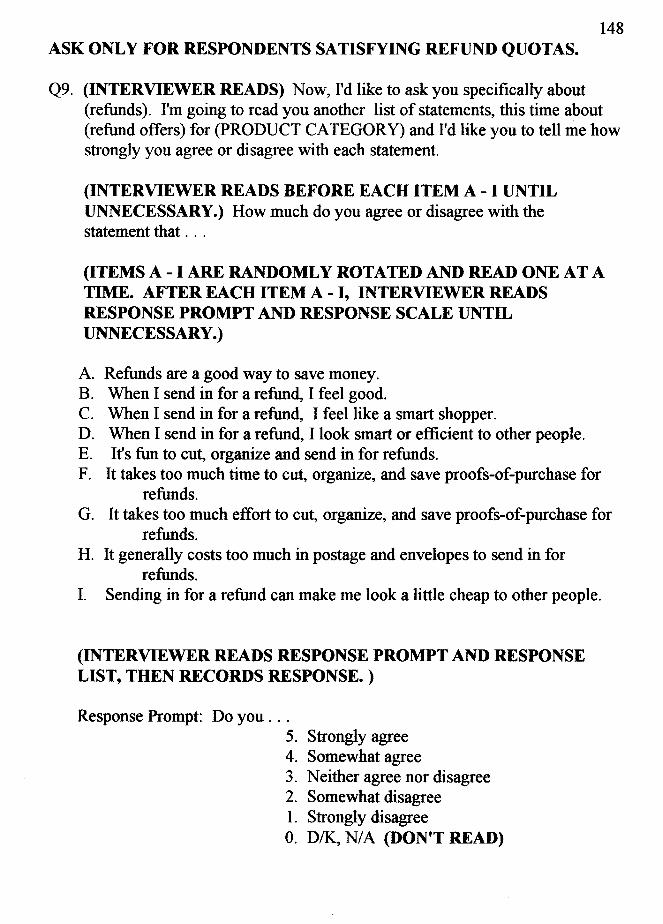
148 ASK ONLY FOR RESPONDENTS SATISFYING REFUND QUOTAS.
Q9. (INTERVIEWER READS) Now, I'd like to ask you specifically about (refunds). I'm going to read you another list of statements, this time about (refund offers) for (PRODUCT CATEGORY) and I'd like you to tell me how strongly you agree or disagree with each statement.
(INTERVIEWER READS BEFORE EACH ITEM A - I UNTIL UNNECESSARY.) How much do you agree or disagree with the statement that . . .
(ITEMS A- I ARE RANDOMLY ROTATED AND READ ONE AT A TIME. AFTER EACH ITEM A - I, INTERVIEWER READS RESPONSE PROMPT AND RESPONSE SCALE UNTIL UNNECESSARY.)
A. Refunds are a good way to save money. B. When I send in for a refund, I feel good. C. When I send in for a refund, I feel like a smart shopper. D. When I send in for a refund, I look smart or efficient to other people. E. It's fun to cut, organize and send in for refunds. F. It takes too much time to cut, organize, and save proofs-of-purchase for
refunds. G. It takes too much effort to cut, organize, and save proofs-of-purchase for
refunds. H. It generally costs too much in postage and envelopes to send in for
refunds. I. Sending in for a refund can make me look a little cheap to other people.
(INTERVIEWER READS RESPONSE PROMPT AND RESPONSE LIST, THEN RECORDS RESPONSE. )
Response Prompt: Do you ... 5. Strongly agree 4. Somewhat agree 3. Neither agree nor disagree 2. Somewhat disagree 1. Strongly disagree 0. D/K, NI A (DON'T READ)

149 ASK ONLY FOR RESPONDENTS SATISFYING PREMIUM QUOTAS.
QlO. (INTERVIEWER READS) Now, I'd like to ask you specifically about the third kind of offer we mentioned, (premium offers). Again, I'll read you a list of statements about (premiums) for (PRODUCT CATEGORY) and I'd like you to tell me how strongly you agree or disagree with each statement.
(INTERVIEWER READS BEFORE EACH ITEM A - I UNTIL UNNECESSARY.) How much do you agree or disagree that ...
(ITEMS A- I RANDOMLY ROTATED AND READ ONE AT A TIME. AFTER EACH ITEM A - I, INTERVIEWER READS RESPONSE PROMPT AND RESPONSE SCALE UNTIL UNNECESSARY.)
A. Premium offers allow me to purchase useful or valuable items. B. Premium offers can help save money by allowing me to trade in proofs-
of-purchase for special items at a reduced price. C. It's fun to send away for premium gifts. D. When I send away for a premium gift, I feel good. E. When I send away for a premium gift, I feel like a smart shopper. F. It generally costs too much in cash, postage, and envelopes to send
away for a premium gift. G. It's too risky to send away for premium gifts that may not be what you
expected. H. It takes too much effort to cut, save and send in proofs-of-purchase for
premiums. I. It takes too much time to cut, save and send in proofs-of-purchase for
premium offers.
(INTERVIEWER READS RESPONSE PROMPT AND RESPONSE LIST, THEN RECORDS RESPONSE.)
Response Prompt: Do you ... 5. Strongly agree 4. Somewhat agree 3. Neither agree nor disagree 2. Somewhat disagree 1. Strongly disagree 0. D/K, NIA (DON'T READ)
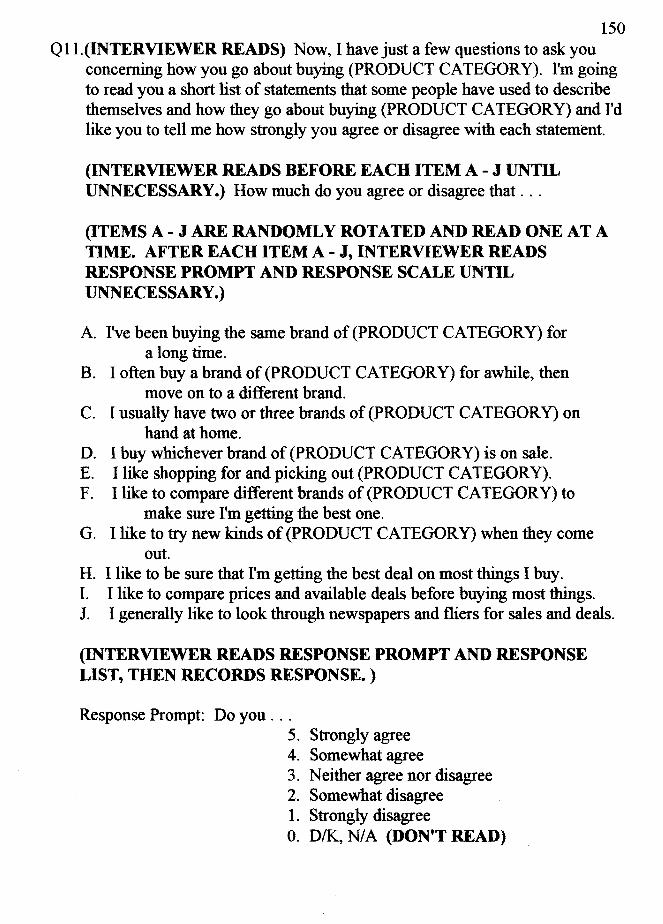
150 Ql 1.(INTERVIEWER READS) Now, I have just a few questions to ask you
concerning how you go about buying (PRODUCT CATEGORY). I'm going to read you a short list of statements that some people have used to describe themselves and how they go about buying (PRODUCT CATEGORY) and I'd like you to tell me how strongly you agree or disagree with each statement.
(INTERVIEWER READS BEFORE EACH ITEM A - J UNTIL UNNECESSARY.) How much do you agree or disagree that ...
(ITEMSA-J ARE RANDOMLY ROTATED AND READ ONE AT A TIME. AFTER EACH ITEM A - J, INTERVIEWER READS RESPONSE PROMPT AND RESPONSE SCALE UNTIL UNNECESSARY.)
A. I've been buying the same brand of(PRODUCT CATEGORY) for a long time.
B. I often buy a brand of(PRODUCT CATEGORY) for awhile, then move on to a different brand.
C. I usually have two or three brands of (PRODUCT CATEGORY) on hand at home.
D. I buy whichever brand of (PRODUCT CATEGORY) is on sale. E. I like shopping for and picking out (PRODUCT CATEGORY). F. I like to compare different brands of (PRODUCT CATEGORY) to
make sure I'm getting the best one. G. I like to try new kinds of (PRODUCT CATEGORY) when they come
out. H. I like to be sure that I'm getting the best deal on most things I buy. I. I like to compare prices and available deals before buying most things. J. I generally like to look through newspapers and fliers for sales and deals.
(INTERVIEWER READS RESPONSE PROMPT AND RESPONSE LIST, THEN RECORDS RESPONSE. )
Response Prompt: Do you ... 5. Strongly agree 4. Somewhat agree 3. Neither agree nor disagree 2. Somewhat disagree 1. Strongly disagree 0. D/K, NIA (DON'T READ)
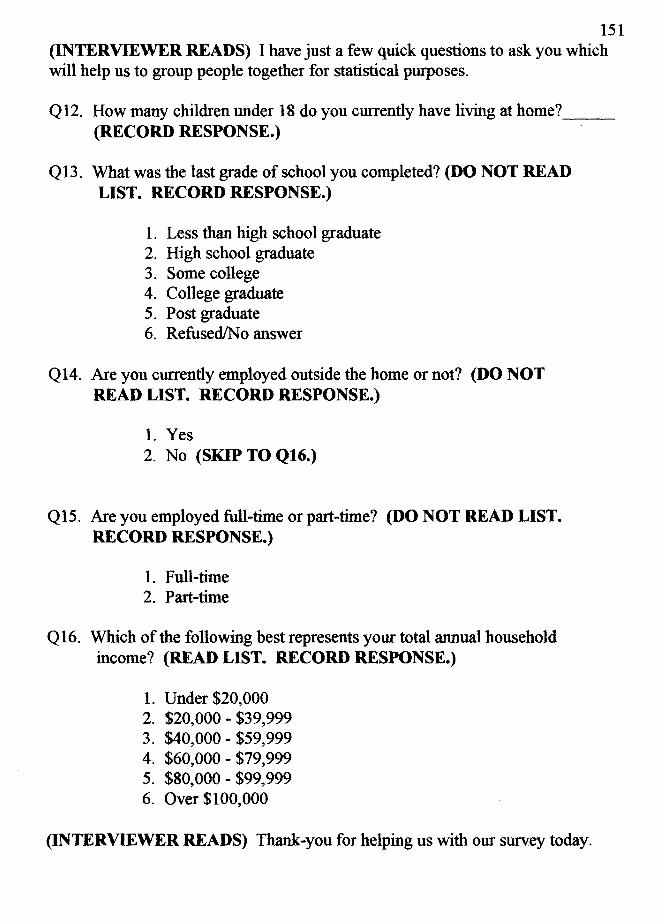
151 (INTERVIEWER READS) I have just a few quick questions to ask you which will help us to group people together for statistical purposes.
Q12. How many children under 18 do you currently have living at home? __ (RECORD RESPONSE.)
Q13. What was the last grade of school you completed? (DO NOT READ LIST. RECORD RESPONSE.)
1. Less than high school graduate 2. High school graduate 3. Some college 4. College graduate 5. Post graduate 6. Refused/No answer
Q14. Are you currently employed outside the home or not? (DO NOT READ LIST. RECORD RESPONSE.)
1. Yes 2. No (SKIP TO Q16.)
Q15. Are you employed full-time or part-time? (DO NOT READ LIST. RECORD RESPONSE.)
1. Full-time 2. Part-time
Q 16. Which of the following best represents your total annual household income? (READ LIST. RECORD RESPONSE.)
1. Under $20,000 2. $20,000 - $39,999 3. $40,000 - $59,999 4. $60,000 - $79,999 5. $80,000 - $99,999 6. Over $100,000
(INTERVIEWER READS) Thank-you for helping us with our survey today.
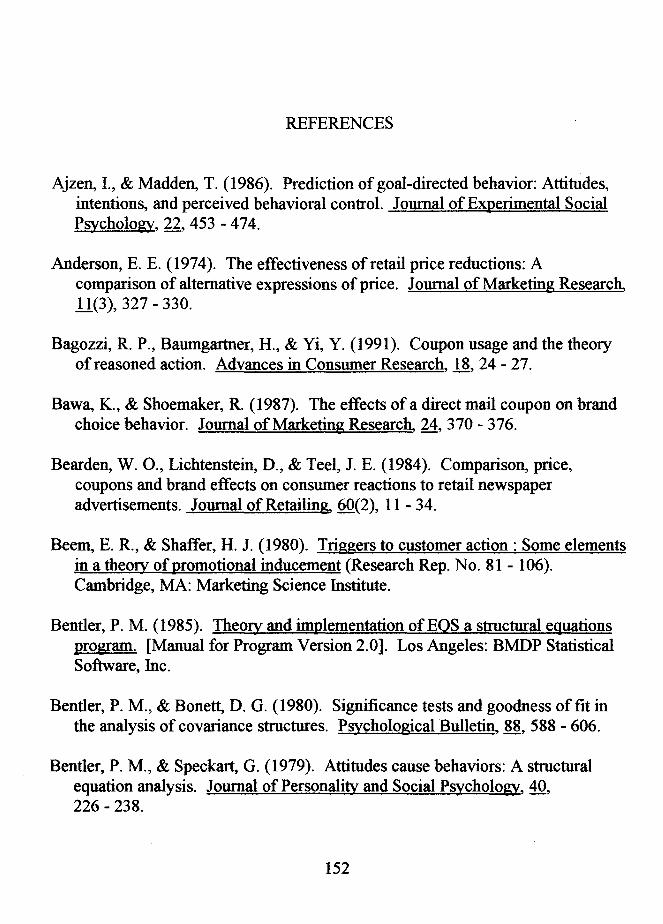
REFERENCES
Ajzen, I., & Madden, T. ( 1986). Prediction of goal-directed behavior: Attitudes, intentions, and perceived behavioral control. Journal of Experimental Social Psychology. 22, 453 - 474.
Anderson, E. E. (1974). The effectiveness of retail price reductions: A comparison of alternative expressions of price. Journal of Marketing Research, il(3), 327 - 330.
Bagozzi, R. P., Baumgartner, H., & Yi, Y. (1991). Coupon usage and the theory of reasoned action. Advances in Consumer Research, ll, 24 - 27.
Bawa, K., & Shoemaker, R. (1987). The effects of a direct mail coupon on brand choice behavior. Journal of Marketing Research, 24, 370 - 376.
Bearden, W. 0., Lichtenstein, D., & Teel, J.E. (1984). Comparison, price, coupons and brand effects on consumer reactions to retail newspaper advertisements. Journal of Retailing, 60(2), 11 - 34.
Beem, E. R., & Shaffer, H.J. (1980). Triggers to customer action: Some elements in a theozy of promotional inducement (Research Rep. No. 81 - 106). Cambridge, MA: Marketing Science Institute.
Bentler, P. M. ( 1985). Theoty and implementation of EOS a structural equations program. [Manual for Program Version 2.0]. Los Angeles: BMDP Statistical Software, Inc.
Bentler, P. M., & Bonett, D. G. (1980). Significance tests and goodness of fit in the analysis of covariance structures. Psychological Bulletin, 88, 588 - 606.
Bentler, P. M., & Speckart, G. (1979). Attitudes cause behaviors: A structural equation analysis. Journal of Personality and Social Psychology, 40, 226 - 238.
152
153 Blair, E. A., & Landon, L. L. (1981). The effects of reference prices in retail
advertisements. Journal of Marketing. 45(2), 61 - 69.
Blattberg, R. C., Peacock, P., & Sen, S. K. (1976). Purchasing strategies across product categories. The Journal of Consumer Research, 3(3), 143 - 154.
Brinberg, D. (1979). The comparison of three attitude models for the prediction of blood donation behavior. Unpublished doctoral dissertation, University of Illinois.
Brown, R. G. (1974). Sales response to promotions and advertising. Journal of Advertising Research, 14(4), 33 - 39.
Buzas, J., & Marmorstein, H. (1988). Consumer's knowledge of supermarket prices: Effects of manufacturer and retailer promotions. Advances in Consumer Research, 15, 360 - 363.
Carmen, J.M. (1969). Some insights into reasonable grocery shopping strategies. Journal of Marketing, 1, 24 - 29.
Chakraborty, G., & Cole, C. (1991). Coupon characteristics and brand choice. Psychology & Marketing,~. 145 - 159.
Conover, J. (1989). The influence of cents-off coupons on brand choice decisions at the point of purchase. Advances in Consumer Research, 16, 443 - 446.
Diamond, W. D., & Campbell, L. (1989). The framing of sales promotions: Effects on reference price changes. Advances in Consumer Research, 16, 240- 246.
Dickson, P.R., & Sawyer, A.G. (1986). Point-of-purchase behavior and price perceptions of supermarket shoppers (Research Rep. No. 86 - 102). Cambridge, MA: Marketing Science Institute.
Dickson, P.R., & Sawyer, A.G. (1990). The price knowledge and search of supermarket shoppers. Journal of Marketing, 2-4, 42- 53.
Dodson, J. A. Tybout, A. M., & Stemthal, B. (1978). Impact of deals and deal retraction on brand switching. Journal of Marketing Research, 15, 72 - 81.

154 Donnelly Marketing. (1991). 10th annual survey of promotional practices.
Stanford, CT: Author.
Fader, P. S., & McAlister, L. (1990). An elimination by aspects model of consumer response to promotion calibrated on UPC scanner data. Journal of Marketing Research, 27, 322 -332.
Feick, L. F., & Price, L. L. (1987). The market maven: A diffuser of marketplace information. Journal of Marketing, 51, 83 - 97.
Fishbein, M., & Ajzen, I. (1975). Belief, attitude, intention, and behavior: An introduction to theory and research. Reading, MA: Addison-Wesley.
Gardner, M., & Shuman, P. (1987). Sponsorship: An important component of the promotions mix. Journal of Advertising, 16, 11 - 17.
Gould, J. (1987). Sweepstakes: The consumer viewpoint. Unpublished manuscript, Pace University.
Grover, R., & Srinivasan, V. (1992). Evaluating the multiple effects of retail promotions on brand loyal and brand switching segments. Journal of Marketing Research, 29, 76 - 89.
Guadagni, P. M., & Little, D. C. (1983). A logit model of brand choice calibrated on scanner data. Marketing Science, i(3), 203 - 238.
Henderson, C. M. (1984). Modeling the coupon redemption decision. Advances in Consumer Research, 12, 138 - 143.
Henderson, C. M. (1990). Sales promotion segmentation: Refming the dealproneness construct. Unpublished manuscript, NH: Dartmouth College.
Holmes, J., & Lett, J. (1977). Product sampling and word of mouth. Journal of Advertising Research, 11, 35 - 39.
Inman, J. T., & McAlister, L. (1991). A model incorporating promotion signal sensitivity for prescribing retailer promotion policy. (Research Rep. No. 92 -107). Cambridge, MA: Marketing Science Institute.
155 Inman, J., McAlister, L., & Hoyer, W. D. (1990). Promotion signal: Proxy for
price cut? Journal of Consumer Researca 16, 420 - 432.
Jain, A. (1990). A theoretical model of household coupon usage behavior and its empirical test. Unpublished Manuscript, TX: Southern Methodist University.
Jolson, M.A., Wiener, J. L., & Rosecky, R. (1987). Correlates of rebate proneness. Journal of Advertising Researca 27(1), 33 - 44.
Kahneman, D., Slovic, P., & Tversky, A. (1982). Judgment under uncertainty: Heuristics and biases. Cambridge, MA: Cambridge University Press.
Kalwani, M., & Yim, K. (1992). Consumer price and promotion expectations: An experimental study. Journal of Marketing Researca 29, 90 - 100.
Krishna, A., Currin, I., & Shoemaker, R. (1991). Consumer perceptions of promotional activity. Journal of Marketing, 55, 4 - 16.
Landis, D., Triandis, H. C., & Adamopoulos, J. (1978). Habit and behavioral intentions as predictors of social behavior. Journal of Social Psychology. 106, 227 - 237.
Levedahl, W. J. (1988). Coupon redeemers: Are they better shoppers? Journal of Consumer Affairs, 22(2), 264 - 283.
Lichtenstein, D., Netemeyer, R., & Burton, S. (1990). Distinguishing coupon proneness from value consciousness: An acquisition - transaction utility theory perspective. Journal of Marketing, 54, 54 - 67.
Lynch, J. G., Jr., & Srull, T. K. (1982). Memory and attentional factors in consumer choice: Concepts and research methods. Journal of Consumer Researca ~. 18 - 37.
Marmorstein, H., Grewal, D., & Fishe, R. P.H. (1992). The value of time spent in price-comparison shopping: Survey and experimental evidence. Journal of Consumer Researca 19, 52 - 61.
Mediamark Research Incorporated. (1993). Shopping and tobacco products report, (Research Rep. No. 11). New York: Author.

156 Miniard, P. W., & Cohen, J.B. (1983). Modeling personal and normative
influences on behavior. Journal of Consumer Research, 10, 169 - 180.
Mobley, W. H., Homer, S. 0., & Hollingsworth, A. T. (1978). An evaluation of precursors of hospital turnover. Journal of Applied Psychology, 63, 408 ·- 414.
Montgomery, D. B. (1970). Consumer characteristics and deal purchasing: An example from the dentifrice market. Cambridge, MA: Marketing Science Institute.
Neslin, S. A., & Clarke, D. G. (1987). Relating the brand use profile of coupon redeemers to brand and coupon characteristics. Journal of Advertising Research, 27(1), 23 - 31.
Nielsen Clearing House Promotional Services. (1985). What consumers think of coupons: A study of consumer actions and reactions. Chicago: A.C. Nielsen Company.
Nielsen Clearing House Promotional Services. ( 1992). Consumer use of coupons shows growth for second year in a row [News release]. Chicago: A.C. Nielsen Company.
Petty, R. E., & Cacioppo, J. T. (1981). Attitudes and persuasion: Classic and contemporary approaches. IA: Wm. C. Brown Company Publishers.
Pomazal, R. J. (1974). Attitudes, normative beliefs and altruism: Help for helping behavior. Unpublished doctoral dissertation, University of Illinois.
Price, L. L., & Feick, L. F. (1988). Information sensitive consumers and market information. Journal of Consumer Affairs, 21, 328 - 341.
Price, LL., Feick, L. F., & Federovich, A.G. (1988). Couponing behaviors of the market maven: Profile of a super couponer. Advances in Consumer Research, 15, 354 - 359.
Raju, J. S., Srinivasan, V., & Lal, R. (1990). The effects of brand loyalty on competitive price promotional strategies. Management Science, 36(3), 276- 304.

Ryan, M. J. (1982). Behavioral intention formation: The interdependency of attitudinal and social influence variables. Journal of Consumer Research, 2, 263 - 277.
Ryan, M. J., & Bonfield, E. H. ( 1980). Fishbein's intentions model: A test of external and pragmatic validity. Journal of Marketing, 44, 82 - 95.
Ryan, T. A. (1970). Intentional behavior. New York: Ronald Press.
Schacter, S., Festinger, L., Willennan, B., & Hyman, R. (1961). Emotional disruption and industrial productivity. Journal of Applied Psychology, 45, 207 - 213.
Schindler, R. M. (1984a). How cents-off coupons motivate the consumer. In research on sales promotion: Collected papers. (Research Rep. 84 - 104). Cambridge, MA: Marketing Science Institute.
157
Schindler, R. M., (1984b). How sales promotions stimulate consumer response: Implications for designing more effective programs, Unpublished manuscript, Chicago: University of Chicago.
Schindler, R. M. (1989). The excitement of getting a bargain: Some hypotheses concerning the origins and effects of smart shopper feelings. Advances in Consumer Research, 16, 447 - 453.
Scott, C. A. (1976). The effects of trial and incentives on repeat purchase behavior. Journal of Marketing Research, 13(3), 263 - 269.
Seipel, C. M. (1971). Premiums - forgotten by theory. Journal of Marketing, 35, 26 - 34.
Shababb, G. A. (1987). The trial effectiveness of coupons. Researcher, 1, 15 - 19.
Shimp, T. A., & Kavas, A. (1984). The theory of reasoned action applied to coupon usage. Journal of Consumer Research, li, 795 - 809.
Shoemaker, R. W., & Shoaf, F. R. (1977). Repeat rates of deal purchases. Journal of Advertising Research, 17(2), 47 - 53.

158 Shoemaker, R. W., & Tibrewala, V. (1985). Relating coupon redemption rates to
past purchasing of the brand. Journal of Advertising Research, 25(5), 40 - 47.
Staff. (1982). Shopping habits: Prices aren't afterall everything. Progressive Grocer, 141 - 144.
Tat, P. K., & Cornwell, T. B. (1992). A motivation-based model of coupon usage. Unpublished manuscript, TN: Memphis State University.
Teel, J.E., Williams, R.H., & Bearden, W. 0. (1980). Correlates of consumer susceptibility to coupons in new grocery product introductions. Journal of Advertising. 2(3), 31 - 46.
Triandis, H. C. (1980). Values, attitudes, and interpersonal behavior. In M.M. Page (Ed.), Nebraska Symposium on Motivation. Lincoln, NE: University of Nebraska Press, 195 - 259.
Ward, J ., & Hill, R. ( 1991 ). Designing effective promotional games: opportunities and problems. Journal of Advertising, 20, 69 - 81.
Webster, F. E., Jr. (1965). The deal-prone consumer. Journal of Marketing Research, 1{2), 186 - 189.
Wierenga, B. (1974). An investigation of brand choice processes. Rottersdam University.
Zaichowsky, J. L. (1988). Involvement and the price cue. Advances in Consumer Research, li, 323 - 327.

VITA
Denise L. Archambault was born in Holyoke, Massachusetts on February 13, 1963
to the parents of Marcel and Alice Archambault. She received her Bachelor of
Arts and Sciences Summa Cum Laude from Western New England College in
Springfield, Massachusetts and her Masters degree in Applied Social Psychology
from Loyola University of Chicago. During the course of her academic training,
Ms. Archambault continually sought to apply the theories and methods of the
science of Psychology to the professional realms of a modem society. She has
held professional positions within mental health, government, advertising,
marketing, and academia, learning from each a bit more about human nature and
bringing to each a cross disciplinary perspective founded in psychology and
nurtured through diverse professional experiences.
159

DISSERTATION APPROVAL SHEET
The dissertation submitted by Denise L. Archambault, MA has been read and approved by the following committee:
Scott Tindale, Ph.D., Director Associate Professor, Psychology Loyola University of Chicago
Emil Posavac, Ph.D. Professor, Psychology Loyola University of Chicago
Linda Heath, Ph.D. Professor, Psychology Loyola University of Chicago
Bernard L. Dugoni, Ph.D. Survey Methodologist National Opinion Research Center
The final copies have been examined by the director of the dissertation and the signature which appears below verifies the fact that any necessary changes have been incorporated and that the dissertation is now given final approval by the committee with reference to content and form.
The dissertation is, therefore, accepted in partial fulfillment of the requirements for the degree of Doctor of Philosophy.
-- ·3/?--+-~/~~)=5-____ _ I T Date Director's Signature