a thesis submitted in partial fulfillment of the...
TRANSCRIPT

A PROJECT REPORT
ON
“ STUDY ON ESTERIFICATION OF ETHYLENE GLYCOL WITH ACETIC ACID IN THE PRESENCE OF SERALITE SRC-120 AND
MOLECULAR SIEVE 13X CATALYST ”
A Thesis Submitted in Partial Fulfillment of the Requirements for the
Degree of
Master of Technology
In
Chemical Engineering
Submitted By
VISHNU PRASAD YADAW
(208CH-101)
DEPARTMENT OF CHEMICAL ENGINEERING
NATIONAL INSTITUTE OF TECHNOLOGY
ROURKELA-769008
2010

A PROJECT REPORT
ON
“ STUDY ON ESTERIFICATION OF ETHYLENE GLYCOL WITH ACETIC ACID IN THE PRESENCE OF SERALITE SRC-120 AND
MOLECULAR SIEVE 13X CATALYST ”
A Thesis Submitted in Partial Fulfillment of the Requirements for the Degree of
Master of Technology
In
Chemical Engineering
Submitted By
VISHNU PRASAD YADAW
(208CH-101)
Under the guidance of
PROF. (Dr.) R. K. SINGH
DEPARTMENT OF CHEMICAL ENGINEERING
NATIONAL INSTITUTE OF TECHNOLOGY
ROURKELA -769008
2010

CERTIFICATE
This is to certify that the thesis of the project entitled, “STUDY ON ESTERIFICATION OF
ETHYLENE GLYCOL WITH ACETIC ACID IN THE PRESENCE OF SERALITE SRC-120
AND MOLECULAR SIEVE 13X CATALYST” submitted by Vishnu Prasad Yadaw (208CH-
101) in partial fulfillment of the requirements for the award of Master of Technology Degree in
Chemical Engineering at the National Institute of Technology, Rourkela is an authentic work
carried out by him under my supervision and guidance
To the best of my knowledge, the matter embodied in the thesis has not been submitted to any
other University/Institute for the award of any Degree.
Place: Rourkela PROF. (Dr.) R. K SINGH
Date: (Department of Chemical Engineering)
National institute of technology
Rourkela-769008

ii
ACKNOWLEDGEMENT
I take this opportunity to express my gratitude to all those who motivated, encouraged and
helped me in the project work. I am grateful to my supervisor, Prof. (Dr.) S. K. Singh, for his
kind support, guidance and encouragement throughout the project work, also for introducing to
this topic, which has been very interesting and has given me great insight to the future work on
this area.
I wish to thank Prof. (Dr.) S.K. Agarwal, Head of Department of Chemical Engineering for his
encouragement, patience and resourcefulness throughout the development of this project.
I also wish to thank Dr. A. Sahoo, P.G. coordinator, Prof. (Dr.) G. K. Roy, Dr. M. Kundu, Dr. S.
Mishra, Dr. B. Munshi, Dr. S. Paria, Dr. H. M. Jena, Dr. S. Khanam, Dr. A. Kumar, Dr. P.
Choudhury and for their kind support and valuable suggestion.
I wish to special thank Dr. S. K. Maity and Dr. P. Biswas for their kind support and valuable
suggestion in completion of this project report.
Cheerful special thanks to my friends and other members of the department for being so
supportive and helpful in every possible way.
Above all, I would like to give hearty thanks to my mother and father for their care and moral
support and to my brother and sisters for continuous love and support which strengthen me for
pursuing higher education.
VISHNU PRASAD YADAW

i
CONTENTS
Pg. No.
ABSTRACT
LIST OF FIGURES
LIST OF TABLES
NOMENENCLATURE
ABBREVIATIONS
iii
iv
vi-ix
ix
x
CHAPTER 1. INTRODUCTION
1.1 Introduction 1
1.2 Available industrial chemical process 1
1.3 Industrial application 4
1.4 Purpose of project work 4
1.5 Organization of thesis 5
CHAPTER 2. LITERATURE REVIEW
2.1 Esterification of acetic acid with butanol 6
2.2 Esterification of acetic acid with methanol 8
2.3 Esterification of acetic acid with ethanol 11
2.4 Esterification of acetic acid with other alcohol 13

ii
CHAPTER 3. PRESENT WORKS AND APPLIED REACTION MECHA NISM
3.1 Present works 19
3.2 Reaction Mechanism 19
CHAPTER 4. EXPERIMENTAL SETUP
4.1 Experimental Apparatus and gas-liquid chromatograph 21
4.2 Chemicals and catalyst material 22
4.3 Physical and chemical properties 22
4.4 Catalyst property 23
4.5 Procedure 23
CHAPTER 5. RESULTS
5.1
Observation table on different catalyst loading, reaction temperature
and molar ratio with reaction time
25
5.2 Effect of catalyst loading on different parameters 61
5.3
5.4
Effect of reaction temperature on various parameters
Parameter estimation
66
71
CHAPTER 6. DISCUSSION 76
CHAPTER 7. CONCLUSION 78
REFERENCES 80

iii
ABSTRACT
There is an increasing the trend of chemical industries toward new processes that should meets
more requirement such as generation of nearly zero waste chemicals, less energy, and sufficient
uses of product chemicals in various application. Esterification is the general name for
a chemical reaction in which two reactants ethylene glycol and acetic acid form an ester as a
product. Since the reaction was occurred in equilibrium and reversible manner, the reaction was
become slowly without catalyst.
The reaction was carried out in the presence of Seralite SRC-120 and Molecular Sieve
13x as acid catalyst with investigated temperature range from 333 to 363 K and varying amount
of 0.5wt% to 2.0wt% catalyst load. It was found that as increase reaction time as increase mole
fraction of product, conversion of reactant and selectivity of ethylene glycol di-acetate (EGDA)
but decrease the selectivity of ethylene glycol mono-acetate (EGMA). The maximum conversion
of acetic acid and ethylene glycol were obtained 46.12% and 100% during 10 hour reaction time
with 1.5wt% amount of catalyst loading respectively. But Molecular sieve 13x has been given
only 78% conversion of ethylene glycol with 4.0 wt% catalyst loading The selectivity of
ethylene glycol di-acetate has been observed 66 percentages with amount of 0.5wt% Seralite
SRC-120 as a catalyst. However the product selectivity with Molecular Sieve 13X was found to
be very less. In the present work, parameter estimation has been done by using non-linear least
square method with the help of Matlab modeling software. Best fit equilibrium constant and
activation energy was found for reaction system.

iv
LIST OF FIGURES
Fig.4.1 Experimental setup 21
Fig.5.2.1. Plots (a), (b), (c) and (d) show the effect of catalyst loading on conversion of
acetic acid at varying reaction time and temperature at 333, 343, 353 and 363 K 61
Fig.5.2.2. Plots (a), (b), (c) and (d) show the effect of catalyst loading on conversion of
ethylene glycol at varying reaction time and temperature at 333, 343, 353 and
363 K
62
Fig.5.2.3. Plots (i), (j), (k) and (l) show the effect of catalyst loading on selectivity of
ethylene glycol mono-acetate at varying ethylene glycol conversion and
temperature at 333, 343, 353 and 363 K
63
Fig.5.2.4. Plots (m), (n), (o) and (p) show the effect of catalyst loading on selectivity of
ethylene glycol di-acetate at varying ethylene glycol conversion and
temperature at 333, 343, 353 and 363 K
64
Fig.5.3.1. Plots (i), (ii), (iii) and (iv) show the effect of reaction temperature on conversion
of acetic acid with varying reaction time and catalyst loading of 0.5, 1.0, 1.5 and
2.0wt%
65
Fig.5.3.2. Plots (v), (vi), (vii) and (viii) show the effect of reaction temperature on
conversion of ethylene glycol with varying reaction time and catalyst loading of
0.5, 1.0, 1.5 and 2.0wt%
66
Fig.5.3.3. Plots (ix), (x), (xi) and (xii) show the effect of reaction temperature on
selectivity of ethylene glycol mono-acetate with varying ethylene glycol
conversion and catalyst loading of 0.5, 1.0, 1.5 and 2.0wt%
67
Fig.5.3.4. Plots (xiii), (xiv), (xv) and (xvi) show the effect of reaction temperature on
selectivity of ethylene glycol di-acetate with varying ethylene glycol conversion
and catalyst loading of 0.5, 1.0, 1.5 and 2.0wt%
68

v
Fig.5.3.5. Plots (xvii), (xviii), (xix) and (xx) show the effect of reaction temperature on
selectivity of ethylene glycol di-acetate with varying reaction time and catalyst
loading of 0.5, 1.0, 1.5 and 2.0wt%
69
Fig.5.3.6. Plots (xxi), (xxii), (xxiii) and (xxiv) show the effect of reaction time on
selectivity of EGDA and mol fraction of used reaction system, also effect of EG
conversion on selectivity of EGDA at molecular sieve 13X catalyst loading of,
4.0wt%
70
Fig.5.4.1. Plot shows the comparison between experimental and model EG concentration
data with reaction time. 72
Fig.5.4.2. Plot shows the comparison between experimental and model of five component
reaction system with concentration data and reaction time. 73
Fig.5.4.3. comparison of experimental and model for conversion of EG and AA and with
varying reaction time and catalyst loading of 1.5wt%. 74
Fig.5.4.4. Comparison of experimental and model data for selectivity of EGDA with
varying reaction time and catalyst loading of 1.5 75
Fig.5.4.5. Plot shows the Activation energy at 0.5, 1.0 and 1.5wt% catalyst loading 75

vi
LIST OF TABLES
Table 4.3 Physical and chemical properties 23
Table 4.4 Catalyst property 24
Table 5.1 Variation of different parameter at 0.5wt% catalyst loading, 333K reaction
temperature and 3.0 molar ratio of AA to EG
25
Table 5.2 Variation of different parameter at 0.5wt% catalyst loading, 343K reaction
temperature and 3.0 molar ratio of AA to EG
26
Table 5.3. Variation of different parameter at 0.5wt% catalyst loading and 353K
reaction temperature
27
Table 5.4. Variation of different parameter at 0.5wt% catalyst loading and 363K reaction
temperature
28
Table 5.5. Variation of different parameter at 1.0wt% catalyst loading and 333K reaction
temperature
29
Table 5.6. Variation of different parameter at 1.0wt% catalyst loading and 343K
reaction temperature
30
Table 5.7 Variation of different parameter at 1.0wt% catalyst loading and 353K
reaction temperature
31
Table 5.8. Variation of different parameter at 1.0wt% catalyst loading and 363K
reaction temperature
32
Table 5.9. Variation of different parameter at 1.5wt% catalyst loading and 333K reaction
temperature
33
Table5.10.Variation of different parameter at 1.5wt% catalyst loading and 343K
reaction temperature
34

vii
Table5.11. Variation of different parameter at 1.5wt% catalyst loading and 353K
reaction temperature
35
Table5.12.Variation of different parameter at 1.5wt% catalyst loading and 363K
reaction temperature
36
Table5.13.Variation of different parameter at 2.0wt% catalyst loading and 333K
reaction temperature
37
Table5.14.Variation of different parameter at 2.0wt% catalyst loading and 343K
reaction temperature
38
Table 5.15. Variation of different parameter at 2.0wt% catalyst loading and 353K
reaction temperature
39
Table 5.16. Variation of different parameter at 2.0wt% catalyst loading and 363K
reaction temperature
40
Table 5.17. Variation of different parameter at 2.0wt% catalyst loading, 333K reaction
temperature and 1.5 molar ratio of AA to EG
41
Table 5.18. Variation of different parameter at 2.0wt% catalyst loading, 333K reaction
temperature and 0.66 molar ratio of AA to EG
42
Table 5.19. Comparison of experimental data with simulated data at 0.5wt% catalyst
loading and temperature at 333K
43
Table 5.20. Comparison of experimental data with simulated data at 0.5wt% catalyst
loading and temperature at 343K
44
Table 5.21. Comparison of experimental data with simulated data at 0.5wt% catalyst
loading and temperature at 353K
45
Table 5.22. Comparison of experimental data with simulated data at 0.5wt% catalyst
loading and temperature at 363K
46
Table 5.23. Comparison of experimental data with simulated data at 1.0wt% catalyst 47

viii
loading and temperature at 333K
Table 5.24. Comparison of experimental data with simulated data at 1.0wt% catalyst
loading and temperature at 343K
48
Table 5.25. Comparison of experimental data with simulated data at 1.0wt% catalyst
loading and temperature at 353K
49
Table 5.26. Comparison of experimental data with simulated data at 1.0wt% catalyst
loading and temperature at 363K
50
Table 5.27. Comparison of experimental data with simulated data at 1.5wt% catalyst
loading and temperature at 333K
51
Table 5.28. Comparison of experimental data with simulated data at 1.5wt% catalyst
loading and temperature at 343K
52
Table 5.29. Comparison of experimental data with simulated data at 1.5wt% catalyst
loading and temperature at 353K
53
Table 5.30. Comparison of experimental data with simulated data at 1.5wt% catalyst
loading and temperature at 363K
54
Table 5.31. Comparison of experimental data with simulated data at 2.0wt% catalyst
loading and temperature at 333K
55
Table 5.32. Comparison of experimental data with simulated data at 2.0wt% catalyst
loading and temperature at 343K
56
Table 5.33. Comparison of experimental data with simulated data at 2.0wt% catalyst
loading and temperature at 353K
57
Table 5.34. Comparison of experimental data with simulated data at 2.0wt% catalyst
loading and temperature at 363K
58
Table 5.35. Estimated parameters at 0.5 wt% catalyst loading 59

ix
Table 5.36. Estimated parameters at 1.0wt% catalyst loading 59
Table 5.37. Estimated parameters at 1.5 wt% catalyst loading 60
Table 5.38. Estimated parameters at 2.0wt% catalyst loading 60
NOMENCLATURE :
K� Forward reaction equilibrium rate constant, lit/mol min
K�� Reverse reaction equilibrium rate constant, lit/mol min
K� Forward reaction equilibrium rate constant, lit/mol min
K�� Reverse reaction equilibrium rate constant, lit/mol min
CEG Concentration of ethylene glycol mol/lit
CHAC Concentration of ethylene glycol mol/lit
CEGMA Concentration of ethylene glycol mol/lit
CEGDA Concentration of ethylene glycol mol/lit
K0 Pre-exponatial factor
E Activation energy, KJ/mol
R Real gas constant
T Reaction temperature, K

x
ABBREVIATIONS :
EG Ethylene glycol
AA Acetic acid
EGMA Ethylene glycol mono-acetate
EGDA Ethylene glycol di-acetate

CHAPTER 1
INTRODUCTION

1
INTRODUCTION 1.1 Introduction
There is an increasing the inclination of chemical industries toward new processes that should
meets requirement such as generation of nearly zero waste chemicals, less energy, and sufficient
uses of product chemicals in various application. Hence the esterification is widely employed
reaction in the organic process industry. The reaction is carried out between carboxylic acid and
alcohol at with or without present of different acid catalyst under such specific condition.
Ethylene glycol was first prepared in 1859 by the French chemist Charles Wurtz. It was
produced on a small scale during World War I as a coolant and as an ingredient in explosives.
Widespread industrial production began in 1937, when its precursor ethylene oxide became
cheaply available. When first introduced it created a minor revolution in aircraft design because
when used in place of water as a radiator coolant, its higher boiling point allowed for smaller
radiators operating at higher temperatures. Ethylene glycol is produced from ethylene, via the
intermediate ethylene oxide [1]. Major derevatives of ethylene glycol by various reaction
processes are ethylene glycol, mono ethylene glycol, diethylene glycol, triethylene glycol, and
tetraethylene glycol.
1.2 Available industrial chemical process
There are different chemical reaction processes are available:
Isomerization
In chemistry isomerisation is the process by which one molecule is transformed into another
molecule which has exactly the same atoms, but the atoms are rearranged. In some molecules
and under some conditions, isomerisation occurs spontaneously. Many isomers are equal or
roughly equal in bond energy, and so exist in roughly equal amounts, provided that they can

2
interconvert relatively freely, that is the energy barrier between the two isomers is not too high.
When the isomerisation occurs intramolecularly it is considered a rearrangement reaction an
intramolecular isomerization that involves the breaking or making of bonds is a special case of a
molecular rearrangement [2].
Dehydration
Dehydration is defined as an excessive loss of body fluid. It is literally the removal of water from
reaction system which forms during reaction process. In the case of ethylene glycol and acetic
acid reaction system the dehydration play vital role because during reaction excess water has
been losses [3].
Etherification
Etherification of glycol is defined acid catalyzed reaction with formation of mono-, di- and tri-
alkyl glycol ethers. Since etherification reactions are carried out in the liquid phase, reaction
becomes slightly slow without catalyst. Hence the etherification of ethylene and propylene
glycols with isobutylene was carried out in the presence of cation exchange resin catalysts. In the
case of ethylene glycol, the mixture of mono- and di-ethers of corresponding glycol is obtained.
The mono-ether of ethylene glycol has good miscibility with water and is used for coating
solvents and as a solvent for paints [4].
Acetylation
Acetylation also called ethanoylation is described as a reaction that introduces an acetyl
functional group into a chemical compound. A reaction involving the replacement of the
hydrogen atom of a hydroxyl group with an acetyl group (CH3 CO) yields a specific ester, the

3
acetate. Acetic anhydride is commonly used as an acetylating agent reacting with free hydroxyl
groups [5].
Esterification
Esterification is the chemical process for making esters, which are compounds of the chemical
structure R-COOR', where R and R' are either alkyl or aryl groups. The most common method
for preparing esters is to heat a carboxylic acid with an alcohol while removing the water that is
formed. A mineral acid catalyst is usually needed to make the reaction occur at a useful rate.
Esters can also be formed by various other reactions. These include the reaction of an alcohol
with an acid chloride or an anhydride. The chemical structure of the alcohol, the acid, and the
acid catalyst used in the esterification reaction all effect its rate. Simple alcohols such as
methanol and ethanol react very fast because they are relatively small and contain no carbon
atom side chains that would hinder their reaction. These differing rates of reaction were first
reported by Nikolay Menschutkin in 1879-83. German chemists, during World War II,
developed solid acid catalysts or ion exchange resins for use in the manufacture of esters. These
solid catalysts work well with acid sensitive esters because they can be separated from the
product by filtration and therefore, the catalyst does not spend very much time in contact with
the acid unstable product. The esterification process has a broad spectrum of uses from the
preparation of highly specialized esters in the chemical laboratory to the production of millions
of tons of commercial ester products. These commercial compounds are manufactured by either
a batch or a continuous synthetic process. The continuous process for making esters was first
patented in 1921 and has been used extensively in the manufacture of large quantities of esters.
[6].

4
1.3 Industrial application
In present markets point of view organic esters are valuable intermediates in several branch of
chemical industry. It has been wide applications in plasticizers, solvents, perfumery also used as
flavoring agents and preservative in the food industry chemicals and as precursors to a gamut of
pharmaceuticals, agrochemicals, and other fine chemicals. Ethylene glycol mono and di-acetate
are major product of esterification of ethylene glycol with acetic acid and they have widely used
as an engine coolant and antifreeze. Due to its low freezing point, it has also been used as a
deicing fluid for windshields and jet engines. The antifreeze capabilities of ethylene glycol
derivatives have made it’s an important component of vitrification mixtures for low-temperature
preservation of biological tissues and organs. Minor uses of ethylene glycol include the
manufacture of capacitors and as a chemical intermediate in the manufacture of 1, 4-dioxane.
1.4 Purpose of project work
Esterification of carboxlic acids with alcohols in the presence of acid catalysts has been done by
many researchers, but the ethylene glycol and acetic acid reaction system has not been studied
more. Therefore present work is considered as esterification reaction between ethylene glycol
with acetic acid at presence of different catalysts. Hence the main objective of this work is to
find out the effects of various parameters such as temperature, catalyst type, catalyst loading,
reaction time and variable molar ratio of reactant on the five component reaction system. Also
have studied on percentage conversion for ethylene glycol and acetic acid, and have to find out
the selectivity of ethylene glycol mono acetate and di-acetate.

5
1.5 Organization of thesis
Chapter 1: This section is divided in several parts introduction, industrial process available,
industrial application of product, physical property of reactant, product and catalyst
and finally purpose of project work.
Chapter 2: This section is literature review section in which has explained previous work done
with different alcohol and also with ethylene glycol in presence of different
catalysts.
Chapter 3: This section shows the present work esterification mechanism and chemistry.
Chapter 4: This section shows experimental setup.
Chapter 5: In this section result has been shown which include effect of reaction time,
temperature, catalyst loading, molar ratio of reactant and type of catalyst.
Chapter 6: Discussion of result has been done in this section.
Chapter 7: Conclusion has been explained in this section.

CHAPTER 2
LITERATURE REVIEW

6
LITERATURE REVIEW
This Literature review represents the esterification of acetic acid with various alcohols in the
presence of several acid and ion- exchange catalyst.
2.1 Esterification of acetic acid with butanol
Esterification of acetic acid is well established chemical process, through which methyl,
ethyl, butyl and ethylene glycol acetate are formed. Several catalysts are used to synthesis acetate
in this process. Mesoporous Al-MCM-41 molecular sieves in the Si/Al ratios 33, 52, 72 and 114
(Rabindran et al. 2005) and 25, 50, 75 and 100 were synthesized under hydrothermal condition.
The acidity and surface area of catalyst were measured with the help FTIR using pyridine as the
diagnostic base and BET showed surface areas between 900 and 1000m2/g and pore diameter
around 26 °A units. Rabindran et al. (2005) was studied the effect of reaction temperature, mole
ratio of the reactant, time and catalyst loading on n-butanol conversion and selectivity of n-butyl
acetate was studied. Al-MCM-41 (33 and 25) was found to be more active than the other
catalysts owing to its high density of Bronsted acid sites. The reaction was also studied over H-
Mordenite, H-beta, H-ZSM-5 and HY zeolites, and the results are compared. n-Butyl acetate was
the major product obtained which is facilitated by weak and moderate Bronsted acid sites. The
low reaction period and low amount of catalyst were required for converting a major amount of
the reactants to product with high selectivity. The reaction over as-prepared catalyst showed
conversion 68% less than that of calcined sample. Hence the reaction is proposed to occur
mainly within the pores of the catalyst. The catalytic activity of the materials was tested for the
vapour phase esterification of acetic acidwith n-butyl alcohol (NBA), isobutyl alcohol (IBA) and
tertiary butyl alcohol (TBA) under autogeneous condition at 100, 150, 175 and 200
0C.NBAconversion was found to be higher than IBA and TBA. The hydrophobic properties of

7
catalyst, alcohols and the stearic properties of alcohols were suggested to play important roles in
the esterification. Another esterification reaction were carried out between the propionic acid
with n-butanol over Amberlyst 15, Amberlyst 35, Amberlyst 39, and HZSM-5 catalysts at the
temperatures range from 353 to 383 K in a stirred batch reactor (Liu et al., 2001). The literature
elaborated experimental results that indicated the Amberlyst resins such as Amberlysts 15wet,
35wet, and 39wet are effective catalysts than HZSM-5 for this reaction. The activation energy of
the forward reaction was found to be 14.1 kcal/mol. A propionic acid molecule is adsorbed on
the acid site of the resin and protonated first and then reacted with an n-butanol molecule in the
bulk liquid to form n-butyl propionate and water. The heat of reaction determined from the
experimental data is quite small, indicating that this reaction is essentially isothermal. However,
the reversible esterification of acetic acid with 1-butanol under the temperature range of 353.15
K to 393.15 K (Grob and Hasse, 2005) was investigated. Based on the final product as 1-butyl
acetate and water result different modeling approaches GE models NRTL, UNIQUAC, PC-
SAFT as well as COSMO-RS are compared.
Heteropolyacids supported on activated carbon have been shown to be efficient solid
catalysts for the esterification of acrylic acid by butanol in liquid phase (DuPont et al., 1995).
The reaction was carried out under batch and flow conditions. The authors have explained the
supported heteropolyacids shown better activity per proton than do conventional catalysts such
as sulfuric acid or resins. It was also proved that under flow conditions deactivation of the
catalyst was low from 43 to 32% conversion. The formation of n-butyl acetate in the presence of
heterogeneous catalysts was also esterified n-butanol with acetic acid (Blagova et al., 1995) at
temperature varying between 100 and 1200C. Three ion-exchange resin catalysts CT-269 mono-
sulfonated, Amberlyst-46 surface-sulfonated and Amberlyst-48 bi-sulfonated are similar matrix

8
but different sulfonation. It is concluded that the esterification occurs mainly on or near the
external surface of catalysts particles whereas side reactions occur mainly in the pores. In this
study shows that the ion-exchange capacity of A-46 is nearly five times lower than that of CT-
269. A detailed study of the esterification of propanoic acid by butanol or 2-ethylhexanol over
hetero- polyacids catalyst (DuPont and Lefebvre, 1996) has been carried out under homogeneous
reaction phase. It was also showing that the reaction rate is proportional to the concentration of
protons, and the activity loss increases with the surface area of the carbon support. Two
heteropolyacids such as 12-tungstophosphoric and 12-tungstosilicic acids were chosen for the
esterification reaction which is totally selective for the formation of the ester and water and can
be performed until a conversion of 100% is reached by elimination of water by azeotropic
distillation.
Esterification of acrylic acid with 1-butanol has been studied (Chen et al., 1999) in a
heterogeneous solid liquid reaction system using a variety of solid acids. Cs2.5H0.5PW12O40
exhibited the highest catalytic activity in the unit of catalyst weight among the solid oxide
catalysts, while the activity of Cs2.5H0.5PW12O40 was less than those of organic resins such as
Nafion and Amberlyst 15.
2.2 Esterification of acetic acid with methanol
To investigate the similarities and differences between heterogeneous and homogeneous
catalyzed esterification, the kinetics of acetic acid esterification with methanol (Liu et al., 2006)
were investigated using a commercial Nafion/silica nanocomposite catalyst (SAC-13) and
H2SO4, respectively. Reactions were carried out in an isothermal well-mixed batch reactor at
600C. It was found that the resin/silica composite is strongly acidic, with highly accessible sites

9
and sufficient robustness to withstand reasonably high temperatures upto 2000C and attrition
stress. Reaction on SAC-13 appears to involve single-site catalysis with a probable rate-
controlling Eley-Rideal surface reaction, which reaction mechanism involving a nucleophilic
attack between adsorbed carboxylic acid and un-adsorbed alcohol as the rate limiting step.
The adsorption equilibrium constants, dispersion coefficients and kinetic parameters were
obtained as most three different useful applications of the reversible reaction (Yu et al. (2004)) of
acetic acid and methanol catalyzed by Amberlyst-15 ion exchange resins. Experiments were
conducted in a packed bed reactor in the temperature range 313–323K using a rectangular pulse
input. The synthesis of methyl acetate, it has found that idea of recovery of dilute acetic acid
from wastewater, and the hydrolysis of methyl acetate. The quasi-homogeneous kinetic model
and linear adsorption isotherm are much applicable because of the solvent, methanol or water is
present at a large excess concentration. It was also found that, with the increase of temperature,
adsorption constants decrease, both the forward and backward reaction rate constants increase,
and the reaction equilibrium constants for the forward reaction decrease while that for the
backward reactions increase. Another esterification isothermal batch experiments carried out
between acetic acid with methanol in the presence of hydrogen iodide (Ronnback et al., 1997) at
temperature of 30-600C. The catalyst concentration was varied between 0.05 and 10.0 wt%. It
was explained that the protolysis equilibria of the acids and the influence of the activity
coefficients on the equilibria. Another paper has reported the impact of carboxylic acid chain
length on the kinetics of liquid-phase acid-catalyzed esterification over sulfuric acid and a
commercial Nafion/silica composite solid acid catalystSAC-13(Liu et al., 2006). Initial kinetics
was measured for the reactions of a series of linear chain carboxylic acids such as acetic,
propionic, butyric, hexanoic, and caprylic acid with methanol at 600C. It was shown that reaction

10
rate decreased as the number of carbons in the linear alkyl chain increased for both H2SO4 and
SAC-13. It has done work on a set of linear-chain carboxylic acids (acetic acid [HAc], propionic
acid [HPr], butyric acid [HBu], hexanoic acid [HHx], caprylic acid [HCp]).The same author (Liu
et al., 2006) report the impact of water on liquid-phase sulfuric acid catalyzed esterification of
acetic acid with methanol at 600C. In order to diminish the effect of water on the catalysis initial
reaction kinetics were measured using a low concentration of sulfuric acid and different initial
water concentrations. The decrease in initial reaction kinetics with increasing concentration of
water indicated that catalysis is impaired as esterification proceeds and water is continuously
produced from the condensation of carboxylic acids and alcohols. The negative impact of water
on catalysis was found to be essentially independent of temperature or molar ratio of methanol-
to-acetic acid under the experimental conditions used. The simultaneous water removal during
reaction should not only inhibit the reverse hydrolysis reaction, but also preserve high activity of
the catalytic protons throughout reaction. Esterification kinetics of propanoic acid with methanol
in the presence of a fibrous polymer-supported sulphonic acid catalyst as well as a conventional
resin catalyst (Lilja et al., 2002) was reported. Kinetic experiments were carried out in a batch
reactor isothermally at 55, 60 and 630C and with different initial molar ratios of propanoic acid
and methanol to 1:1, 2:3 and 3:2 with the conventional catalyst, Amberlyst 15. It was found that
the reaction rate was higher with the fibre catalyst than with the Amberlyst 15 and achieved
apparent second-order rate constant equal to 1.82×10⁻³ dm3/(mol2 g min) at 600C with the
initial molar ratio 1:1 and 7.03 × 10⁻⁴ dm3/(mol2 g min) for the conventional catalyst under
comparable conditions. The author and their co-workers were demonstrated the ability of the
fibrous polymer-supported sulphonic acid catalyst in the esterification of propanoic acid with
methanol and to develop an advanced kinetic model for the esterification. The reaction rate was

11
higher over the fibre catalyst as Smopex-101than over a conventional resin catalyst asAmberlyst-
15. It has reported that the increase of the temperature as well as the initial molar ratio of
propanoic acid and methanol increased the esterification rate. The degree of cross-linking of the
fibre catalyst and different fibre dimensions did not affect the reaction rate.
2.3 Esterification of acetic acid with ethanol
Most of the commercial processes for ethyl acetate production are via liquid-phase
esterification (Wu et al., 2004). The reactions were conducted at temperature range of 363 to 400
K, with molar ratio of ethanol to acetic acid 1.5. Author has reported that the temperature is
critical parameters in this novel EAc synthesis process and the one-pass ethanol conversion was
successfully improved from 67 to 85 mol%. It has found maximum yield for ethyl acetate to not
more than 67%. The equilibrium constant is almost constant and is independent of the reaction
temperature while the ethanol concentration in the products flow decreased from 14 to 6.5 wt%.
The reduction of ethanol concentration is advantageous for further purification processes.
Ethanol is converted into ethyl acetate with high selectivity over Cu-ZnO-ZrO2-Al 2O3
catalyst, together with low selectivity to methyl ethyl ketone. The ethyl acetate production ability
of catalyst is roughly proportional to the Cu surface area of the Cu-ZnO-ZrO2-Al 2O3 catalyst.
The highest ethanol conversion, the highest ethyl acetate selectivity, and the highest space-time
yield of ethyl acetate were achieved at Cu content of 70 mol%. The additive oxides as ZnO,
ZrO2, and Al2O3 (Inui et al., 2002) are necessary for the selective ethyl acetate formation.
The kinetics of esterification of maleic acid with ethanol over cheap and easily available
catalysts, ion-exchange resins and clay supported heteropoly acids (Yadav and Thathagar, 2002)
over detail study has been done by authors and achieved the order of catalytic activity as

12
Amberlyst-36, Amberlyst-15, Indion-170, Amberlyst-18, Amberlite IRA SL 400, Filtrol-24.20%
and DTP/K-10. A pseudo-homogeneous kinetic model was developed and the activation energy
was found to be 14.2 kcal.
The esterification of acetic acid with ethanol, catalyzed both homogeneously by the
acetic acid, and heterogeneously by Amberlyst 15, has been carried out at (Calvar et al., 2007)
several temperatures between 303.15 and 353.15K and at various starting reactant compositions.
The influence of feed composition and reflux ratio has been analyzed in packed column which is
filled by Amberlyst 15. The best results have been obtained using the ASOG method to calculate
the activity coefficients.
Another esterification process was reported by Yang et al. (2004) which occurred
between the lactic acid and ethanol over five different cation-exchange resins. The effect of
catalyst type, catalyst loading, and temperature on reaction kinetics was evaluated. In order to
study in this paper the authors has analysed that which components is the strongest adsorption
strength on the resin surface. It also has studied to simplified two mechanisms based on
Lanwt%uir– Hinselwood model. The thermal stability and mechanical strength of the resin
catalysts were tested by SEM. The order of catalytic activity was found to be:
D002<D001<Amberlyst-15< NKC<002. Activation energies were found to be 51.58 KJ/mol and
52.26 KJ/mol, which suggested that this reaction was kinetically controlled. Pervaporation-aided
esterification of acetic acid with ethanol was reported by some authors (Tanaka et al., 2001) at
343K over zeolite T membranes. Almost complete conversion was reached within 8 h when
initial molar ratios of alcohol to acetic acid were 1.5 and 2.

13
2.4 Esterification of acetic acid with other alcohol
The kinetic behavior of the heterogeneous esterification of acetic acid with amyl alcohol
over an acidic cation-exchange resin and Dowex 50Wx8-100 was (Wu and Lin, 2000) reported.
The experiments were conducted in a fixed-bed reactor at temperatures from 323 to 393 K and at
molar ratios of feed (amyl alcohol to acetic acid) vary from 1 to 10. Report has shown
equilibrium conversion of acetic acid increase with increasing reaction temperature. The kinetic
data were correlated with the quasi-homogeneous, Langmuir-Hinshelwood, Eley-Rideal, and
modified Langmuir-Hinshelwood models. The modified Langmuir-Hinshelwood model yielded
the best representation for the kinetic behavior of the reaction over wide ranges of temperature
and feed composition. The formation of a gaseous phase, when the reactor operated at 393 K, is
also of great advantage for the forward reaction esterification.
The esterification rate constant of the most active modification of the new catalyst
was obtained at 550C, which clearly exceeds the corresponding value obtained with a traditional
polyvinylbenzene supported catalyst. The esterification of acetic acid with methanol (Arvela et
al., 1999) was selected to the model system. They have been determined the kinetic parameters
both by using the activity coeficients and without the activity coeficients.. The apparent
activation energies are for Amberlyst 15 was found 106 kJ/mol, for Smopex 101 133 kJ/mol, and
for PE-UHS 86kJ/mol. The value of the equilibrium constant was estimated to be 4.0 to 5.0 at the
reference temperature 550C. The values of the kinetic parameters also confirm that Smopex 101
is an efficient esterification catalyst.
However, Kinetics of heterogeneous catalysed esterification of acetic acid with
isoamyl alcohol was studied over cation-exchange resin catalyst, Purolite CT-175, in a stirred
14
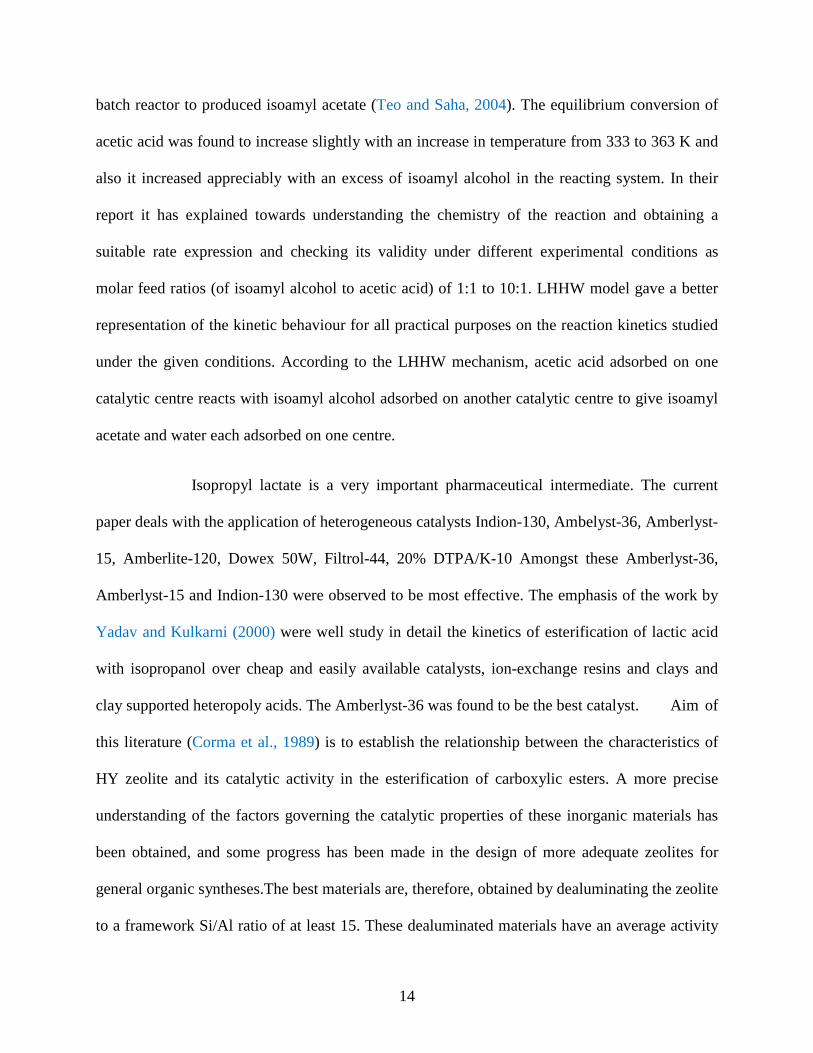
batch reactor to produced isoamyl acetate (Teo and Saha, 2004). The equilibrium conversion of
acetic acid was found to increase slightly with an increase in temperature from 333 to 363 K and
also it increased appreciably with an excess of isoamyl alcohol in the reacting system. In their
report it has explained towards understanding the chemistry of the reaction and obtaining a
suitable rate expression and checking its validity under different experimental conditions as
molar feed ratios (of isoamyl alcohol to acetic acid) of 1:1 to 10:1. LHHW model gave a better
representation of the kinetic behaviour for all practical purposes on the reaction kinetics studied
under the given conditions. According to the LHHW mechanism, acetic acid adsorbed on one
catalytic centre reacts with isoamyl alcohol adsorbed on another catalytic centre to give isoamyl
acetate and water each adsorbed on one centre.
Isopropyl lactate is a very important pharmaceutical intermediate. The current
paper deals with the application of heterogeneous catalysts Indion-130, Ambelyst-36, Amberlyst-
15, Amberlite-120, Dowex 50W, Filtrol-44, 20% DTPA/K-10 Amongst these Amberlyst-36,
Amberlyst-15 and Indion-130 were observed to be most effective. The emphasis of the work by
Yadav and Kulkarni (2000) were well study in detail the kinetics of esterification of lactic acid
with isopropanol over cheap and easily available catalysts, ion-exchange resins and clays and
clay supported heteropoly acids. The Amberlyst-36 was found to be the best catalyst. Aim of
this literature (Corma et al., 1989) is to establish the relationship between the characteristics of
HY zeolite and its catalytic activity in the esterification of carboxylic esters. A more precise
understanding of the factors governing the catalytic properties of these inorganic materials has
been obtained, and some progress has been made in the design of more adequate zeolites for
general organic syntheses.The best materials are, therefore, obtained by dealuminating the zeolite
to a framework Si/Al ratio of at least 15. These dealuminated materials have an average activity

15
per acid site very similar to that found for sulfuric acid. Additionally these heterogeneous
catalysts can overcome equilibrium limitations due to the hydrophobicity of their surfaces, where
the concentration of water must be quite small. zeolite catalysts have been found to be especially
valuable for the direct esterification of phenols. Yeramian et al. (1968) proposed the vapor-phase
reactions catalyzed by ion exchange resins with isopropyl alcohol with acetic acid. The
esterification reactions have been done at three different temperatures 1100, 1160 and 120°C. In
this case it was found that the experimental data are explained fairly well by a Hinshelwood-
Langmuir model. He has found that the influence of both reactants much important and no
general order of reaction with respect to them can be deduced, he has been also found that both
esterification and dehydration reactions proceed through the same rate mechanism. Chakrabarti
and Sharma (1991) have studied on esterification of acetic acid with styrene in the presence of
cation exchange resins as catalysts in the temperature range 20-60°C. The reaction was
accompanied by dimerization of styrene. The selectivity with respect to the ester was greatly
influenced by the catalyst, solvent and operating conditions. Monodisperse K2661 was found to
be the best catalyst amongst those studied.
Dynamics of a chromatographic reactor and develope a kinetic model for the
esterification of acetic acid with methanol in presence of homogeneous acid catalyst (Mazzotti et
al. and Ronnback et al., (1997)) was studied. The synthesis of ethyl acetate and water from
ethanol and acetic acid on a commercial polystyrene-divinylbenzene acidic resin is considered.
The chromatographic reactor exhibits a rather rich dynamical behavior, which is a consequence
of the dual role, as a catalyst and as a selective sorbent, played by the resin. The esterification
kinetics was studied with isothermal batch an experiment at 300-600C and catalyst concentration
was varied between 0.05 and 10.0 wt%. The experiments revealed that besides the main reaction,

16
the esterification of acetic acid, a side reaction appeared. Tzong Liu et al. (2001) was determined
the kinetic data on the esterification of propionic acid with n-butanol catalyzed by Amberlyst
15, Amberlyst 35, Amberlyst 39, and HZSM-5 pellets and at the temperatures from 353 to 383
K in a stirred batch reactor. The data indicated that the Amberlyst series resins were all effective
to carry out this esterification. The activation energy of the forward reaction was found to be
14.1 kcal/mol and, kinetic model devlopedaccording Rideal-Eley theory. Also he has found that
activity-based equilibrium constant increase slightly with an increase in temperature.
the esterification of acetic acid with isobutanol under uncatalyzed and heterogeneously catalyzed
reactions condition using a stirred batch reactor in dioxane has been addressed. The equilibrium
constant, which is independent of temperature ranging from 318 to 368 K, was found to be 4. It
was also studied as excess of glycol diacetate (Shlechter et al. and Ince, 2002) equivalent to the
amount which would be present in an extract layer from a liquid extractton column, using
butylene glycol diacetate as a solvent for the recovery of glycol. (Gangadwala et al., Gelosa et al.
and Altokka et al. (2003)) were reported esterification of acetic acid with butanol and glycerol
with acetic acid and acetic acid with isobutanol in the presence of amberlyst catalyst
respectively. Pseudohomogeneous, Eley-Rideal, Langmuir-Hinshelwood-Hougen-Watson
(LHHW), and modified LHHW models were developed. The kinetics for the side-reaction
etherification was also investigated. The equilibrium constant, which is independent of
temperature ranging from 318 to 368 K, was found to be 4. Reactive chromatography is an
attractive method for chemical synthesis because chemical reactions and product separation
occur simultaneously in the same unit. In this work, the synthesis of triacetine, starting from
glycerol and acetic acid, using reactive chromatography on acidic polymeric resins is
investigated. The obtained data was compared with the predictions of a mathematical model,

17
which kinetic and equilibrium parameters were estimated from the batch experiments mentioned
above. Teo et al. and Kirumakki et al. (2004) have studied on esterification of acetic acid with
isoamyl alcohol and benzyl alcohol over heterogeneous catalysed as zeolites H, HY and HZSM5
were studied in this report. The equilibrium conversion of acetic acid was found to increase
slightly with an increase in temperature from 333 to 363 K and also it increased appreciably with
an excess of isoamyl alcohol in the reacting system. The pore architecture seems to influence the
product selectivity.
The reaction kinetics of the reversible liquid-phase esterification of acetic acid
with 1-butanol was investigated at temperatures between 353.15 and 393.15 K using sulfuric
acid as catalyst. Different thermodynamic models are compared: NRTL, UNIQUAC, and PC-
SAFT. The weight-based activity of the heterogeneous catalysts decreases in the following order:
Smopex-101 > Amberlyst 15 > sulphated ZrO2 > H-USY-20 > H-BETA-12.5 > H-MOR-45 >
Nb2O5 > H-ZSM-5-12.5. The low activity of ZSM-5 is a result the influence of the Si/Al ratio
Grob et al. and Peters et al. (2006). Liquid-phase esterification of acetic acid with isobutanol
catalyzed by ion-exchange resins and manganese nodule leached residue was explained (Izci et
al. Das et al. and parida (2007)). As a result, it was found that the weight-based activity of the
heterogeneous catalysts increases in the following order: Dowex 50 Wx2 > Amberlite IR- 120
and these catalysts were effectively for the synthesis of isobutyl acetate under these experimental
conditions (Izci et al. Das et al. and parida (2007)). Water-washed manganese nodule leached
residue (WMNLR) calcined at 400 ◦C shows highest catalytic activity with 76.6% conversion
having 100% selectivity towards n-butyl acetate.
Schmid et al. (2008) was studied on esterification of ethylene glycol with acetic
acid catalyzed by amberlyst 36 and has found the reaction kinetics and the chemical equilibrium

18
at various temperatures, range from 333.15 to 363.15 K and starting compositions. Liao et al.
(2009) was presented review on triacetylglycerol with glycerol by two steps such as
esterification and acetylation. A two-step method is proposed to obtain high selectivity and high
conversion rate for producing additive triacetylglycerol of biofuel from its byproduct glycerol.
Amberlyst-35 was found to be an excellent catalyst. The optimal conditions are temperature of
105 °C and an acetic acid to glycerol molar ratio of 9:1 with 0.5 g catalyst. After the 4 hour
reaction of the optimal condition, the selectivity of triacetylglycerol reaches almost 100% in 15
min by adding thereto acid anhydride.

CHAPTER 3
THE PRESENT WORKS
AND APPLIED REACTION MECHANISM

19
THE PRESENT WORKS AND
APPLIED REACTION MECHANISM
3.1 Present works
The esterification reaction is widely used in the chemical reaction process to form ester.
Esterification reaction is generally carried out between alcohol and carboxylic acid with or
without presence of acid catalyst. There are many work has been done previous with different
alcohol and acetic acid reaction system to form value added products, but ethylene glycol and
acetic acid reaction system has been found limited work in few literature . However the valuable
products as ethylene glycol mono and di-acetate obtained from ethylene glycol and acetic acid
reaction system, which is used as different application in many chemical and other industries.
Present work is an esterification of ethylene glycol with acetic acid in the presence of
SERALITE SRC-120 and molecular sieve 13X as catalysts. The aim of present work to analyzes
the effect of amount of catalyst loading, reactant molar ratio and reaction temperature on the
product selectivity and reactant conversion. However some simulation work also has been done
to obtain the value of chemical equilibrium constant, activation energy and rate of reaction. The
equilibrium constant K1, K-1, K2 and K-2 has been calculated based on mole fraction and also
determined the percentage selectivity and conversion of product and reactant respectively.
3.2 Reaction Mechanism
Acetic acid reacts with ethylene glycol in the presence of ion-exchange resin as a catalyst to
produce the ester as ethylene glycol mono and di-acetate. Esterification reaction is very slow at
without catalyst and it is also a type of reversible reaction. Due to reverse reaction it produce

20
excess amount of water during reaction and the water reduces formation of ester as a products.
This reverse reaction is following as hydrolysis reaction.
The experimental reaction was carried out in generally following two steps, first the
reaction between ethylene glycol and acetic acid over acid catalyst and formation of ethylene
glycol mono-acetate, second following consecutive step is ethylene glycol mono-acetate to
ethylene glycol di-acetate. This reaction mechanism can be understood with help scheme 1. The
equilibrium constant K1, K-1, K2 and K-2 has been calculated in mole fraction basis and also
determined the percentage selectivity and conversion of product and reactant respectively.
C2H6O2 + C2H4O2 C4H8O3 + H2O ...........I
C4H8O3 + C2H4O2 C6H10O4 + H2O ..........II
Scheme 1
����� �� ������ � �� ��������� … … … … … … … … … ���
������� ���������� � ������������ … … … … … … . … . ��
Arrhenius equation:
� ���� ���
For equation III:
Rate of forward reaction = K� [CEG] [CHAC]
Rate of reverse reaction = K�� [CEGMA] [CH�O]
For equation IV:
Rate of forward reaction = K� [CEGMA] [CHAC]
Rate of reverse reaction = K�� [CEGDA] [CH�O]

CHAPTER 4
EXPERIMENTAL SETUP

4.1 Experimental Apparatus and gas
Figure. 4.1. Experimental setup,
21
EXPERIMENTAL SETUP
and gas-liquid chromatograph
1. Experimental setup, gas-liquid chromatography and chemicals
EXPERIMENTAL SETUP

22
4.2 Chemicals and catalyst material
Ethylene glycol and acetic acid (aldehyde free) were purchased from Merck Specialisties Pvt.
ltd. Mumbai (India). The conversion of ethylene glycol with acetic acid was catalysed in the
presence ion-exchange resin SERALITE SRC-120 and Molecular Sieve 13x purified from Sisco
Research Laboratories Pvt Ltd Mumbai (India). The final product ethylene glycol mono acetate
and di-acetate has been analyzed by liquid-gas chromatograph. The average pore diameter of
Molecular sieve 13x with 10 A0 and SERALITE SRC-120 with 8% crosslinking have been used
in experiment.
4.3 Physical and chemical properties[6]
Component
Property
Ethylene
glycol
Acetic acid Ethylene glycol
mono-acetate
Ethylene glycol
di-acetate
Formula C2H6O2 C2H4O2 CH3COOCH2CH2O
H
CH3COOCH2CH2
OOCCH3
Physical
state Clear liquid Clear liquid Clear liquid Clear liquid
Molecular
weight 62.07 60.05 104.11 146.14
Boiling
point (0C) 195 118 186 - 189 186 - 191
Specific
gravity
1.115
1.049 1.15 1.20
Flash point
(0C) 111 39 102 82
Stability
Stable under
ordinary
conditions
Stable under
ordinary
conditions
Stable under
ordinary condition
Stable under
ordinary
conditions

23
4.4 Catalyst property[7]
Name of
catalyst
Physically Loss on
drying
Ionic
form
pH range Particle
size
Cross
linking
SERALITE
SRC-120
Standard
grade
Yellow-
brown
resinous
beads
Max 45-
50% H+ 0-14 20-50mesh 8%
Molecular Sieve 13X[8]
Physically Pale brown granules or pellets,
Normal pore diameter 9 A0 (0.9 micron)
Type of crystal structure Hexagonal
Bulk density 680 g/l
Equilibrium water capacity at 20 C./55 % R.H. 25 % wt.
Water content 1.5% wt. (max.)
Heat of adsorption 4200 KJ/Kg water (max.)
Specific heat (approx.) 1.07 KJ/Kg 0C
Pellets Size Normal 1.5mm 3mm
Beads sizes normal 1.5 mm 3 mm
4.5 Procedure
All kinetic experiments have been carried out in a three necked glass reactor with a volume of
250 cm3. Experimental setup has consists of magnetic stirrer, condenser, temperature sensor and
thermometer. To maintain the preselected constant temperature within ±0.2 K the reactor is
equipped with temperature controller with sensor. Magnetic stirrer and temperature controller are
equipped together. However magnetic stirrer has used to well mix-up the reactant mixture during
reaction process and temperature controller has to maintain the temperature at constant.
Temperature sensor is applied for set the temperature with help of thermometer, which is deep
24
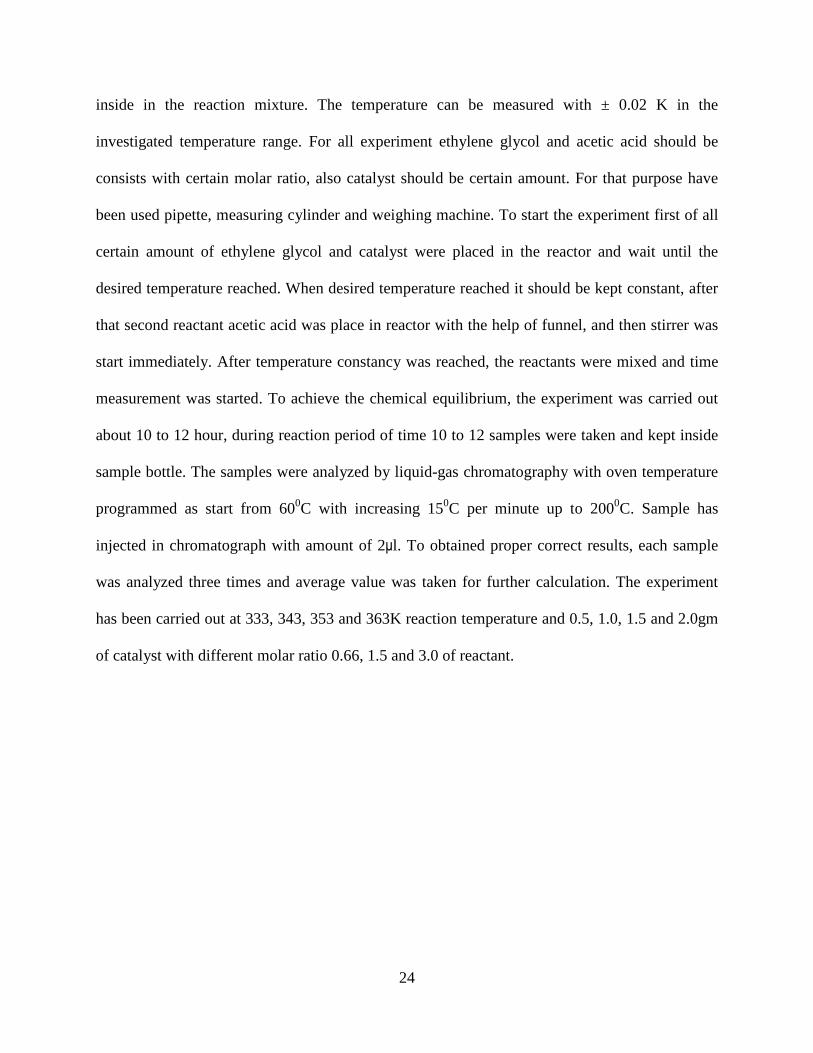
inside in the reaction mixture. The temperature can be measured with ± 0.02 K in the
investigated temperature range. For all experiment ethylene glycol and acetic acid should be
consists with certain molar ratio, also catalyst should be certain amount. For that purpose have
been used pipette, measuring cylinder and weighing machine. To start the experiment first of all
certain amount of ethylene glycol and catalyst were placed in the reactor and wait until the
desired temperature reached. When desired temperature reached it should be kept constant, after
that second reactant acetic acid was place in reactor with the help of funnel, and then stirrer was
start immediately. After temperature constancy was reached, the reactants were mixed and time
measurement was started. To achieve the chemical equilibrium, the experiment was carried out
about 10 to 12 hour, during reaction period of time 10 to 12 samples were taken and kept inside
sample bottle. The samples were analyzed by liquid-gas chromatography with oven temperature
programmed as start from 600C with increasing 150C per minute up to 2000C. Sample has
injected in chromatograph with amount of 2µl. To obtained proper correct results, each sample
was analyzed three times and average value was taken for further calculation. The experiment
has been carried out at 333, 343, 353 and 363K reaction temperature and 0.5, 1.0, 1.5 and 2.0gm
of catalyst with different molar ratio 0.66, 1.5 and 3.0 of reactant.

CHAPTER 5
RESULTS
25
RESULTS
5.1 Observation table on different catalyst loading, reaction temperature and
molar ratio with reaction time:
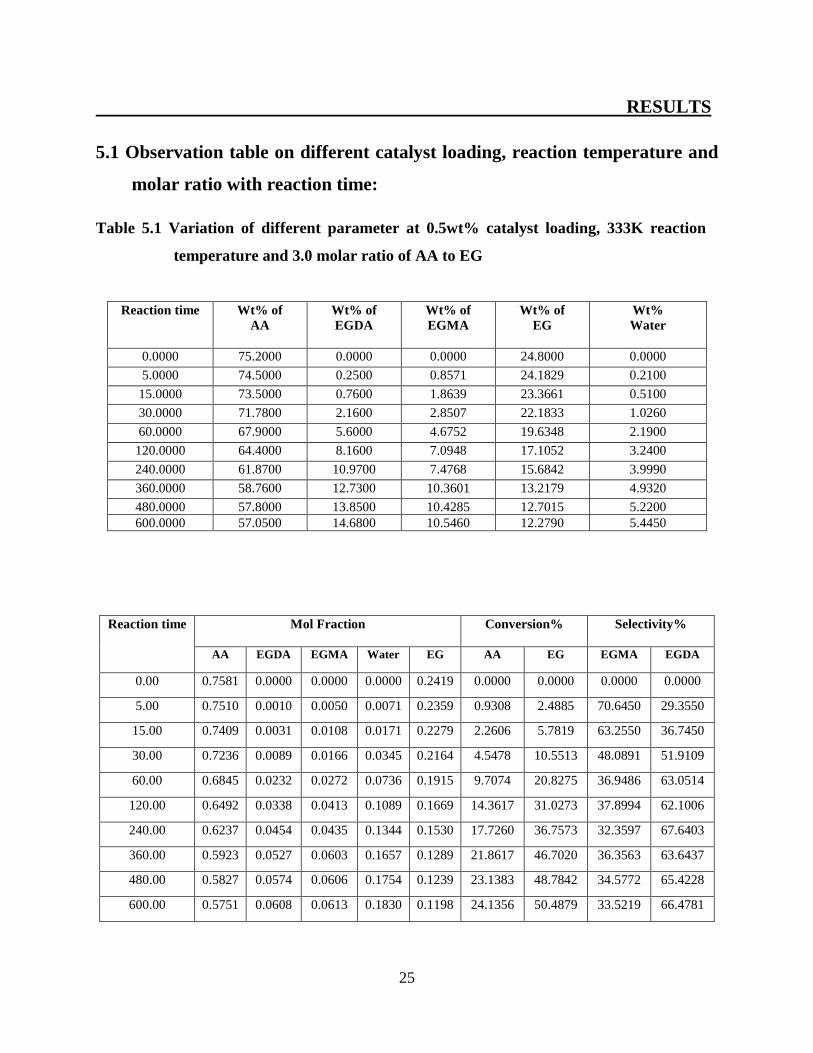
Table 5.1 Variation of different parameter at 0.5wt% catalyst loading, 333K reaction
temperature and 3.0 molar ratio of AA to EG
Reaction time Wt% of AA
Wt% of EGDA
Wt% of EGMA
Wt% of EG
Wt% Water
0.0000 75.2000 0.0000 0.0000 24.8000 0.0000
5.0000 74.5000 0.2500 0.8571 24.1829 0.2100
15.0000 73.5000 0.7600 1.8639 23.3661 0.5100
30.0000 71.7800 2.1600 2.8507 22.1833 1.0260
60.0000 67.9000 5.6000 4.6752 19.6348 2.1900
120.0000 64.4000 8.1600 7.0948 17.1052 3.2400
240.0000 61.8700 10.9700 7.4768 15.6842 3.9990
360.0000 58.7600 12.7300 10.3601 13.2179 4.9320
480.0000 57.8000 13.8500 10.4285 12.7015 5.2200 600.0000 57.0500 14.6800 10.5460 12.2790 5.4450
Reaction time Mol Fraction Conversion%
Selectivity%
AA EGDA EGMA Water EG AA EG EGMA EGDA
0.00 0.7581 0.0000 0.0000 0.0000 0.2419 0.0000 0.0000 0.0000 0.0000
5.00 0.7510 0.0010 0.0050 0.0071 0.2359 0.9308 2.4885 70.6450 29.3550
15.00 0.7409 0.0031 0.0108 0.0171 0.2279 2.2606 5.7819 63.2550 36.7450
30.00 0.7236 0.0089 0.0166 0.0345 0.2164 4.5478 10.5513 48.0891 51.9109
60.00 0.6845 0.0232 0.0272 0.0736 0.1915 9.7074 20.8275 36.9486 63.0514
120.00 0.6492 0.0338 0.0413 0.1089 0.1669 14.3617 31.0273 37.8994 62.1006
240.00 0.6237 0.0454 0.0435 0.1344 0.1530 17.7260 36.7573 32.3597 67.6403
360.00 0.5923 0.0527 0.0603 0.1657 0.1289 21.8617 46.7020 36.3563 63.6437
480.00 0.5827 0.0574 0.0606 0.1754 0.1239 23.1383 48.7842 34.5772 65.4228
600.00 0.5751 0.0608 0.0613 0.1830 0.1198 24.1356 50.4879 33.5219 66.4781

26
Table 5.2 Variation of different parameter at 0.5wt% catalyst loading, 343K reaction
temperature and 3.0 molar ratio of AA to EG
Reaction time Mol Fraction
Conversion% Selectivity%
AA EGDA EGMA Water EG AA EG EGMA EGDA
0.00 0.7581 0.0000 0.0000 0.0000 0.2419 0.0000 0.0000 0.0000 0.0000
5.00 0.7434 0.0027 0.0092 0.0146 0.2300 1.9282 4.9286 63.1549 36.8451
15.00 0.7324 0.0056 0.0144 0.0257 0.2219 3.3909 8.2961 56.1640 43.8360
30.00 0.7147 0.0126 0.0182 0.0433 0.2111 5.7181 12.7282 42.0832 57.9168
60.00 0.6559 0.0311 0.0400 0.1021 0.1709 13.4707 29.3658 39.1471 60.8529
120.00 0.6290 0.0405 0.0481 0.1290 0.1534 17.0213 36.6038 37.2645 62.7355
240.00 0.5938 0.0529 0.0586 0.1643 0.1305 21.6755 46.0673 35.6584 64.3416
360.00 0.5703 0.0579 0.0720 0.1878 0.1120 24.7739 53.6866 38.3230 61.6770
480.00 0.5531 0.0642 0.0766 0.2049 0.1012 27.0346 58.1843 37.3757 62.6243
600.00 0.5464 0.0684 0.0748 0.2117 0.0987 27.9255 59.2122 35.3424 64.6576
Reaction time Wt% of AA
Wt% of EGDA
Wt% of EGMA
Wt% of EG
Wt% Water
0.00 75.20 0.00 0.00 24.80 0.00
5.00 73.75 0.65 1.59 23.58 0.44
15.00 72.65 1.36 2.48 22.74 0.77
30.00 70.90 3.03 3.14 21.64 1.29
60.00 65.07 7.50 6.87 17.52 3.04
120.00 62.40 9.77 8.27 15.72 3.84
240.00 58.90 12.76 10.07 13.38 4.89
360.00 56.57 13.98 12.38 11.49 5.59
480.00 54.87 15.49 13.17 10.37 6.10
600.00 54.20 16.52 12.86 10.12 6.30

27
Table 5.3. Variation of different parameter at 0.5wt% catalyst loading and 353K
reaction temperature
Reaction time Wt% of AA
Wt% of EGDA
Wt% of EGMA
Wt% of EG
Wt% Water
0.0000 75.2000 0.0000 0.0000 24.8000 0.0000
5.0000 72.7500 1.2000 2.5370 22.7779 0.7350
15.0000 71.3400 2.2000 3.5564 21.7456 1.1580
30.0000 67.5500 5.4000 5.5668 19.1882 2.2950
60.0000 63.6300 8.8900 7.3894 16.6196 3.4710
120.0000 61.1200 10.9200 8.8480 14.8879 4.2240
240.0000 57.9600 13.8000 10.2224 12.8456 5.1720
360.0000 55.3400 15.1500 12.8404 10.7116 5.9580
480.0000 53.7000 16.7500 13.4036 9.6964 6.4500
600.0000 52.3100 17.5000 14.7445 8.5785 6.8670
Reaction time
Mol Fraction
Conversion% Selectivity%
AA EGDA EGMA Water EG AA EG EGMA EGDA
0.0000 0.7581 0.0000 0.0000 0.0000 0.2419 0.0000 0.0000 0.0000 0.0000
5.0000 0.7334 0.0050 0.0148 0.0247 0.2222 3.2580 8.1535 59.7425 40.2575
15.0000 0.7192 0.0091 0.0207 0.0389 0.2121 5.1330 12.3161 53.1547 46.8453
30.0000 0.6809 0.0224 0.0324 0.0771 0.1872 10.1728 22.6283 41.9821 58.0179
60.0000 0.6414 0.0368 0.0430 0.1166 0.1621 15.3856 32.9856 36.8465 63.1535
120.0000 0.6161 0.0452 0.0515 0.1419 0.1452 18.7234 39.9680 36.2546 63.7454
240.0000 0.5843 0.0572 0.0595 0.1738 0.1253 22.9255 48.2031 34.2084 65.7916
360.0000 0.5579 0.0628 0.0747 0.2002 0.1045 26.4096 56.8081 37.3008 62.6992
480.0000 0.5413 0.0694 0.0780 0.2167 0.0946 28.5904 60.9017 35.9668 64.0332
600.0000 0.5273 0.0725 0.0858 0.2307 0.0837 30.4388 65.4092 37.1622 62.8378

28
Table 5.4. Variation of different parameter at 0.5wt% catalyst loading and 363K
reaction temperature
Reaction time Wt% of AA
Wt% of EGDA
Wt% of EGMA
Wt% of EG
Wt% of Water
0.0000 75.2000 0.0000 0.0000 24.8000 0.0000
5.0000 71.5800 2.4000 2.8555 22.0785 1.0860
15.0000 69.0400 4.5000 4.2663 20.3456 1.8480
30.0000 65.2500 7.3500 6.7754 17.6396 2.9850
60.0000 60.7500 10.9800 9.4039 14.5311 4.3350
120.0000 58.0000 13.2800 10.8938 12.6661 5.1600
240.0000 56.5800 14.5900 11.4889 11.7551 5.5860
360.0000 53.8100 16.3600 13.7686 9.6444 6.4170
480.0000 52.7000 17.5200 14.0400 8.9900 6.7500
600.0000 50.6900 18.5000 16.1278 7.3292 7.3530
Reaction time
Mol Fraction
Conversion% Selectivity%
AA EGDA EGMA Water EG AA EG EGMA EGDA
0.0000 0.7581 0.0000 0.0000 0.0000 0.2419 0.0000 0.0000 0.0000 0.0000
5.0000 0.7216 0.0099 0.0166 0.0365 0.2154 4.8138 10.9737 45.5079 54.4921
15.0000 0.6960 0.0186 0.0248 0.0621 0.1985 8.1915 17.9611 39.9571 60.0429
30.0000 0.6578 0.0304 0.0394 0.1003 0.1721 13.2314 28.8726 39.2853 60.7147
60.0000 0.6124 0.0455 0.0547 0.1457 0.1418 19.2154 41.4069 37.5455 62.4545
120.0000 0.5847 0.0550 0.0634 0.1734 0.1236 22.8723 48.9269 36.5402 63.4598
240.0000 0.5704 0.0604 0.0668 0.1877 0.1147 24.7606 52.6004 35.5972 64.4028
360.0000 0.5424 0.0678 0.0801 0.2156 0.0941 28.4441 61.1112 37.1361 62.8639
480.0000 0.5313 0.0726 0.0817 0.2268 0.0877 29.9202 63.7499 35.9999 64.0001
600.0000 0.5110 0.0766 0.0938 0.2471 0.0715 32.5931 70.4468 37.9621 62.0379

29
Table 5.5. Variation of different parameter at 1.0wt% catalyst loading and 333K reaction temperature
Reaction time Wt% of AA
Wt% of EGDA
Wt% of EGMA
Wt% of EG
Wt% Water
0.0000 75.2000 0.0000 0.0000 24.8000 0.0000
5.0000 73.5800 0.7000 1.8107 23.4233 0.4860
15.0000 72.0800 1.7000 2.9860 22.2979 0.9360
30.0000 70.0000 3.5000 4.0270 20.9130 1.5600
60.0000 63.6500 8.8000 7.4830 16.6020 3.4650
120.0000 59.2700 12.2000 10.2311 13.5198 4.7790
240.0000 55.6000 15.0300 12.5607 10.9293 5.8800
360.0000 51.5400 17.3000 16.3641 7.6979 7.0980
480.0000 50.2000 18.3400 17.2051 6.7549 7.5000
600.0000 49.3600 18.9700 17.7635 6.1544 7.7520
Reaction time
Mol Fraction
Conversion%
Selectivity%
AA EGDA EGMA Water EG AA EG EGMA EGDA
0.0000 0.7581 0.0000 0.0000 0.0000 0.2419 0.0000 0.0000
5.0000 0.7417 0.0029 0.0105 0.0163 0.2285 2.1542 5.5513 64.4846 35.5154
15.0000 0.7266 0.0070 0.0174 0.0315 0.2175 4.1489 10.0890 55.2157 44.7843
30.0000 0.7056 0.0145 0.0234 0.0524 0.2040 6.9149 15.6734 44.6784 55.3216
60.0000 0.6416 0.0365 0.0435 0.1164 0.1620 15.3590 33.0564 37.3776 62.6224
120.0000 0.5975 0.0505 0.0595 0.1606 0.1319 21.1835 45.4845 37.0533 62.9467
240.0000 0.5605 0.0623 0.0730 0.1976 0.1066 26.0638 55.9303 36.9723 63.0277
360.0000 0.5196 0.0717 0.0952 0.2385 0.0751 31.4627 68.9600 39.9020 60.0980
480.0000 0.5060 0.0760 0.1001 0.2520 0.0659 33.2447 72.7625 39.7041 60.2959
600.0000 0.4976 0.0786 0.1033 0.2605 0.0600 34.3617 75.1837 39.6602 60.3398

30
Table 5.6. Variation of different parameter at 1.0wt% catalyst loading and 343K reaction temperature
Reaction time Wt% of AA
Wt% of EGDA
Wt% of EGMA
Wt% of EG
Wt% Water
0.0000 75.2000 0.0000 0.0000 24.8000 0.0000
5.0000 72.5100 1.7000 2.2407 22.7423 0.8070
15.0000 70.2500 3.2000 4.0211 21.0439 1.4850
30.0000 65.5000 7.3000 6.4133 17.8767 2.9100
60.0000 59.9200 12.1000 9.2469 14.1490 4.5840
120.0000 53.9000 14.5000 16.2624 8.9476 6.3900
240.0000 50.8000 16.9300 18.1738 6.7761 7.3200
360.0000 48.1200 19.7800 18.7589 5.2171 8.1240
480.0000 47.6000 20.1000 19.2043 4.8156 8.2800
600.0000 46.8000 21.1000 19.1664 4.4136 8.5200
Reaction time
Mol Fraction
Conversion%
Selectivity%
AA EGDA EGMA Water EG AA EG EGMA EGDA
0.0000 0.7581 0.0000 0.0000 0.0000 0.2419 0.0000 0.0000 0.0000 0.0000
5.0000 0.7309 0.0070 0.0130 0.0271 0.2219 3.5771 8.2973 48.0569 51.9431
15.0000 0.7082 0.0133 0.0234 0.0499 0.2053 6.5824 15.1455 46.8657 53.1343
30.0000 0.6603 0.0302 0.0373 0.0978 0.1744 12.8989 27.9166 38.1442 61.8558
60.0000 0.6040 0.0501 0.0538 0.1540 0.1380 20.3191 42.9474 34.9135 65.0865
120.0000 0.5433 0.0601 0.0946 0.2147 0.0873 28.3244 63.9211 44.0478 55.9522
240.0000 0.5121 0.0701 0.1057 0.2460 0.0661 32.4468 72.6769 42.9710 57.0290
360.0000 0.4851 0.0819 0.1091 0.2730 0.0509 36.0106 78.9634 39.9647 60.0353
480.0000 0.4798 0.0833 0.1117 0.2782 0.0470 36.7021 80.5821 40.1429 59.8571
600.0000 0.4718 0.0874 0.1115 0.2863 0.0431 37.7659 82.2031 38.9349 61.0651

31
Table 5.7. Variation of different parameter at 1.0wt% catalyst loading and 353K reaction temperature
Reaction time Wt% of AA
Wt% of EGDA
Wt% of EGMA
Wt% of EG
Wt% Water
0.0000 75.2000 0.0000 0.0000 24.8000 0.0000
5.0000 71.5000 2.2000 3.2791 21.9109 1.1100
15.0000 70.0000 3.7000 3.7421 20.9979 1.5600
30.0000 63.2000 8.7000 8.4054 16.0945 3.6000
60.0000 59.2000 11.8000 10.9223 13.2776 4.8000
120.0000 52.8000 16.3000 15.6047 8.5753 6.7200
240.0000 49.9000 17.8000 18.4944 6.2156 7.5900
360.0000 47.4000 18.7000 21.5455 4.0144 8.3400
480.0000 46.6000 21.5000 18.9432 4.3768 8.5800
600.0000 46.1000 21.8000 19.3824 3.9876 8.7300
Reaction time
Mol Fraction
Conversion% Selectivity%
AA EGDA EGMA Water EG AA EG EGMA EGDA
0.0000 0.7581 0.0000 0.0000 0.0000 0.2419 0.0000 0.0000 0.0000 0.0000
5.0000 0.7208 0.0091 0.0191 0.0373 0.2138 4.9202 11.6495 51.1289 48.8711
15.0000 0.7056 0.0153 0.0218 0.0524 0.2048 6.9149 15.3310 41.5172 58.4828
30.0000 0.6371 0.0360 0.0489 0.1210 0.1570 15.9574 35.1027 40.4109 59.5891
60.0000 0.5968 0.0489 0.0635 0.1613 0.1295 21.2766 46.4611 39.3835 60.6165
120.0000 0.5323 0.0675 0.0908 0.2258 0.0837 29.7872 65.4223 40.1907 59.8093
240.0000 0.5030 0.0737 0.1076 0.2550 0.0606 33.6436 74.9371 42.1733 57.8267
360.0000 0.4778 0.0775 0.1253 0.2802 0.0392 36.9681 83.8127 44.7127 55.2873
480.0000 0.4698 0.0891 0.1102 0.2883 0.0427 38.0319 82.3515 38.2124 61.7876
600.0000 0.4647 0.0903 0.1127 0.2933 0.0389 38.6968 83.9211 38.4267 61.5733

32
Table 5.8. Variation of different parameter at 1.0wt% catalyst loading and 363K reaction temperature
Reaction time Wt% of AA
Wt% of EGDA
Wt% of EGMA
Wt% of EG
Wt% Water
0.0000 75.2000 0.0000 0.0000 24.8000 0.0000
5.0000 70.5000 3.0000 3.8727 21.2173 1.4100
15.0000 68.5000 4.5000 5.2023 19.7876 2.0100
30.0000 61.7000 10.8000 8.0137 15.4363 4.0500
60.0000 53.2200 15.7800 15.6175 8.7884 6.5940
120.0000 47.6000 18.8000 21.0564 4.2636 8.2800
240.0000 45.3500 20.9000 21.9646 2.8304 8.9550
360.0000 44.0000 21.9300 22.8372 1.8728 9.3600
480.0000 43.7000 22.9000 21.9753 1.9747 9.4500
600.0000 42.9000 23.6000 22.3647 1.4453 9.6900
Reaction time
Mol Fraction
Conversion% Selectivity%
AA EGDA EGMA Water EG AA EG EGMA EGDA
0.0000 0.7581 0.0000 0.0000 0.0000 0.2419 0.0000 0.0000
5.0000 0.7107 0.0124 0.0225 0.0474 0.2070 6.2500 14.4463 47.5369 52.4631
15.0000 0.6905 0.0186 0.0303 0.0675 0.1930 8.9096 20.2111 44.7964 55.2036
30.0000 0.6220 0.0447 0.0466 0.1361 0.1506 17.9521 37.7568 34.2465 65.7535
60.0000 0.5365 0.0654 0.0908 0.2216 0.0857 29.2287 64.5627 40.9924 59.0076
120.0000 0.4798 0.0779 0.1225 0.2782 0.0416 36.7021 82.8081 44.0143 55.9857
240.0000 0.4572 0.0866 0.1277 0.3009 0.0276 39.6941 88.5872 42.4519 57.5481
360.0000 0.4435 0.0909 0.1328 0.3145 0.0183 41.4893 92.4485 42.2286 57.7714
480.0000 0.4405 0.0949 0.1278 0.3175 0.0193 41.8883 92.0376 40.2478 59.7522
600.0000 0.4325 0.0978 0.1301 0.3256 0.0141 42.9521 94.1723 39.9465 60.0535

33
Table 5.9. Variation of different parameter at 1.5wt% catalyst loading and 333K reaction temperature
Reaction time Wt% of AA
Wt% of EGDA
Wt% of EGMA
Wt% of EG
Wt% Water
0.00 75.20 0.00 0.00 24.80 0
5.00 72.01 1.20 3.82 22.01 0.957014
15.00 67.50 4.00 7.65 18.54 2.310014
30.00 65.00 5.30 10.13 16.51 3.060014
60.00 57.40 10.57 15.79 10.90 5.340014
120.00 53.60 14.76 16.41 8.75 6.480014
240.00 51.60 17.30 16.26 7.76 7.080014
360.00 49.50 18.55 18.12 6.12 7.710014
480.00 48.89 19.90 17.25 6.06 7.893014
600.00 47.78 20.60 18.18 5.21 8.226014
Reaction time
Mol Fraction
Conversion% Selectivity%
AA EGDA EGMA Water EG AA EG EGMA EGDA
0.0000 0.7581 0.0000 0.0000 0.0000 0.2419 0.0000 0.0000 0.0000 0.0000
5.0000 0.7259 0.0050 0.0222 0.0322 0.2148 4.2420 11.2368 69.0813 30.9187
15.0000 0.6804 0.0166 0.0445 0.0776 0.1809 10.2393 25.2339 57.3029 42.6971
30.0000 0.6552 0.0220 0.0589 0.1028 0.1611 13.5638 33.4246 57.2924 42.7076
60.0000 0.5786 0.0438 0.0919 0.1794 0.1063 23.6702 56.0673 51.1928 48.8072
120.0000 0.5403 0.0611 0.0954 0.2177 0.0853 28.7234 64.7259 43.8356 56.1644
240.0000 0.5202 0.0717 0.0946 0.2379 0.0757 31.3830 68.7100 39.7492 60.2508
360.0000 0.4990 0.0768 0.1054 0.2591 0.0597 34.1755 75.3196 40.6748 59.3252
480.0000 0.4928 0.0824 0.1003 0.2652 0.0592 34.9867 75.5496 37.8329 62.1672
600.0000 0.4817 0.0853 0.1057 0.2764 0.0509 36.4627 78.9759 38.2512 61.7488

34
Table 5.10. Variation of different parameter at 1.5wt% catalyst loading and 343K reaction temperature
Reaction time
Wt% of AA
Wt% of EGDA
Wt% of EGMA
Wt% of EG
Wt% of Water
0.00 75.20 0.00 0.00 24.80 0.00
5.00 71.50 2.03 3.52 21.84 1.110014
15.00 65.40 6.30 8.01 17.35 2.940014
30.00 63.30 8.38 8.69 16.06 3.570014
60.00 55.30 14.30 14.12 10.31 5.970014
120.00 51.32 17.00 17.17 7.34 7.164014
240.00 48.23 19.47 19.01 5.20 8.091014
360.00 47.02 20.78 19.24 4.51 8.454014
480.00 46.02 21.28 20.26 3.68 8.754014
600.00 45.49 22.10 20.01 3.48 8.913014
Reaction time
Mol Fraction
Conversion%
Selectivity%
AA EGDA EGMA Water EG AA EG EGMA EGDA
0.0000 0.7581 0.0000 0.0000 0.0000 0.2419 0.0000 0.0000 0.0000 0.0000
5.0000 0.7208 0.0084 0.0205 0.0373 0.2130 4.9202 11.9406 54.9054 45.0947
15.0000 0.6593 0.0261 0.0466 0.0988 0.1692 13.0319 30.0456 47.1623 52.8377
30.0000 0.6381 0.0347 0.0505 0.1200 0.1567 15.8244 35.2339 42.1203 57.8797
60.0000 0.5575 0.0592 0.0821 0.2006 0.1006 26.4627 58.4303 40.9375 59.0625
120.0000 0.5173 0.0704 0.0999 0.2407 0.0716 31.7553 70.3903 41.4882 58.5118
240.0000 0.4862 0.0807 0.1106 0.2719 0.0507 35.8643 79.0359 40.6646 59.3354
360.0000 0.4740 0.0861 0.1119 0.2841 0.0439 37.4734 81.8344 39.3915 60.6085
480.0000 0.4639 0.0882 0.1178 0.2942 0.0359 38.8032 85.1449 40.0602 59.9398
600.0000 0.4586 0.0916 0.1164 0.2995 0.0340 39.5080 85.9491 38.8610 61.1390

35
Table 5.11. Variation of different parameter at 1.5wt% catalyst loading and 353K reaction temperature
Reaction time
Wt% of AA
Wt% of EGDA
Wt% of EGMA
Wt% of EG
Wt% Water
0.00 75.82 0.00 0.00 24.18 0.00
5.00 69.90 3.20 4.63 20.68 1.590014
15.00 64.00 7.20 9.16 16.28 3.360014
30.00 61.90 9.21 9.93 14.97 3.990014
60.00 53.97 15.48 14.74 9.44 6.369014
120.00 50.07 18.00 17.91 6.48 7.539014
240.00 46.40 20.30 21.00 3.66 8.640014
360.00 45.60 21.40 20.82 3.30 8.880014
480.00 44.70 22.90 20.24 3.01 9.150014
600.00 43.80 23.50 20.95 2.33 9.420014
Reaction
time
Mol Fraction
Conversion%
Selectivity%
AA EGDA EGMA Water EG AA EG EGMA EGDA
0.0000 0.7520 0.0000 0.0060 0.0060 0.2359 0.0000 0.0000 0.0000 0.0000
5.0000 0.7046 0.0133 0.0269 0.0534 0.2018 7.0478 16.6038 50.3746 49.6254
15.0000 0.6452 0.0298 0.0532 0.1129 0.1589 14.8936 34.3378 47.1623 52.8377
30.0000 0.6240 0.0382 0.0578 0.1341 0.1460 17.6861 39.6460 43.0837 56.9164
60.0000 0.5441 0.0641 0.0858 0.2140 0.0921 28.2314 61.9514 40.0692 59.9308
120.0000 0.5047 0.0746 0.1042 0.2533 0.0632 33.4175 73.8863 41.1280 58.8720
240.0000 0.4677 0.0841 0.1221 0.2903 0.0357 38.2979 85.2396 42.0662 57.9338
360.0000 0.4597 0.0887 0.1211 0.2984 0.0322 39.3617 86.6894 40.5775 59.4225
480.0000 0.4506 0.0949 0.1177 0.3075 0.0293 40.5585 87.8709 38.2888 61.7113
600.0000 0.4415 0.0974 0.1218 0.3165 0.0228 41.7553 90.5935 38.4870 61.5130

36
Table 5.12. Variation of different parameter at 1.5wt% catalyst loading and 363K reaction temperature
Reaction time
Wt% of AA
Wt% of EGDA
Wt% of EGMA
Wt% of EG
Wt% Water
0.00 75.82 0.00 0.00 24.18 0
5.00 68.20 4.50 5.72 19.48 2.100014
15.00 63.03 8.08 9.58 15.66 3.651014
30.00 56.90 11.43 15.44 10.74 5.490014
60.00 49.62 17.00 20.12 5.59 7.674014
120.00 46.00 19.46 22.89 2.89 8.760014
240.00 43.93 20.47 25.04 1.18 9.381014
360.00 43.40 21.73 24.16 1.17 9.540014
480.00 43.00 23.60 22.19 1.55 9.660014
600.00 42.10 24.10 23.04 0.83 9.930014
Reaction
time
Mol Fraction
Conversion%
Selectivity%
AA EGDA EGMA Water EG AA EG EGMA EGDA
0.0000 0.7520 0.0000 0.0060 0.0060 0.2359 0.0000 0.0000 0.0000 0.0000
5.0000 0.6875 0.0186 0.0333 0.0706 0.1900 9.3085 21.4611 47.1623 52.8377
15.0000 0.6354 0.0335 0.0557 0.1227 0.1527 16.1835 36.8726 45.4305 54.5695
30.0000 0.5736 0.0474 0.0898 0.1845 0.1048 24.3351 56.6780 48.6638 51.3362
60.0000 0.5002 0.0704 0.1170 0.2579 0.0545 34.0159 77.4737 45.3768 54.6232
120.0000 0.4637 0.0806 0.1331 0.2944 0.0282 38.8298 88.3447 45.2242 54.7758
240.0000 0.4428 0.0848 0.1456 0.3152 0.0115 41.5824 95.2402 46.1955 53.8045
360.0000 0.4375 0.0900 0.1405 0.3206 0.0114 42.2872 95.2910 43.8356 56.1644
480.0000 0.4335 0.0978 0.1291 0.3246 0.0151 42.8191 93.7556 39.7600 60.2400
600.0000 0.4244 0.0998 0.1340 0.3337 0.0081 44.0159 96.6495 40.1564 59.8436

37
Table 5.13. Variation of different parameter at 2.0wt% catalyst loading and 333K reaction temperature
Reaction time Wt% of
AA Wt% of EGDA
Wt% of EGMA
Wt% of EG
Wt% of Water
0.0000 75.2000 0.0000 0.0000 24.8000 0.0000
5.0000 69.5200 3.2100 5.2721 20.2938 1.7040
15.0000 65.5000 5.0400 9.6330 16.9170 2.9100
30.0000 62.3000 7.1600 12.1594 14.5106 3.8700
60.0000 56.1000 11.3700 16.9083 9.8917 5.7300
120.0000 52.9700 14.9300 17.2618 8.1692 6.6690
240.0000 49.5800 19.8600 16.1143 6.7597 7.6860
360.0000 47.3600 20.5500 18.9793 4.7587 8.3520
480.0000 46.2000 20.9000 20.4913 3.7087 8.7000
600.0000 45.3700 21.6300 20.8900 3.1610 8.9490
Reaction time
Mol Fraction
Conversion% Selectivity%
AA EGDA EGMA Water EG AA EG EGMA EGDA
0.0000 0.7581 0.0000 0.0000 0.0000 0.2419 0.0000 0.0000 0.0000 0.0000
5.0000 0.7008 0.0133 0.0307 0.0573 0.1980 7.5532 18.1700 53.5499 46.4501
15.0000 0.6603 0.0209 0.0560 0.0978 0.1650 12.8989 31.7864 57.2941 42.7059
30.0000 0.6280 0.0297 0.0707 0.1300 0.1416 17.1542 41.4896 54.3803 45.6197
60.0000 0.5655 0.0471 0.0983 0.1925 0.0965 25.3989 60.1141 51.0722 48.9278
120.0000 0.5340 0.0619 0.1004 0.2241 0.0797 29.5612 67.0598 44.7987 55.2013
240.0000 0.4998 0.0823 0.0937 0.2583 0.0659 34.0691 72.7431 36.2869 63.7131
360.0000 0.4774 0.0851 0.1104 0.2806 0.0464 37.0213 80.8116 39.3304 60.6696
480.0000 0.4657 0.0866 0.1192 0.2923 0.0362 38.5638 85.0456 40.7652 59.2348
600.0000 0.4574 0.0896 0.1215 0.3007 0.0308 39.6675 87.2539 40.4020 59.5980

38
Table 5.14. Variation of different parameter at 2.0wt% catalyst loading and 343K reaction temperature
Reaction time Wt% of
AA Wt% of EGDA
Wt% of EGMA
Wt% of EG
Wt% of Water
0.0000 75.2000 0.0000 0.0000 24.8000 0.0000
5.0000 67.8500 4.3500 6.5427 19.0523 2.2050
15.0000 64.0800 6.8100 9.5727 16.2013 3.3360
30.0000 60.6400 9.6700 11.4609 13.8611 4.3680
60.0000 53.8700 15.6600 14.6618 9.4092 6.3990
120.0000 50.8900 17.6400 17.0063 7.1706 7.2930
240.0000 47.8300 20.9900 17.5377 5.4312 8.2110
360.0000 45.6600 21.5700 20.4728 3.4352 8.8620
480.0000 44.1900 22.3800 21.8668 2.2602 9.3030
600.0000 43.1200 23.0500 22.7669 1.4390 9.6240
Reaction time
Mol Fraction
Conversion%
Selectivity%
AA EGDA EGMA Water EG AA EG EGMA EGDA
0.0000 0.7581 0.0000 0.0000 0.0000 0.2419 0.0000 0.0000
5.0000 0.6840 0.0180 0.0381 0.0741 0.1859 9.7739 23.1763 51.3558 48.6442
15.0000 0.6460 0.0282 0.0557 0.1121 0.1581 14.7872 34.6723 49.6648 50.3352
30.0000 0.6113 0.0401 0.0667 0.1468 0.1352 19.3617 44.1084 45.4124 54.5876
60.0000 0.5430 0.0649 0.0853 0.2150 0.0918 28.3643 62.0598 39.6566 60.3434
120.0000 0.5130 0.0731 0.0989 0.2451 0.0700 32.3271 71.0861 40.3593 59.6407
240.0000 0.4822 0.0870 0.1020 0.2759 0.0530 36.3963 78.0998 36.9672 63.0328
360.0000 0.4603 0.0894 0.1191 0.2978 0.0335 39.2819 86.1483 39.9838 60.0162
480.0000 0.4455 0.0927 0.1272 0.3126 0.0220 41.2367 90.8863 40.6819 59.3181
600.0000 0.4347 0.0955 0.1324 0.3234 0.0140 42.6596 94.1974 40.9438 59.0562

39
Table 5.15. Variation of different parameter at 2.0wt% catalyst loading and 353K reaction temperature
Reaction time Wt% of
AA Wt% of EGDA
Wt% of EGMA
Wt% of EG
Wt% of Water
0.0000 75.8200 0.0000 0.0000 24.1800 0.0000
5.0000 67.3500 4.8300 6.7255 18.7394 2.3550
15.0000 63.0800 7.6600 10.0951 15.5289 3.6360
30.0000 59.4800 11.2100 11.2776 13.3164 4.7160
60.0000 52.6700 16.7100 15.2459 8.6150 6.7590
120.0000 48.9500 19.2300 18.1038 5.8412 7.8750
240.0000 46.8300 21.2500 18.9007 4.5083 8.5110
360.0000 43.6600 23.3400 21.4178 2.1202 9.4620
480.0000 42.0900 24.9000 21.9167 1.1603 9.9330
600.0000 41.0000 25.0800 23.5496 0.1104 10.2600
Reaction time
Mol Fraction
Conversion%
Selectivity%
AA EGDA EGMA Water EG AA EG EGMA EGDA
0.0000 0.7520 0.0000 0.0060 0.0060 0.2359 0.0000 0.0000 0.0000 0.0000
5.0000 0.6789 0.0200 0.0391 0.0791 0.1828 10.4388 24.4377 49.4284 50.5716
15.0000 0.6359 0.0317 0.0587 0.1222 0.1515 16.1170 37.3835 48.0536 51.9464
30.0000 0.5996 0.0464 0.0656 0.1585 0.1299 20.9042 46.3047 41.3886 58.6114
60.0000 0.5309 0.0692 0.0887 0.2271 0.0840 29.9601 65.2619 39.0401 60.9599
120.0000 0.4934 0.0797 0.1053 0.2646 0.0570 34.9069 76.4468 39.7886 60.2114
240.0000 0.4721 0.0880 0.1099 0.2860 0.0440 37.7260 81.8213 38.4358 61.5642
360.0000 0.4401 0.0967 0.1246 0.3179 0.0207 41.9415 91.4508 39.1770 60.8230
480.0000 0.4243 0.1032 0.1275 0.3338 0.0113 44.0292 95.3213 38.1886 61.8114
600.0000 0.4133 0.1039 0.1370 0.3448 0.0011 45.4787 99.5547 39.7260 60.2740

40
Table 5.16. Variation of different parameter at 2.0wt% catalyst loading and 363K reaction temperature
Reaction time Wt% of
AA Wt% of EGDA
Wt% of EGMA
Wt% of EG
Wt% Water
0.0000 75.7200 0.0000 0.0000 24.2834 0.0000
5.0000 66.5200 5.0800 7.8080 17.9879 2.6040
15.0000 61.6800 7.9300 12.1371 14.1969 4.0560
30.0000 57.8500 10.2600 15.4563 11.2287 5.2050
60.0000 49.5300 15.8200 21.9565 4.9924 7.7010
120.0000 46.0900 18.4500 24.1724 2.5546 8.7330
240.0000 44.1100 19.8600 25.5956 1.1074 9.3270
360.0000 42.9000 21.1000 25.9264 0.3836 9.6900
480.0000 41.1100 25.4100 22.8888 0.3642 10.2270
600.0000 39.8800 27.7500 21.6871 0.0869 10.5960
Reaction time
Mol Fraction
Conversion%
Selectivity%
AA EGDA EGMA Water EG AA EG EGMA EGDA
0.0000 0.7530 0.0000 0.0050 0.0050 0.2369 0.0000 0.0000 0.0000 0.0000
5.0000 0.6706 0.0210 0.0454 0.0875 0.1755 11.5425 27.4680 51.8969 48.1031
15.0000 0.6218 0.0329 0.0706 0.1363 0.1385 17.9787 42.7545 51.7913 48.2087
30.0000 0.5832 0.0425 0.0899 0.1749 0.1095 23.0718 54.7231 51.3955 48.6045
60.0000 0.4993 0.0655 0.1277 0.2588 0.0487 34.1356 79.8692 49.3465 50.6535
120.0000 0.4646 0.0764 0.1406 0.2934 0.0249 38.7101 89.6991 47.9066 52.0934
240.0000 0.4447 0.0823 0.1489 0.3134 0.0108 41.3431 95.5347 47.4966 52.5034
360.0000 0.4325 0.0874 0.1508 0.3256 0.0037 42.9521 98.4531 46.3081 53.6919
480.0000 0.4144 0.1053 0.1331 0.3436 0.0036 45.3324 98.5313 38.7359 61.2641
600.0000 0.4020 0.1150 0.1261 0.3560 0.0008 46.9681 99.6495 35.4240 64.5760

41
Table 5.17. Variation of different parameter at 2.0wt% catalyst loading, 333K reaction temperature and 1.5 molar ratio of AA to EG
Reaction time
Wt% of AA
Wt% of EGDA
Wt% of EGMA
Wt% of EG
Wt% Water
0.0000 58.8785 0.0000 0.0000 41.1215 0.0000
5.0000 55.8100 0.2000 5.0338 38.0357 0.9206
15.0000 51.9000 2.5000 8.5344 34.9720 2.0936
30.0000 47.6000 7.6000 8.7220 32.6945 3.3836
60.0000 43.4300 8.6000 14.5253 28.8101 4.6346
120.0000 38.4300 9.6000 21.7673 24.0681 6.1346
240.0000 36.6000 10.7000 23.3722 22.6442 6.6836
360.0000 35.7000 11.3000 24.0774 21.9690 6.9536
480.0000 34.0690 12.0000 25.9072 20.5809 7.4429
600.0000 33.1800 12.6000 26.5933 19.9171 7.7096
Reaction time
Mol Fraction
Conversion%
Selectivity%
AA EGDA EGMA Water EG AA EG EGMA EGDA
0.0000 0.5967 0.0000 0.0000 0.0000 0.4033 0.0000 0.0000 0.0000 0.0000
5.0000 0.5656 0.0008 0.0294 0.0311 0.3730 5.2115 7.5042 94.6428 5.3572
15.0000 0.5260 0.0104 0.0499 0.0707 0.3430 11.8523 14.9543 70.5553 8.8189
30.0000 0.4824 0.0317 0.0510 0.1143 0.3207 19.1555 20.4930 44.6151 22.6325
60.0000 0.4401 0.0358 0.0849 0.1566 0.2826 26.2379 29.9390 54.2447 22.2490
120.0000 0.3895 0.0400 0.1273 0.2072 0.2360 34.7300 41.4707 61.4132 21.4588
240.0000 0.3709 0.0446 0.1367 0.2258 0.2221 37.8381 44.9333 60.5246 22.7837
360.0000 0.3618 0.0471 0.1408 0.2349 0.2155 39.3666 46.5753 59.9298 23.5131
480.0000 0.3453 0.0500 0.1515 0.2514 0.2018 42.1368 49.9509 60.2450 23.9795
600.0000 0.3363 0.0525 0.1555 0.2604 0.1953 43.6466 51.5653 59.7013 24.6458

42
Table 5.18. Variation of different parameter at 2.0wt% catalyst loading, 333K reaction
temperature and 0.66 molar ratio of AA to EG
Reaction time Wt% of
AA Wt% of EGDA
Wt% of EGMA
Wt% of EG
Wt% of Water
0.00 38.89 0.00 0.00 61.11 0
5.00 36.50 0.72 3.11 58.95 0.71672
15.00 35.24 1.36 4.39 57.92 1.09472
30.00 33.50 3.41 4.48 56.99 1.61672
60.00 28.40 6.20 9.35 52.91 3.14672
120.00 22.30 11.00 13.08 48.64 4.97672
240.00 21.00 13.23 12.16 48.24 5.36672
360.00 19.60 16.00 10.64 47.97 5.78672
480.00 17.20 18.30 11.52 46.47 6.50672
600.00 16.40 19.70 10.91 46.24 6.74672
Reaction time
Mol Fraction Conversion% Selectivity%
AA EGDA EGMA Water EG AA EG EGMA EGDA
0.0000 0.3967 0.0000 0.0000 0.0000 0.6033 0.0000 0.0000 0.0000 0.0000
5.0000 0.3723 0.0030 0.0183 0.0244 0.5819 6.1427 3.5390 8.0302 2.6444
15.0000 0.3595 0.0057 0.0258 0.0372 0.5718 9.3827 5.2248 10.7072 2.7973
30.0000 0.3417 0.0143 0.0264 0.0550 0.5626 13.8570 6.7424 10.1901 6.7212
60.0000 0.2897 0.0260 0.0550 0.1070 0.5223 26.9713 13.4273 17.6942 10.8887
120.0000 0.2275 0.0461 0.0770 0.1692 0.4802 42.6570 20.4064 20.6343 17.0909
240.0000 0.2142 0.0555 0.0716 0.1825 0.4763 45.9999 21.0549 18.5193 20.0627
360.0000 0.1999 0.0671 0.0626 0.1968 0.4736 49.5999 21.4973 15.6272 23.6523
480.0000 0.1755 0.0767 0.0678 0.2212 0.4588 55.7714 23.9573 15.9500 25.9329
600.0000 0.1673 0.0826 0.0642 0.2294 0.4565 57.8285 24.3371 14.8241 27.5371

43
Table 5.19. Comparison of experimental data with simulated data at 0.5wt% catalyst
loading and temperature at 333K
Reaction time
Experimental
Concentration, kmol/m3
Simulation Concentration, kmol/m3
EG
AA
EGMA
EGDA
Water EG AA EGMA EGDA Water
0 4 12.5333 0 0 0 4 12.533 0 0 0
5 3.9005 12.4167 0.0824 0.0171 0.1167 3.955 12.486 0.043 0.002 0.047
10 3.8346 12.3333 0.1308 0.0346 0.2 3.911 12.435 0.081 0.008 0.098
15 3.7687 12.25 0.1792 0.0521 0.2833 3.867 12.382 0.115 0.018 0.151
20 3.7051 12.1544 0.2109 0.084 0.3789 3.824 12.327 0.146 0.03 0.206
25 3.6415 12.0589 0.2425 0.116 0.4744 3.782 12.269 0.173 0.045 0.264
30 3.5779 11.9633 0.2741 0.148 0.57 3.74 12.211 0.197 0.063 0.322
35 3.5094 11.8556 0.3033 0.1872 0.6778 3.699 12.151 0.219 0.082 0.382
40 3.4409 11.7478 0.3326 0.2265 0.7856 3.659 12.09 0.238 0.103 0.443
45 3.3724 11.64 0.3618 0.2658 0.8933 3.62 12.028 0.255 0.125 0.505
50 3.3039 11.5322 0.3911 0.305 1.0011 3.581 11.966 0.271 0.148 0.567
55 3.2354 11.4244 0.4203 0.3443 1.1089 3.543 11.904 0.285 0.172 0.629
60 3.1669 11.3167 0.4495 0.3836 1.2167 3.506 11.842 0.298 0.196 0.691
65 3.1329 11.2681 0.4689 0.3982 1.2653 3.469 11.781 0.31 0.221 0.752
70 3.0989 11.2194 0.4883 0.4128 1.3139 3.433 11.72 0.321 0.246 0.813
75 3.0649 11.1708 0.5077 0.4274 1.3625 3.398 11.659 0.331 0.272 0.874
80 3.0309 11.1222 0.5271 0.442 1.4111 3.363 11.599 0.34 0.297 0.934
85 2.9969 11.0736 0.5465 0.4566 1.4597 3.329 11.54 0.349 0.322 0.993
90 2.9629 11.025 0.5659 0.4712 1.5083 3.295 11.482 0.358 0.347 1.051
95 2.9289 10.9764 0.5853 0.4858 1.5569 3.262 11.424 0.367 0.371 1.109
100 2.8949 10.9278 0.6046 0.5005 1.6056 3.23 11.368 0.375 0.395 1.165
150 2.7016 10.6279 0.6914 0.607 1.9054 2.936 10.863 0.458 0.606 1.67
200 2.6061 10.4522 0.7067 0.6872 2.0811 2.691 10.464 0.55 0.759 2.069
250 2.4966 10.2685 0.742 0.7614 2.2649 2.485 10.151 0.647 0.868 2.382
300 2.3308 10.0525 0.8575 0.8116 2.4808 2.315 9.903 0.741 0.945 2.63
350 2.1651 9.8365 0.9731 0.8619 2.6968 2.173 9.706 0.826 1.001 2.827
400 2.1042 9.74 0.9984 0.8975 2.7933 2.057 9.548 0.901 1.042 2.985
450 2.0695 9.6733 1.0011 0.9295 2.86 1.961 9.421 0.965 1.074 3.112
500 2.0373 9.6125 1.0046 0.9581 2.9208 1.883 9.318 1.02 1.098 3.215
550 2.0089 9.5604 1.0093 0.9818 2.9729 1.819 9.236 1.065 1.116 3.297
600 1.9805 9.5083 1.014 1.0055 3.025 1.767 9.169 1.103 1.131 3.364

44
Table 5.20. Comparison of experimental data with simulated data at 0.5wt% catalyst
loading and temperature at 343K
Reaction time
Experimental
Concentration, kmol/m3
Simulation Concentration, kmol/m3
EG AA EGMA EGDA Water EG AA EGMA EGDA Water
0 4 12.53333 0 0 0 4 12.533 0 0 0
5 3.83428 12.32692 0.12443 0.04129 0.20758 3.907 12.436 0.09 0.003 0.097
10 3.73925 12.20419 0.19174 0.069 0.33032 3.817 12.337 0.171 0.013 0.196
15 3.67195 12.1052 0.23133 0.10068 0.4293 3.729 12.235 0.243 0.028 0.298
20 3.6086 12.01018 0.25905 0.13235 0.52432 3.645 12.131 0.307 0.047 0.402
25 3.53733 11.89932 0.28676 0.17195 0.63518 3.564 12.026 0.365 0.071 0.507
30 3.45814 11.77262 0.33032 0.2155 0.76188 3.486 11.922 0.416 0.098 0.611
35 3.36312 11.63405 0.37387 0.26301 0.90045 3.411 11.817 0.462 0.127 0.716
40 3.26414 11.48756 0.42534 0.31052 1.04695 3.339 11.714 0.503 0.158 0.819
45 3.17308 11.35294 0.47285 0.35407 1.18156 3.27 11.612 0.539 0.191 0.921
50 3.08993 11.2302 0.5164 0.38971 1.3043 3.204 11.511 0.571 0.225 1.022
55 3.01075 11.11538 0.55995 0.42534 1.41912 3.14 11.413 0.6 0.26 1.12
60 2.9474 11.02036 0.59559 0.46097 1.51414 3.079 11.317 0.627 0.295 1.216
65 2.88801 10.93326 0.6233 0.48869 1.60124 3.02 11.224 0.65 0.329 1.309
70 2.8405 10.86199 0.64706 0.51244 1.67251 2.964 11.133 0.672 0.364 1.4
75 2.79695 10.79864 0.67081 0.53224 1.7319 2.911 11.046 0.691 0.398 1.487
80 2.75735 10.73925 0.69061 0.55204 1.79129 2.859 10.961 0.71 0.431 1.572
85 2.72964 10.6957 0.70249 0.56787 1.8388 2.81 10.88 0.726 0.463 1.653
90 2.69796 10.64819 0.71833 0.58371 1.88631 2.763 10.801 0.742 0.495 1.732
95 2.67025 10.6086 0.7302 0.59559 1.9259 2.718 10.726 0.757 0.525 1.807
100 2.64649 10.569 0.74208 0.60747 1.96154 2.675 10.654 0.771 0.554 1.879
150 2.45249 10.2681 0.83314 0.71437 2.2664 2.334 10.091 0.89 0.776 2.442
200 2.29016 10.02262 0.90837 0.79751 2.50792 2.117 9.753 0.986 0.897 2.78
250 2.13971 9.80882 0.99152 0.86086 2.72568 1.982 9.555 1.058 0.96 2.978
300 2.00905 9.63066 1.07466 0.91233 2.90385 1.899 9.439 1.107 0.993 3.094
350 1.89423 9.47624 1.14989 0.95192 3.05826 1.849 9.371 1.139 1.011 3.162
400 1.79921 9.34163 1.20532 0.99152 3.19287 1.82 9.331 1.159 1.021 3.202
450 1.72794 9.23077 1.23699 1.03111 3.29977 1.802 9.308 1.171 1.027 3.225
500 1.68043 9.14367 1.24887 1.0707 3.39084 1.791 9.294 1.178 1.03 3.239
550 1.65271 9.08428 1.24887 1.09842 3.45023 1.785 9.286 1.183 1.032 3.247
600 1.64084 9.0526 1.24095 1.11821 3.4819 1.781 9.281 1.185 1.033 3.252

45
Table 5.21. Comparison of experimental data with simulated data at 0.5wt% catalyst
loading and temperature at 353K
Reaction time
Experimental
Concentration, kmol/m3
Simulation Concentration, kmol/m3
EG AA EGMA EGDA Water EG AA EGMA EGDA Water
0 4.0000 12.5330 0.0000 0.0000 0.0000 4.0000 12.5330 0.0000 0.0000 0.0000
5 3.7274 12.1923 0.1997 0.0690 0.3422 3.8720 12.3990 0.1230 0.0060 0.1340
10 3.5928 12.0102 0.2868 0.1165 0.5243 3.7490 12.2610 0.2300 0.0210 0.2720
15 3.4819 11.8518 0.3501 0.1680 0.6827 3.6330 12.1210 0.3220 0.0450 0.4120
20 3.3631 11.6736 0.4055 0.2274 0.8609 3.5220 11.9800 0.4030 0.0750 0.5530
25 3.2483 11.4955 0.4610 0.2868 1.0390 3.4170 11.8390 0.4720 0.1110 0.6940
30 3.1414 11.3292 0.5085 0.3462 1.2053 3.3170 11.6990 0.5330 0.1510 0.8340
35 3.0543 11.1867 0.5520 0.3976 1.3479 3.2220 11.5620 0.5850 0.1930 0.9710
40 2.9712 11.0600 0.5877 0.4412 1.4746 3.1330 11.4290 0.6300 0.2370 1.1040
45 2.9039 10.9570 0.6154 0.4808 1.5775 3.0490 11.2990 0.6690 0.2820 1.2340
50 2.8484 10.8660 0.6391 0.5124 1.6686 2.9690 11.1740 0.7030 0.3280 1.3590
55 2.7930 10.7789 0.6629 0.5402 1.7557 2.8940 11.0540 0.7340 0.3730 1.4790
60 2.7455 10.7076 0.6867 0.5679 1.8230 2.8230 10.9390 0.7610 0.4160 1.5940
65 2.7019 10.6442 0.7065 0.5916 1.8903 2.7560 10.8300 0.7850 0.4590 1.7030
70 2.6703 10.5888 0.7183 0.6075 1.9457 2.6930 10.7260 0.8080 0.5000 1.8070
75 2.6386 10.5413 0.7342 0.6273 1.9932 2.6330 10.6280 0.8280 0.5390 1.9050
80 2.6069 10.4898 0.7500 0.6431 2.0407 2.5770 10.5350 0.8470 0.5760 1.9980
85 2.5792 10.4502 0.7619 0.6550 2.0803 2.5240 10.4470 0.8660 0.6100 2.0860
90 2.5515 10.4146 0.7738 0.6708 2.1199 2.4740 10.3640 0.8830 0.6430 2.1690
95 2.5317 10.3790 0.7817 0.6827 2.1555 2.4270 10.2870 0.8990 0.6730 2.2460
100 2.5079 10.3433 0.7936 0.6946 2.1872 2.3830 10.2140 0.9150 0.7020 2.3190
150 2.3298 10.0662 0.8767 0.7896 2.4644 2.0600 9.7030 1.0500 0.8900 2.8300
200 2.1833 9.8405 0.9401 0.8688 2.6901 1.8860 9.4490 1.1440 0.9700 3.0840
250 2.0447 9.6346 1.0192 0.9361 2.8959 1.7950 9.3240 1.2000 1.0040 3.2090
300 1.9022 9.4446 1.1063 0.9915 3.0860 1.7490 9.2620 1.2320 1.0200 3.2710
350 1.7834 9.2822 1.1855 1.0311 3.2523 1.7250 9.2310 1.2480 1.0270 3.3020
400 1.6844 9.1397 1.2410 1.0747 3.3948 1.7130 9.2150 1.2560 1.0310 3.3180
450 1.6092 9.0249 1.2766 1.1143 3.5096 1.7070 9.2070 1.2610 1.0320 3.3260
500 1.5339 8.9140 1.3162 1.1499 3.6205 1.7040 9.2030 1.2630 1.0330 3.3300
550 1.4627 8.8190 1.3637 1.1736 3.7155 1.7020 9.2010 1.2640 1.0340 3.3320
600 1.4152 8.7240 1.4350 1.1895 3.8105 1.7010 9.2000 1.2650 1.0340 3.3330

46
Table 5.22. Comparison of experimental data with simulated data at 0.5wt% catalyst
loading and temperature at 363K
Reaction time
Experimental
Concentration, kmol/m3
Simulation Concentration, kmol/m3
EG AA EGMA EGDA Water EG AA EGMA EGDA Water 0 4 12.53333 0 0 0 4 12.533 0 0 0 5 3.63235 12.02206 0.22738 0.14027 0.51244 3.805 12.325 0.181 0.014 0.208 10 3.42647 11.72511 0.33824 0.23133 0.80939 3.624 12.107 0.326 0.05 0.426 15 3.27602 11.50735 0.41346 0.3026 1.02715 3.456 11.887 0.442 0.102 0.646 20 3.13744 11.30147 0.48869 0.36991 1.23303 3.3 11.668 0.534 0.166 0.865 25 3.00283 11.10747 0.55995 0.4293 1.42308 3.157 11.454 0.607 0.236 1.079 30 2.88801 10.93326 0.6233 0.48869 1.59729 3.025 11.249 0.666 0.309 1.284 35 2.78507 10.78281 0.67873 0.5362 1.7517 2.903 11.054 0.715 0.382 1.479 40 2.694 10.64423 0.72624 0.58371 1.88631 2.791 10.872 0.756 0.453 1.661 45 2.61482 10.52545 0.76584 0.61934 2.00509 2.688 10.701 0.791 0.52 1.832 50 2.54355 10.42251 0.80147 0.65498 2.10803 2.594 10.544 0.823 0.583 1.989 55 2.4802 10.32749 0.83314 0.68665 2.20701 2.507 10.399 0.852 0.641 2.134 60 2.42873 10.2483 0.86086 0.71437 2.2862 2.426 10.266 0.88 0.694 2.267 65 2.37726 10.17308 0.88462 0.73812 2.36143 2.353 10.145 0.906 0.741 2.388 70 2.33767 10.10973 0.90441 0.75792 2.42081 2.285 10.034 0.931 0.784 2.499 75 2.30204 10.05826 0.92421 0.77771 2.47624 2.223 9.934 0.956 0.822 2.599 80 2.2664 10.00679 0.94005 0.79355 2.52771 2.165 9.843 0.979 0.855 2.69 85 2.24265 9.96324 0.95192 0.80939 2.57127 2.113 9.76 1.002 0.885 2.773 90 2.21097 9.92364 0.96776 0.82127 2.61086 2.064 9.686 1.024 0.912 2.847 95 2.19118 9.88801 0.97568 0.83314 2.64649 2.02 9.618 1.046 0.935 2.915 100 2.16742 9.85633 0.98756 0.84502 2.67817 1.979 9.557 1.066 0.955 2.976 150 2.02885 9.63857 1.0509 0.92025 2.89593 1.719 9.188 1.217 1.064 3.345 200 1.94174 9.50396 1.0905 0.96776 3.03054 1.614 9.049 1.289 1.098 3.484 250 1.84276 9.36538 1.14197 1.01131 3.16912 1.572 8.995 1.319 1.11 3.538 300 1.72398 9.1991 1.21324 1.05882 3.33145 1.555 8.975 1.331 1.114 3.558 350 1.61708 9.04468 1.28054 1.10633 3.48982 1.549 8.966 1.335 1.116 3.567 400 1.52998 8.92195 1.3241 1.14593 3.61256 1.547 8.963 1.337 1.116 3.57 450 1.46663 8.82296 1.35577 1.1776 3.71154 1.546 8.962 1.338 1.117 3.571 500 1.3914 8.7121 1.39932 1.21324 3.8224 1.545 8.962 1.338 1.117 3.571 550 1.29242 8.58541 1.46663 1.24095 3.94514 1.545 8.961 1.338 1.117 3.572 600 1.14989 8.42704 1.55373 1.25679 4.06391 1.545 8.961 1.338 1.117 3.572

47
Table 5.23. Comparison of experimental data with simulated data at 1.0wt% catalyst
loading and temperature at 333K
Reaction time
Experimental
Concentration, kmol/m3
Simulation Concentration, kmol/m3
EG
AA EGMA EGDA Water EG AA EGMA EGDA Water
0.0000 4.0000 12.5333 0.0000 0.0000 0.0000 4.0000 12.5330 0.0000 0.0000 0.0000 5.0000 3.7780 12.2633 0.1741 0.0480 0.2700 3.8980 12.4250 0.0960 0.0060 0.1080 10.0000 3.6872 12.1383 0.2306 0.0822 0.3950 3.7990 12.3090 0.1780 0.0230 0.2240 15.0000 3.5964 12.0133 0.2871 0.1164 0.5200 3.7040 12.1880 0.2470 0.0490 0.3450 20.0000 3.5220 11.8978 0.3205 0.1575 0.6356 3.6120 12.0640 0.3060 0.0810 0.4690 25.0000 3.4475 11.7822 0.3539 0.1986 0.7511 3.5240 11.9370 0.3560 0.1200 0.5960 30.0000 3.3731 11.6667 0.3872 0.2397 0.8667 3.4390 11.8100 0.3990 0.1620 0.7230 35.0000 3.2572 11.4903 0.4426 0.3002 1.0431 3.3570 11.6830 0.4360 0.2070 0.8500 40.0000 3.1413 11.3139 0.4980 0.3607 1.2194 3.2780 11.5570 0.4670 0.2550 0.9760 45.0000 3.0254 11.1375 0.5534 0.4212 1.3958 3.2020 11.4320 0.4950 0.3030 1.1010 50.0000 2.9095 10.9611 0.6088 0.4817 1.5722 3.1290 11.3110 0.5190 0.3520 1.2220 55.0000 2.7936 10.7847 0.6641 0.5422 1.7486 3.0590 11.1920 0.5410 0.4000 1.3410 60.0000 2.6777 10.6083 0.7195 0.6027 1.9250 2.9920 11.0770 0.5610 0.4480 1.4560 65.0000 2.6363 10.5475 0.7415 0.6222 1.9858 2.9260 10.9650 0.5790 0.4940 1.5680 70.0000 2.5949 10.4867 0.7636 0.6416 2.0467 2.8640 10.8580 0.5970 0.5390 1.6750 75.0000 2.5535 10.4258 0.7856 0.6610 2.1075 2.8030 10.7540 0.6140 0.5830 1.7790 80.0000 2.5120 10.3650 0.8076 0.6804 2.1683 2.7450 10.6540 0.6310 0.6240 1.8790 85.0000 2.4706 10.3042 0.8296 0.6998 2.2292 2.6890 10.5580 0.6470 0.6640 1.9750 90.0000 2.4292 10.2433 0.8516 0.7192 2.2900 2.6350 10.4660 0.6640 0.7010 2.0670 95.0000 2.3878 10.1825 0.8737 0.7386 2.3508 2.5820 10.3780 0.6800 0.7370 2.1550 100.0000 2.3463 10.1217 0.8957 0.7580 2.4117 2.5320 10.2940 0.6970 0.7710 2.2390 150.0000 2.0762 9.7254 1.0398 0.8841 2.8079 2.1150 9.6310 0.8680 1.0170 2.9020 200.0000 1.9021 9.4706 1.1331 0.9648 3.0628 1.8200 9.2050 1.0320 1.1480 3.3280 250.0000 1.7194 9.2103 1.2382 1.0424 3.3231 1.6120 8.9230 1.1670 1.2220 3.6100 300.0000 1.5022 8.9283 1.3906 1.1072 3.6050 1.4640 8.7310 1.2700 1.2660 3.8020 350.0000 1.2850 8.6464 1.5430 1.1720 3.8869 1.3600 8.6000 1.3470 1.2930 3.9330 400.0000 1.1909 8.5156 1.6004 1.2087 4.0178 1.2870 8.5080 1.4020 1.3110 4.0250 450.0000 1.1275 8.4225 1.6341 1.2384 4.1108 1.2350 8.4450 1.4420 1.3230 4.0880 500.0000 1.0734 8.3433 1.6633 1.2634 4.1900 1.1990 8.4000 1.4700 1.3310 4.1330 550.0000 1.0330 8.2850 1.6857 1.2813 4.2483 1.1730 8.3690 1.4900 1.3370 4.1640 600.0000 0.9927 8.2267 1.7080 1.2993 4.3067 1.1550 8.3480 1.5040 1.3410 4.1850

48
Table 5.24. Comparison of experimental data with simulated data at 1.0wt% catalyst
loading and temperature at 343K
Reaction time
Experimental
Concentration, kmol/m3
Simulation Concentration, kmol/m3
EG
AA EGMA EGDA Water EG AA EGMA EGDA Water
0.0000 4.0000 12.5333 0.0000 0.0000 0.0000 4.0000 12.5330 0.0000 0.0000 0.0000 5.0000 3.6681 12.0850 0.2155 0.1164 0.4483 3.7990 12.3180 0.1870 0.0140 0.2150 10.0000 3.5311 11.8967 0.3011 0.1678 0.6367 3.6110 12.0930 0.3380 0.0510 0.4400 15.0000 3.3942 11.7083 0.3866 0.2192 0.8250 3.4360 11.8640 0.4590 0.1050 0.6690 20.0000 3.2239 11.4444 0.4633 0.3128 1.0889 3.2740 11.6360 0.5550 0.1710 0.8970 25.0000 3.0536 11.1806 0.5400 0.4064 1.3528 3.1230 11.4120 0.6340 0.2440 1.1210 30.0000 2.8833 10.9167 0.6167 0.5000 1.6167 2.9820 11.1940 0.6980 0.3200 1.3390 35.0000 2.7831 10.7617 0.6621 0.5548 1.7717 2.8500 10.9860 0.7520 0.3980 1.5470 40.0000 2.6829 10.6067 0.7075 0.6096 1.9267 2.7280 10.7870 0.7980 0.4740 1.7460 45.0000 2.5827 10.4517 0.7529 0.6644 2.0817 2.6140 10.6000 0.8390 0.5470 1.9330 50.0000 2.4825 10.2967 0.7983 0.7192 2.2367 2.5070 10.4250 0.8770 0.6160 2.1080 55.0000 2.3823 10.1417 0.8437 0.7740 2.3917 2.4080 10.2600 0.9120 0.6800 2.2730 60.0000 2.2821 9.9867 0.8891 0.8288 2.5467 2.3140 10.1080 0.9460 0.7400 2.4250 65.0000 2.2122 9.9031 0.9453 0.8425 2.6303 2.2270 9.9660 0.9790 0.7940 2.5670 70.0000 2.1423 9.8194 1.0016 0.8562 2.7139 2.1450 9.8340 1.0120 0.8430 2.6990 75.0000 2.0724 9.7358 1.0578 0.8699 2.7975 2.0680 9.7130 1.0450 0.8880 2.8200 80.0000 2.0025 9.6522 1.1140 0.8836 2.8811 1.9950 9.6000 1.0770 0.9280 2.9330 85.0000 1.9325 9.5686 1.1702 0.8973 2.9647 1.9270 9.4960 1.1090 0.9640 3.0370 90.0000 1.8626 9.4850 1.2264 0.9110 3.0483 1.8630 9.4000 1.1410 0.9960 3.1330 95.0000 1.7927 9.4014 1.2826 0.9247 3.1319 1.8030 9.3100 1.1720 1.0250 3.2230 100.0000 1.7228 9.3178 1.3388 0.9384 3.2156 1.7460 9.2280 1.2030 1.0510 3.3050 150.0000 1.3556 8.8542 1.6096 1.0348 3.6792 1.3280 8.6620 1.4720 1.1990 3.8710 200.0000 1.2097 8.6389 1.6862 1.1041 3.8944 1.0920 8.3700 1.6520 1.2550 4.1630 250.0000 1.0720 8.4294 1.7522 1.1759 4.1039 0.9580 8.2110 1.7620 1.2800 4.3220 300.0000 0.9672 8.2433 1.7756 1.2572 4.2900 0.8810 8.1210 1.8270 1.2920 4.4120 350.0000 0.8624 8.0572 1.7991 1.3385 4.4761 0.8360 8.0700 1.8650 1.2990 4.4630 400.0000 0.8199 7.9911 1.8180 1.3621 4.5422 0.8110 8.0410 1.8870 1.3030 4.4920 450.0000 0.7929 7.9550 1.8359 1.3712 4.5783 0.7960 8.0240 1.8990 1.3050 4.5090 500.0000 0.7659 7.9111 1.8460 1.3881 4.6222 0.7870 8.0150 1.9070 1.3060 4.5180 550.0000 0.7389 7.8556 1.8444 1.4167 4.6778 0.7830 8.0090 1.9110 1.3060 4.5240 600.0000 0.7119 7.8000 1.8429 1.4452 4.7333 0.7800 8.0060 1.9130 1.3070 4.5270

49
Table 5.25. Comparison of experimental data with simulated data at 1.0wt% catalyst
loading and temperature at 353K
Reaction time
Experimental
Concentration, kmol/m3
Simulation Concentration, kmol/m3
EG
AA EGMA EGDA Water EG AA EGMA EGDA Water
0.0000 4.0000 12.5333 0.0000 0.0000 0.0000 4.0000 12.5330 0.0000 0.0000 0.0000 5.0000 3.5340 11.9167 0.3153 0.1507 0.6167 3.7850 12.3030 0.1990 0.0160 0.2300 10.0000 3.4604 11.7917 0.3376 0.2021 0.7417 3.5860 12.0620 0.3570 0.0570 0.4710 15.0000 3.3868 11.6667 0.3598 0.2534 0.8667 3.4010 11.8180 0.4830 0.1160 0.7150 20.0000 3.1231 11.2889 0.5093 0.3676 1.2444 3.2300 11.5760 0.5830 0.1870 0.9570 25.0000 2.8595 10.9111 0.6588 0.4817 1.6222 3.0710 11.3400 0.6650 0.2640 1.1930 30.0000 2.5959 10.5333 0.8082 0.5959 2.0000 2.9240 11.1140 0.7330 0.3430 1.4190 35.0000 2.5202 10.4222 0.8486 0.6313 2.1111 2.7870 10.8990 0.7920 0.4210 1.6340 40.0000 2.4445 10.3111 0.8889 0.6667 2.2222 2.6600 10.6970 0.8440 0.4960 1.8360 45.0000 2.3687 10.2000 0.9292 0.7021 2.3333 2.5410 10.5090 0.8930 0.5660 2.0240 50.0000 2.2930 10.0889 0.9696 0.7374 2.4444 2.4310 10.3340 0.9390 0.6300 2.1990 55.0000 2.2173 9.9778 1.0099 0.7728 2.5556 2.3280 10.1730 0.9840 0.6880 2.3600 60.0000 2.1416 9.8667 1.0502 0.8082 2.6667 2.2320 10.0240 1.0280 0.7400 2.5090 65.0000 2.0784 9.7778 1.0877 0.8339 2.7556 2.1420 9.8880 1.0720 0.7870 2.6450 70.0000 2.0152 9.6889 1.1253 0.8596 2.8444 2.0570 9.7620 1.1150 0.8280 2.7710 75.0000 1.9519 9.6000 1.1628 0.8853 2.9333 1.9780 9.6470 1.1580 0.8640 2.8860 80.0000 1.8887 9.5111 1.2003 0.9110 3.0222 1.9040 9.5410 1.2010 0.8960 2.9920 85.0000 1.8255 9.4222 1.2378 0.9366 3.1111 1.8340 9.4440 1.2430 0.9230 3.0890 90.0000 1.7623 9.3333 1.2753 0.9623 3.2000 1.7680 9.3540 1.2840 0.9480 3.1790 95.0000 1.6991 9.2444 1.3129 0.9880 3.2889 1.7070 9.2710 1.3240 0.9690 3.2620 100.0000 1.6359 9.1556 1.3504 1.0137 3.3778 1.6490 9.1940 1.3640 0.9880 3.3390 150.0000 1.2880 8.6792 1.5699 1.1421 3.8542 1.2240 8.6690 1.6870 1.0890 3.8640 200.0000 1.1294 8.4778 1.6857 1.1849 4.0556 0.9860 8.3950 1.8890 1.1250 4.1380 250.0000 0.9729 8.2819 1.8028 1.2243 4.2514 0.8510 8.2430 2.0090 1.1410 4.2900 300.0000 0.8250 8.1083 1.9250 1.2500 4.4250 0.7730 8.1580 2.0780 1.1480 4.3750 350.0000 0.6771 7.9347 2.0472 1.2757 4.5986 0.7290 8.1090 2.1190 1.1520 4.4240 400.0000 0.6670 7.8556 1.9883 1.3448 4.6778 0.7030 8.0810 2.1430 1.1550 4.4520 450.0000 0.6913 7.8000 1.8840 1.4247 4.7333 0.6880 8.0650 2.1560 1.1560 4.4680 500.0000 0.6955 7.7528 1.8285 1.4760 4.7806 0.6790 8.0560 2.1640 1.1560 4.4770 550.0000 0.6693 7.7181 1.8461 1.4846 4.8153 0.6750 8.0510 2.1690 1.1570 4.4820 600.0000 0.6432 7.6833 1.8637 1.4932 4.8500 0.6720 8.0480 2.1710 1.1570 4.4850

50
Table 5.26. Comparison of experimental data with simulated data at 1.0wt% catalyst
loading and temperature at 363K
Reaction time
Experimental
Concentration, kmol/m3
Simulation Concentration, kmol/m3
EG
AA EGMA EGDA Water EG AA EGMA EGDA Water
0.0000 4.0000 12.5333 0.0000 0.0000 0.0000 4.0000 12.5330 0.0000 0.0000 0.0000 5.0000 3.4222 11.7500 0.3724 0.2055 0.7833 3.6510 12.1290 0.2940 0.0550 0.4040 10.0000 3.3069 11.5833 0.4363 0.2569 0.9500 3.3430 11.6950 0.4750 0.1810 0.8380 15.0000 3.1916 11.4167 0.5002 0.3082 1.1167 3.0720 11.2680 0.5920 0.3370 1.2650 20.0000 2.9576 11.0389 0.5903 0.4521 1.4944 2.8310 10.8710 0.6750 0.4940 1.6620 25.0000 2.7237 10.6611 0.6804 0.5959 1.8722 2.6180 10.5130 0.7450 0.6370 2.0200 30.0000 2.4897 10.2833 0.7705 0.7397 2.2500 2.4270 10.1980 0.8120 0.7620 2.3350 35.0000 2.3110 10.0478 0.8924 0.7966 2.4856 2.2550 9.9230 0.8800 0.8650 2.6100 40.0000 2.1323 9.8122 1.0143 0.8534 2.7211 2.1000 9.6830 0.9490 0.9510 2.8500 45.0000 1.9536 9.5767 1.1361 0.9103 2.9567 1.9600 9.4730 1.0200 1.0200 3.0600 50.0000 1.7749 9.3411 1.2580 0.9671 3.1922 1.8330 9.2900 1.0910 1.0760 3.2430 55.0000 1.5962 9.1056 1.3798 1.0240 3.4278 1.7170 9.1270 1.1610 1.1220 3.4060 60.0000 1.4175 8.8700 1.5017 1.0808 3.6633 1.6100 8.9830 1.2300 1.1600 3.5500 65.0000 1.3567 8.7919 1.5453 1.0981 3.7414 1.5130 8.8550 1.2960 1.1910 3.6780 70.0000 1.2959 8.7139 1.5889 1.1153 3.8194 1.4240 8.7390 1.3590 1.2170 3.7940 75.0000 1.2350 8.6358 1.6324 1.1325 3.8975 1.3410 8.6350 1.4190 1.2390 3.8980 80.0000 1.1742 8.5578 1.6760 1.1498 3.9756 1.2660 8.5410 1.4760 1.2580 3.9920 85.0000 1.1134 8.4797 1.7196 1.1670 4.0536 1.1960 8.4550 1.5300 1.2740 4.0780 90.0000 1.0526 8.4017 1.7632 1.1843 4.1317 1.1310 8.3770 1.5810 1.2880 4.1560 95.0000 0.9918 8.3236 1.8068 1.2015 4.2097 1.0720 8.3050 1.6280 1.3000 4.2280 100.0000 0.9310 8.2456 1.8503 1.2187 4.2878 1.0170 8.2400 1.6730 1.3100 4.2930 150.0000 0.6299 7.8396 2.0465 1.3236 4.6938 0.6430 7.8090 1.9900 1.3670 4.7240 200.0000 0.5336 7.6833 2.0829 1.3836 4.8500 0.4600 7.6060 2.1530 1.3870 4.9270 250.0000 0.4436 7.5396 2.1190 1.4374 4.9938 0.3680 7.5050 2.2360 1.3960 5.0280 300.0000 0.3793 7.4458 2.1539 1.4668 5.0875 0.3210 7.4550 2.2790 1.4000 5.0780 350.0000 0.3149 7.3521 2.1889 1.4962 5.1813 0.2970 7.4290 2.3020 1.4010 5.1040 400.0000 0.3075 7.3167 2.1683 1.5242 5.2167 0.2850 7.4150 2.3130 1.4020 5.1180 450.0000 0.3144 7.2958 2.1337 1.5519 5.2375 0.2780 7.4080 2.3190 1.4030 5.1250 500.0000 0.3043 7.2611 2.1193 1.5765 5.2722 0.2750 7.4050 2.3220 1.4030 5.1280 550.0000 0.2687 7.2056 2.1349 1.5965 5.3278 0.2730 7.4030 2.3240 1.4030 5.1300 600.0000 0.2331 7.1500 2.1505 1.6164 5.3833 0.2720 7.4020 2.3240 1.4030 5.1310

51
Table 5.27. Comparison of experimental data with simulated data at 1.5wt% catalyst
loading and temperature at 333K
Reaction time
Experimental
Concentration, kmol/m3
Simulation Concentration, kmol/m3
EG
AA EGMA EGDA Water EG AA EGMA EGDA Water
0.0000 4.0000 12.5333 0.0000 0.0000 0.0000 4.0000 12.5330 0.0000 0.0000 0.0000 5.0000 3.5505 12.0017 0.3673 0.0822 0.5317 3.7090 12.2300 0.2790 0.0120 0.3030 10.0000 3.2706 11.6258 0.5513 0.1781 0.9075 3.4470 11.9360 0.5090 0.0440 0.5970 15.0000 2.9906 11.2500 0.7354 0.2740 1.2833 3.2110 11.6530 0.6980 0.0910 0.8800 20.0000 2.8814 11.1111 0.8149 0.3037 1.4222 2.9980 11.3830 0.8530 0.1490 1.1500 25.0000 2.7722 10.9722 0.8944 0.3333 1.5611 2.8070 11.1270 0.9790 0.2140 1.4060 30.0000 2.6630 10.8333 0.9740 0.3630 1.7000 2.6360 10.8860 1.0810 0.2830 1.6470 35.0000 2.5121 10.6222 1.0648 0.4232 1.9111 2.4820 10.6610 1.1650 0.3540 1.8720 40.0000 2.3611 10.4111 1.1556 0.4833 2.1222 2.3430 10.4510 1.2330 0.4250 2.0820 45.0000 2.2102 10.2000 1.2463 0.5435 2.3333 2.2180 10.2580 1.2880 0.4940 2.2750 50.0000 2.0592 9.9889 1.3371 0.6037 2.5444 2.1060 10.0790 1.3340 0.5600 2.4540 55.0000 1.9083 9.7778 1.4279 0.6638 2.7556 2.0050 9.9140 1.3720 0.6240 2.6190 60.0000 1.7573 9.5667 1.5187 0.7240 2.9667 1.9130 9.7630 1.4040 0.6830 2.7700 65.0000 1.7285 9.5139 1.5237 0.7479 3.0194 1.8310 9.6260 1.4310 0.7380 2.9070 70.0000 1.6996 9.4611 1.5286 0.7718 3.0722 1.7560 9.5000 1.4540 0.7890 3.0330 75.0000 1.6707 9.4083 1.5336 0.7957 3.1250 1.6890 9.3860 1.4750 0.8360 3.1470 80.0000 1.6419 9.3556 1.5385 0.8196 3.1778 1.6280 9.2820 1.4930 0.8790 3.2510 85.0000 1.6130 9.3028 1.5435 0.8436 3.2306 1.5720 9.1870 1.5100 0.9180 3.3460 90.0000 1.5841 9.2500 1.5484 0.8675 3.2833 1.5220 9.1020 1.5250 0.9530 3.4310 95.0000 1.5553 9.1972 1.5534 0.8914 3.3361 1.4760 9.0240 1.5390 0.9850 3.5090 100.0000 1.5264 9.1444 1.5583 0.9153 3.3889 1.4350 8.9540 1.5510 1.0140 3.5790 150.0000 1.3711 8.8500 1.5744 1.0545 3.6833 1.1790 8.5370 1.6450 1.1760 3.9960 200.0000 1.3047 8.7111 1.5683 1.1269 3.8222 1.0790 8.3860 1.6940 1.2260 4.1470 250.0000 1.2296 8.5708 1.5784 1.1921 3.9625 1.0400 8.3310 1.7180 1.2420 4.2020 300.0000 1.1194 8.4250 1.6529 1.2277 4.1083 1.0250 8.3110 1.7270 1.2480 4.2220 350.0000 1.0093 8.2792 1.7273 1.2634 4.2542 1.0190 8.3030 1.7310 1.2490 4.2300 400.0000 0.9842 8.2161 1.7145 1.3014 4.3172 1.0170 8.3000 1.7330 1.2500 4.2330 450.0000 0.9803 8.1738 1.6798 1.3399 4.3596 1.0160 8.2990 1.7330 1.2500 4.2340 500.0000 0.9552 8.1175 1.6738 1.3710 4.4158 1.0160 8.2980 1.7340 1.2510 4.2350 550.0000 0.8981 8.0404 1.7110 1.3910 4.4929 1.0160 8.2980 1.7340 1.2510 4.2350 600.0000 0.8410 7.9633 1.7481 1.4110 4.5700 1.0160 8.2980 1.7340 1.2510 4.2350

52
Table 5.28. Comparison of experimental data with simulated data at 1.5wt% catalyst
loading and temperature at 343K
Reaction time
Experimental
Concentration, kmol/m3
Simulation Concentration, kmol/m3
EG
AA EGMA EGDA Water EG AA EGMA EGDA Water
0.0000 4.0000 12.5333 0.0000 0.0000 0.0000 4.0000 12.5330 0.0000 0.0000 0.0000 5.0000 3.5224 11.9167 0.3386 0.1390 0.6167 3.6670 12.1740 0.3080 0.0250 0.3590 10.0000 3.1603 11.4083 0.5545 0.2853 1.1250 3.3700 11.8140 0.5400 0.0900 0.7190 15.0000 2.7982 10.9000 0.7703 0.4315 1.6333 3.1070 11.4610 0.7140 0.1790 1.0720 20.0000 2.7290 10.7833 0.7920 0.4790 1.7500 2.8730 11.1240 0.8450 0.2820 1.4090 25.0000 2.6598 10.6667 0.8137 0.5265 1.8667 2.6650 10.8080 0.9450 0.3900 1.7250 30.0000 2.5906 10.5500 0.8354 0.5740 1.9833 2.4800 10.5150 1.0230 0.4980 2.0180 35.0000 2.4360 10.3278 0.9225 0.6416 2.2056 2.3140 10.2470 1.0870 0.6000 2.2860 40.0000 2.2814 10.1056 1.0095 0.7091 2.4278 2.1650 10.0040 1.1410 0.6940 2.5290 45.0000 2.1267 9.8833 1.0966 0.7767 2.6500 2.0320 9.7850 1.1890 0.7790 2.7480 50.0000 1.9721 9.6611 1.1836 0.8443 2.8722 1.9110 9.5890 1.2330 0.8550 2.9440 55.0000 1.8174 9.4389 1.2707 0.9119 3.0944 1.8030 9.4140 1.2750 0.9220 3.1190 60.0000 1.6628 9.2167 1.3578 0.9795 3.3167 1.7050 9.2570 1.3150 0.9800 3.2760 65.0000 1.6229 9.1614 1.3822 0.9949 3.3719 1.6160 9.1180 1.3540 1.0310 3.4150 70.0000 1.5831 9.1061 1.4067 1.0103 3.4272 1.5350 8.9940 1.3910 1.0740 3.5390 75.0000 1.5432 9.0508 1.4311 1.0257 3.4825 1.4620 8.8840 1.4280 1.1110 3.6490 80.0000 1.5033 8.9956 1.4556 1.0411 3.5378 1.3950 8.7850 1.4630 1.1420 3.7480 85.0000 1.4635 8.9403 1.4800 1.0565 3.5931 1.3340 8.6980 1.4970 1.1690 3.8350 90.0000 1.4236 8.8850 1.5045 1.0719 3.6483 1.2790 8.6190 1.5290 1.1930 3.9140 95.0000 1.3837 8.8297 1.5290 1.0873 3.7036 1.2280 8.5490 1.5600 1.2120 3.9840 100.0000 1.3439 8.7744 1.5534 1.1027 3.7589 1.1820 8.4860 1.5890 1.2290 4.0470 150.0000 1.0979 8.4246 1.6954 1.2067 4.1088 0.8910 8.1130 1.7980 1.3110 4.4200 200.0000 0.9538 8.2100 1.7690 1.2772 4.3233 0.7710 7.9700 1.8950 1.3340 4.5630 250.0000 0.8292 8.0215 1.8297 1.3410 4.5118 0.7210 7.9120 1.9370 1.3420 4.6210 300.0000 0.7826 7.9375 1.8390 1.3784 4.5958 0.7000 7.8880 1.9540 1.3450 4.6450 350.0000 0.7360 7.8535 1.8482 1.4158 4.6799 0.6920 7.8780 1.9620 1.3470 4.6550 400.0000 0.6825 7.7811 1.8828 1.4347 4.7522 0.6880 7.8740 1.9650 1.3470 4.6590 450.0000 0.6273 7.7117 1.9237 1.4490 4.8217 0.6860 7.8720 1.9660 1.3470 4.6610 500.0000 0.5888 7.6553 1.9443 1.4669 4.8781 0.6860 7.8710 1.9670 1.3470 4.6620 550.0000 0.5754 7.6185 1.9343 1.4903 4.9149 0.6850 7.8710 1.9670 1.3470 4.6620 600.0000 0.5620 7.5817 1.9243 1.5137 4.9517 0.6850 7.8710 1.9670 1.3480 4.6620

53
Table 5.29. Comparison of experimental data with simulated data at 1.5wt% catalyst
loading and temperature at 353K
Reaction time
Experimental
Concentration, kmol/m3
Simulation Concentration, kmol/m3
EG
AA EGMA EGDA Water EG AA EGMA EGDA Water
0.0000 4.0000 12.5333 0.0000 0.0000 0.0000 4.0000 12.5330 0.0000 0.0000 0.0000 5.0000 3.3359 11.6500 0.4450 0.2192 0.8833 3.6380 12.1160 0.3080 0.0540 0.4170 10.0000 2.9812 11.1583 0.6627 0.3562 1.3750 3.3200 11.6720 0.4990 0.1810 0.8610 15.0000 2.6265 10.6667 0.8804 0.4932 1.8667 3.0420 11.2380 0.6220 0.3370 1.2950 20.0000 2.5557 10.5500 0.9053 0.5390 1.9833 2.7970 10.8350 0.7080 0.4950 1.6980 25.0000 2.4849 10.4333 0.9301 0.5849 2.1000 2.5810 10.4740 0.7790 0.6400 2.0590 30.0000 2.4142 10.3167 0.9550 0.6308 2.2167 2.3890 10.1560 0.8440 0.7660 2.3770 35.0000 2.2655 10.0964 1.0322 0.7024 2.4369 2.2180 9.8790 0.9100 0.8720 2.6540 40.0000 2.1168 9.8761 1.1093 0.7740 2.6572 2.0650 9.6390 0.9760 0.9590 2.8940 45.0000 1.9681 9.6558 1.1864 0.8456 2.8775 1.9280 9.4320 1.0420 1.0290 3.1010 50.0000 1.8194 9.4356 1.2635 0.9171 3.0978 1.8040 9.2510 1.1090 1.0870 3.2820 55.0000 1.6707 9.2153 1.3407 0.9887 3.3181 1.6930 9.0930 1.1750 1.1330 3.4400 60.0000 1.5219 8.9950 1.4178 1.0603 3.5383 1.5910 8.9540 1.2380 1.1710 3.5790 65.0000 1.4822 8.9408 1.4432 1.0747 3.5925 1.5000 8.8310 1.2990 1.2020 3.7020 70.0000 1.4424 8.8867 1.4686 1.0890 3.6467 1.4160 8.7220 1.3560 1.2280 3.8110 75.0000 1.4026 8.8325 1.4940 1.1034 3.7008 1.3400 8.6240 1.4110 1.2490 3.9090 80.0000 1.3628 8.7783 1.5194 1.1178 3.7550 1.2710 8.5370 1.4610 1.2670 3.9960 85.0000 1.3230 8.7242 1.5448 1.1322 3.8092 1.2080 8.4590 1.5090 1.2830 4.0740 90.0000 1.2833 8.6700 1.5702 1.1466 3.8633 1.1510 8.3880 1.5530 1.2960 4.1450 95.0000 1.2435 8.6158 1.5956 1.1610 3.9175 1.0990 8.3250 1.5940 1.3070 4.2080 100.0000 1.2037 8.5617 1.6210 1.1753 3.9717 1.0510 8.2670 1.6320 1.3170 4.2660 150.0000 0.9310 8.1921 1.7967 1.2723 4.3413 0.7470 7.9110 1.8850 1.3680 4.6220 200.0000 0.7418 7.9372 1.9203 1.3379 4.5961 0.6180 7.7660 1.9960 1.3850 4.7670 250.0000 0.5856 7.7222 2.0177 1.3967 4.8111 0.5630 7.7050 2.0450 1.3920 4.8290 300.0000 0.5614 7.6667 2.0105 1.4281 4.8667 0.5400 7.6780 2.0660 1.3950 4.8550 350.0000 0.5373 7.6111 2.0033 1.4595 4.9222 0.5290 7.6670 2.0750 1.3960 4.8660 400.0000 0.5167 7.5500 1.9833 1.5000 4.9833 0.5250 7.6620 2.0790 1.3960 4.8710 450.0000 0.4970 7.4875 1.9602 1.5428 5.0458 0.5230 7.6600 2.0810 1.3960 4.8730 500.0000 0.4670 7.4250 1.9577 1.5753 5.1083 0.5220 7.6590 2.0810 1.3960 4.8740 550.0000 0.4216 7.3625 1.9859 1.5925 5.1708 0.5220 7.6580 2.0820 1.3960 4.8750 600.0000 0.3763 7.3000 2.0142 1.6096 5.2333 0.5220 7.6580 2.0820 1.3960 4.8750

54
Table 5.30. Comparison of experimental data with simulated data at 1.5wt% catalyst
loading and temperature at 363K
Reaction time
Experimental
Concentration, kmol/m3
Simulation Concentration, kmol/m3
EG
AA EGMA EGDA Water EG AA EGMA EGDA Water
0.0000 4.0000 12.5333 0.0000 0.0000 0.0000 4.0000 12.5330 0.0000 0.0000 0.0000
5.0000 3.1416 11.3667 0.5502 0.3082 1.1667 3.4220 11.8820 0.5060 0.0720 0.6510
10.0000 2.8333 10.9358 0.7359 0.4308 1.5975 2.9520 11.2510 0.8130 0.2340 1.2820
15.0000 2.5251 10.5050 0.9215 0.5534 2.0283 2.5690 10.6760 1.0050 0.4260 1.8570
20.0000 2.2610 10.1644 1.1091 0.6299 2.3689 2.2540 10.1750 1.1350 0.6110 2.3580
25.0000 1.9970 9.8239 1.2967 0.7064 2.7094 1.9910 9.7500 1.2350 0.7740 2.7830
30.0000 1.7329 9.4833 1.4842 0.7829 3.0500 1.7700 9.3960 1.3220 0.9070 3.1370
35.0000 1.5942 9.2811 1.5593 0.8465 3.2522 1.5830 9.1030 1.4040 1.0130 3.4300
40.0000 1.4556 9.0789 1.6344 0.9101 3.4544 1.4230 8.8620 1.4820 1.0950 3.6710
45.0000 1.3170 8.8767 1.7094 0.9736 3.6567 1.2860 8.6620 1.5570 1.1570 3.8710
50.0000 1.1783 8.6744 1.7845 1.0372 3.8589 1.1670 8.4950 1.6290 1.2040 4.0380
55.0000 1.0397 8.4722 1.8595 1.1008 4.0611 1.0630 8.3560 1.6960 1.2400 4.1770
60.0000 0.9011 8.2700 1.9346 1.1644 4.2633 0.9730 8.2380 1.7590 1.2680 4.2950
65.0000 0.8648 8.2197 1.9568 1.1784 4.3136 0.8940 8.1380 1.8160 1.2890 4.3950
70.0000 0.8286 8.1694 1.9790 1.1925 4.3639 0.8250 8.0530 1.8690 1.3060 4.4800
75.0000 0.7923 8.1192 2.0012 1.2065 4.4142 0.7650 7.9790 1.9170 1.3180 4.5540
80.0000 0.7561 8.0689 2.0234 1.2206 4.4644 0.7120 7.9160 1.9600 1.3290 4.6170
85.0000 0.7199 8.0186 2.0455 1.2346 4.5147 0.6650 7.8610 1.9980 1.3370 4.6720
90.0000 0.6836 7.9683 2.0677 1.2486 4.5650 0.6230 7.8130 2.0330 1.3440 4.7200
95.0000 0.6474 7.9181 2.0899 1.2627 4.6153 0.5870 7.7710 2.0640 1.3490 4.7620
100.0000 0.6112 7.8678 2.1121 1.2767 4.6656 0.5550 7.7340 2.0920 1.3540 4.7990
150.0000 0.3973 7.5804 2.2526 1.3502 4.9529 0.3790 7.5380 2.2460 1.3740 4.9950
200.0000 0.2823 7.4367 2.3387 1.3790 5.0967 0.3260 7.4790 2.2950 1.3800 5.0540
250.0000 0.1902 7.3143 2.4005 1.4093 5.2190 0.3090 7.4620 2.3100 1.3810 5.0710
300.0000 0.1894 7.2775 2.3654 1.4452 5.2558 0.3040 7.4560 2.3140 1.3810 5.0770
350.0000 0.1885 7.2407 2.3303 1.4812 5.2926 0.3030 7.4540 2.3160 1.3820 5.0790
400.0000 0.2088 7.2111 2.2601 1.5311 5.3222 0.3020 7.4540 2.3160 1.3820 5.0790
450.0000 0.2344 7.1833 2.1812 1.5844 5.3500 0.3020 7.4540 2.3160 1.3820 5.0790
500.0000 0.2305 7.1417 2.1474 1.6222 5.3917 0.3020 7.4540 2.3160 1.3820 5.0790
550.0000 0.1823 7.0792 2.1813 1.6364 5.4542 0.3020 7.4540 2.3160 1.3820 5.0790
600.0000 0.1340 7.0167 2.2153 1.6507 5.5167 0.3020 7.4540 2.3160 1.3820 5.0790

55
Table 5.31. Comparison of experimental data with simulated data at 2.0wt% catalyst
loading and temperature at 333K
Reaction time
Experimental
Concentration, kmol/m3
Simulation Concentration, kmol/m3
EG
AA EGMA EGDA Water EG AA EGMA EGDA Water
0.0000 4.0000 12.5333 0.0000 0.0000 0.0000 4.0000 12.5330 0.0000 0.0000 0.0000
5.0000 3.2732 11.5867 0.5069 0.2199 0.9467 3.6240 12.1430 0.3610 0.0140 0.3900
10.0000 3.0009 11.2517 0.7166 0.2825 1.2817 3.2960 11.7770 0.6520 0.0520 0.7560
15.0000 2.7285 10.9167 0.9263 0.3452 1.6167 3.0080 11.4350 0.8850 0.1060 1.0980
20.0000 2.5992 10.7389 1.0072 0.3936 1.7944 2.7570 11.1170 1.0710 0.1720 1.4160
25.0000 2.4698 10.5611 1.0882 0.4420 1.9722 2.5370 10.8240 1.2180 0.2460 1.7090
30.0000 2.3404 10.3833 1.1692 0.4904 2.1500 2.3440 10.5540 1.3330 0.3230 1.9790
35.0000 2.2163 10.2111 1.2453 0.5385 2.3222 2.1750 10.3070 1.4240 0.4010 2.2260
40.0000 2.0921 10.0389 1.3214 0.5865 2.4944 2.0270 10.0810 1.4950 0.4780 2.4520
45.0000 1.9679 9.8667 1.3975 0.6346 2.6667 1.8960 9.8760 1.5500 0.5540 2.6570
50.0000 1.8438 9.6944 1.4736 0.6827 2.8389 1.7820 9.6890 1.5930 0.6250 2.8440
55.0000 1.7196 9.5222 1.5497 0.7307 3.0111 1.6800 9.5200 1.6260 0.6930 3.0130
60.0000 1.5954 9.3500 1.6258 0.7788 3.1833 1.5910 9.3670 1.6520 0.7570 3.1660
65.0000 1.5723 9.3065 1.6286 0.7991 3.2268 1.5120 9.2290 1.6730 0.8160 3.3040
70.0000 1.5491 9.2631 1.6315 0.8194 3.2703 1.4410 9.1040 1.6880 0.8700 3.4290
75.0000 1.5260 9.2196 1.6343 0.8397 3.3138 1.3790 8.9920 1.7010 0.9200 3.5410
80.0000 1.5028 9.1761 1.6371 0.8601 3.3572 1.3230 8.8900 1.7110 0.9660 3.6430
85.0000 1.4797 9.1326 1.6400 0.8804 3.4007 1.2740 8.8000 1.7190 1.0070 3.7330
90.0000 1.4565 9.0892 1.6428 0.9007 3.4442 1.2300 8.7180 1.7250 1.0450 3.8150
95.0000 1.4334 9.0457 1.6456 0.9210 3.4876 1.1900 8.6450 1.7310 1.0790 3.8880
100.0000 1.4102 9.0022 1.6485 0.9413 3.5311 1.1550 8.5790 1.7360 1.1090 3.9540
150.0000 1.2608 8.6871 1.6322 1.1070 3.8463 0.9520 8.2010 1.7640 1.2840 4.3320
200.0000 1.1661 8.4517 1.5862 1.2477 4.0817 0.8830 8.0770 1.7790 1.3390 4.4560
250.0000 1.0634 8.2325 1.5724 1.3642 4.3008 0.8580 8.0360 1.7860 1.3560 4.4970
300.0000 0.9289 8.0783 1.6872 1.3839 4.4550 0.8500 8.0220 1.7890 1.3610 4.5110
350.0000 0.7944 7.9242 1.8020 1.4036 4.6092 0.8470 8.0170 1.7900 1.3630 4.5160
400.0000 0.7111 7.8289 1.8734 1.4155 4.7044 0.8460 8.0160 1.7910 1.3630 4.5170
450.0000 0.6405 7.7483 1.9340 1.4255 4.7850 0.8460 8.0150 1.7910 1.3630 4.5180
500.0000 0.5835 7.6769 1.9767 1.4398 4.8564 0.8460 8.0150 1.7910 1.3630 4.5180
550.0000 0.5467 7.6193 1.9927 1.4607 4.9140 0.8460 8.0150 1.7910 1.3630 4.5180
600.0000 0.5098 7.5617 2.0087 1.4815 4.9717 0.8460 8.0150 1.7910 1.3630 4.5180

56
Table 5.32. Comparison of experimental data with simulated data at 2.0wt% catalyst
loading and temperature at 343K
Reaction time
Experimental
Concentration, kmol/m3
Simulation Concentration, kmol/m3
EG
AA EGMA EGDA Water EG AA EGMA EGDA Water
0.0000 4.0000 12.5333 0.0000 0.0000 0.0000 4.0000 12.5330 0.0000 0.0000 0.0000
5.0000 3.0730 11.3083 0.6291 0.2980 1.2250 3.5760 12.0860 0.4000 0.0240 0.4470
10.0000 2.8430 10.9942 0.7748 0.3822 1.5392 3.2120 11.6600 0.7030 0.0850 0.8730
15.0000 2.6131 10.6800 0.9205 0.4664 1.8533 2.8980 11.2610 0.9320 0.1700 1.2720
20.0000 2.4873 10.4889 0.9810 0.5317 2.0444 2.6280 10.8910 1.1030 0.2690 1.6420
25.0000 2.3615 10.2978 1.0415 0.5970 2.2356 2.3940 10.5520 1.2320 0.3740 1.9810
30.0000 2.2357 10.1067 1.1020 0.6623 2.4267 2.1910 10.2440 1.3300 0.4800 2.2890
35.0000 2.1160 9.9186 1.1533 0.7307 2.6147 2.0140 9.9650 1.4040 0.5820 2.5680
40.0000 1.9963 9.7306 1.2046 0.7991 2.8028 1.8600 9.7150 1.4610 0.6780 2.8180
45.0000 1.8766 9.5425 1.2559 0.8675 2.9908 1.7250 9.4910 1.5070 0.7670 3.0420
50.0000 1.7570 9.3544 1.3072 0.9358 3.1789 1.6070 9.2920 1.5440 0.8480 3.2410
55.0000 1.6373 9.1664 1.3585 1.0042 3.3669 1.5030 9.1150 1.5760 0.9210 3.4180
60.0000 1.5176 8.9783 1.4098 1.0726 3.5550 1.4110 8.9580 1.6030 0.9860 3.5750
65.0000 1.4875 8.9369 1.4286 1.0839 3.5964 1.3300 8.8200 1.6270 1.0430 3.7130
70.0000 1.4574 8.8956 1.4474 1.0952 3.6378 1.2580 8.6980 1.6490 1.0930 3.8350
75.0000 1.4273 8.8542 1.4662 1.1065 3.6792 1.1940 8.5900 1.6700 1.1370 3.9430
80.0000 1.3973 8.8128 1.4849 1.1178 3.7206 1.1370 8.4950 1.6890 1.1750 4.0380
85.0000 1.3672 8.7714 1.5037 1.1291 3.7619 1.0860 8.4110 1.7070 1.2070 4.1220
90.0000 1.3371 8.7300 1.5225 1.1404 3.8033 1.0400 8.3380 1.7240 1.2360 4.1950
95.0000 1.3070 8.6886 1.5413 1.1517 3.8447 1.0000 8.2730 1.7400 1.2600 4.2600
100.0000 1.2769 8.6472 1.5601 1.1630 3.8861 0.9640 8.2160 1.7550 1.2810 4.3170
150.0000 1.0864 8.3542 1.6480 1.2656 4.1792 0.7570 7.9080 1.8610 1.3820 4.6250
200.0000 0.9695 8.1417 1.6693 1.3612 4.3917 0.6870 7.8150 1.9070 1.4050 4.7180
250.0000 0.8492 7.9415 1.7098 1.4410 4.5918 0.6640 7.7850 1.9250 1.4120 4.7480
300.0000 0.7150 7.7908 1.8274 1.4575 4.7425 0.6560 7.7750 1.9310 1.4140 4.7580
350.0000 0.5809 7.6401 1.9450 1.4741 4.8932 0.6530 7.7710 1.9330 1.4140 4.7620
400.0000 0.4909 7.5283 2.0132 1.4959 5.0050 0.6520 7.7700 1.9340 1.4150 4.7630
450.0000 0.4119 7.4263 2.0691 1.5190 5.1071 0.6520 7.7700 1.9340 1.4150 4.7630
500.0000 0.3425 7.3353 2.1170 1.5405 5.1981 0.6510 7.7700 1.9340 1.4150 4.7630
550.0000 0.2873 7.2610 2.1531 1.5597 5.2724 0.6510 7.7700 1.9340 1.4150 4.7630
600.0000 0.2321 7.1867 2.1891 1.5788 5.3467 0.6510 7.7700 1.9340 1.4150 4.7630

57
Table 5.33. Comparison of experimental data with simulated data at 2.0wt% catalyst
loading and temperature at 353K
Reaction time
Experimental
Concentration, kmol/m3
Simulation Concentration, kmol/m3
EG
AA EGMA EGDA Water EG AA EGMA EGDA Water
0.0000 4.0000 12.5333 0.0000 0.0000 0.0000 4.0000 12.5330 0.0000 0.0000 0.0000
5.0000 3.0225 11.2250 0.6467 0.3308 1.3083 3.5290 12.0270 0.4350 0.0360 0.5060
10.0000 2.7636 10.8692 0.8087 0.4277 1.6642 3.1310 11.5400 0.7450 0.1240 0.9930
15.0000 2.5047 10.5133 0.9707 0.5247 2.0200 2.7930 11.0830 0.9640 0.2430 1.4500
20.0000 2.3857 10.3133 1.0086 0.6057 2.2200 2.5050 10.6630 1.1200 0.3750 1.8700
25.0000 2.2668 10.1133 1.0465 0.6868 2.4200 2.2590 10.2830 1.2320 0.5090 2.2500
30.0000 2.1478 9.9133 1.0844 0.7678 2.6200 2.0470 9.9420 1.3150 0.6380 2.5910
35.0000 2.0214 9.7242 1.1480 0.8306 2.8092 1.8640 9.6390 1.3790 0.7570 2.8940
40.0000 1.8951 9.5350 1.2116 0.8934 2.9983 1.7050 9.3730 1.4300 0.8650 3.1600
45.0000 1.7687 9.3458 1.2752 0.9562 3.1875 1.5660 9.1390 1.4750 0.9600 3.3940
50.0000 1.6423 9.1567 1.3388 1.0190 3.3767 1.4440 8.9350 1.5140 1.0420 3.5980
55.0000 1.5159 8.9675 1.4024 1.0817 3.5658 1.3370 8.7570 1.5510 1.1130 3.7760
60.0000 1.3895 8.7783 1.4660 1.1445 3.7550 1.2420 8.6020 1.5850 1.1730 3.9310
65.0000 1.3522 8.7267 1.4889 1.1589 3.8067 1.1580 8.4670 1.6180 1.2240 4.0660
70.0000 1.3150 8.6750 1.5118 1.1733 3.8583 1.0830 8.3490 1.6490 1.2670 4.1840
75.0000 1.2777 8.6233 1.5347 1.1877 3.9100 1.0170 8.2470 1.6790 1.3040 4.2860
80.0000 1.2404 8.5717 1.5576 1.2021 3.9617 0.9580 8.1570 1.7080 1.3340 4.3760
85.0000 1.2031 8.5200 1.5805 1.2164 4.0133 0.9050 8.0790 1.7350 1.3590 4.4540
90.0000 1.1658 8.4683 1.6034 1.2308 4.0650 0.8580 8.0100 1.7610 1.3810 4.5230
95.0000 1.1285 8.4167 1.6263 1.2452 4.1167 0.8160 7.9500 1.7860 1.3990 4.5830
100.0000 1.0913 8.3650 1.6492 1.2596 4.1683 0.7780 7.8970 1.8090 1.4140 4.6360
150.0000 0.8884 8.0700 1.7599 1.3517 4.4633 0.5580 7.6090 1.9610 1.4810 4.9240
200.0000 0.7988 7.9228 1.7918 1.4094 4.6106 0.4800 7.5160 2.0230 1.4970 5.0170
250.0000 0.6951 7.7610 1.8375 1.4674 4.7724 0.4530 7.4840 2.0450 1.5020 5.0490
300.0000 0.5346 7.5408 1.9384 1.5271 4.9925 0.4430 7.4720 2.0530 1.5040 5.0610
350.0000 0.3741 7.3207 2.0392 1.5867 5.2126 0.4390 7.4680 2.0560 1.5040 5.0650
400.0000 0.2904 7.1894 2.0754 1.6343 5.3439 0.4380 7.4670 2.0570 1.5040 5.0660
450.0000 0.2259 7.0804 2.0954 1.6788 5.4529 0.4380 7.4660 2.0580 1.5040 5.0670
500.0000 0.1589 6.9847 2.1335 1.7075 5.5486 0.4380 7.4660 2.0580 1.5040 5.0670
550.0000 0.0884 6.9090 2.1990 1.7127 5.6243 0.4380 7.4660 2.0580 1.5040 5.0670
600.0000 0.0178 6.8333 2.2644 1.7178 5.7000 0.4380 7.4660 2.0580 1.5040 5.0670

58
Table 5.34. Comparison of experimental data with simulated data at 2.0wt% catalyst
loading and temperature at 363K
Reaction time
Experimental
Concentration, kmol/m3
Simulation Concentration, kmol/m3
EG
AA EGMA EGDA Water EG AA EGMA EGDA Water
0.0000 4.0000 12.5333 0.0000 0.0000 0.0000 4.0000 12.5330 0.0000 0.0000 0.0000 5.0000 2.9013 11.0867 0.7508 0.3480 1.4467 3.3870 11.8380 0.5310 0.0820 0.6950 10.0000 2.5956 10.6833 0.9589 0.4456 1.8500 2.8960 11.1660 0.8410 0.2630 1.3670 15.0000 2.2898 10.2800 1.1670 0.5432 2.2533 2.4990 10.5600 1.0300 0.4720 1.9730 20.0000 2.1302 10.0672 1.2734 0.5964 2.4661 2.1740 10.0380 1.1580 0.6690 2.4950 25.0000 1.9707 9.8544 1.3798 0.6495 2.6789 1.9050 9.6010 1.2590 0.8370 2.9320 30.0000 1.8111 9.6417 1.4862 0.7027 2.8917 1.6790 9.2400 1.3490 0.9720 3.2930 35.0000 1.6434 9.4106 1.5904 0.7662 3.1228 1.4880 8.9450 1.4360 1.0760 3.5880 40.0000 1.4758 9.1794 1.6945 0.8297 3.3539 1.3250 8.7020 1.5190 1.1560 3.8310 45.0000 1.3082 8.9483 1.7987 0.8932 3.5850 1.1840 8.5020 1.6000 1.2160 4.0310 50.0000 1.1405 8.7172 1.9029 0.9566 3.8161 1.0630 8.3350 1.6770 1.2610 4.1980 55.0000 0.9729 8.4861 2.0070 1.0201 4.0472 0.9570 8.1950 1.7490 1.2950 4.3380 60.0000 0.8052 8.2550 2.1112 1.0836 4.2783 0.8640 8.0770 1.8150 1.3200 4.4560 65.0000 0.7725 8.2072 2.1290 1.0986 4.3261 0.7830 7.9760 1.8770 1.3400 4.5570 70.0000 0.7397 8.1594 2.1467 1.1136 4.3739 0.7120 7.8890 1.9330 1.3550 4.6440 75.0000 0.7069 8.1117 2.1645 1.1286 4.4217 0.6490 7.8140 1.9840 1.3680 4.7190 80.0000 0.6742 8.0639 2.1822 1.1436 4.4694 0.5930 7.7490 2.0300 1.3770 4.7840 85.0000 0.6414 8.0161 2.2000 1.1586 4.5172 0.5440 7.6920 2.0710 1.3850 4.8410 90.0000 0.6086 7.9683 2.2177 1.1736 4.5650 0.5000 7.6420 2.1080 1.3910 4.8910 95.0000 0.5759 7.9206 2.2355 1.1886 4.6128 0.4620 7.5980 2.1420 1.3970 4.9350 100.0000 0.5431 7.8728 2.2533 1.2037 4.6606 0.4270 7.5590 2.1720 1.4010 4.9740 150.0000 0.3537 7.5992 2.3585 1.2878 4.9342 0.2350 7.3470 2.3440 1.4210 5.1860 200.0000 0.2564 7.4617 2.4155 1.3281 5.0717 0.1720 7.2790 2.4020 1.4260 5.2540 250.0000 0.1689 7.3349 2.4638 1.3674 5.1985 0.1510 7.2560 2.4210 1.4280 5.2770 300.0000 0.1202 7.2508 2.4770 1.4027 5.2825 0.1440 7.2490 2.4280 1.4280 5.2840 350.0000 0.0716 7.1668 2.4903 1.4381 5.3665 0.1420 7.2460 2.4300 1.4280 5.2870 400.0000 0.0608 7.0506 2.3956 1.5436 5.4828 0.1410 7.2450 2.4310 1.4280 5.2880 450.0000 0.0595 6.9263 2.2739 1.6666 5.6071 0.1410 7.2450 2.4310 1.4280 5.2880 500.0000 0.0513 6.8175 2.1816 1.7671 5.7158 0.1400 7.2450 2.4310 1.4280 5.2880 550.0000 0.0327 6.7321 2.1334 1.8339 5.8013 0.1400 7.2450 2.4310 1.4280 5.2880 600.0000 0.0140 6.6467 2.0853 1.9007 5.8867 0.1400 7.2450 2.4310 1.4280 5.2880

59
Table 5.35. Estimated parameters at 0.5 wt% catalyst loading
T K
K1 Lit/Mol Min
K-1 Lit/Mol Min
K2 Lit/Mol Min
K-2 Lit/Mol Min
333 1.81E-04 5.37E-04 1.06E-03 3.73E-03
343 3.79E-04 1.61E-03 1.18E-03 3.86E-03
353 5.23E-04 1.94E-03 1.42E-03 4.80E-03
363 8.06E-04 2.33E-03 2.34E-03 7.01E-03
Table 5.36. Estimated parameters at 1.0wt% catalyst loading
T, K K1
Lit/Mol Min K-1
Lit/Mol Min K2
Lit/Mol Min K-2
Lit/Mol Min 333 4.15E-04 5.88E-04 1.98E-03 4.42E-03
343 8.31E-04 5.94E-04 2.31E-03 5.98E-03
353 8.89E-04 4.89E-04 2.43E-03 8.18E-03
363 1.48E-03 2.49E-04 5.65E-03 1.35E-02
Catalyst Wt% E KJ/mol K 0
0.5 47.32176 5357.593
25.27386 8.989795
1.0 38.04532 429.8043
31.32745 144.321

60
Table 5.37. Estimated parameters at 1.5 wt% catalyst loading
T, K K1
Lit/Mol Min K-1
Lit/Mol Min K2
Lit/Mol Min K-2
Lit/Mol Min 333 1.22E-03 1.40E-03 1.34E-03 3.64E-03
343 1.41E-03 8.29E-04 2.54E-03 6.26E-03
353 1.54E-03 6.06E-04 5.38E-03 1.26E-02
363 2.51E-03 3.58E-04 6.59E-03 1.70E-02
Table 5.38. Estimated parameters at 2.0wt% catalyst loading T, K
K1 Lit/Mol Min
K-1 Lit/Mol Min
K2 Lit/Mol Min
K-2 Lit/Mol Min
333 1.60E-03 1.34E-03 1.24E-03 2.89E-03
343 1.82E-03 1.00E-03 1.87E-03 4.17E-03
353 2.04E-03 6.39E-04 2.56E-03 5.16E-03
363 2.73E-03 2.16E-04 4.76E-03 1.11E-02
Catalyst Wt% E KJ/mol K 0
1.5 22.15049 3.430274
54.80678 574939.4
2.0 16.92696 0.70335
42.86498 6407.92

61
5.2 Effect of catalyst loading on different parameters
5.2.1 Effect on conversion of acetic acid
0 100 200 300 400 500 6000
5
10
15
20
25
30
35
40
45
50
Con
vers
ion
of a
cetic
aci
d, %
Reaction time, min
Catalyst Loading 0.5 gm 1.0 gm 1.5 gm 2.0 gm
0 100 200 300 400 500 6000
5
10
15
20
25
30
35
40
45
50
Con
vers
ion
of a
cetic
aci
d, %
Reaction time, min
Catalyst Loading 0.5 gm 1.0 gm 1.5 gm 2.0 gm
(a) (b)
0 100 200 300 400 500 6000
5
10
15
20
25
30
35
40
45
50
Con
vers
ion
of a
cetic
aci
d, %
Reaction time, min
Catalyst Loading 0.5 gm 1.0 gm 1.5 gm 2.0 gm
0 100 200 300 400 500 6000
5
10
15
20
25
30
35
40
45
50
Con
vers
ion
of a
cetic
aci
d, %
Reaction time, min
Catalyst Loading 0.5 gm 1.0 gm 1.5 gm 2.0 gm
(c) (d)
Fig.5.2.1. Plots (a), (b), (c) and (d) show the effect of catalyst loading on conversion of acetic
acid at varying reaction time and temperature at 333, 343, 353 and 363 K

62
5.2.2 Effect on conversion of ethylene glycol
0 100 200 300 400 500 6000
10
20
30
40
50
60
70
80
90
100
Catalyst Loading 0.5 gm 1.0 gm 1.5 gm 2.0 gm
Con
vers
ion
of e
thyl
ene
glyc
ol %
Reaction time, min
0 100 200 300 400 500 6000
10
20
30
40
50
60
70
80
90
100
Catalyst Loading 0.5 gm 1.0 gm 1.5 gm 2.0 gm
Co
nve
rsio
n o
f eth
ylen
e g
lyco
l %
Reaction time, min
(e) (f)
0 100 200 300 400 500 6000
10
20
30
40
50
60
70
80
90
100
Catalyst Loading 0.5 gm 1.0 gm 1.5 gm 2.0 gm
Con
vers
ion
of e
thyl
ene
glyc
ol %
Reaction time, min
0 100 200 300 400 500 6000
10
20
30
40
50
60
70
80
90
100
Catalyst Loading 0.5 gm 1.0 gm 1.5 gm 2.0 gm
Con
vers
ion
of e
thyl
ene
glyc
ol %
Reaction time, min
(g) (h)
Fig.5.2.2. Plots (a), (b), (c) and (d) show the effect of catalyst loading on conversion of ethylene
glycol at varying reaction time and temperature at 333, 343, 353 and 363 K

63
5.2.3 Effect on selectivity of ethylene glycol mono-acetate
0 10 20 30 40 50 60 70 80 90 10030
35
40
45
50
55
60
65
Catalyst Loading 0.5 gm 1.0 gm 1.5 gm 2.0 gm
Sel
ect
ivity
of E
GM
A,
%
Conversion of ethylene glycol, %
0 10 20 30 40 50 60 70 80 90 10030
35
40
45
50
55
60
65
Catalyst Loading 0.5 gm 1.0 gm 1.5 gm 2.0 gm
Se
lect
ivity
of E
GM
A, %
Conversion of ethylene glycol, %
(i) (j)
0 10 20 30 40 50 60 70 80 90 10030
35
40
45
50
55
60
65
Catalyst Loading 0.5 gm 1.0 gm 1.5 gm 2.0 gm
Sel
ectiv
ity o
f EG
MA
, %
Conversion of ethylene glycol, %
0 10 20 30 40 50 60 70 80 90 10030
35
40
45
50
55
60
65
Catalyst Loading 0.5 gm 1.0 gm 1.5 gm 2.0 gm
Sel
ectiv
ity o
f EG
MA
, %
Conversion of ethylene glycol, %
(k) (l)
Fig.5.2.3. Plots (i), (j), (k) and (l) show the effect of catalyst loading on selectivity of ethylene
glycol mono-acetate at varying ethylene glycol conversion and temperature at 333, 343,
353 and 363 K
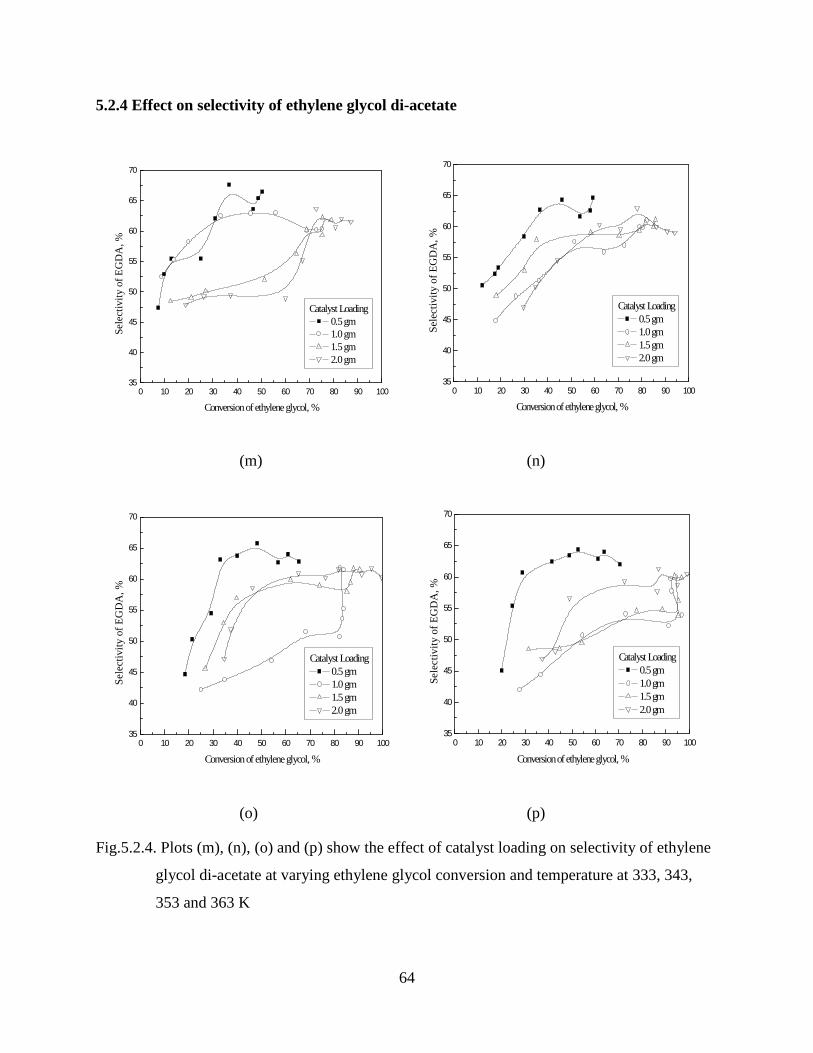
64
5.2.4 Effect on selectivity of ethylene glycol di-acetate
0 10 20 30 40 50 60 70 80 90 10035
40
45
50
55
60
65
70
Catalyst Loading 0.5 gm 1.0 gm 1.5 gm 2.0 gm
Se
lect
ivity
of E
GD
A, %
Conversion of ethylene glycol, %
0 10 20 30 40 50 60 70 80 90 10035
40
45
50
55
60
65
70
Catalyst Loading 0.5 gm 1.0 gm 1.5 gm 2.0 gm
Se
lect
ivity
of E
GD
A,
%
Conversion of ethylene glycol, %
(m) (n)
0 10 20 30 40 50 60 70 80 90 10035
40
45
50
55
60
65
70
Catalyst Loading 0.5 gm 1.0 gm 1.5 gm 2.0 gm
Se
lect
ivity
of E
GD
A,
%
Conversion of ethylene glycol, %
0 10 20 30 40 50 60 70 80 90 10035
40
45
50
55
60
65
70
Catalyst Loading 0.5 gm 1.0 gm 1.5 gm 2.0 gm
Se
lect
ivity
of
EG
DA
, %
Conversion of ethylene glycol, %
(o) (p)
Fig.5.2.4. Plots (m), (n), (o) and (p) show the effect of catalyst loading on selectivity of ethylene
glycol di-acetate at varying ethylene glycol conversion and temperature at 333, 343,
353 and 363 K

65
5.3 Effect of reaction temperature on various parameters
5.3.1 Effect on conversion of acetic acid
0 100 200 300 400 500 6000
5
10
15
20
25
30
35
Con
vers
ion
of a
cetic
aci
d, %
Reaction time, min
333K 343K 353K 363K
0 100 200 300 400 500 6000
5
10
15
20
25
30
35
40
45
Con
vers
ion
of a
cetic
aci
d, %
Reaction time, min
333K 343K 353K 363K
(i) (ii)
0 100 200 300 400 500 6000
5
10
15
20
25
30
35
40
45
Co
nve
rsio
n o
f ace
tic a
cid
, %
Reaction time, min
333K 343K 353K 363K
0 100 200 300 400 500 6000
5
10
15
20
25
30
35
40
45
50
Con
vers
ion
of a
cetic
aci
d, %
Reaction time, min
333K 343K 353K 363K
(iii) (iv)
Fig.5.3.1. Plots (i), (ii), (iii) and (iv) show the effect of reaction temperature on conversion of
acetic acid with varying reaction time and catalyst loading of 0.5, 1.0, 1.5 and 2.0wt%

66
5.3.2 Effect on conversion of ethylene glycol
0 100 200 300 400 500 6000
10
20
30
40
50
60
70
333K 343K 353K 363KC
onv
ersi
on o
f eth
ylen
e gl
yco
l %
Reaction time, min
0 100 200 300 400 500 6000
10
20
30
40
50
60
70
80
90
100
333K 343K 353K 363KC
onve
rsio
n of
eth
ylen
e g
lyco
l %Reaction time, min
(v) (vi)
0 100 200 300 400 500 6000
10
20
30
40
50
60
70
80
90
100
333K 343K 353K 363KC
on
vers
ion
of
eth
ylen
e gl
ycol
%
Reaction time, min
0 100 200 300 400 500 6000
10
20
30
40
50
60
70
80
90
100
333K 343K 353K 363KC
onve
rsio
n of
eth
yle
ne g
lyco
l %
Reaction time, min
(vii) (viii)
Fig.5.3.2. Plots (v), (vi), (vii) and (viii) show the effect of reaction temperature on conversion of
ethylene glycol with varying reaction time and catalyst loading of 0.5, 1.0, 1.5 and
2.0wt%

67
5.3.3 Effect on selectivity of ethylene glycol mono-acetate
0 10 20 30 40 50 60 7030
35
40
45
50
55
60
65
333K 343K 353K 363K
Sel
ectiv
ity o
f EG
MA
, %
Conversion of ethylene glycol %
0 10 20 30 40 50 60 70 80 90 10035
40
45
50
55
60
333K 343K 353K 363K
Sel
ectiv
ity o
f EG
MA
, %
Conversion of ethylene glycol %
(ix) (x)
0 10 20 30 40 50 60 70 80 90 10035
40
45
50
55
60
333K 343K 353K 363K
Sel
ectiv
ity o
f EG
MA
, %
Conversion of ethylene glycol, %
30 40 50 60 70 80 90 10030
35
40
45
50
55
60
65
333K 343K 353K 363K
Sel
ectiv
ity o
f EG
MA
, %
Conversion of ethylene glycol, %
(xi) (xii)
Fig.5.3.3. Plots (ix), (x), (xi) and (xii) show the effect of reaction temperature on selectivity of ethylene
glycol mono-acetate with varying ethylene glycol conversion and catalyst loading of 0.5, 1.0, 1.5
and 2.0wt%

68
5.3.4 Effect on selectivity of ethylene glycol di-acetate
0 10 20 30 40 50 60 70
40
50
60
70
333K 343K 353K 363K
Se
lect
ivity
of E
GD
A, %
Conversion of ethylene glycol %
0 10 20 30 40 50 60 70 80 90 10020
25
30
35
40
45
50
55
60
65
333K 343K 353K 363K
Se
lect
ivity
of E
GD
A, %
Conversion of ethylene glycol %
(xiii) (xiv)
0 10 20 30 40 50 60 70 80 90 10035
40
45
50
55
60
333K 343K 353K 363K
Sel
ect
ivity
of E
GD
A, %
Conversion of ethylene glycol, %
30 40 50 60 70 80 90 10035
40
45
50
55
60
65
70
333K 343K 353K 363K
Se
lect
ivity
of
EG
DA
, %
Conversion of ethylene glycol, %
(xv) (xvi)
Fig.5.3.4. Plots (xiii), (xiv), (xv) and (xvi) show the effect of reaction temperature on selectivity
of ethylene glycol di-acetate with varying ethylene glycol conversion and catalyst
loading of 0.5, 1.0, 1.5 and 2.0wt%

69
5.3.5 Effect on selectivity of ethylene glycol di-acetate with reaction time
0 100 200 300 400 500 60035
40
45
50
55
60
65
70
333K 343K 353K 363K
Se
lect
ivity
of
EG
DA
, %
Reaction time, min
0 100 200 300 400 500 60040
45
50
55
60
65
333K 343K 353K 363K
Se
lect
ivity
of
EG
DA
, %
Reaction time, min
(xvii) (xviii)
0 100 200 300 400 500 600
40
45
50
55
60
333K 343K 353K 363K
Sel
ect
ivity
of E
GD
A, %
Reaction time, min
0 100 200 300 400 500 60035
40
45
50
55
60
65
70
333K 343K 353K 363K
Se
lect
ivity
of
EG
DA
, %
Reaction time, min
(xix) (xx)
Fig.5.3.5. Plots (xvii), (xviii), (xix) and (xx) show the effect of reaction temperature on selectivity of ethylene glycol di-acetate with varying reaction time and catalyst loading of 0.5, 1.0, 1.5 and 2.0wt%

70
0 50 100 150 200 250 300 350 400 450 500 550 6000
10
20
30
40
50
60
70
80
90
100
EGMA% EGDA%
Sel
ectiv
ity%
Reaction Time, min
0 50 100 150 200 250 300 350 400 450 500 550 6000
10
20
30
40
50
60
70
80
90
100
EG% AA%
Con
vers
ion%
Reaction Time, min
(xxi) (xxii)
0 10 20 30 40 50 60 70 80 90 1000
10
20
30
40
50
60
70
80
90
100
EGMA% EGDA%
Sel
ectiv
ity%
Conversion%
%Selectivity Vs EG Conversion
0 50 100 150 200 250 300 350 400 450 500 550 6000.0
0.1
0.2
0.3
0.4
0.5
0.6
0.7
0.8
0.9
1.0
AA EGDA EGMA EG Water
Mol
Fra
ctio
n
Reaction Time, min
Mol Fraction Vs Reaction Time
(xxiii) (xxiv)
Fig.5.3.6. Plots (xxi), (xxii), (xxiii) and (xxiv) show the effect of reaction time on selectivity of EGDA and mol fraction of used reaction system, also effect of EG conversion on selectivity of EGDA at molecular sieve 13X catalyst loading of, 4.0wt%

71
5.4 Parameter estimation
Rate equation based on the individual component of the five component reaction
system, included ethylene glycol, acetic acid as reactant and ethylene glycol mono-
acetate, ethylene glycol di-acetate and water as product has been written in
following manner:
�� � ���
# ��
���� � ��� … . … … … … … . . . $
���� � ����
# ���
���� � ��� … … … … … … … $$
����� �� ������ � �� ��������� … … … … … … … … . .
����� �� ������ � �� ��������� � ���������� � ������������ … . . �
������� � ������ � �� ��������� � ���������� � ������������ … . %
������� ���������� � ������������ … … … … … … … … &
������ � ������ � �� ��������� � ���������� � ������������ … … '
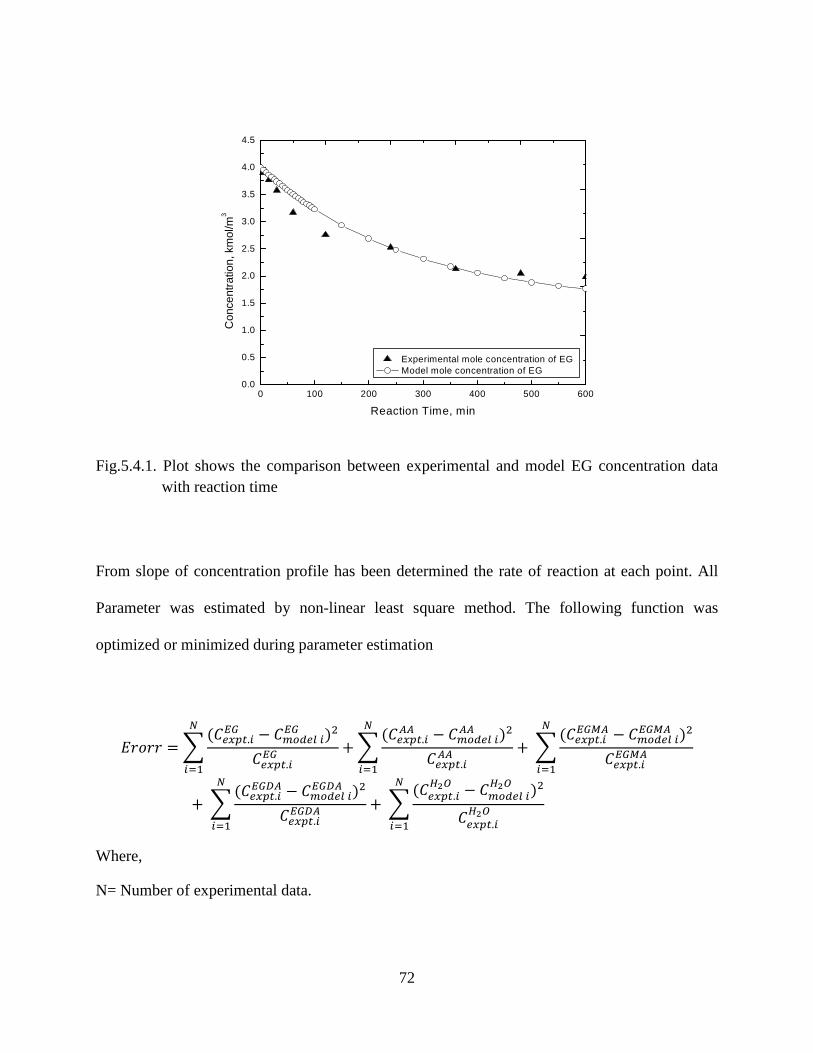
72
0 100 200 300 400 500 6000.0
0.5
1.0
1.5
2.0
2.5
3.0
3.5
4.0
4.5
Experimental mole concentration of EG Model mole concentration of EG
Con
cent
ratio
n, k
mol
/m3
Reaction Time, min
Fig.5.4.1. Plot shows the comparison between experimental and model EG concentration data with reaction time
From slope of concentration profile has been determined the rate of reaction at each point. All
Parameter was estimated by non-linear least square method. The following function was
optimized or minimized during parameter estimation
()*)) + ,-./01.234 � -567.8 234 9�
-./01.234
:
2;�� + ,-./01.2<< � -567.8 2<< 9�
-./01.2<<
:
2;�� + ,-./01.234=< � -567.8 234=< 9�
-./01.234=<
:
2;�
� + ,-./01.234>< � -567.8 234>< 9�
-./01.234><
:
2;�� + ,-./01.2
?@A � -567.8 2?@A 9�
-./01.2?@A
:
2;�
Where,
N= Number of experimental data.

73
0 100 200 300 400 500 600
0
2
4
6
8
10
12 expt. EG conc. expt. AA conc expt. EGMA conc. expt. EGDA conc. expt. Water conc. model. EG conc model. AA conc model. EGMA conc model. EGDA conc model. Water conc
Con
cent
ratio
n, k
mol
/m3
Reaction time, min
Fig.5.4.2. Plot shows the comparison between experimental and model of five component reaction system concentration data with reaction time

Fig.5.4.3. Comparison of experimental and model data for conversion of EG and AAvarying reaction time and catalyst loading of 1.5
0
10
20
30
40
50
60
70
80
90
100
0 100
Co
nve
rsio
n%
Experimental Vs Model
0
10
20
30
40
50
60
70
80
90
100
0 50 100 150
Co
nve
rsio
n%
Experimental Vs Model
74
. Comparison of experimental and model data for conversion of EG and AAvarying reaction time and catalyst loading of 1.5wt%
200 300 400 500 600
Reaction time, min
Experimental Vs Model
Expt. EG conversion
Model EG conversion
150 200 250 300 350 400 450 500 550 600
Reaction time, min
Experimental Vs Model
Expt. AA conversion
Model AA conversion
. Comparison of experimental and model data for conversion of EG and AA with

75
Fig.5.4.4. Comparison of experimental and model data for selectivity of EGDA with varying
reaction time and catalyst loading of 1.5
2.8x10⁻³ 2.8x10⁻³ 2.9x10⁻³ 2.9x10⁻³ 3.0x10⁻³ 3.0x10⁻³ 3.1x10⁻³-7.6
-7.4
-7.2
-7.0
-6.8
-6.6
-6.4
-6.2
-6.0
-5.8
-5.6
-5.4
Re
act
ion
rate
, km
ol/m3 S
1/T (1/K)
Catalyst Linear fit
0.5 gm (E=41.92KJ/mol, R2=0.90)
1.0 gm (E=38.70KJ/mol, R2=0.90)
1.5 gm (E=31.99KJ/mol, R2=0.98)
Fig.5.4.5. Plot shows the activation energy at 0.5, 1.0 and 1.5wt% catalyst loading
0
10
20
30
40
50
60
70
0 100 200 300 400 500 600
Sel
ectiv
ity%
Reaction time
Experimental Vs Model
Expt. EGDA selectivity
Model EGDA selectivity

CHAPTER 6
DISCUSSION

76
DISCUSSION
Esterification of ethylene glycol with acetic acid has been carried out in the presence of Seralite
SRC-120 (as type of Amberlite-120 ion exchange resin) and Molecular Sieve 13x(as Zeolite).
The effect of various parameters has been found for five component reaction system and
Therefore results were divided into several section due to purpose of easily understand. It was
obtained that form reaction time curve profile that as increase reaction time as increase mole
fraction of product, conversion of reactant and selectivity of ethylene glycol di-acetate (EGDA)
but decrease in selectivity of ethylene glycol mono-acetate (EGMA) after 60 min . Observation
table on different catalyst loading, reaction temperature, molar ratio and varying reaction time
were shown in table from 5.1 to 5.18 and table 5.19 to 5.34 were represents the experimental and
simulated data based on concentration of five component reactant and products system. Similarly
the parameters have been estimated with different catalyst loading reported in table 5.35 to 5.38.
Parameters as the rate of reaction, activation energy; pre-exponential factor and equilibrium rate
constant were analyzed for best fit in five component reaction systems. In section 5.2 to 5.4
experimental and estimated data was graphically represented the effect of reaction time on
conversion and selectivity of reactant and product respectively. Here it was found that as initially
as from 60 to 120 min) increase the reaction time, suddenly increased the conversion of acetic
acid (AA) and ethylene glycol (EG) because of the molecule of both reactant collide rapidly in
presence of ion exchange acid catalyst. Maximum conversion of acetic acid was found to be
46.12 to 47 percentages at 353 to 363 K with 1.5 wt% and 2.0 wt% catalysts respectively. It was
found that no much greater effect on reactant conversion either increases temperature or catalyst
loading after 2 hour of the reaction time. Similarly the conversion of ethylene glycol was
investigated and obtained 100 percentage conversions at 353 K with 10 hour reaction time. The

77
selectivity of ethylene glycol mono and di acetate as product also has been investigated with
different reaction temperature, reactant molar ratio and amount of catalyst. First of all elaborate
the selectivity of ethylene glycol mono-acetate (EGMA), which was shown in section 5.2.3.
Based on the selectivity graph it was obtained at starting conversion of EG was given maximum
selectivity of EGMA, due to at starting reaction stage water formation has been low. The water
has formed due to hydrolysis reaction and greatly affects on the reaction system. To avoiding this
problem to reach reaction at equilibrium stage, water has been removed with the help of
distillation column which reported in many literatures. However the most interesting and
valuable product ethylene glycol di-acetate (EGDA) in five component reaction system was
investigated as similar manner as EGMA, but most significant factor in the case of EGDA is
maximum selectivity about 65 to 66 percentage has been obtained in the amount of 0.5wt%
Seralite SRC-120 as a catalyst. Further increasing of catalyst loading and reaction temperature
have no much effect on the selectivity of EGDA, because of as increasing the temperature
Lewis acid sites are formed but Bronsted acid sites are removed, and Bronsted acid sites are
more crucial factor in the catalysis esterification reaction. Hence, if increases the reaction
temperature the Bronsted acid sites were reduced and decreases the activity of catalyst. In the
part of simulation work, this has been done by non linear least square method and Arrhenius law
with the help of Matlab software. It was obtained the equilibrium rate constant increases as
increase the reaction temperature and catalyst loading hence increase the rate of reaction because
of when liquids are heated the particles gain kinetic energy and move faster increasing the
chance of collision between reactant molecules and therefore the increased chance of a fruitful
collision, this effectively means the activation energy. The lowest activation energy about
31.99KJ/mol has been obtained with 1.5wt% amount of catalyst loading. .

CHAPTER 7
CONCLUSION

78
CONCLUSION
Esterification of ethylene glycol with acetic acid in the presence of acid catalysts as Seralite
SRC-120 and Molecular Sieve 13x(as Zeolite) has been carried out generally in two consecutive
steps. First ethylene glycol with acetic acid to produced ethylene glycol mono acetate then
consecutive step form ethylene mono-acetate with acetic acid to ethylene glycol di-acetate.
However the most significant result was obtained from experiment as well as simulation data.
The highest ethylene glycol conversion was obtained 91.21% in 5 hour and mostly it was
converted complete in 10 hours over seralite SRC-120 and 1.5wt% catalyst loading with
temperature at 353 K. Similarly the conversion of acetic acid was found to be 46.12 %. About 65
to 66 percentage selectivity of EGDA has been achieved with amount of 0.5wt% Seralite SRC-
120 as a catalyst. However the previous work has been reported the 54 to 56 percentage of
EGDA selectivity. From figure 5.3.7 was shown the lowest activation energy about 31.99KJ/mol
which is better for fastest esterification reaction. Due to low activation energy hydrolysis
reaction can be controlled well. The experimental data and calculated data was well matched this
means diminishes the chance of error. Molecular Sieve 13X was not given better results, because
it has low active surface area and required more activation energy. In the case of molecular sieve
13X, ethylene glycol conversion was achieved to78.67%. The most appropriate reaction
temperature for esterification of ethylene glycol with acetic acid was achieved at 353K. The
Selectivity of EGMA was reduced with increases of reaction time due to excess water has
formed by hydrolysis backward reversible reaction. It was obtained the equilibrium rate constant
increases as increase the reaction temperature and catalysts loading hence increase the rate of
reaction.

79
Proposed Future Work
1. Esterification ethylene glycol with acetic acid is well emerging area in the field of research
and produces value added product. Which is widely used in many applications such solvent,
perfumery, paint, ink, anti-freezant etc. therefore essential research required.
2. Ethylene glycol with acetic acid can be treated with different acid catalyst and investigate the
different reaction parameters.
3. Since ethylene glycol is obtain from glycerol, which is available in excess amount in the
current market. So esterification of glycerol with acetic acid can be considered as another
reaction system. Biofuel as product has been obtained from glycerol, which can been
attracted toward research.
4. Ethylene glycol can also be treated with different acids and analyzed which is better reaction
system.

80
REFERENCES
1. Altıokka M. R., Çıtak A., Kinetics study of esterification of acetic acid with isobutanol in the
presence of amberlite catalyst, Applied Catalysis A: General, 2003, 239; 141–148.
2. Arvela P. M., Salmia T., Sundell M., Ekman K., Peltonen R., Lehtonen J, Comparison of
polyvinylbenzene and polyolefin supported sulphonic acid catalysts in the esterification of
acetic acid, Applied Catalysis A: General 1999, 184; 25-32.
3. Blagova S., Paradaa S., Bailerb O., Moritzb P., Lamc D., Weinandd R., HasseH, Influence of
ion-exchange resin catalysts on side reactions of the esterification of n-Butanol with acetic
acid Chemical Engineering Science 2006, 61 753 – 765.
4. Chakrabarti A. and Sharma M. M., Esterification Of Acetic Acid With Styrene: Ion
Exchange Resins As Catainsts, Reactive Polymers, 1991; 16:51-59.
5. Chen X., Xu Z. and Okuhara T., Liquid phase esterification of acrylic acid with 1-butanol
catalyzed by solid acid catalysts, Applied Catalysis A: General, 1999, 180; 261-269.
6. Calvar N., B. Gonzalez, Dominguez A., Esterification of acetic acid with ethanol: Reaction
kinetics and operation in a packed bed reactive distillation column, Chemical Engineering
and Processing 2007, 46; 1317–1323.
7. Corma A., Garcia H, Iborra S. and Primo J., Modified Faujasite Zeolites as Catalysts in
Organic Reactions: Esterification of Carboxylic Acids in the Presence of HY Zeolites,
Journal Of Catalysis 1989, 120; 78-87.

81
8. DuPont P.; VCdrine J.C., Paumard E., Hecquet G., Lefebvre F., ,Heteropolyacids supported
on activated carbon as catalysts for the esterification of acrylic acid by butanol Applied
Catalysis A: General, 1995, 129; 2 17-227.
9. DuPont P., Lefebvre F., Esterification of propanoic acid by butanol and 2-ethylhexanol
catalyzed by heteropolyacids pure or supported on carbon, Journal of Molecular Catalysis A:
Chemical, 1996, 114299-307.
10. Das, J., Parida, K.M., Heteropoly acid intercalated Zn/Al HTlc as efficient catalyst for
esterification of acetic acid using n-butanol, Journal of Molecular Catalysis A: Chemical,
2007, 264; 248–254.
11. Dash, S.S., Parida, K.M., Esterification of acetic acid with n-butanol over manganese nodule
leached residue, Journal of Molecular Catalysis A: Chemical 2007, 266; 88–92.
12. Grob S. and Hasse H., Thermodynamics of Phase and Chemical Equilibrium in a Strongly
Nonideal Esterification System, J. Chem. Eng. Data 2005, 50; 92-101.
13. Gangadwala J., Mankar S. and Mahajani S, Esterification of Acetic Acid with Butanol in the
Presence of Ion-Exchange Resins as Catalysts, Ind. Eng. Chem. Res., 2003, 42; 2146-2155.
14. Gelosa D., Ramaioli M. and Valente G., Chromatographic Reactors: Esterification of
Glycerol with Acetic Acid Using Acidic Polymeric Resins, Ind. Eng. Chem. Res., 2003, 42;
6536-6544.
15. Izci, A., Bodu, F., Liquid-phase esterification of acetic acid with isobutanol catalyzed by ion-
exchange resins, Reactive & Functional Polymers, 2007, 67; 1458–1464.

82
16. Ince E., Kinetic of esterification of ethyl alcohol by acetic acid on a catalytic resin, Journal of
Engineering Sciences, 2002, 8; 109-113.
17. Inui K., Kurabayashi T., Direct synthesis of ethyl acetate from ethanol over Cu-Zn-Zr-Al-O
catalyst Satoshi Sato Applied Catalysis A: General 2002, 237; 53–61
18. Jayadeokar, S.S. and Sharma, M.M., Ion exchange resin catalysed etherification of ethylene
and propylene glycols with isobutylene.
19. Kirumakki S. R., Nagaraju N., Narayanan S, A comparative esterification of benzyl alcohol
with acetic acid over zeolites H, HY and HZSM5, Applied Catalysis A: General, 2004, 273;
1–9.
20. Lee, M.J.; Wu, H.-T.; Kang, C. H.; Lin H.M., Kinetic behavior of amyl acetate synthesis
catalyzed by acidic cation exchange resin, J. Chin. Inst. Chem. Eng., 1999, 30; 117.
21. Liu, W.T. and Tan, C.S., Liquid-phase esterification of propionic acid with n-butanol, Ind.
Eng. Chem. Res., 2001, 40; 3281-3286.
22. Liao, X.; Zhu, Y.; Wang, S. G.; Li, Y., Producing triacetylglycerol with glycerol by two
steps: esterification and acetylation, Fuel Processing Technology, 2009, 90; 988–993.
23. Lee M. J.; Wu H.T. and Lin H. Kinetics of Catalytic Esterification of Acetic Acid and Amyl
Alcohol over Dowex, Ind. Eng. Chem. Res. 2000, 39; 4094-4099.
24. Liu,Y.; Lotero, E.; Goodwin, J. G., Effect of carbon chain length on esterification of
carboxylic acids with methanol using acid catalysis Journal of Catalysis, 2006, 243; 221–
228.

83
25. Liu,Y.; Lotero, E.; Goodwin, J. G., Effect of water on sulfuric acid catalyzed Esterification,
Journal of Molecular Catalysis A: Chemical 2006, 245; 132–140.
26. Lilja, J.; Aumo J.; Salmi T.; Yu M.D. , Arvela P. M., Sundell M., Ekman K., Peltonen R.,
Vainio H., Kinetics of esterification of propanoic acid with methanol over a fibrous polymer-
supported sulphonic acid catalyst Applied Catalysis A: General 2002, 228; 253–267.
27. Liu Y.; Lotero E.; Goodwin, J. G., A comparison of the esterification of acetic acid with
methanol using heterogeneous versus homogeneous acid catalysis Journal of Catalysis 2006,
242; 278–286.
28. Mazzotti, M.; Neri, B.; Gelosa, D. and Morbidelli M, Dynamics of a Chromatographic
Reactor: Esterification Catalyzed by Acidic Resins, Ind. Eng. Chem. Res. 1997, 36; 163-
3172.
29. Peters, T.A.; Benes N.E.; Holmen, A.; Keurentjes, J.T.F., Comparison of commercial solid
acid catalysts for the esterification of acetic acid with butanol, Applied Catalysis A: General,
2006, 297; 182–188.
30. Rabindran, B. J.; Pandurangan A., A highly efficient catalyst for the Esterification of acetic
acid using n-butyl alcohol, Journal of Molecular Catalysis A: Chemical, 2005, 237;146–154.
31. Rabindran B. J.; Pandurangan, A., Catalytic application of Al-MCM-41 in the esterification
of acetic acid with various alcohols, Applied Catalysis A: General, 2005, 288; 25–33.
32. Ronnback, R.; Salmi, T.; Vuori, A.; Haario, H.; Lehtonen, J.; Sundqvist , A. and Tirronen E.,
Development of a kinetic model for the esterification of acetic acid with methanol in the

84
presence of a homogeneous acid catalyst, Chemical Engineering Science, 1997, 52; 3369
3381.
33. Shlechter, N.; Donald, F. O., and Marshak S., Esterification of 2,3-buty lene glycol with
acetic acid, Indutrial and Engineering Chemistry, 2002, 37; 9.
34. Schmid, B.; Do1ker, M. and Gmehling, J., Esterification of Ethylene Glycol with Acetic
Acid Catalyzed by Amberlyst 36, Ind. Eng. Chem. Res., 2008, 47; 698-703.
35. Teo, H.T.R.; Saha, B., Heterogeneous catalysed esterification of acetic acid with isoamyl
alcohol: kinetic studies, Journal of Catalysis 2004, 228; 174–182.
36. Tanaka, K.; Yoshikawa, R.; Ying, C.; Kita, H.; Okamoto, K., Application of zeolite
membranes to esterification reactions, Catalysis Today 2001, 67; 121–125.
37. Verhoef, J.M.; Kooyman, J. P.; Peters, A.J.; Bekkum, H. V., Micropor. Mesopor. Mater,
1999, 27; 365.
38. Wu, K.C.; Chen, Y.W., An efficient two-phase reaction of ethyl acetate production in
modified ZSM-5 zeolites, Applied Catalysis A: General 2004, 257; 33–42.
39. Yu, W.; Hidajat, K.; Ray, A. K., Determination of adsorption and kinetic parameters for
methyl acetate esterification and hydrolysis reaction catalyzed by Amberlyst 15, Applied
Catalysis A: General 2004, 260; 191–205.
40. Yadav, G.D.; Thathagar, M.B., Esterification of maleic acid with ethanol over cation-
exchange resin catalysts, Reactive & Functional Polymers 2002, 52; 99–110.
41. Yadav, G.D.; Kulkarni, H.B., Ion-exchange resin catalysis in the synthesis of isopropyl
lactate, Reactive & Functional Polymers 2000, 44; 153–165.

85
42. Yeramian, A. A.; Gottifredi, J. C. and Cunningham, R. E.,Vapor-Phase Reactions Catalyzed
by Ion Exchange Resins II. Isopropanol-Acetic Acid Esterification, Journal of Catalysis,
1968, 12; 257-262.
43. Zhang, Y.; Ma, L.; Yang J., Kinetics of esterification of lactic acid with ethanol catalyzed by
cation-exchange resins, Reactive & Functional Polymers 2004, 61; 101–114.
Web references
[1.] http://www.spiritus-temporis.com/ethylene-glycol/see-also.htm
[2.] IUPAC Compendium of Chemical Terminology 2nd Edition 1994, 66, 1129 (1997).
[3.] http://en.wikipedia.org/wiki/Dehydration.
[4.] http://en.wikipedia.org/wiki/Acetylation
[5.] http://science.jrank.org/pages/2573/Esterification.html#ixzz0mWCUWuPH
[6.] http://chemicalland21.com
[7.] http://www.alibaba.com/product-tp/245683519/SERALITE_SRC_120
[8.] http://www.desiccachemical.com/molecular13x.html