a taxometric analysis of the latent structure of ... · a taxometric analysis of the latent...
TRANSCRIPT

A Taxometric Analysis of the Latent Structure of Psychopathy:Evidence for Dimensionality
Jean-Pierre GuayUniversite de Montreal and Institut Philippe-Pinel de Montreal
John RuscioCollege of New Jersey
Raymond A. KnightBrandeis University
Robert D. HareUniversity of British Columbia
The taxonomic status of psychopathy is controversial. Whereas some studies have found evidence thatpsychopathy, at least its antisocial component, is distributed as a taxon, others have found that both majorcomponents of psychopathy—callousness/unemotionality and impulsivity/antisocial behavior—appearto distribute as dimensions and show little evidence of taxonicity. In the present study, recent advancesin taxometric analysis were added to P. Meehl’s (1995) multiple consistency tests strategy for assessingtaxonicity, and they were applied to Psychopathy Checklist—Revised (R. D. Hare, 2003) ratings of 4,865offenders sampled from multiple forensic settings. The results indicated that both the individualcomponents of psychopathy and their interface are distributed dimensionally. Both the implications ofthese results for research in psychopathy and the integration of these findings with previous taxometricstudies of psychopathy are discussed.
Keywords: psychopathy, taxometrics, latent structure, antisocial behavior
Psychopathy is a personality disorder that comprises a distinctcluster of emotional, interpersonal, and behavioral characteristics(e.g., emotional detachment, callousness, irresponsibility, impul-sivity) and one that is characterized by a disregard for the societalrules and the rights of others (Hare, 1996). Its association withviolence (Porter & Woodworth, 2006) and its usefulness as a riskfactor in predicting criminal recidivism (Douglas, Vincent, &Edens, 2006) have increased its prominence in the last decade inboth criminology and psychopathology. The origins of our currentconceptualization of the construct can be traced to Cleckley’s(1976) classic description of the syndrome. He delineated itscharacteristics, however, without addressing the issue of whether itrepresents the coalescence of extreme manifestations on a numberof dimensional traits or constitutes a taxon (i.e., a distinct, nonar-bitrary entity or class).
The first formalized assessment tool for measuring psychopathywas Hare’s (1980) operationalization of the construct in the Psy-chopathy Checklist (PCL) and its revision, the PCL–R (Hare,
1991, 2003). Although Hare conceptualized the PCL as a way ofindicating how closely an individual approximated the “prototypicpsychopath” and proposed a PCL–R cutting score of 30 (out of 40)to consider a person sufficiently close to the psychopath prototype,he also recognized that viable arguments could be made for usingthe PCL–R to obtain dimensional scores.
It behooves the researcher who postulates the existence of ataxon in a particular domain and undertakes taxometrics in pursuitof that taxon to provide adequate theoretical justification for thesearch (Lenzenweger, 2004). Taxonicity implies both a nonarbi-trary latent category and a particular causal structure. The mostwidely accepted theoretical understanding of taxonicity and thestrongest examples of taxa have focused on entities specified bythe conjunction of a distinct pathology and etiology (Meehl, 1973,1992). Even though evidence for specific genetic, biological, andenvironmental correlates of a syndrome might ultimately be ac-counted for adequately either by dimensional or taxonic models,the absence of any such etiological evidence should preclude thesearch for a taxon. Consequently, the theoretical case for hypoth-esizing the possibility that psychopathy may be distributed as ataxon revolves around evidence for specific genetic, neurobiolog-ical, cognitive, and affective covariates of the construct that areconsistent with the hypothesis that a specific etiology or specificetiologies may account for it. This evidence makes plausible thesearch for taxonicity, but does not confirm the existence of a taxon,and is not inconsistent with dimensional explanations.
Two- (Harpur, Hakstian, & Hare, 1988; Harpur, Hare, & Hak-stian, 1989), three- (Cooke & Michie, 2001), and four-factor(Hare, 2003; Hare & Neumann, 2006) models of the PCL have allidentified two overarching components involving impulsivity–antisocial behavior and affective–interpersonal features. Because
Jean-Pierre Guay, Ecole de criminologie, Universite de Montreal, Mon-treal, Quebec, Canada, and Institut Philippe-Pinel de Montreal, Montreal,Quebec, Canada; John Ruscio, Department of Psychology, College of NewJersey; Raymond A. Knight, Department of Psychology, Brandeis Univer-sity; Robert D. Hare, Department of Psychology, University of BritishColumbia, Vancouver, British Columbia.
We thank Robert Krueger and Scott Lilienfeld for the very insightfulcomments on a draft of this article.
Correspondence concerning this article should be addressed to Jean-Pierre Guay, School of Criminology, University of Montreal, C.P. 6128,Succusale Centre-ville, Montreal, Quebec, H3C 3J7 Canada. E-mail: [email protected]
Journal of Abnormal Psychology Copyright 2007 by the American Psychological Association2007, Vol. 116, No. 4, 701–716 0021-843X/07/$12.00 DOI: 10.1037/0021-843X.116.4.701
701

these two components have consistently yielded distinct patternsof correlations with characteristics relevant to psychopathy, dif-ferent models of specific underlying processes have been proposedfor each (e.g., Bloningen, Hicks, Krueger, Patrick, & Iacono, 2005;Fowles & Dindo, 2006; Patrick & Zempolich, 1998). Such modelsraise the possibility that either or both factors may be distributed astaxa. A brief survey of some of the correlative evidence in thegenetic, neurobiological, cognitive, and affective domains pro-vides an adequate justification to support a taxonomic investiga-tion.
There is considerable evidence from adoption and twin geneticstudies, including those of twins reared apart, indicating thatgenetic factors play a significant role in the likelihood that a personwill commit a criminal act (Gottesman & Goldsmith, 1994; Groveet al., 1990; Mednick, Gabrielli, & Hutchings, 1984) and alsoincrease the probability that an individual will be diagnosed withantisocial personality disorder (APD) during his or her lifetime(Cadoret, Yates, Troughton, Woodworth, & Stewart, 1995; Ge etal., 1996; Lyons et al., 1995). Although behavioral genetic re-search suggests that the Factor 2 features may have higher herita-bility than those of Factor 1 (Depue, 1996; Edelbrock, Rende,Plomin, & Thompson, 1995; Krueger, 2000; Mason & Frick, 1994;but see Livesley, 1998, for contrary evidence), there are also datasupporting the importance of independent genetic influences in themanifestation of Factor 1 (Patrick, 2003; Taylor, Loney, Bobadilla,Iacono, & McGue, 2003).
A number of neurobiological deficits or anomalies have beenidentified in both psychopathic criminals and “successful” psycho-paths, who have largely avoided contact with the criminal justicesystem or extended incarceration. For instance, both specific neuro-logical structural features in the amygdala, orbito-frontal cortex, andhippocampus (e.g., Blair, 2004; Mitchell, Colledge, Leonard, & Blair,2002; Raine, 2001; Raine et al., 2004; Tiihonen et al., 2000) andfunctional anomalies in the amygdala/hippocampal formation, para-hippocampal gyrus, ventral striatum, anterior and posterior cingulatedgyri, and fronto-temporal cortex (e.g., Kiehl, Hare, Liddle, & Mc-Donald, 1999; Kiehl et al., 2001; Kiehl et al., 2004; Muller et al.,2003; Vollm et al., 2004) have been linked to the syndrome or itscomponents. Some speculations have been proposed about a compre-hensive and integrated mapping of these deficits onto psychopathy(Blair, Mitchell, & Blair, 2005) and onto the two major PCL–Rfactors by which they are assessed (Patrick, 2003). An understandingof the latent distribution of the PCL–R and its factors could substan-tially advance the search for such an integration.
Psychopathic individuals have been found to be deficient on anumber of cognitive (e.g., Herve, Hayes, & Hare, 2003; Morgan &Lilienfeld, 2000; Newman & Lorenz, 2003) and affective tasks(e.g., Blair, 2001; Blair et al., 2002; Patrick, 2001; Williamson,Harpur, & Hare, 1991) that map onto the structural features notedabove. Psychopaths’ difficulty in shifting a dominant behaviorwhen contingencies have been reversed (Newman & Lorenz,2003) and their difficulties with working memory and other as-pects of executive functioning (Morgan & Lilienfeld, 2000;Seguin, 2004) implicate deficits in their orbito-frontal cortex. Incontrast, psychopaths’ impairments in passive avoidance learning(Newman & Kosson, 1986), dysfunctional response to another’ssadness or fear (Blair, 1995), reduced augmentation of the startlereflex by threat primes (Levenston, Patrick, Bradley, & Lang,2000), impaired aversive conditioning (Raine, Venables, & Wil-
liams, 1996), and deficient processing of fearful expressions(Blair, Colledge, Murray, & Mitchell, 2001) are perhaps betteraccounted for at the neural level by deficiencies in the functions ofthe amygdala (Blair, 2004) or in the integration of frontal-limbicprocesses (Hare, 2003; Muller et al., 2003). Although speculativemodels to integrate these deficits have been proposed (e.g., Blair etal., 2005; Fowles & Dindo, 2006), unpacking the complexity of thedevelopment of the underlying core processes (Seguin, 2004) andmapping onto the specific behavioral patterns in psychopathy haveremained elusive.
Such correlations with specific genetic, neurobiological, cogni-tive, and affective processes suggest the possibility that specificneurobiological deficiencies may be necessary antecedents of psy-chopathy. Although dimensional models may be proposed to ac-count for such causes (e.g., Benning, Patrick, Blonigen, Hicks, &Iacono, 2005; Miller, Lynam, Widiger, & Leukefeld, 2001), ataxonic distribution is a viable theoretical possibility that must beinvestigated. Resolution of this issue of the latent structure ofpsychopathy is not only important for developing theoretical mod-els of the etiology and course of psychopathy, but also it hascritical implications for determining optimal investigative strate-gies and for specifying the ideal psychometric qualities of scalesconstructed both for clinical and dispositional decision making(Krueger, 1999; Meehl, 1992; Ruscio & Ruscio, 2004a). Becauseof the prominence of PCL–R ratings in risk assessment instru-ments (e.g., Quinsey, Harris, Rice, & Cormier, 1998) and itswidespread use in legal dispositional decisions (Edens & Petrila,2006), such scaling issues have substantial practical import. Con-sequently, a number of studies have addressed the problem ofpsychopathy’s latent distribution (Edens, Marcus, Lilienfeld, &Poythress, 2006; Guay & Knight, 2003; Harris, Rice, & Quinsey,1994; Marcus, John, & Edens, 2004; Skilling, Quinsey, & Craig,2001; Vasey, Kotov, Frick, & Loney, 2005) but with mixed results.Many of these prior studies have unfortunately suffered fromsampling and methodological weaknesses that have limited theirability to provide a definitive answer to this question.
Both of the studies that found no evidence for taxonic latentstructures analyzed self-report data. Guay and Knight (2003) con-ducted a taxometric investigation of the components of psychop-athy with the Multidimensional Assessment of Sex and Aggression(MASA; Knight & Cerce, 1999). The MASA is a self-reportinventory that covers multiple domains (childhood experiences,family and social relationships, school and work experiences,alcohol and drug use, and sexual and aggressive behavior andfantasies) and was developed to supplement archival records.Participants were 330 sex offenders, 155 generic criminals, and 93community controls, who had been tested on paper-and-pencil andcomputerized versions of the MASA. A total of 11 scales measur-ing conning and superficial charm, emotional detachment andbehavioral problems, and impulse control were generated withfactor analysis in combination with a Rasch model. The varioustaxometric techniques (mean above minus below a cut [MAMBAC;Meehl & Yonce, 1994], maximum covariance analysis [MAXCOV;Meehl, 1973], maximum eigenvalue [MAXEIG; Waller & Meehl,1998]) that were assessed all generated results consistent with adimensional structure, with no evidence of taxonicity. Marcus,John, and Edens (2004) evaluated a sample of 309 incarceratedoffenders (51.6% African American, 37.5% Caucasian, 8% His-panic, 2.9% other, and 91.3% male) with the Psychopathic Per-
702 GUAY, RUSCIO, KNIGHT, AND HARE
sonality Inventory (PPI; Lilienfeld & Andrews, 1996). The authorsperformed MAMBAC, MAXEIG, and latent mode (L-Mode;Waller & Meehl, 1998) analyses, and their results showed noevidence of taxonicity. Both studies may have compromised theirability to identify a taxon because of the potential for increasednuisance covariation in self-report data that is produced by re-sponse styles and biases. Malingering and positive impressionmanagement, dishonesty, lack of insight, semantic aphasia, andnegative emotionality are common when studying psychopathywith self-report instruments (Lilienfeld & Fowler, 2006), such asthe MASA or the PPI, along with other aspects related to methodvariance could have artifactually increased the correlation of scaleswithin the taxon, and the complement and thereby reduced thepotential to identify a taxon.
Harris et al. (1994) analyzed data collected from 653 mentallydisordered participants from a maximum-security institution, whohad been adjudicated not guilty by reason of insanity. Although theauthors argued that their results provided evidence for a taxon,several methodological ambiguities of their study undermine theirconclusion. First, their sample comprised a select, potentiallybiased group of offenders (Marcus et al., 2004). Second, with theexception of their application of Meehl’s (1995) taxometric anal-yses, most of the statistical procedures used by Harris et al. (1994)lacked empirical support as methods for distinguishing betweentaxonic and dimensional structures. The validity of their iterativemethods approach has not been tested by any Monte Carlo studies,and the distributions of Bayesian probabilities can readily beU-shaped, even when the latent structure is dimensional, especiallywhen a large number of items are used as in the Harris et al. study.Third, their exclusive use of file reviews introduced severe limi-tations. The data for accurately rating Factor 1 items in archivalfiles is often missing (Hare, 2003). Moreover, insufficient fileinformation can lead raters to score items for which data aremissing or inadequate from information on related items (Alpert,Shaw, Pouget, & Lim, 2002), thereby decreasing item covariationwithin the putative taxon, increasing item correlation across thetaxon and complement, and increasing the potential to find apseudo-taxon. File reports often focus on salient, egregious Factor2 antisocial behaviors that may make ratings more vulnerable toraters’ a priori taxonic (Beauchaine & Waters, 2003) or itemcontingency (Bolt, Hare, Vitale, & Newman, 2004) biases and maythereby increase the probability of pseudo-taxonicity. In this re-gard, it is interesting that Harris et al. found evidence for a taxononly in their Factor 2 analyses. Fourth, the authors used an ad-mixed sample in which they used some matching procedures. Thealleged taxon might have been an artifact of their sampling strat-egy. This possibility could have been avoided by rerunning theiranalyses within samples, or they could have presented a contin-gency table of sample membership and taxon/complement assign-ment. Fifth, Harris et al. did not have access to the simulationprograms used in the present study, which generate taxonic anddimensional comparison data to analyze as an interpretive aid.Without this, they did not notice the limited range and low valuesof the covariances that their MAXCOV analyses generated. Con-sequently, they may not have scaled the ordinate of their graphsappropriately for the interpretation of the curves calculated fromtheir data. A more extended ordinate makes their apparentlypeaked curve look flat and dimensional.
Later, Skilling et al. (2001) replicated Harris et al.’s (1994)results, with a similar methodology, but this time by analyzing asample of 1,111 boys. At first sight, their results appear to supportthe taxonic structure of psychopathy, but, once again, methodolog-ical problems plague the study. First, the authors unnecessarilydichotomized their items for MAXCOV, which weakens this pro-cedure (Ruscio, 2000). Second, the authors used the goodness-of-fit index (GFI) to determine the nature of the latent structure. In thetwo studies that have examined the GFI systematically (Cleland,Rothschild, & Haslam, 2000; Haslam & Cleland, 2002), it hasbeen shown to discriminate poorly between taxonic and dimen-sional structure. Moreover, because both taxonic and dimensionalstructures can yield GFIs well above .90, no universally applicablethreshold has emerged, even for data that GFI handles well.Examining the consistency of base-rate estimates has intuitiveappeal and is widely recommended and practiced, but nobody hasever actually established that taxonic structure does in fact yieldmore consistent estimates across a realistic range of data parame-ters. A recent factorial Monte Carlo study (Ruscio, 2006) foundthat MAMBAC, MAXCOV, and MAXEIG analyses seldomyielded lower standard deviations for taxonic structure than fordimensional structure. More often than not, they were basically thesame. Ambiguous MAMBAC and MAXCOV results may be pro-duced by a positive skew of indicators or by low endorsement ratesin the case of binary indicators. Rising MAMBAC curves andapparent (but low) peaks toward the right side of MAXCOVcurves, highly consistent base-rate estimates, and a high GFI areall as consistent with a latent dimension whose indicators arepositively skewed (low endorsement) as they are with a smalltaxon.
Skilling, Harris, Rice, and Quinsey (2002) used the same par-ticipants as the Harris et al. (1994) study to investigate the taxonicstructure of APD, PCL–R, and the Child and Adolescent TaxonScale (CATS), a derived instrument based on eight items associ-ated with the taxon in the Harris et al. article. The authors per-formed MAMBAC and MAXCOV analyses and concluded thatthere was evidence supporting a taxon both for APD and forCATS. They failed to report the amplitude of the mean differencesin MAMBAC and the covariance scores in MAXCOV. Otherproblems identified in the Harris et al. article, such as possiblerater file review and graph comparison biases, absence of taxonbase-rate estimates, the potentially misleading admixed sample,and limited ordinate values also apply to the Skilling et al. study.
Vasey, Kotov, Frick, and Loney (2005) studied a sample of 386children and adolescents to test the latent structure of psychopathy.The authors used two versions (parent and student) of the Antiso-cial Process Screening Device (APSD; Frick & Hare, 2001) toassess psychopathic characteristics. Along with evidence of ataxon for broad antisocial behavior, the authors claimed that theyhad found evidence for a psychopathy taxon. Specifically, withMAXEIG on the five subscales of youth self-report and parent-report APSD, the results produced graphs consistent with a taxonicstructure with an average base rate of .08. Their L-Mode analysesalso suggested taxonicity with a base rate of .04. Unfortunately,sample composition may easily explain the presence of the allegedtaxon. In order to “increase the chances of detecting a psychopathytaxon (should one exist),” the authors Vasey et al. (2005, p. 420)added an extra 60 juvenile offenders to an already heterogeneous
703LATENT STRUCTURE OF PSYCHOTHERAPY

sample of 283 children and adolescents (boys and girls) recruitedfrom middle schools and 43 referred boys with severe emotional,behavioral, or learning problems. Vasey et al.’s two studies ofchildren and adolescents were also limited by their lack of com-parison curves for taxonic and dimensional data to help interprettheir results. Some of their interpretations of curves as indicatingtaxonicity are questionable. Moreover, their strongest results camefrom data in which they combined separate community and clin-ical samples, increasing the potential for identifying pseudo-taxa(Ruscio & Ruscio, 2004a). As the authors indicated, their bestevidence identifies a taxon with a base rate that is too broad forpsychopathy and that may be more accurately interpreted as anexternalizing syndrome.
Recently, Edens et al. (2006) investigated the latent structure ofpsychopathy with the PCL–R in a sample of 876 male prisoninmates and individuals who were court ordered into residentialdrug treatment programs (59% Caucasian, 31% African American,10% Hispanic). The authors used a double strategy in which theyconducted taxometric analyses on Hare’s (2003) four-factor solu-tion and used the same combination of items (as well as the eightitems that correlated most highly with the PCL–R total score intheir sample) that had been used by Harris et al. (1994) to produceapparently taxonic results. Their results provided no evidence oftaxonicity.
The four studies that profess to offer support for the hypothesisthat the latent structure of psychopathy is taxonic do not provideconvincing data to support this claim. Consequently, we conductedthe present study in which Meehl’s (1995) taxometric method wasapplied to PCL–R ratings of 4,865 offenders sampled from mul-tiple prison settings and that was assessed by both interviews andarchival file review. In addition to a large representative sample,the putative psychopathy taxon was sufficiently large to affordpowerful taxometric analyses, including the generation of simu-lated taxonic and dimensional data with which to compare theresearch data results. Of the sample in the present study, 19% (n �927) had a score of 30 or higher. The present sample also permittedthe construction and analysis of several indicator sets with whichto assess the latent structure of psychopathy and permitted detailedanalyses of subsamples to examine and eliminate potential sam-pling biases. The sample was subdivided by security level andethnic status, and separate subsample analyses were computed.Hare’s (2003) four-factor solution to the PCL–R was used as thebasis of the primary analyses, with composite scores for eachfactor serving as indicators. Additional analyses were performedwith items within each of these four factors—as well as theaffective–interpersonal features and impulsivity–antisocial behav-ior factors—as indicators to assess the taxonicity of each. Thus, thepresent study addressed the methodological shortcomings of priorstudies and allowed a convincing test of the taxonicity of psychop-athy and its components.
Method
Participants
The initial sample of participants consisted of 5,408 male prisoninmates incarcerated in North American institutions. Data werecollected from 15 different samples across Canada (British Co-lumbia, Ontario, and Quebec) and the United States (Wisconsinand North Carolina).
Sample 1 comprised 322 male inmates of a federal medium secu-rity institution in British Columbia, all serving sentences of 2 years ormore. They had volunteered to take part in several research projects.Sample 2 was composed of 121 male inmates of a provincial prisonin British Columbia, all serving sentences of less than 2 years. Sample3 contained 369 male inmates of a minimum security institution inWisconsin (Kosson, Smith, & Newman, 1990). In Sample 4, 106male inmates of the Institute Phillipe-Pinel de Montreal in the prov-ince of Quebec were evaluated with a French version of the PCL–R(Cote & Hodgins, 1991) just prior to conditional release from mini-mum, medium, or maximum security federal prisons. Sample 5 wascomposed of 87 inmates of a medium security prison in Kingston,Ontario (Serin, 1991). Sample 6 was composed of 152 African Amer-ican male inmates (Kosson, Smith, & Newman, 1990). Sample 7included 60 male inmates from a medium security prison in NorthCarolina (Johnson, 1990). In Sample 8, 197 male inmates from afederal medium security prison in British Columbia were evaluatedwith the PCL–R. Sample 9 included 172 male inmates from a federalforensic psychiatric institution in British Columbia. Most were par-ticipants in a violent offender treatment program. Participants fromSample 10 were 1,190 male inmates (526 Caucasian and 664 AfricanAmerican) from a state medium security prison in Wisconsin. InSample 11, 320 male inmates (227 Caucasian, and 73 Native Amer-ican; 220 sex offenders) from a federal medium security prison inBritish Columbia that houses violent offenders were interviewed(Porter et al., 2000). Sample 12 was composed of 60 male inmates(rapists) in federal medium and maximum security institutions inOntario (Brown & Forth, 1997). Sample 13 consisted of 185 maleinmates of a medium security institution in British Columbia. Sample14 was composed of 427 male violent offenders in a federal mediumsecurity institution in Ontario (Simourd & Hoge, 2000). Finally,Sample 15 was composed of a representative sample of 1,640 maleoffenders, admitted to a regional reception and assessment center ofthe Correctional Service of Canada.
The average age of the 2,300 offenders for whom data wereavailable was 31.1 (SD � 9.3; range: 17–81). In general, thereliability of the PCL–R ratings was quite acceptable. Cronbach’salpha was .85, and the intraclass correlation was .86 for a singlerating and .92 for the average of two ratings. Intraclass correlationcoefficients (ICC) for single ratings (ICC1) on Factor 1 and Factor2 of the PCL–R were respectively.75 and .85, and for averagedratings (ICC2) they were .85 and .92. For the four facets (Hare,2003), coefficients ranged from .67 to .84 for single ratings andfrom .80 to .91 for averaged ratings. To qualify as a PCL–R rater,individuals had to receive proper training in the use of the instru-ment. For a more detailed description of the sample compositionand the rating procedures, see Hare (2003). Participants withmissing information on any one of the items (n � 543) wereexcluded, and analyses for the present study were performed on the4,865 participants with complete PCL–R protocols.
Measures
Psychopathy was assessed with the PCL–R (Hare, 1991). Allparticipants were assessed with the semistructured interview andfile information. The PCL–R is a 20-item clinical rating scale thatmeasures interpersonal, affective, and socially deviant features ofpsychopathy. The mean score on the PCL–R for the entire samplewas 21.9 (SD � 7.9).
704 GUAY, RUSCIO, KNIGHT, AND HARE

Taxometric Analyses
Two taxometric procedures were performed on each indicatorset: MAMBAC and MAXEIG. A third procedure, L-Mode, wasperformed only on the indicators in the primary analyses, whichpossessed sufficient variation to render a factor analysis meaning-ful. These three procedures are based on independent mathematicalderivations and therefore can contribute nonredundant evidence oflatent structure. Below, we note how MAMBAC and MAXEIGanalyses were conducted, both of which involve a number ofchoice points in their implementation. For detailed descriptionsof the logic and the mathematical underpinnings of all threeprocedures, see the primary publications cited above; on theavailable options for implementing each procedure and sugges-tions for making informed choices, see Ruscio and Ruscio(2004b, 2004c).
MAMBAC was performed with composite input indicators (i.e.,by selecting one of the k variables to serve as the output indicatorand summing the remaining k – 1 variables to serve as the inputindicator for each of k analyses). To accommodate the constrainedindicator response scales, 50 equally spaced cutting scores begin-ning and ending with at least 25 cases from each end of the inputindicator (larger values were used as necessary to stabilize theshapes near the ends of the curves) and 10 internal replicationsin the calculation of each curve (to reduce the obfuscatinginfluence of cutting between equal-scoring cases, as describedin Ruscio, Haslam, & Ruscio, 2006) were used. MAMBAC curveswere not smoothed, and full panels of curves for each indicator setwere examined to determine whether an averaged curve adequatelyrepresented the overall trend. Averaged curves are presented here toconserve space. Panels are available from Jean-Pierre Guay uponrequest.
MAXEIG was performed with composite input indicators (inthe same way, and for the same reason, as in MAMBAC), exceptfor the primary series of analyses. In that instance, there wassufficient response variation to perform MAXEIG in the moretraditional manner (i.e., by selecting one of the k variables to serveas the input indicator and by using the remaining k – 1 variables asoutput indicators for each of the k analyses). Each analysis used 50windows that overlapped 90% with adjacent subsamples and 10internal replications. Once again, smoothing was not performed,and full panels of curves were examined to ensure that the aver-aged curve fairly represented the overall pattern of results.
Analyses of Comparison Data
As a supplement to the inspection of taxometric results that canaid interpretation in ambiguous circumstances, bootstrap methodswere used. This involves generating samples of taxonic and di-mensional comparison data that reproduce the sample size, indi-cator distributions, and indicator correlations in a sample of re-search data and then submitting each bootstrap sample to the sametaxometric analyses as the research data. Comparison data weregenerated with an updated version of the algorithm outlined inRuscio and Ruscio (2004a) and in Ruscio, Ruscio, and Keane(2004) that implements two new features. First, comparison dataare allowed to be multidimensional rather than constrained tounidimensionality (in the full sample for dimensional comparisondata, within groups for taxonic comparison data). Second, indica-
tor distributions are generated by using a standard bootstrap tech-nique rather than by being copied from the research data. The basicbootstrap approach of resampling, with replacement, treats a sam-ple distribution as an unbiased estimate of the population distri-bution and draws new samples accordingly. Specifically, N scoresfor each indicator in a bootstrap sample of comparison data weredrawn at random (with replacement) from the original score dis-tribution. Programs including these features have been shown toreproduce indicator distributions and correlations with good pre-cision and negligible bias (Ruscio, Ruscio, & Meron, in press).Simulating taxonic comparison data requires a criterion variablethat contains classification codes for each case. The PCL–R cutoffscore of 30 that has been typically used for the diagnosis ofpsychopathy in research studies was used for all analyses. Thiscutoff was originally generated to maximize the overall hit rate ofPCL–R for global judgments of psychopathy (cf. Hare, 2003). Ithas been used in hundreds of laboratory and applied researchstudies, and its utility has been supported by its generation andvalidation of many of the processing and neurological differencesdiscussed in the introductory paragraphs. There are also itemresponse theory data that suggest that the score of 30 indicates thesame level of psychopathy across North American male offenders,English male offenders, female offenders, and male forensic psy-chiatric patients (Hare & Neumann, 2006). Consequently, it con-stitutes a reasonable cutoff for our taxonomic analyses. Becausethere might be some differences in offenders whose PCL–Rs werescored only from file reviews and those scored from a combinationof file and interview assessments (Hare, 2003), we included in ourstudy only protocols that were rated with both informationalsources. We assigned the 927 cases with PCL–R total scores at orexceeding 30 to the putative taxon. We assigned all others to theputative complement. We generated 10 samples of taxonic and 10samples of dimensional comparison data for each analysis.
An examination of the results for taxonic and dimensionalcomparison data helps to ensure that apparently dimensional re-sults do not stem from too small a sample size, inadequate repre-sentation of putative taxon members, insufficiently valid indica-tors, problematically high levels of nuisance covariance, or otherunacceptable aspects of the data. The extent to which the resultsfor the research data are better reproduced by those within thesampling distribution yielded by analyses of taxonic or dimen-sional comparison data sets supports the validity of the corre-sponding structural inference.
As an objective adjunct to the interpretation of curve shapes, wecalculated a quantitative index. The fit of the averaged curve forthe research data to the averaged curves in the sampling distributionsof taxonic and dimensional comparison data sets was assessed byusing an approach introduced by Ruscio and Ruscio (2004b) and thatwas refined by Ruscio et al. (in press). First, fit is calculated for thecomparison data generated to represent each structure:
FitRMSR � ���yres,data � ysim,data�2
N, (1)
where yres.data refers to a data point on the curve for the researchdata, ysim.data refers to the corresponding data point on the curvefor comparison data, and N is the number of data points on eachcurve. Lower values of FitRMSR reflect better fit, with perfect fit
705LATENT STRUCTURE OF PSYCHOTHERAPY
represented by a value of 0. Equation 1 is calculated twice, once toassess the fit of the research curves to those for taxonic comparisondata (FitRMSR-tax) and once to assess the fit for dimensionalcomparison data (FitRMSR-dim). Then, these two values are inte-grated into a single comparison curve fit index (CCFI):
CCFI �FitRMSR-dim
FitRMSR-dim � FitRMSR-tax. (2)
CCFI values can range from 0 to 1, with lower values suggestingbetter fit for dimensional structure and higher values suggestingbetter fit for taxonic structure. The index is symmetrical about .50in that this middle value represents equivalent fit for both struc-tures. It is important to note that the CCFI indexes the relative fitof taxonic and dimensional structural models, not the absolutegoodness of fit of either model. In a preliminary test of this type ofcurve fit index (Ruscio, 2004), latent structure was correctlyclassified with high precision in analyses of the 700 Meehl andYonce (1994) samples of taxonic and dimensional data. In aMonte Carlo study that included a much broader range of dataconditions (Ruscio et al., in press), this index significantlyoutperformed several of the most popular taxometric consis-tency tests.
Results
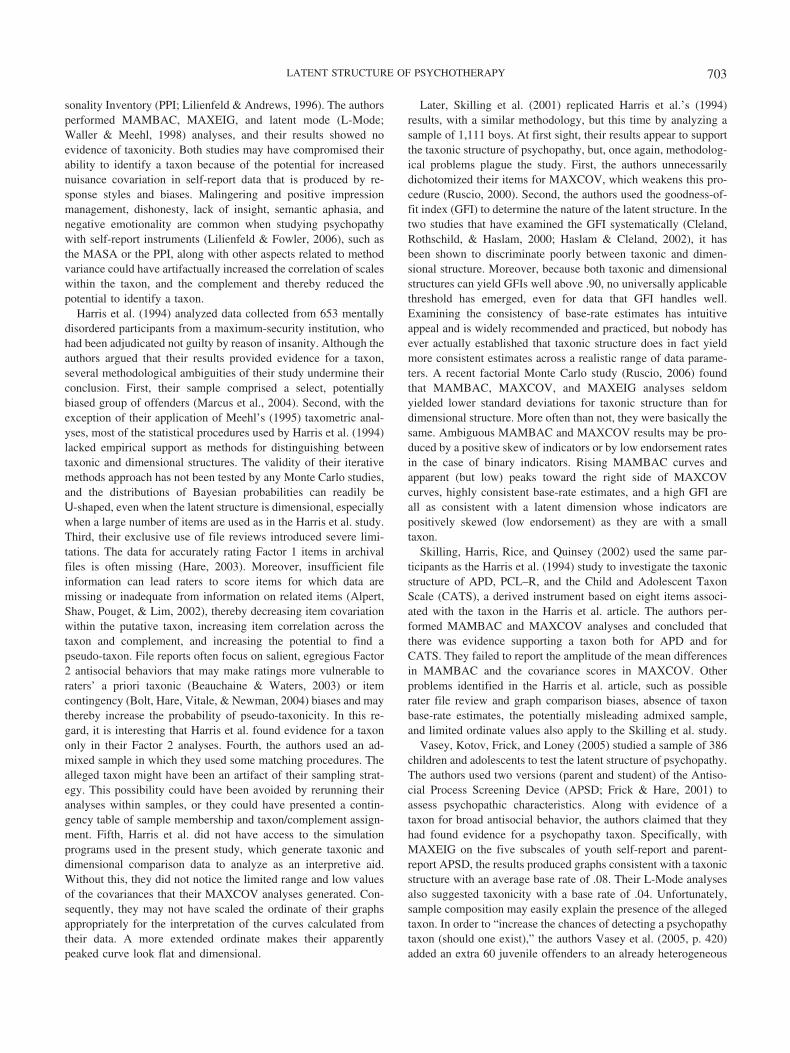
In the first series of analyses, composite indicators wereformed in accordance with Hare’s (2003) four-factor model;items assigned to each factor (referred to here as facets) weresummed to yield one indicator a piece.1 These analyses areprimary in the sense that the structure of psychopathy wasrepresented by all four facets: interpersonal, affective, lifestyle,and antisocial. Descriptive statistics for both various sub-samples used in the analyses and the entire sample are presentedin Table 1. The results for MAMBAC, MAXEIG, and L-Modeanalyses of the summative indicators appear in Figure 1. Theseanalyses yielded quite clear and consistent results. Curve shapeswere highly consistent with what one would expect for dimen-sional structure and were quite similar to the curves generated forsimulated dimensional comparison data. This same conclusion wasalso reflected in the CCFI values, which strongly favor a dimen-sional interpretation (see Table 2 for all CCFI results). Althoughthere was a modest level of consistency among the MAMBAC
base-rate estimates, as well as among the MAXEIG estimates, thiswas not true of the L-Mode estimates (see Table 3 for summariesof all taxon base-rate estimates). In addition to the notable dis-crepancies across procedures’ estimates, the results were muchbetter reproduced by the dimensional than by the taxonic compar-ison data. Thus, the totality of evidence suggests that these fourtheoretically derived composite indicators of psychopathy do notrepresent a taxonic construct. Rather, individual differences appearmore consistent with dimensional structure.
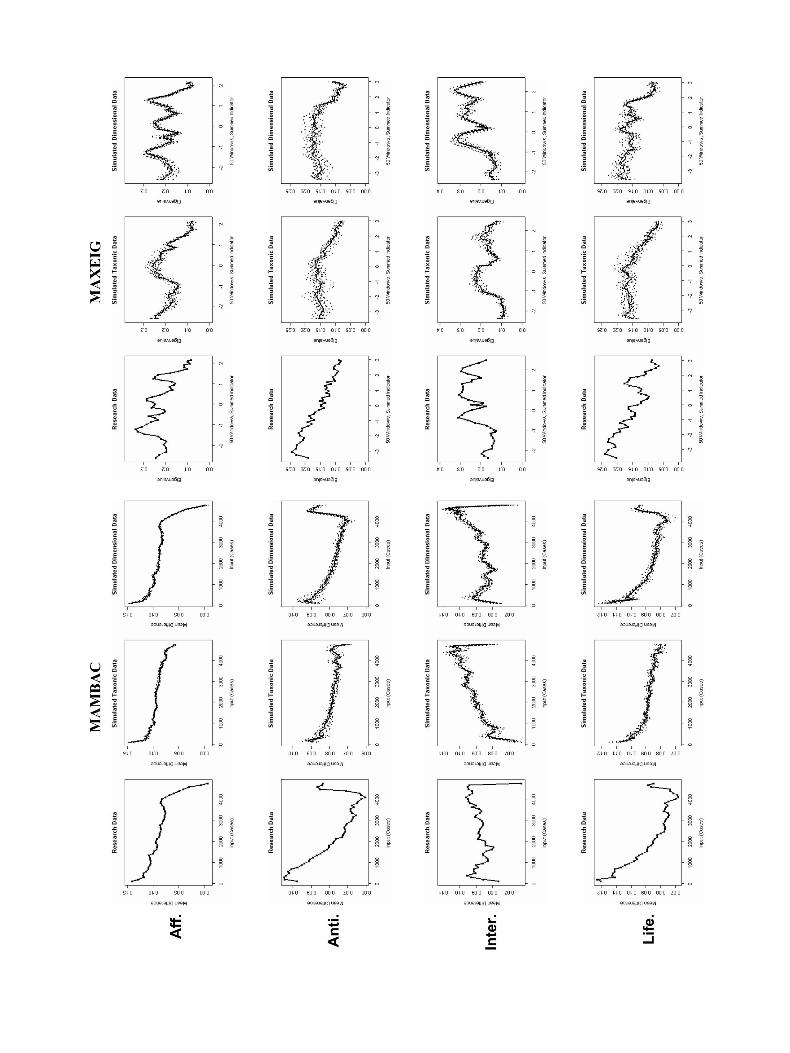
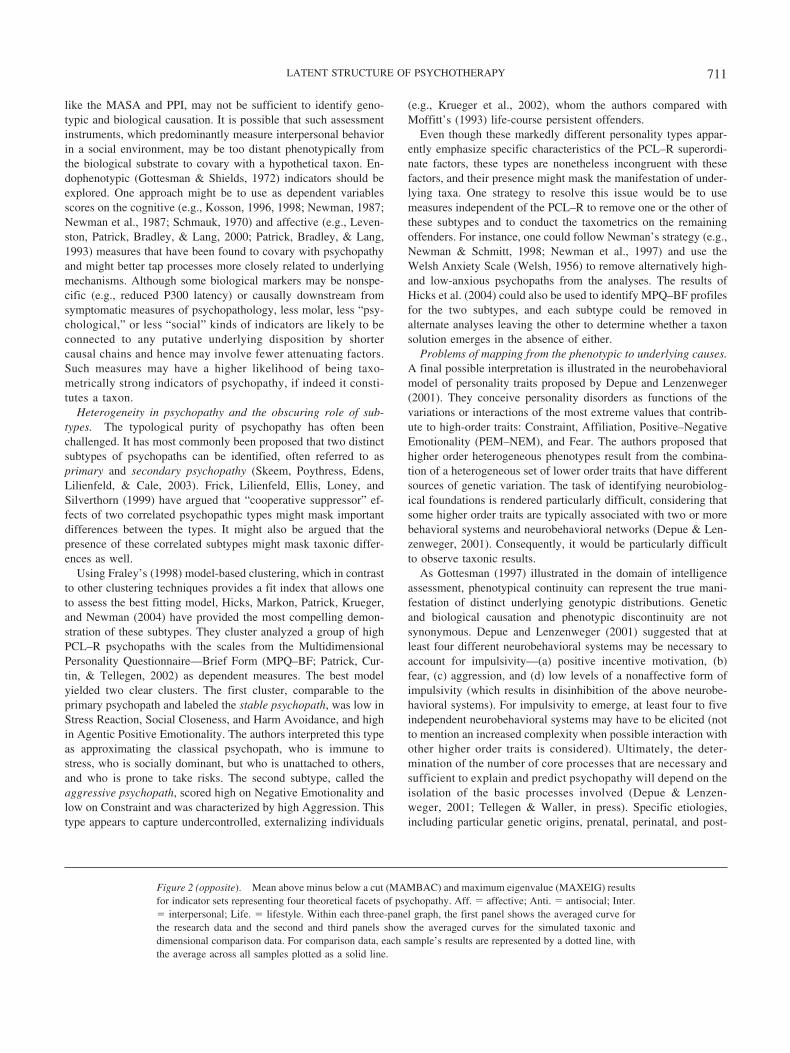
The second series of taxometric analyses was performed totest the latent structure of each of the four theoretical facets ofpsychopathy. The results for MAMBAC and MAXEIG analysesof indicator sets representing each facet (affective: four indica-tors; antisocial: five indicators; interpersonal: four indicators;and lifestyle: five indicators) appear in Figure 2. In analyses ofthe research data, no taxonic peaks emerged, and CCFI valuessupported—in seven out of eight analyses—an inference ofdimensional structure for each facet. Taxon base-rate estimatesvaried substantially within analyses, and they were generallybetter reproduced by the dimensional than by the taxonic com-parison data. Thus, although the results are not as prototypicallydimensional in appearance as in the first series of analyses, noevidence in support of a taxon was obtained for any of the fourtheoretical facets.
The final series of taxometric analyses examined the latentstructure of PCL–R Factors 1 and 2 by using separate sets ofindicators to represent each. The results for MAMBAC andMAXEIG analyses of indicator sets representing PCL–R Factors 1(8 indicators) and 2 (10 indicators) appear in Figure 3. None of thecurves for the research data contain the peaks that would beexpected of taxonic data, an interpretation supported by CCFIvalues in three out of four analyses (the exception was an ambig-uous value supportive of neither structure). Moreover, taxon base-rate estimates were inconsistent within and across procedures.Results for comparison data suggest that either latent structurecould have given rise to such estimates. Hence they are notparticularly informative in these analyses. To the extent that the
1 A series of preliminary analyses with MAMBAC were performed onall possible combinations of indicators. None of the curves appearedtaxonic. These curves are available from Jean-Pierre Guay on request.
Table 1Psychopathy Checklist—Revised (PCL–R) Descriptive Statistics for Subsamples
Indicator set
Allsubjects
Causianonly
AfricanAmerican
onlyMin.
securityMed.
securityMax.
securityFederalsample
M SD M SD M SD M SD M SD M SD M SD
Summative 21.9 7.9 23.2 7.6 22.8 7.3 23.9 7.9 23.5 7.2 22.6 7.4 19.3 8.2Affective 3.6 2.1 3.7 2.2 4.1 2.0 4.0 2.4 3.6 2.1 3.6 2.3 3.1 2.2Antisocial 4.8 2.1 4.9 2.1 4.9 2.0 5.1 2.1 4.8 2.0 4.7 2.0 4.4 2.2Interpersonal 5.9 2.5 6.4 2.3 5.8 2.2 6.9 2.3 6.4 2.4 6.1 2.4 5.1 2.9Lifestyle 5.8 2.8 6.1 2.6 5.9 2.6 5.8 2.6 6.3 2.5 6.5 2.6 5.0 3.0PCL–R Factor 1 8.4 3.8 8.7 3.8 9.0 3.4 9.2 4.0 8.8 3.6 8.3 3.8 7.5 3.9PCL–R Factor 2 11.7 4.7 12.5 4.2 11.7 4.0 12.7 4.2 12.7 4.3 12.6 4.3 10.1 5.4
Note. Min. � minimum; Med. � medium; Max. � maximum.
706 GUAY, RUSCIO, KNIGHT, AND HARE
results for these two factors hint at latent structure, they suggest adimensional interpretation. In any event, there is no evidence thateither the Affective/Interpersonal (Factor 1) or the Lifestyle/Antisocialty (Factor 2) features of the PCL–R factor are distributedas a taxon.
Follow-up analyses were performed for each indicator setwithin subsamples consisting of (a) inmates in maximum secu-rity prisons, (b) inmates in medium security prisons, (c) inmatesin minimum security prisons, (d) African American inmates, (e)Caucasian inmates, and (f) inmates from a representative sam-ple of subjects incarcerated in Canadian federal institutions.These analyses yielded far too many curves to present here, butall CCFI values are provided in Table 2. For each indicator set,results across subsamples were consistent with those in the fullsample in supporting an inference of dimensional structure.
Discussion
Summary of Results
Overall, the observed results support a dimensional structurefor psychopathy and its components as measured by the PCL–R.Whether considered separately or in combination, none of theanalyses provided results consistent with a taxonic structure.The primary analyses—those performed with four theoreticallybased composite indicators—yielded unambiguously dimen-sional results, and the follow-up analyses produced results thatdid not follow the patterns observed for prototypical taxonic ordimensional data. Nonetheless, we believe that the totality ofevidence warrants a dimensional interpretation for several rea-sons. First, none of the MAMBAC or MAXEIG curves gener-ated peaks supportive of a taxonic structure. Second, a curve fit
Figure 1. Mean above minus below a cut (MAMBAC), maximum eigenvalue (MAXEIG), and latent mode(L-Mode) results for the summative indicators. Within each three-panel graph, the first panel shows the averagedcurve for the research data, and the second and third panels show the averaged curves for the simulated taxonicand dimensional comparison data. For comparison data, each sample’s results are represented by a dotted line,with the average across all samples plotted as a solid line.
707LATENT STRUCTURE OF PSYCHOTHERAPY

index based on bootstrapped sampling distributions of resultsfor taxonic and dimensional comparison data consistently sug-gested dimensional structure. Third, taxon base-rate estimateswere inconsistent across analyses, and, more often than not, the
means and standard deviations of these estimates were betterreproduced by the dimensional than by the taxonic comparisondata. Fourth, regardless of how the sample was divided, thesesame results were found.
Table 2Comparison Curve Fit Index (CCFI) Values for MAMBAC and MAXEIG Analyses
Indicator setFull
sampleMax.
securityaMed.
securitybMin.
securityc
AfricanAmerican
onlyCaucasian
onlyFederalsampled
MAMBAC analyses
Summative .272 .293 .325 .393 .279 .369 .318Affective .132 .420 .294 .332 .330 .294 .224Antisocial .420 .313 .402 .398 .361 .221 .400Interpersonal .220 .422 .247 .278 .414 .359 .337Lifestyle .429 .448 .471 .360 .356 .290 .201PCL–R Factor 1 .407 .604 .362 .606 .566 .499 .485PCL–R Factor 2 .500 .576 .472 .464 .460 .459 .447
MAXEIG analyses
Summative .265 .338 .339 .422 .290 .345 .459Affective .291 .371 .431 .352 .359 .543 .423Antisocial .537 .501 .428 .426 .470 .403 .499Interpersonal .194 .395 .395 .379 .409 .376 .256Lifestyle .340 .421 .483 .480 .352 .477 .198PCL–R Factor 1 .424 .438 .453 .503 .506 .565 .390PCL–R Factor 2 .386 .508 .473 .408 .441 .486 .472
Note. CCFI values � .50 support dimensional structure and appear in bold print; CCFI values � .50 support taxonic structure. MAMBAC � mean aboveminus below a cut; MAXEIG � maximum eigenvalue; Max. � maximum; Med. � medium; Min. � minimum; PCL–R � Psychopathy Checklist—Revised.a Samples 9 and 12. b Samples 1, 5, 7, 8, 11, 13, and 14. c Samples 2, 3, and 6. d Sample 15.
Table 3Summary of Taxon Base-Rate Estimates
Indicator set
MAMBAC MAXEIG L-Mode
Estimates M SD Estimates M SD Mode 1 Mode 2
Summative 4 .54 .08 4 .66 .07 .00 .80Sim. Tax. Data .65 .07 .43 .02Sim. Dim. Data .54 .04 .62 .06
Affective facet 4 .95 .10 6 .55 .23Sim. Tax. Data .74 .15 .59 .16Sim. Dim. Data .94 .12 .50 .20
Antisocial facet 5 .53 .11 10 .68 .24Sim. Tax. Data .56 .05 .61 .15Sim. Dim. Data .51 .07 .56 .20
Interpersonal facet 4 .56 .21 6 .42 .11Sim. Tax. Data .36 .24 .50 .11Sim. Dim. Data .52 .18 .37 .15
Lifestyle facet 5 .59 .09 10 .66 .20Sim. Tax. Data .57 .05 .63 .09Sim. Dim. Data .55 .08 .61 .13
PCL–R Factor 1 8 .60 .11 28 .52 .18Sim. Tax. Data .56 .10 .52 .20Sim. Dim. Data .57 .09 .52 .20
PCL–R Factor 2 10 .68 .07 45 .69 .20Sim. Tax. Data .60 .06 .60 .17Sim. Dim. Data .69 .14 .61 .18
Note. MAMBAC � mean above minus below a cut; MAXEIG � maximum eigenvalue; L-Mode � latent mode; Sim. Tax. Data � Simulated taxonicdata; Sim. Dim. Data � simulated dimensional data; PCL–R � Psychopathy Checklist—Revised.
708 GUAY, RUSCIO, KNIGHT, AND HARE

Integration of Current Results With Previous Studies
These results are consistent with the results found by Guay andKnight (2003) with the MASA, by Marcus et al. (2004) with thePPI, and by Edens et al. (2006) with the PCL–R, but they differfrom the four studies that identified taxonic distributions. It islikely that the methodological problems in the four studies thatfound evidence for a taxon, delineated in the introductory para-graphs and addressed in the present study, are responsible for thedifferences in the results. The present study counters the problemsof these prior studies by accessing a larger and more representativesample and by analyzing subsamples in detail to ensure thatparticular selection criteria did not bias results. Both interview andarchival file review were used in arriving at PCL–R scores, andonly those offenders for whom ratings on all items were possiblewere included, guaranteeing a more complete and detailed cover-age of both Factor 1 and Factor 2 content and guarding against thebiasing tendency for raters to use related items to arrive at judg-ments for items with insufficient information. Finally, more so-phisticated analytic procedures were introduced, including thecomparison of simulated taxonic and dimensional comparisonsgenerated from the same sample and quantitative analyses of curvefits to reduce some of arbitrariness of the interpretation of theresults.
Interpretations of the Dimensional Results
The clear and strong indications of the dimensionality of psy-chopathy can be interpreted in several ways. These range from theacceptance of psychopathy as dimensional and possibly an ex-treme on one or more normative personality traits, to questioningthe PCL–R as the appropriate assessment to uncover a taxon, toconsiderations about the homogeneity of psychopathy and thepotential multiplicity of its underlying core processes. We considereach of these alternative perspectives in turn.
Psychopathy as a dimension. Consistent with the results ofthese taxometric analyses, we might conclude that both the latentstructure of psychopathy and its core factors may best be inter-preted as dimensionally distributed. A shortcoming of taxometricanalysis is its failure to parameterize any particular alternativedimensional model (Krueger, 2006). Consequently, the disconfir-mation of a taxonic model does not suggest or corroborate anyparticular alternative model, but rather is simply consistent withresearch that supports the hypothesis that personality disorders ingeneral may be best conceptualized as distinct configurations ofextreme scores on personality traits, affective and cognitive com-petences, or neurobiological processes that exist on a continuumwith normal functioning (e.g., Widiger, 1993; Widiger & Costa,1994). Using the perspective of the five-factor model (FFM; Mc-Crae & Costa, 1990, Lynam (2002) has recently presented datathat support the application of a dimensional conceptualization topsychopathy. He argued both from expert-generated FFM psy-chopathy prototypes and correlations of the FFM with measures ofpsychopathy that the psychopath could be described as low on allfacets of Agreeableness, and low in the dutifulness, deliberation,and self-discipline facets of Conscientiousness. Mixed resultsemerged for Neuroticism and Extraversion. For Neuroticism,whereas the facets of anxiety, self-consciousness, and perhapsvulnerability and depression were low for the psychopath, the
facets of impulsivity and angry hostility were high. The Extraver-sion facet of excitement seeking was high for the psychopath, butthe facets of warmth and perhaps positive emotions were low.Lynam (2002) concluded that psychopathy could best be concep-tualized by extreme scores on a collection of FFM personalitytraits. More generally, Bishopp & Hare (2005) have reported thata multidimensional scaling analysis of the data set used in thepresent study provided support for a multidimensional structurewithin the PCL–R, corroborating the hypothesis that psychopathycan be viewed as an extreme variant of multiple dimensions ofpersonality. Psychopathy might also be conceptualized within theframework of an “externalizing spectrum” of personality and psy-chopathology (Krueger, 2006).
Conceiving of psychopathy as a dimension carries several im-plications about optimal strategies for studying the disorder. Itargues for moving away from extreme group designs that attemptto distinguish psychopaths from nonpsychopaths or from trichoto-mizing PCL–R scores and assuming that discrete groups have beenformed for comparison purposes (Lilienfeld, 1994) and towarddimensional designs, such as the quantitative, latent trait model-based approach proposed by Krueger, Markon, Patrick, and Iacono(2005), in explicating the comorbidity among externalizing disor-ders. The dimensionalization of psychopathy is also consistentwith the recent increase in research on subclinical manifestationsof psychopathy (Hall & Benning, 2006) and suggests the impor-tance of such research for unraveling etiological factors of thecomponents of psychopathy. In this regard, it is interesting to notethat the factors of psychopathy have recently been identified ascritical in predicting sexual coercion against women (Knight &Guay, 2006). The predictive potency of these factors is similar incriminal, noncriminal, juvenile, and adult samples (Knight &Sims-Knight, 2003, 2004), suggesting a gradual rather than a stepfunction in the contribution of psychopathy to rape.
Certainly, the strong evidence for the dimensional latent struc-ture of psychopathy should affect how this construct is conceptu-alized and used in criminal justice proceedings. The PCL–R is themost commonly cited measure in such proceedings (Edens &Petrila, 2006; Hare, 1996) and is a part of some actuarials that havebeen constructed to predict both violence (e.g., Violence RiskAppraisal Guide; Harris, Rice, & Quinsey, 1993) and sexualviolence (e.g., Sex Offender Risk Appraisal Guide; Quinsey et al.,1998). In civil commitment procedures for sexual predators, it issometimes a critical issue to determine whether a defendant is oris not “a psychopath” (Edens & Petrila, 2006). The present re-search suggests that criminal justice language and conceptualiza-tion should be modified and should stop talking about individualsas being “psychopaths.” Rather, lawyers should refer to defendantsas being “high on measures of psychopathy.” Although this ap-pears to be a subtle difference, it may have important conse-quences in reducing juries’ perceptions of particular defendants asdifferent in kind. The suggestion of Edens and Petrila (2006) tohave confidence intervals as well as discrete scores reported incourt cases is also apropos. The data supporting the dimensional-ization of psychopathy also suggest that actuarial measures used inthe criminal justice system might profit from the use of the fullPCL–R score rather than by reifying an arbitrary dichotomizationor by weighting scores to give more leverage to a purported taxon.
PCL–R as a questionable intervening measure. The specific-ity of both the PCL–R and self-report measures of psychopathy,
709LATENT STRUCTURE OF PSYCHOTHERAPY
like the MASA and PPI, may not be sufficient to identify geno-typic and biological causation. It is possible that such assessmentinstruments, which predominantly measure interpersonal behaviorin a social environment, may be too distant phenotypically fromthe biological substrate to covary with a hypothetical taxon. En-dophenotypic (Gottesman & Shields, 1972) indicators should beexplored. One approach might be to use as dependent variablesscores on the cognitive (e.g., Kosson, 1996, 1998; Newman, 1987;Newman et al., 1987; Schmauk, 1970) and affective (e.g., Leven-ston, Patrick, Bradley, & Lang, 2000; Patrick, Bradley, & Lang,1993) measures that have been found to covary with psychopathyand might better tap processes more closely related to underlyingmechanisms. Although some biological markers may be nonspe-cific (e.g., reduced P300 latency) or causally downstream fromsymptomatic measures of psychopathology, less molar, less “psy-chological,” or less “social” kinds of indicators are likely to beconnected to any putative underlying disposition by shortercausal chains and hence may involve fewer attenuating factors.Such measures may have a higher likelihood of being taxo-metrically strong indicators of psychopathy, if indeed it consti-tutes a taxon.
Heterogeneity in psychopathy and the obscuring role of sub-types. The typological purity of psychopathy has often beenchallenged. It has most commonly been proposed that two distinctsubtypes of psychopaths can be identified, often referred to asprimary and secondary psychopathy (Skeem, Poythress, Edens,Lilienfeld, & Cale, 2003). Frick, Lilienfeld, Ellis, Loney, andSilverthorn (1999) have argued that “cooperative suppressor” ef-fects of two correlated psychopathic types might mask importantdifferences between the types. It might also be argued that thepresence of these correlated subtypes might mask taxonic differ-ences as well.
Using Fraley’s (1998) model-based clustering, which in contrastto other clustering techniques provides a fit index that allows oneto assess the best fitting model, Hicks, Markon, Patrick, Krueger,and Newman (2004) have provided the most compelling demon-stration of these subtypes. They cluster analyzed a group of highPCL–R psychopaths with the scales from the MultidimensionalPersonality Questionnaire—Brief Form (MPQ–BF; Patrick, Cur-tin, & Tellegen, 2002) as dependent measures. The best modelyielded two clear clusters. The first cluster, comparable to theprimary psychopath and labeled the stable psychopath, was low inStress Reaction, Social Closeness, and Harm Avoidance, and highin Agentic Positive Emotionality. The authors interpreted this typeas approximating the classical psychopath, who is immune tostress, who is socially dominant, but who is unattached to others,and who is prone to take risks. The second subtype, called theaggressive psychopath, scored high on Negative Emotionality andlow on Constraint and was characterized by high Aggression. Thistype appears to capture undercontrolled, externalizing individuals
(e.g., Krueger et al., 2002), whom the authors compared withMoffitt’s (1993) life-course persistent offenders.
Even though these markedly different personality types appar-ently emphasize specific characteristics of the PCL–R superordi-nate factors, these types are nonetheless incongruent with thesefactors, and their presence might mask the manifestation of under-lying taxa. One strategy to resolve this issue would be to usemeasures independent of the PCL–R to remove one or the other ofthese subtypes and to conduct the taxometrics on the remainingoffenders. For instance, one could follow Newman’s strategy (e.g.,Newman & Schmitt, 1998; Newman et al., 1997) and use theWelsh Anxiety Scale (Welsh, 1956) to remove alternatively high-and low-anxious psychopaths from the analyses. The results ofHicks et al. (2004) could also be used to identify MPQ–BF profilesfor the two subtypes, and each subtype could be removed inalternate analyses leaving the other to determine whether a taxonsolution emerges in the absence of either.
Problems of mapping from the phenotypic to underlying causes.A final possible interpretation is illustrated in the neurobehavioralmodel of personality traits proposed by Depue and Lenzenweger(2001). They conceive personality disorders as functions of thevariations or interactions of the most extreme values that contrib-ute to high-order traits: Constraint, Affiliation, Positive–NegativeEmotionality (PEM–NEM), and Fear. The authors proposed thathigher order heterogeneous phenotypes result from the combina-tion of a heterogeneous set of lower order traits that have differentsources of genetic variation. The task of identifying neurobiolog-ical foundations is rendered particularly difficult, considering thatsome higher order traits are typically associated with two or morebehavioral systems and neurobehavioral networks (Depue & Len-zenweger, 2001). Consequently, it would be particularly difficultto observe taxonic results.
As Gottesman (1997) illustrated in the domain of intelligenceassessment, phenotypical continuity can represent the true mani-festation of distinct underlying genotypic distributions. Geneticand biological causation and phenotypic discontinuity are notsynonymous. Depue and Lenzenweger (2001) suggested that atleast four different neurobehavioral systems may be necessary toaccount for impulsivity—(a) positive incentive motivation, (b)fear, (c) aggression, and (d) low levels of a nonaffective form ofimpulsivity (which results in disinhibition of the above neurobe-havioral systems). For impulsivity to emerge, at least four to fiveindependent neurobehavioral systems may have to be elicited (notto mention an increased complexity when possible interaction withother higher order traits is considered). Ultimately, the deter-mination of the number of core processes that are necessary andsufficient to explain and predict psychopathy will depend on theisolation of the basic processes involved (Depue & Lenzen-weger, 2001; Tellegen & Waller, in press). Specific etiologies,including particular genetic origins, prenatal, perinatal, and post-
Figure 2 (opposite). Mean above minus below a cut (MAMBAC) and maximum eigenvalue (MAXEIG) resultsfor indicator sets representing four theoretical facets of psychopathy. Aff. � affective; Anti. � antisocial; Inter.� interpersonal; Life. � lifestyle. Within each three-panel graph, the first panel shows the averaged curve forthe research data and the second and third panels show the averaged curves for the simulated taxonic anddimensional comparison data. For comparison data, each sample’s results are represented by a dotted line, withthe average across all samples plotted as a solid line.
711LATENT STRUCTURE OF PSYCHOTHERAPY

natal biological determinants, and specific life experiences impact-ing on causal neurobiological influences within personality struc-ture will determine the relevant processes contributing topsychopathy. As in the hunt for the “quantitative trait loci” of
intelligence (Gottesman, 1997), such complexity does not easilyyield its underlying causal mechanisms to empirical scrutiny, andinvestment in a long-term search is necessary. The advantage ofbeing able to identify a taxon in the phenotypical distributions of
Figure 3. Mean above minus below a cut (MAMBAC) and maximum eigenvalue (MAXEIG) results forindicator sets representing Psychopathy Checklist—Revised (PCL–R) Factors 1 and 2. Within eachthree-panel graph, the first panel shows the averaged curve for the research data and the second and thirdpanels show the averaged curves for the simulated taxonic and dimensional comparison data. Forcomparison data, each sample’s results are represented by a dotted line, with the average across all samplesplotted as a solid line.
712 GUAY, RUSCIO, KNIGHT, AND HARE

PCL–R or its subcomponents would have been the location of abeacon guiding us to a specific etiology (Meehl, 1977). Theabsence of such a beacon may mean that no phenotypic measures,even cognitive or affective assessments that may be closer to theunderlying causal mechanisms, will provide such guidance, andlongitudinal research strategies aimed at identifying and trackingmultiple underlying processes and environmental contingencieswill be necessary.
Conclusions
The analyses in the present article clearly indicate that thedisorder defined by high scores on the PCL–R and the correlatedfactors that the PCL–R comprises are distributed dimensionally.Although such results strongly disconfirm the hypothesis that thedistribution of PCL–R scores can be accounted for by a latenttaxon, questions about the specificity of the measure in covaryingwith underlying processes, the possibility of covarying but etio-logically distinct subtypes of psychopathy, and the possibility thatthe manifest behavior of psychopathy is the interaction of multipleindependent neurobiological systems leave open the possibilitythat other measures might yet uncover a taxon. The support for adimensional model of psychopathy buttresses research strategiesthat examine the correlates of psychopathy self-report scales inboth criminal and noncriminal samples (Benning, Patrick, Salekin,& Leistico, 2005; Brook, Kosson, Walsh, & Robins, 2005; Knight& Sims-Knight, 2003) encourages structural equation modelingapproaches to conceptualizing and testing etiological hypothesesabout psychopathy (Krueger et al., 2002) and argues for thecreation of scales that are equally reliable and discriminatingacross the full spectrum of the scale. Although we should not yetforego the more traditional group comparison approaches, suchdata should be analyzed and interpreted with dimensional precau-tions in mind. We have not resolved the issue of taxonicitysufficiently to leave any strategy behind in the attempts to unravelthe Gordian knot of psychopathy.
References
Alpert, M., Shaw, R. J., Pouget, E. R., & Lim, K. O. (2002). A comparisonof clinical ratings with vocal acoustic measures of flat affect and alogia.Journal of Psychiatric Research, 36, 347–353.
Beauchaine, T. P., & Waters, E. (2003). Pseudotaxonocity in MAMBACand MAXCOV analyses of rating scale data: Turning continua intoclasses by manipulating observer’s expectations. Psychological Meth-ods, 8, 3–15.
Benning, S. D., Patrick, C. J., Blonigen, D. M., Hicks, B. M., & Iacono,W. G. (2005). Estimating facets of psychopathy from normal personalitytraits: A step toward community-epidemiological investigations. Assess-ment, 12, 3–18.
Benning, S. D., Patrick, C. J., Salekin, R. T., & Leistico, A. R. (2005).Convergent and discriminant validity of psychopathy factors assessedvia self-report: A comparison of three instruments. Assessment, 12,270–289.
Bishopp, D., & Hare, R. D. (2005). A multidimensional scaling analysis ofthe Hare PCL–R. Manuscript submitted for publication.
Blair, R. J. R. (1995). A cognitive developmental approach to morality:Investigating the psychopath. Cognition, 57, 1–29.
Blair, R. J. R. (2001). Neuro-cognitive models of aggression, the antisocialpersonality disorders and psychopathy. Journal of Neurology, Neuro-surgery and Psychiatry, 71, 727–731.
Blair, R. J. R. (2004). The roles of orbital frontal cortex in the modulationof antisocial behavior. Brain and Cognition, 55, 198–208.
Blair, R. J. R., Colledge, E., Murray, L., & Mitchell, D. G. V. (2001). Aselective impairment in the processing of sad and fearful expressions inchildren with psychopathic tendencies. Journal of Abnormal Child Psy-chology, 29, 491–498.
Blair, R. J. R., Mitchell, D. G. V., & Blair, K. S. (2005). The psychopath:Emotion and the brain. Oxford, England: Blackwell.
Blair, R. J. R., Mitchell, D. G. V., Richell, R. A., Kelly, S., Leonard, A.,Newman, C., & Scott, S. K. (2002). Turning a deaf ear to fear: Impairedrecognition of vocal affect in psychopathic individuals. Journal of Ab-normal Psychology, 111, 682–686.
Bloningen, D. M., Hicks, B. M., Krueger, R. F., Patrick, C. J., & Iacono,W. G. (2005). Psychopathic personality traits: Heritability and geneticoverlap with internalizing and externalizing psychopathology. Psycho-logical Medicine, 35, 1–12.
Bolt, D., Hare, R. D., Vitale, J., & Newman, J. P. (2004). A multigroupitem response theory analysis of the Hare Psychopathy Checklist—Revised. Psychological Assessment, 16, 155–168.
Brook, M., Kosson, D. S., Walsh, Z., & Robins, R. W. (2005, July).Psychopathic personality as measured by the Self-Report PsychopathyScale—II (SRP–II): External correlates, antisocial deviance, and sub-stance use. Poster presented at the Annual Convention of the Society forthe Scientific Study of Psychopathology, Vancouver, British Columbia,Canada.
Brown, S. L. & Forth, A. E. (1997). Psychopathy and sexual assault: Staticrisk factors, emotional precursors, and rapist subtypes. Journal of Con-sulting and Clinical Psychology, 65, 848–857.
Cadoret, R. J., Yates, W. R., Troughton, E., Woodworth, G., & Stewart,M. A. (1995). Adoption study demonstrating two genetic pathways todrug abuse. Archives of General Psychiatry, 42, 161–167.
Cleckley, H. (1976). The mask of sanity (5th ed). St. Louis, MO: Mosby.Cleland, C., Rothschild, L., & Haslam, N. (2000). Detecting latent taxa:
Monte Carlo comparison of taxometric, mixture, and clustering methods.Psychological Reports, 87, 37–47.
Cooke, D. J., & Michie, C. (2001). Refining the construct of psychopathy:Toward a hierarchical model. Psychological Assessment, 13, 171–188.
Cote, G., & Hodgins, S. (1991). L’Echelle de psychopathie de Hare—Revisee: Elements de la validation de la version Francais. Bulletin dePsychologie, 45, 14–20.
Depue, R. A., (1996). A neurobiological framework for the structure ofpersonality and emotion: Implications for personality disorders. In J. F.Clarkin & M. F. Lenzenweger (Eds.), Major theories of personalitydisorder (pp. 347–390). New York: Guilford Press.
Depue, R. A., & Lenzenweger, M. (2001). Neurobiology of personalitydisorders. In J. Livesley (Ed.), Handbook of personality disorders (pp.136–176). New York: Guilford Press.
Douglas, K., Vincent, G. M., & Edens, J. (2006). Risk for criminalrecidivism: The role of psychopathy. In C. Patrick (Ed.), Handbook ofpsychopathy (pp. 533–554). New York: Guilford Press.
Edelbrock, C., Rende, R., Plomin, R., & Thompson, L. A. (1995). A twinstudy of competence and problem behavior in childhood and earlyadolescence. Journal of Child Psychology and Psychiatry, 36, 775–785.
Edens, J. F., Marcus, D. K., Lilienfeld, S. O., & Poythress, N. G. (2006).Psychopathic, not psychopath: Taxometric evidence for the dimensionalstructure of psychopathy. Journal of Abnormal Psychology, 115, 131–144.
Edens, J. F., & Petrila, J. (2006). Legal and ethical issues in the assessmentand treatment of psychopathy. In C. Patrick (Ed.), Handbook of psy-chopathy (pp. 573–588). New York: Guilford Press.
Fowles, D. C., & Dindo, L. (2006). A dual-deficit model of psychopathy.In C. Patrick (Ed.), Handbook of psychopathy (pp. 14–34). New York:Guilford Press.
713LATENT STRUCTURE OF PSYCHOTHERAPY

Fraley, C. (1998). Algorithms for model-based Gaussian hierarchical clus-tering. Journal on Scientific Computing, 20, 270–281.
Frick, P. J., & Hare, R. D. (2001). The antisocial process screening device.Toronto, Ontario, Canada: Multi-Health Systems.
Frick, P. J., Lilienfeld, S. O., Ellis, M. L., Loney, B. R., & Silverthorn, P.(1999). The association between anxiety and psychopathy dimensions inchildren. Journal of Abnormal Child Psychology, 27, 381–390.
Ge, X., Conger, R. D., Cadoret, R. D., Neiderhiser, J., Troughton, E.,Stewart, E., & Yates, W. (1996). The developmental interface betweennature and nurture: A mutual influence model of adolescent antisocialbehavior and parenting behaviors. Developmental Psychology, 32, 574–589.
Gottesman, I. I. (1997, June 6). Twins: En route to QTLs for cognition.Science, 276, 1522–1523.
Gottesman, I. I., & Goldsmith, H. H. (1994). Developmental psychopa-thology of antisocial behavior: Inserting genes into its ontogenesis andepigenesis. In C. A. Nelson (Ed.), Threats to optimal development,integrating biological, psychological, and social risk factors (pp. 69–104). Hillsdale, NJ: Erlbaum.
Gottesman, I. I., & Shields, J. (1972). Schizophrenia and genetics. A twinstudy vantage point. New York: Academic Press.
Grove, W. M., Eckert, E. D., Heston, L., Bouchard, T. J., Jr., Segal, N., &Lykken, D. T. (1990). Heritability of substance abuse and antisocialbehavior: A study of monozygotic twins reared apart. Biological Psy-chiatry, 27, 1293–1304.
Guay, J. P., & Knight, R. A. (2003, July). Assessing the underlyingstructure of psychopathy factors using taxometrics. Poster presented atthe conference on Developmental and Neuroscience Perspectives onPsychopathy, Madison, Wisconsin.
Hall, J. R., & Benning, S. D. (2006). The “successful” psychopath: Adap-tive and subclinical manifestations of psychopathy in the general pop-ulation. In C. Patrick (Ed.), Handbook of psychopathy (pp. 459–478).New York: Guilford Press.
Hare, R. D. (1980). A research scale for the assessment of psychopathy incriminal populations. Personality and Individual Differences, 1, 111–119.
Hare, R. D. (1991). The Psychopathy Checklist—Revised manual. Toronto,Ontario, Canada: Multi-Health Systems.
Hare, R. D. (1996). Psychopathy: A clinical construct whose time hascome. Criminal Justice and Behavior, 23, 25–54.
Hare, R. D. (2003). The Psychopathy Checklist—Revised technical manual(2nd ed.). Toronto, Ontario, Canada: Multi-Health Systems.
Hare, R. D., & Neumann, C. N. (2006). The PCL–R assessment ofpsychopathy: Development, structural properties, and new directions. InC. Patrick (Ed.), Handbook of psychopathy (pp. 58–88). New York:Guilford Press.
Harpur, T. J., Hakstian, A. R., & Hare, R. D. (1988). Factor structure of thePsychopathy Checklist. Journal of Consulting and Clinical Psychology,56, 741–747.
Harpur, T. J., Hare, R. D., & Hakstian, A. R. (1989). Two-factor concep-tualization of psychopathy: Construct validity and assessment implica-tions. Psychological Assessment, 1, 6–17.
Harris, G. T., Rice, M. E., & Quinsey, V. L. (1994). Psychopathy as ataxon: Evidence that psychopaths are a discrete class. Journal of Con-sulting and Clinical Psychology, 62, 387–397.
Haslam, N., & Cleland, C. (2002). Taxometric analysis of fuzzy categories:A Monte Carlo study. Psychological Reports, 90, 401–404.
Herve, H. F., Hayes, P. J., & Hare, R. D. (2003). Psychopathy andsensitivity to the emotional polarity of metaphorical statements. Person-ality and Individual Differences, 35, 1497–1507.
Hicks, B. M., Markon, K. E., Patrick, C. J., Krueger, R. F., & Newman,J. P. (2004). Identifying psychopathy subtypes based on personalitystructure. Psychological Assessment, 16, 276–288.
Johnson, T. D. (1990). Partial helplessness conditioning as a possible
etiological factor in psychopathy. Unpublished doctoral dissertation,University of Alabama, Birmingham, AL.
Kiehl, K. A., Hare, R. D., Liddle, P. F., & McDonald, J. (1999). ReducedP300 responses in criminal psychopaths during a visual oddball task.Biological Psychiatry, 45, 1498–1507.
Kiehl, K. A., Smith, A. M., Hare, R. D., Mendrek, A., Forster, B. B., Brink,J., & Liddle, P. F. (2001). Limbic abnormalities in affective processingby criminal psychopaths as revealed by functional magnetic resonanceimaging. Biological Psychiatry, 50, 677–684.
Kiehl, K. A., Smith, A. M., Mendrek, A., Forster, B. B., Hare, R. D., &Liddle, P. F. (2004). Temporal lobe abnormalities in semantic process-ing by criminal psychopaths as revealed by functional magnetic reso-nance imaging. Psychiatry Research: Neuroimaging, 130, 27–42.
Knight, R. A., & Cerce, D. D. (1999). Validation and revision of theMultidimensional Assessment of Sex and Aggression. PsychologicaBelgica, 39, 135–161.
Knight, R. A., & Guay, J. P. (2006). The role of psychopathy in sexualcoercion against women. In C. Patrick (Ed.), Handbook of psychopathy(pp. 512–532). New York: Guilford Press.
Knight, R. A., & Sims-Knight, J. E. (2003). Developmental antecedents ofsexual coercion against women: Testing of alternative hypotheses withstructural equation modeling, In R. A. Prentky, E. Janus, & M. Seto(Eds.), Sexual coercion: Understanding and management (pp. 72–85).New York: New York Academy of Sciences.
Knight, R. A., & Sims-Knight, J. E. (2004). Testing an etiological modelfor juvenile sexual offending against women. Journal of Child SexualAbuse, 13, 33–55.
Kosson, D. S. (1996). Psychopathy and dual-task performance underfocusing conditions. Journal of Abnormal Psychology, 105, 391–400.
Kosson, D. S. (1998). Divided visual attention in psychopathic and non-psychopathic offenders. Personality and Individual Difference, 24, 373–391.
Kosson, D. S., Smith, S. S., & Newman, J. P. (1990). Evaluation of theconstruct validity of psychopathy in Black and White male inmates:Three preliminary studies. Journal of Abnormal Psychology, 99, 250–259.
Krueger, R. F. (1999). The structure of common mental disorders. Archivesof General Psychiatry, 56, 921–926.
Krueger, R. F. (2000). Phenotypic, genetic, and nonshared environmentalparallels in the structure of personality: A view from the Multidimen-sional Personality Questionnaire. Journal of Personality and SocialPsychology, 79, 1057–1067.
Krueger, R. F. (2006). Perspectives on the conceptualization of psychop-athy: Toward an integration. In C. Patrick (Ed.), Handbook of psychop-athy (pp. 193–202). New York: Guilford Press.
Krueger, R. F., Hicks, B. M., Patrick, C. J., Carlson, S. R., Iacono, W. G.,& McGue, M. (2002). Etiologic connections among substance depen-dence, antisocial behavior, and personality: Modeling the externalizingspectrum. Journal of Abnormal Psychology, 111, 411–424.
Krueger, R. F., Markon, K. E., Patrick, C. J., & Iacono, W. G. (2005).Externalizing psychopathology in adulthood: A dimensional-spectrumconceptualization and its implications for DSM–V. Journal of AbnormalPsychology, 114, 537–550.
Lenzenweger, M. F. (2004). Consideration of the challenges, complica-tions, and pitfalls of taxometric analysis. Journal of Abnormal Psychol-ogy, 113, 10–23.
Levenston, G. K., Patrick, C. J., Bradley, M. M., & Lang, P. J. (2000). Thepsychopath as observer: Emotion and attention in picture processing.Journal of Abnormal Psychology, 109, 373–385.
Lilienfeld, S. O. (1994). Conceptual problems in the assessment of psy-chopathy. Clinical Psychology Review, 14, 17–38.
Lilienfeld, S. O., & Andrews, B. P. (1996). Development and preliminaryvalidation of a self-report measure of psychopathic personality traits in
714 GUAY, RUSCIO, KNIGHT, AND HARE

noncriminal populations. Journal of Personality Assessment, 66, 488–524.
Lilienfeld, S. O., & Fowler, K. A. (2006). The self-report assessment ofpsychopathy: Promises, problems, and solutions. In C. Patrick (Ed.),Handbook of Psychopathy (pp. 107–132). New York: Guilford Press.
Livesley, W. J. (1998). Suggestions for a framework for an empiricallybased classification of personality disorder. Canadian Journal of Psy-chiatry, 43, 137–147.
Lynam, D. R. (2002). Psychopathy from the perspective of the five-factormodel. In P. T. Costa Jr., & T. A. Widiger (Eds.), Personality disordersfrom the perspective of the five-factor model of personality (2nd ed., pp.325–350). Washington, DC: American Psychological Association.
Lyons, M. J., True, W. R., Eisen, S. A., Goldberg, J., Meyers, J. M.,Faraone, L. J., et al. (1995). Differential heritability of adult and juvenileantisocial traits. Archives of General Psychiatry, 52, 906–915.
Marcus, D. K., John, S. L., & Edens, J. F. (2004). A taxometric analysis ofpsychopathic personality. Journal of Abnormal Psychology, 113, 626–635.
Mason, D. A., & Frick, P. J. (1994). The heritability of antisocial behavior:A meta-analysis of twin and adoption studies. Journal of Psychopathol-ogy and Behavioral Assessment, 16, 301–323.
McCrae, R. R., & Costa, P. T. (1990). Personality in adulthood. New York:Guilford Press.
Mednick, S. A., Gabrielli, W. F., Jr., & Hutchings, B. (1984, May 25).Genetic influences in criminal convictions: Evidence from an adoptioncohort. Science, 224, 891–894.
Meehl, P. E. (1973). MAXCOV–HITMAX: A taxonomic search methodfor loose genetic syndromes. In P. E. Meehl (Ed.), Psychodiagnosis:Selected papers (pp. 200–224). Minneapolis: University of MinnesotaPress.
Meehl, P. E. (1977). Specific etiology and other forms of strong influence:Some quantitative meanings. Journal of Medicine and Philosophy, 2,33–53.
Meehl, P. E. (1992). Factors and taxa, traits and types, differences ofdegree and differences in kind. Journal of Personality, 60, 117–174.
Meehl, P. E. (1995). Bootstraps taxometrics: Solving the classificationproblem in psychopathology. American Psychologist, 50, 266–275.
Meehl, P. E., & Yonce, L. J. (1994). Taxometric analysis: I. Detectingtaxonicity with two quantitative indicators using means above and belowa sliding cut (MAMBAC procedure). Psychological Reports, 74, 1059–1274.
Miller, J. D., Lynam, D. R., Widiger, T. A., & Leukefeld, C. (2001).Personality disorders as extreme variants of common personality dimen-sions. Can the five-factor model of personality adequately representpsychopathy? Journal of Personality, 69, 253–276.
Mitchell, D. G. V., Colledge, E., Leonard, A., & Blair, R. J. R. (2002).Risky decisions and response reversal: Is there evidence of orbito-frontalcortex dysfunction in psychopathic individuals? Neuropsychologia, 40,2013–2022.
Moffitt, T. E. (1993). Adolescence-limited and life-course-persistent anti-social behavior: A developmental taxonomy. Psychological Review,100, 674–701.
Morgan, A. P., & Lilienfeld, S. O. (2000). A meta-analytic review of therelation between antisocial behavior and neuropsychological measuresof executive function. Clinical Psychology Review, 20, 113–156.
Muller, J. L., Sommer, M., Wagner, V., Lamge, K., Taschler, H., Roder,H., et al. (2003). Abnormalities in emotion processing within corticaland subcortical regions in criminal psychopaths: Evidence from a func-tional magnetic resonance imaging study using pictures with emotionalcontent. Biological Psychiatry, 54, 152–162.
Newman, J. P. (1987). Reaction to punishment in extraverts and psycho-paths: Implications for the impulsive behavior of disinhibited individu-als. Journal of Research in Personality, 21, 464–480.
Newman, J. P., & Kosson, D. S. (1986). Passive avoidance learning in
psychopathic and nonpsychopathic offenders. Journal of Abnormal Psy-chology, 95, 252–256.
Newman, J. P., & Lorenz, A. R. (2003). Response modulation and emotionprocessing: Implications for psychopathy and other dysregulatory psy-chopathology. In R. J. Davidson, K. Scherer, & H. H. Goldsmith (Eds.),Handbook of affective sciences (pp. 1043–1067). Oxford, England:Oxford University Press.
Newman, J. P., Patterson, C. M., & Kosson, D. S. (1987). Responseperseveration in psychopaths. Journal of Abnormal Psychology, 96,145–148.
Newman, J. P., & Schmitt, W. A. (1998). Passive avoidance in psycho-pathic offenders: A replication and extension. Journal of AbnormalPsychology, 107, 527–532.
Newman, J. P., Schmitt, W. A., & Voss, W. D. (1997). The impact ofmotivationally neutral cues on psychopathic individuals: Assessing thegenerality of the response modulation hypothesis. Journal of AbnormalPsychology, 106, 563–575.
Patrick, C. J. (2001). Emotional processes in psychopathy. In A. Raine &J. Sanmartin (Eds.), Violence and psychopathy (pp. 57–77). New York:Kluwer Academic.
Patrick, C. J. (2003, July). Psychopathy and externalizing: Genetics andbrain function. Paper presented at the conference on Developmental andNeuroscience Perspectives on Psychopathy, Madison, Wisconsin.
Patrick, C. J., Bradley, M. M., & Lang, P. J. (1993). Emotion in thecriminal psychopath: Startle reflex modulation. Journal of AbnormalPsychology, 102, 82–92.
Patrick, C. J., Curtin, J. J., & Tellegen, A. (2002). Development andvalidation of a brief form of the Multidimensional Personality Question-naire (MPQ). Psychological Assessment, 14, 150–163.
Patrick, C. J., & Zempolich, K. A. (1998). Emotion and aggression in thepsychopathic personality. Aggression and Violent Behavior, 3, 303–338.
Porter, S., Fairweather, D., Drugge, J., Herve, H. Birt, A., & Boer D. P.(2000). Profiles of psychopathy in incarcerated sexual offenders. Crim-inal Justice and Behavior, 27, 216–233.
Porter, S., & Woodworth, M. (2006), Psychopathy and aggression. In C.Patrick (Ed.), Handbook of psychopathy (pp. 481–494). New York:Guilford Press.
Quinsey, V. L., Harris, G. T., Rice, M. E., & Cormier, C. A. (1998). Violentoffenders: Appraising and managing risk. Washington, DC: AmericanPsychological Association.
Raine, A. (2001). Psychopathy, violence, and brain imaging. In A. Raine &J. Sanmartin (Eds.), Violence and psychopathy (pp. 35–56). New York:Academic Press.
Raine, A., Ishikawa, S. S., Arce, E., Lencz, T., Knuth, K. H., Birhle, S., etal. (2004). Hippocampal structural asymmetry in unsuccessful psycho-paths. Biological Psychiatry, 55, 185–191.
Raine, A., Venables, P. H., & Williams, M. (1996). Better autonomicconditioning and faster electrodermal half-recovery time at age 15 yearsas possible protective factors against crime at age 29 years. Develop-mental Psychology, 32, 624–630.
Ruscio, J. (2000). Taxometric analysis with dichotomous indicators: Themodified MAXCOV procedure and a case removal consistency test.Psychological Reports, 87, 929–939.
Ruscio, J. (2004, May). Bootstrapping sampling distributions to quantifythe fit of taxometric curves. Paper presented at the annual meeting of theAmerican Psychological Society, Chicago, IL.
Ruscio, J. (2006). Estimating taxon base rates with the MAXCOV,MAXEIG, and MAMBAC taxometric procedures: A Monte Carlo study.Manuscript in preparation.
Ruscio, J., Haslam, N., & Ruscio, A. M. (2006). Introduction to thetaxometric method: A practical guide. Mahwah, NJ: Erlbaum.
Ruscio, J., & Ruscio, A. M. (2004a). Clarifying boundary issues in psy-chopathology: The role of taxometrics in a comprehensive program ofstructural research. Journal of Abnormal Psychology, 113, 24–38.
715LATENT STRUCTURE OF PSYCHOTHERAPY

Ruscio, J., & Ruscio, A. M. (2004b). A conceptual and methodologicalchecklist for conducting a taxometric investigation. Behavior Therapy,35, 403–447.
Ruscio, J., & Ruscio, A. M. (2004c). A nontechnical introduction to thetaxometric method. Understanding Statistics, 3, 151–193.
Ruscio, J., & Ruscio, A. M., & Keane, T. M. (2004). Using taxometricanalysis to distinguish a small latent taxon from a latent dimension withpositively skewed indicators: The case of involuntary defeat syndrome.Journal of Abnormal Psychology, 113, 145–154.
Ruscio, J., Ruscio, A. M., & Meron, M. (in press). Applying the bootstrapto taxometric analysis: Generating empirical sampling distributions tohelp interpret results. Multivariate Behavioral Research.
Schmauk, F. J. (1970). Punishment, arousal, and avoidance learning insociopaths. Journal of Abnormal Psychology, 76, 325–335.
Seguin, J. R. (2004). Neurocognitive elements of antisocial behaviour:Relevance of an orbitofrontal cortex account. Brain and Cognition, 55,185–197.
Serin, R. C. (1991). Psychopathy and violence in criminals. Journal ofInterpersonal Violence, 6, 423–431.
Simourd, D. J. & Hoge, R. D. (2000). Criminal psychopathy: A risk-and-need perspective. Criminal Justice and Behavior, 27, 256–272.
Skeem, J., Poythress, N., Edens, J., Lilienfeld, S., & Cale, E. (2003).Psychopathic personality or personalities? Exploring potential variantsof psychopathy and their implications for risk assessment. Aggressionand Violent Behavior, 8, 513–546.
Skilling, T. A., Harris, G. T., Rice, M. E., & Quinsey, V. L. (2002).Identifying persistently antisocial offenders using the Hare PsychopathyChecklist and DSM antisocial personality disorder criteria. Psychologi-cal Assessment, 14, 27–38.
Skilling, T. A., Quinsey, V. L., Craig, W. M. (2001). Evidence of a taxonunderlying serious antisocial behavior in boys. Criminal Justice andBehavior, 28, 450–470.
Taylor, J., Loney, B. R., Bobadilla, L., Iacono, W. G., & McGue, M.
(2003). Genetic and environmental influence on psychopathy: Findingsfrom an adolescent male twin cohort. Journal of Abnormal Child Psy-chology, 31, 633–645.
Tellegen, A., & Waller, N. G. (in press). Exploring personality through testconstruction: Development of the multidimensional personality ques-tionnaire. Minneapolis: University of Minnesota Press.
Tiihonen, J., Hodgins, S., Vaurio, O., Laakso, M., Repo, E., Soininen, H.,et al. (2000). Amygdaloid volume loss in psychopathy. Society forNeuroscience Abstracts, 2017.
Vasey, M. W., Kotov, R., Frick, P. J., & Loney, B. R. (2005). The latentstructure of psychopathy in youth: A taxometric investigation. Journal ofAbnormal Child Psychology, 33, 411–429.
Vollm, B., Richardson, P., Stirling, J., Elliott, R., Dolan, M., Chaudhry, I.,et al. (2004). Neurobiological substrates of antisocial and borderlinepersonality disorder: Preliminary results of a functional fMRI study.Criminal Behaviour and Mental Health, 14, 39–54.
Waller, N. G., & Meehl, P. E. (1998). Multivariate taxometric procedures:Distinguishing types from continua. Newbury Park, CA: Sage.
Welsh, G. S. (1956). Factor dimensions A and R. In G. S. Welsh & W. G.Dahlstrom (Eds.), Basic readings on the MMPI in psychology andmedicine (pp. 264–281). Minneapolis: University of Minnesota Press.
Widiger, T. A. (1993). The DSM–III–R categorical personality disorderdiagnoses: A critique and an alternative. Psychological Inquiry, 4, 75–90.
Widiger, T. A., & Costa, P. T. (1994). Personality and personality disor-ders. Journal of Abnormal Psychology, 103, 78–91.
Williamson, S. E., Harpur, T. J., & Hare, R. D. (1991). Abnormal process-ing of affective words by psychopaths. Psychophysiology, 28, 260–273.
Received April 13, 2005Revision received October 3, 2006
Accepted December 13, 2006 �
716 GUAY, RUSCIO, KNIGHT, AND HARE