a talent management strategy - aarp · 2018-08-23 · 4 investing in training 50+ workers: a talent...
TRANSCRIPT

Investing in Training 50+ Workers:A Talent Management Strategy
A REPORT FOR AARP PREPARED BY TOWERS PERRIN WORKER SURVEY CONDUCTED BY KNOWLEDGE NETWORKS APRIL 2008

AARP is a nonprofit, nonpartisan membership organization that helps people 50+ have independence, choice and control in ways
that are beneficial and affordable to them and society as a whole. AARP does not endorse candidates for public office or make
contributions to either political campaigns or candidates. We produce AARP The Magazine, published bimonthly; AARP Bulletin,
our monthly newspaper; AARP Segunda Juventud, our bimonthly magazine in Spanish and English; NRTA Live & Learn, our quarterly
newsletter for 50+ educators; and our website, AARP.org. AARP Foundation is an affiliated charity that provides security, protection,
and empowerment to older persons in need with support from thousands of volunteers, donors, and sponsors. We have staffed
offices in all 50 states, the District of Columbia, Puerto Rico, and the U.S. Virgin Islands.
AARP collected the data for this study through an online survey of workers age 50+ administered by Knowledge Networks of Menlo
Park, California. Towers Perrin, a global consulting firm, interviewed a select group of employers and wrote the report. AARP’s
Workforce Issues Department and Office of Social Impact made this study possible. This study was managed by S. Kathi Brown and
Hana Holley of AARP’s Knowledge Management Department. Special thanks to the following AARP staff for their input and guidance:
Dan Kohrman, Craig Langford, Evelyn Morton, Tom Osborne, Sara Rix, Deborah Russell, and Tim Wollerman. For additional
information, contact S. Kathi Brown of AARP’s Knowledge Management Department at 202-434-6296. For press inquiries, contact
Dave Nathan of AARP’s Media Relations Department at 202-434-2560.

A REPORT FOR AARP PREPARED BY TOWERS PERRIN 1
CONTENTS
Executive Summary . . . . . . . . . . . . . . . . . . . . . . . . . . . . . . . . . . . . . . . . . . . . . . . . . . . . . . . . . . . . . . . . . . . . . . . . 03
Key Findings . . . . . . . . . . . . . . . . . . . . . . . . . . . . . . . . . . . . . . . . . . . . . . . . . . . . . . . . . . . . . . . . . . . . . . . . . . . . . . 05
50+ Workers Want Training—the More Skill-Focused, the Better . . . . . . . . . . . . . . . . . . . . . . . . . . . . . . . . . . . 05
50+ Workers are Highly Flexible and Adaptable Learners . . . . . . . . . . . . . . . . . . . . . . . . . . . . . . . . . . . . . . . . 08
Most 50+ Workers Are Satisfied with Available Training . . . . . . . . . . . . . . . . . . . . . . . . . . . . . . . . . . . . . . . . . 09
Opportunities for Improvement in Training Definitely Exist . . . . . . . . . . . . . . . . . . . . . . . . . . . . . . . . . . . . . . . 13
Training Yields Valuable Benefits . . . . . . . . . . . . . . . . . . . . . . . . . . . . . . . . . . . . . . . . . . . . . . . . . . . . . . . . . . . 22
Implications . . . . . . . . . . . . . . . . . . . . . . . . . . . . . . . . . . . . . . . . . . . . . . . . . . . . . . . . . . . . . . . . . . . . . . . . . . . . . . 25
Best Practices . . . . . . . . . . . . . . . . . . . . . . . . . . . . . . . . . . . . . . . . . . . . . . . . . . . . . . . . . . . . . . . . . . . . . . . . . . . . 26
Appendix A: Employer Interviews: Methodology . . . . . . . . . . . . . . . . . . . . . . . . . . . . . . . . . . . . . . . . . . . . . . . . . . 29
Appendix B: 50+ Worker Survey: Methodology . . . . . . . . . . . . . . . . . . . . . . . . . . . . . . . . . . . . . . . . . . . . . . . . . . . 30
Appendix C: 50+ Worker Survey: Annotated Questionnaire . . . . . . . . . . . . . . . . . . . . . . . . . . . . . . . . . . . . . . . . . . 31
Appendix D: 50+ Worker Survey: Detailed Data Tables for Selected Questions . . . . . . . . . . . . . . . . . . . . . . . . . . . 49
LLIISSTT OOFF EEXXHHIIBBIITTSS
Exhibit 1: 50+ Workers’ Interest in Various Types of Work-Related Training . . . . . . . . . . . . . . . . . . . . . . . . . . . . . . 05
Exhibit 2: Range of Desired Training Topics . . . . . . . . . . . . . . . . . . . . . . . . . . . . . . . . . . . . . . . . . . . . . . . . . . . . . . 06
Exhibit 3: Desired Frequency of Training . . . . . . . . . . . . . . . . . . . . . . . . . . . . . . . . . . . . . . . . . . . . . . . . . . . . . . . . 07
Exhibit 4: Workers’ Comfort with Various Training Approaches . . . . . . . . . . . . . . . . . . . . . . . . . . . . . . . . . . . . . . . 08
Exhibit 5: Overall Participation in Training . . . . . . . . . . . . . . . . . . . . . . . . . . . . . . . . . . . . . . . . . . . . . . . . . . . . . . . 10
Exhibit 6: Participation in Requested or Desired Training within Past Two Years . . . . . . . . . . . . . . . . . . . . . . . . . . 10
Exhibit 7: Satisfaction with Training Offered by Employer. . . . . . . . . . . . . . . . . . . . . . . . . . . . . . . . . . . . . . . . . . . . 10
Exhibit 8: Drivers of Training Satisfaction . . . . . . . . . . . . . . . . . . . . . . . . . . . . . . . . . . . . . . . . . . . . . . . . . . . . . . . . 11
Exhibit 9: Training-Related Drivers of Job Motivation . . . . . . . . . . . . . . . . . . . . . . . . . . . . . . . . . . . . . . . . . . . . . . . 12
Exhibit 10: Company Support for Training. . . . . . . . . . . . . . . . . . . . . . . . . . . . . . . . . . . . . . . . . . . . . . . . . . . . . . . . 12
Investing in Training
50+ Workers:A Talent Management Strategy

2 INVESTING IN TRAINING 50+ WORKERS: A TALENT MANAGEMENT STRATEGY
Exhibit 11: Training Participation by Education Level . . . . . . . . . . . . . . . . . . . . . . . . . . . . . . . . . . . . . . . . . . . . . . . 13
Exhibit 12: Variety of Training Methods Employers Offer . . . . . . . . . . . . . . . . . . . . . . . . . . . . . . . . . . . . . . . . . . . . 14
Exhibit 13: Workers’ Training Interests vs. Employers’ Policies in Providing or Paying for Training . . . . . . . . . . 15–16
Exhibit 14: Workers’ Training Interests vs. Actual Participation. . . . . . . . . . . . . . . . . . . . . . . . . . . . . . . . . . . . . 17–18
Exhibit 15: Workers Who Report Insufficient Company Support for Training (By Sector and Company Size) . . . . . 19
Exhibit 16: Workers Who Perceive Unequal Access to Training (By Education Level and Sector) . . . . . . . . . . . . . . 19
Exhibit 17: Areas in Which Workers Feel They Lack Knowledge, Skills, or Training Needed to Do Their Job Well . . 20
Exhibit 18: Areas in Which Workers Feel They Lack Knowledge, Skills, or Training: Significant Differences by
Education Level. . . . . . . . . . . . . . . . . . . . . . . . . . . . . . . . . . . . . . . . . . . . . . . . . . . . . . . . . . . . . . . . . . . 21
Exhibit 19: Reasons for Dissatisfaction with Training . . . . . . . . . . . . . . . . . . . . . . . . . . . . . . . . . . . . . . . . . . . . . . . 21
Exhibit 20: Obstacles to Participating in Training . . . . . . . . . . . . . . . . . . . . . . . . . . . . . . . . . . . . . . . . . . . . . . . . . . 22
Exhibit 21: Value of Training in Last Two Years to Job or Career . . . . . . . . . . . . . . . . . . . . . . . . . . . . . . . . . . . . . . . 23
Exhibit 22: Impact of Training in Last Two Years on Workers . . . . . . . . . . . . . . . . . . . . . . . . . . . . . . . . . . . . . . . . . 23
Exhibit 23: Impact of Training on Retention . . . . . . . . . . . . . . . . . . . . . . . . . . . . . . . . . . . . . . . . . . . . . . . . . . . . . . 24
LLIISSTT OOFF DDEETTAAIILLEEDD DDAATTAA TTAABBLLEESS IINN AAPPPPEENNDDIIXX DD
The tables found in Appendix D show responses by age, education level, household income, sector, and
employer size.
Table 1: 50+ Workers’ Interest in Various Types of Work-Related Training . . . . . . . . . . . . . . . . . . . . . . . . . . . . . . . 49
Table 2: Range of Desired Training Topics . . . . . . . . . . . . . . . . . . . . . . . . . . . . . . . . . . . . . . . . . . . . . . . . . . . . 50–51
Table 3: Desired Frequency of Training . . . . . . . . . . . . . . . . . . . . . . . . . . . . . . . . . . . . . . . . . . . . . . . . . . . . . . 52–53
Table 4a and b: Overall Participation in Training . . . . . . . . . . . . . . . . . . . . . . . . . . . . . . . . . . . . . . . . . . . . . . . 54–55
Table 5: Participation in Requested or Desired Training within Past Two Years. . . . . . . . . . . . . . . . . . . . . . . . . 56–57
Table 6: Satisfaction with Training Offered by Employer . . . . . . . . . . . . . . . . . . . . . . . . . . . . . . . . . . . . . . . . . . . . 58
Table 7: Company Support for Training. . . . . . . . . . . . . . . . . . . . . . . . . . . . . . . . . . . . . . . . . . . . . . . . . . . . . . . . . . 59
Table 8: Variety of Training Methods Employers Offer . . . . . . . . . . . . . . . . . . . . . . . . . . . . . . . . . . . . . . . . . . . 60–61
Table 9: Reasons for Dissatisfaction with Training . . . . . . . . . . . . . . . . . . . . . . . . . . . . . . . . . . . . . . . . . . . . . . 62–63
Table 10: Obstacles to Participating in Training . . . . . . . . . . . . . . . . . . . . . . . . . . . . . . . . . . . . . . . . . . . . . . . . 64–65
Table 11: Value of Training in Last Two Years to Job or Career . . . . . . . . . . . . . . . . . . . . . . . . . . . . . . . . . . . . . . . . 66
Table 12: Impact of Training in Last Two Years on Workers. . . . . . . . . . . . . . . . . . . . . . . . . . . . . . . . . . . . . . . . 67–68
Table 13: Impact of Training on Retention . . . . . . . . . . . . . . . . . . . . . . . . . . . . . . . . . . . . . . . . . . . . . . . . . . . . . . . 69
Table 14: Workers’ Comfort with Various Training Approaches. . . . . . . . . . . . . . . . . . . . . . . . . . . . . . . . . . . . . 70–71

A REPORT FOR AARP PREPARED BY TOWERS PERRIN 3
EXECUTIVE SUMMARYPowerful demographic and business trends are
converging in ways that focus new attention on the
training and development function in U.S. companies.
First, the aging of the baby boomer generation,
combined with declining birthrates and increasing life
expectancies, is sparking profound shifts within the
U.S. labor force. While no one can say for sure whether
baby boomer retirements will trigger the massive
skilled-labor shortages that some have predicted,
slowing labor force growth means that 50+ workers will
likely figure more prominently in the workplace than
ever before.
Second, faced with tightening labor pools, the ever-
quickening pace of business change, the maturation
of the knowledge economy, rapid technological
advancement, and the increased competitiveness
accompanying globalization, today’s organizations face
unrelenting pressure to continuously build and sustain
workforce knowledge and expertise through rigorous
training initiatives.
Data from the American Society for Training and
Development (ASTD) 2005 State of the Industry Report
indicate that the overall investment in employee
learning has grown from $645 per employee per year in
1995 to $955 in 2004, which represents more than an
inflation-adjusted increase.1 Perhaps more noteworthy
is that training today has earned a place on the
executive agenda: IBM’s 2004 Global CEO study found
that 75% of CEOs believe that employee education is
critical for future enterprise success.2
Yet, as companies invest more than ever in strategic
new learning initiatives, prior research suggests that few
are taking shifting demographics into account. As
expressed in a 2006 study jointly conducted by IBM
and ASTD, “Many learning functions have yet to develop
a comprehensive plan for addressing the needs of
their organizations with respect to changing workforce
demographics.”3 In fact, that study found that only
16 percent of learning executives surveyed viewed
changing workforce demographics as a priority area.
Furthermore, as noted in AARP’s 2005 study, American
Business and Older Employees: A Focus on Midwest
Employers, most employers in the Midwest have not
implemented training programs in an effort to attract
and retain mature workers. According to that survey,
less than half (48% of the 679 respondents) said they
had training programs targeting older employees.4
Given the attention both workforce demographics and
training imperatives have received from the media and
business communities, the relative lack of training
targeting the increasingly important 50+ segment of
the workforce is puzzling.
Might this dearth of programs reflect a systematic
belief among employers that training people age 50+ is
an unjustified use of scarce resources and that younger
workers presumably have a longer time horizon over
which to produce a return on companies’ training
investments? Do negative perceptions regarding the
50+ population’s desire and ability to learn persist,
even today? Are workers ages 50+ interested in
receiving training? Do they value learning opportunities?
To answer some of these questions, AARP contracted
with Towers Perrin and Knowledge Networks to explore
the perceptions and experiences of 50+ workers
themselves, as well as the perceptions of a select group
of employers recognized for their progressive training
programs. The study relied on two key data sources:
An online survey administered to a nationally
representative segment of workers ages 50+. The
survey sample was drawn from individuals who
worked full- or part-time at companies with at least
10 employees. The survey provided extensive data on
1 Sugrue, B. & Rivera, R. (2005). State of the Industry Report. Alexandria, VA: ASTD
2 IBM Business Consulting Services. “Your Turn: The Global CEO Study 2004,” p. 36. The study was based on interviews of 456 CEOs worldwide.
3 IBM Business Consulting Services, in association with the American Society of Training and Development. “Closing the Generational Divide: Shifting Workforce Demographics and
the Learning Function,” p. 1. 2006. The study was an online survey of 239 learning executives.
4 AARP. “American Business and Older Employees: A Focus on Midwest Employers,” p. 12. 2005.

4 INVESTING IN TRAINING 50+ WORKERS: A TALENT MANAGEMENT STRATEGY
worker views of, and satisfaction with, the training
opportunities they receive. The worker survey was
fielded by Knowledge Networks in December 2006
and garnered 1,048 qualified responses.
Interviews with 20 human resource and training
executives at companies identified by AARP and
Towers Perrin as likely to have strong training and
development programs that might serve as models
for other companies. The goal was to gain further
insight into how these organizations view training
broadly as well as their assessment of the
advantages and disadvantages of training workers
ages 50+ specifically.
This research produced some important insights:
50+ workers are highly receptive to training
opportunities, particularly those aimed at improving
specific business and technical skills. The strong
appetite that many 50+ workers demonstrate for
work-related training suggests that employers should
make sure to consider the needs and interests of
these workers when developing training programs.
Many 50+ workers report that they actively and
regularly attend training programs, and participate
in a wide variety of ways, which suggests that their
employers take an age-neutral approach to training.
While these findings indicate that many 50+ workers
believe that their employers do provide sufficient
training options, opportunities for improvement exist.
For example, more than half of respondents who have
taken work-related training say that the training
offered to them is not always appropriate for their
needs or that participation is not always possible due
to busy schedules. Additionally, more than one-third
of respondents do not feel that their company offers
all of the training opportunities that they need to
keep their skills up-to-date, and more than one in
four do not think that all workers at their company
have equal access to training.
Workers age 50+, as well as the select group of
training leaders who were interviewed, indicate that
training 50+ workers produces tangible benefits both
for the workers and the organization. Workers say
training improves their productivity and career
prospects, while the interviewed organizations point
to retention as an important outcome.
The findings from the study should dispel many of the
doubts employers may still harbor about the value of
making training investments in the 50+ workforce, as
well as concerns about how mature workers view such
training. The majority of respondents not only
demonstrated enthusiasm for learning in general, but
also expressed interest in various kinds of ongoing, job-
specific skill development opportunities that build both
organizational competitiveness and individual expertise.
Significantly, 50+ workers also reported that their
participation in training translates into organizational
value as expressed by improved productivity,
promotability, and retention.
If the study findings reveal a call to action, it is for
organizations to more closely match their training
investments to both enterprise strategy and employee
needs to ensure that their organizations remain
competitive in today’s challenging business environ-
ment. Given the growing complexity of technology, and
the relationships and processes needed to do business
in a more global marketplace, offering effective training
programs and opportunities across the demographic
spectrum is fast becoming a business imperative in
many companies and industries.
Following is a closer look at the key findings of this
important research.

A REPORT FOR AARP PREPARED BY TOWERS PERRIN 5
KEY FINDINGS50+ Workers Want Training—the MoreSkill-Focused, the BetterOVERALL INTEREST IN TRAININGIf there is one overarching theme that emerges from
the survey findings, it is that the passion for knowledge
does not disappear or diminish simply because a worker
passes the age 50 threshold. Whether gauged by
interest levels, participation rates, satisfaction meas-
ures, or perceived performance outcomes, 50+ workers’
enthusiasm for learning in general—and workplace
training in particular—ranks high. Indeed, with 93
percent of survey respondents reporting that they enjoy
learning new things, and 77 percent expressing interest
specifically in work-related education, the 50+ segment
exhibits a high level of commitment to lifelong learning
(Appendix C, Questions 9 and 13).
PERSPECTIVES OF SELECTED EMPLOYERSMature workers’ desire for, and positive responses to,
training are not going unnoticed by training leaders.
The select group of employers interviewed for this study
generally describes 50+ workers as enthusiastic
participants in training programs. The employers also
note that these workers appear to place a high value on
the available training opportunities, which suggests, in
turn, that these workers probably also value organizations
that extend numerous and varied training programs.
Among the observations of the training leaders
interviewed were the following:
“Older workers value training as much as the younger
workforce does.” (Stanley Consultants)
“In some ways, I think older workers value the training
we offer even more because it gives them the
opportunity to choose [a career change].”
(Bon Secours Richmond Health System)
“Older workers take [training] more seriously. They
recognize the value and appreciate the opportunity
to participate in additional training and skill
development.” (Schneider National)
“We don’t find any difference in attitude at all. We find
that people just want to keep learning and growing.
Older workers have a high level of commitment,
maturity, and intrinsic desire to learn.”
(Atlantic Health)
While that kind of broad-based receptivity to learning
is certainly important to note, it is more interesting—
and significant—to hold up the lens through which 50+
workers themselves currently view employer-
sponsored training.
DESIRED OUTCOMES OF TRAININGBy all indications, 50+ workers are casting a highly
practical, business-oriented eye on work-related training
opportunities. As shown in Exhibit 1, 50+ workers are
almost as interested in programs designed to build new
skills and advance their careers (83%) as they are in
training that updates current skills and knowledge
(90%). Although a majority (57%) also express interest in
training that would help them get an entirely different
type of job, fewer workers are interested in securing
training for entirely different careers than in securing
training related to their current career paths.
These findings are good news for employers. They not
only underscore 50+ workers’ long-term commitment to
productive careers, but also suggest that this group
maintains a strong drive to keep skills up-to-date and
relevant in an evolving business landscape.
EXHIBIT 1: 50+ WORKERS’ INTEREST IN VARIOUS TYPES OF WORK-RELATED TRAINING
Training to keep your skillsand knowledge up to date
Training to learn new skills andknowledge to advance your career
Training to learn new skills andknowledge for an entirely different
type of job
PERCENT VERY/SOMEWHAT INTERESTED
Source: December 2006 AARP survey of individuals age 50+ employed in companieswith 10 or more employees. Question 14. Base: all 1,048 respondents
90%
83%
57%

6 INVESTING IN TRAINING 50+ WORKERS: A TALENT MANAGEMENT STRATEGY
INTEREST IN SPECIFIC TYPES OF TRAININGThe majority of 50+ workers are interested in developing
both “hard” technical skills specific to their profession
as well as “soft” management-oriented skills. This
interest in both “soft” and “hard” skills is worth noting
because it shows that this growing segment of the
workforce is open to acquiring and refining some of the
very same skills that are projected to be of critical
importance to employers. For example, a 2006 ASTD
Public Policy Council white paper 5 concluded that, to
compete effectively in the 21st century economy,
organizations must begin to close emerging “skills
gaps” to create workforces that are highly competent
in a range of skill areas. These areas include:
Basic skills (the three Rs of reading, writing, and
arithmetic), customer service, communications,
and basic business acumen.
Technical and professional skills, such as computer/
technology skills, plus skills for specialized industries
(e.g., automotive, construction).
Management and leadership skills, covering areas
such as supervision, team-building, goal-setting,
planning, motivation, decision making, and ethical
judgment.
As Exhibit 2 illustrates, 50+ workers show strong
interest in many of these areas. For example, technical
or professional skills development and computer skills
training are of particular interest to these workers, with
more than seven in ten expressing interest in each of
these areas. This high interest in computer training
suggests that the majority of 50+ workers are committed
to keeping job-related skills up-to-date in an era of
rapid, ongoing technological change. Additionally, the
broad range of topics 50+ workers are interested in
indicates that these workers recognize that many of
today’s productivity-focused workplaces require a
diverse set of skills. In addition to receiving training that
further develops these “hard” skills, many 50+ workers
also exhibit interest in developing their “soft” management-
oriented skills in areas such as communication, project
management, supervision, and negotiation skills. Of the
“skills gaps” identified by ASTD, basic skills is the one
area in which most 50+ workers express very little
interest in receiving training, presumably because most
5 ASTD, “Bridging the Skills Gap,” Fall 2006, various authors from ASTD and ASTD Public Policy Council. p. 6. The white paper draws from a broad array of ASTD and other research
to define and discuss the “skills gap” the authors say is emerging between U.S. organizations’ skill needs and the capabilities of the workforce.
EXHIBIT 2: RANGE OF DESIRED TRAINING TOPICS
PERCENT VERY/SOMEWHAT INTERESTED
Source: December 2006 AARP survey of individuals age 50+ employed in companieswith 10 or more employees. Question 16. Base: all 1,048 respondents
79%Computer skills training/information
and communication technology training
72%Specific technical or professional
skills training
53%Occupational safety training
59%Formal courses that lead to certification
or degrees applicable to your job
53%Communication skills training (e.g., presentation or writing skills)
51%Career development counseling (training
on how to develop or manage your career)
50%Project management skills training
58%Supervisory or management skills training
50%Negotiation skills training
44%Required professional training (e.g., continuing legal or accounting credits)
43%Foreign language training
42%Awareness training on workplace
diversity (other than age)
41%New employee orientation training
41%Awareness training on age diversity
24%Basic skills training (e.g., basic math, or basic writing or reading skills)
17%English as a second language (ESL) classes
9%Other

A REPORT FOR AARP PREPARED BY TOWERS PERRIN 7
of them have no need for such basic training and are
substantially more focused on developing advanced
skills and knowledge specific to certain careers and jobs.
In addition to striking the right balance of training topics,
employers should also strive to achieve the right training
frequency. As Exhibit 3 shows, nearly half (47%) of 50+
workers regard one to four times a year as optimal.
Significantly fewer respondents would prefer to receive
training monthly (16%) or more often (12%), perhaps
because receiving training with such frequency would
interfere with meeting regular job responsibilities.
SELECTED DIFFERENCES BY EDUCATION, INCOME,AGE, AND EMPLOYER SIZEAlthough the majority of respondents expressed interest
in training regardless of age, education level, household
income, or company size, some differences did surface.
Among the observations worth noting:
Overall Interest in Training
Workers with no formal education beyond high school
have less overall interest in work-related training than
do better-educated workers (66% vs. 84%), perhaps
because workers who are less educated are less likely
than other workers to receive information about the
potential benefits to be reaped from training. Similarly,
workers in companies with fewer than 50 employees
show less overall interest in training than do workers at
companies with at least 50 employees (66% vs. 81%).
Desired Outcomes of Training
Respondents age 65+ (57%), along with respondents
who have only a high school education or less (75%),
express less interest than their counterparts ages 50-
to-64 and those with more education in learning new
skills to foster career advancement (Appendix D,
Table 1). This could indicate somewhat lower interest
in utilizing training to pursue formal career advancement
or less confidence that training will prove useful in
achieving this goal.
On the other hand, workers with household incomes
under $25,000 are more interested than those with
incomes higher than $50,000 (68% vs. 53%) in
receiving training that would equip them with new
skills necessary to get an entirely different type of
job. This suggests that lower-income workers may be
particularly likely to view training as a prerequisite for
job change, especially when the desired job is a
better-paying one.
Interest in Specific Types of Training
Compared to their younger counterparts, respondents
age 65+ expressed significantly less interest in
receiving training in certain areas, such as specific
technical or professional skills training, and supervisory
or management training (30%) (Appendix D, Table 2).
Similar differences exist by education level. For
example, workers with no education beyond high
school express less interest than workers with at least
some formal education beyond high school (vocational
school, college, or postgraduate) in receiving technical
or professional skills training (64% vs. 77%). Moreover,
fewer than half (48%) of workers with no formal
education beyond high school express interest in
management training, compared to 64 percent of
workers with more formal education.
Basic skills training and occupational safety training
are the only areas in which less educated workers are
more likely to express interest than better-educated
workers. Specifically, nearly one in three (32%)
workers with no formal education beyond high school
express interest in basic skills training, compared to
EXHIBIT 3: DESIRED FREQUENCY OF TRAINING
Source: December 2006 AARP survey of individuals age 50+ employed in companieswith 10 or more employees. Question 21. Base: all 1,048 respondents
5%6%7%
16%
19%
20% 27%
Quarterly
Never
Weekly or more often
Every other week
Monthly
Not sure/it depends
1-to-3 times per year

8 INVESTING IN TRAINING 50+ WORKERS: A TALENT MANAGEMENT STRATEGY
just one in four (25%) workers with some formal
education since high school but less than a four-year
college degree, and just under one in six (16%) workers
with a four-year college degree. Additionally, close to six
in ten (59%) workers with no formal education beyond
high school and almost as many (56%) workers with
some formal education beyond high school but less
than a four-year degree express interest in occupational
safety training, compared to just over four in ten (44%)
workers with a four-year college degree.
The lower interest expressed by certain groups in
specific types of training, particularly the lower
interest expressed by the 65+ cohort, may reflect
these workers’ belief that they do not lack skills in
these areas. Conversely, the stronger interest
expressed by workers in their fifties and early sixties
as well as by those with higher levels of formal
education may reflect their greater degree of
confidence in training as a method for achieving
career-related goals, or an understanding of the
importance of maintaining and updating skills
necessary to fulfill the demands of their job.
50+ Workers are Highly Flexible andAdaptable LearnersThe 50+ workers surveyed report that they are
comfortable with a range of learning modes.
Specifically, when asked to rate their comfort with
each of eight different learning methods, including
classroom-based methods and online methods, the
majority of 50+ workers reported that they would be
comfortable with each method presented. As shown
in Exhibit 4, classroom-based training is clearly the
preferred learning method, with nine in ten (90%)
expressing comfort with classroom training in a small
group of less than five participants and just over eight
in ten (81%) expressing comfort with classroom training
in a group of five or more participants. However, a large
majority (71%) also indicate that they would be
comfortable with self-study delivered online or via
computer and more than six in ten (62%) would be
comfortable with live online, instructor-led training,
tending to contradict the conventional wisdom that
50+ workers are uncomfortable using technology
for learning.
SELECTED DIFFERENCES BY EDUCATION AND AGEAs with interest in training, the survey did reveal some
differences across demographic groups regarding
comfort with technology-based learning methods.
For example:
Comfort with Online or Computer-Based Self-Study
While three in four (75%) workers ages 50-to-59 say
they would be comfortable with online or computer-
based self-study, just over half of workers age 65+
(52%) say they would be comfortable participating in
this type of training (Appendix D, Table 14). Similarly,
workers with at least some formal education beyond
high school (vocation school, college, or postgraduate)
are significantly more likely than workers with no
formal education beyond high school to say that they
would be comfortable with this method of training
(77% vs. 59%).
Comfort with Live Online, Instructor-Led Training
More than six in ten (64%) workers ages 50-to-59 feel
that they would be very or somewhat comfortable
EXHIBIT 4: WORKERS’ COMFORT WITH VARIOUS TRAINING APPROACHES
PERCENT VERY/SOMEWHAT COMFORTABLE
Source: December 2006 AARP survey of individuals age 50+ employed in companieswith 10 or more employees. Question 20. Base: all 1,048 respondents
Being mentored or taught on thejob by other employee(s)
Formal one-on-one training
Self-study online orcomputer-based
Live online trainingwith an instructor
Conferences, workshops, seminars
Classroom training in a small group (fewer than five
participants)
Classroom training in a larger group (five or more participants)
Self-study using written/paper materials (not computer-based)
90%
83%
81%
80%
80%
71%
67%
62%

A REPORT FOR AARP PREPARED BY TOWERS PERRIN 9
with live online, instructor-led training, while just over
half (53%) of workers age 65+ expressed such
comfort. While over two in three (68%) workers with
at least some formal education beyond high school
(vocation school, college, or postgraduate) feel that
they would be very or somewhat comfortable with
this type of training, just over half (51%) of workers
with no formal education beyond high school share
this feeling.
It is not clear, however, what these findings actually
reflect. Workers in the highest age category may be
among the most senior and experienced workers in
the organization. They may just believe that they have
less to gain from ongoing training. And as far as their
preferred mode of study, it is a well-documented fact
that learning styles vary widely across any sizable
population of individual learners, regardless of age.6
Despite the above differences between workers in the
survey’s highest age category (ages 65+) and those in
other age groups, it is worth noting that the majority
of those in the 65+ age group not only expressed
interest in computer skills training but also said that
they would be comfortable participating in computer-
based or online self-study. These findings clearly
contradict the myth that mature workers are universally
uncomfortable with technology. Furthermore, workers
age 65+ are just as likely as most other 50+ workers
to report that they do not have difficulty keeping up
with the technology needed to perform their work.
PERSPECTIVES OF SELECTED EMPLOYERSInterviews with the select group of training leaders offer
some insight into how companies view the technology
issue. Consider the following statements:
“Our older workers do not tend to be intimidated by
technology—they embrace it readily. However, some
younger workers see the video simulations we use for
training as a video game and don’t take it seriously.
Older workers take it more seriously. They recognize
the value and appreciate the opportunity to partici-
pate in additional training and skill development.”
(Schneider National)
“We have found that the ability to use a computer
does not differ by age. It is not an age issue but an
accessibility issue. If you have not been exposed
to computers, you need to be trained, whether you
are 55 or 25.”
(L.L.Bean)
“The notion that people over age 50 require special
training in order to master new technology is a little
outdated. Technology has penetrated companies at
high levels. Today people are much more comfortable
with technology—everybody touches it.”
(Hewlett-Packard)
“There are always different levels of comfort with
technology, but this is a technically savvy company.
Everybody uses computers.”
(Air Products and Chemicals, Inc.)
Most 50+ Workers Are Satisfied withAvailable Training PARTICIPATION AND PERCEIVED ADEQUACYOF TRAININGGiven the enthusiasm 50+ workers show for workplace
training, it would follow that participation rates would
be high—as long as employers are providing relevant
programs and extending access to them broadly and
conveniently. The employee survey findings show that
the vast majority of 50+ workers are, in fact, attending
employer training. Moreover, these workers say that,
for the most part, the programs have been effective in
helping them to meet job and professional requirements.
Overall, 84 percent of the 50+ workers surveyed say
they have received employer-provided training at some
6 Talmadge, G. K., & Shearer, J. W. (1969). “Relationship among learning styles, instructional methods and the nature of learning experiences.” Journal of Educational Psychology, 57,
222-230. Dunn, R. (1979) “Learning—A matter of style.” Educational Leadership 36(6) 430-432. Barbe, W. B., & Swassing, R. H. (1979). Teaching through modality strengths. New
York, NY: Zane-Bloser, Inc.; Stronck, D. R. (1980). “The educational implications of human individuality.” American Biology Teacher, 42, 146-151.

10 INVESTING IN TRAINING 50+ WORKERS: A TALENT MANAGEMENT STRATEGY
point during their careers, and two-thirds (66%) of the
workers surveyed say they have participated in training
within the past two years (Exhibit 5).
As noted in the ASTD white paper, and also in a Wall
Street Journal online interview of Robert Reich, skill
development to enhance worker performance is
regarded as among the most important issues facing
U.S. companies.7,8 Against that backdrop, the grades
50+ workers give workplace training emerge as helpful
indicators of how well employers are addressing this
issue. Workers’ responses also help reveal whether, and
the extent to which, they believe that some of their
training needs are being neglected.
In fact, most 50+ workers report that the training made
available to them is sufficient for their needs. For example,
as Exhibit 5 shows, fully three in four (75%) of those who
have received training within the past two years believe
that they have participated in enough work-related
training to meet job and professional development
requirements.
7 ASTD, “Bridging the Skills Gap,” Fall 2006, various authors from ASTD and ASTD Public Policy Council. p. 4.
8 Preparing the Work Force: An Interview with Robert B. Reich, by Tony Bingham, President and CEO of ASTD and Pat Galagan, Executive Editor of ASTD that appeared on
CareerJournal.com (Wall Street Journal’s Executive Career Site) on Sept. 26, 2006. Reich, author of The Work of Nations book was Secretary of Labor under President Bill Clinton.
EXHIBIT 5: OVERALL PARTICIPATION IN TRAINING
PERCENT RESPONDING YES
84%
66%
75%
Source: December 2006 AARP survey of individuals age 50+ employed in companieswith 10 or more employees. Questions 17, 22 and 23. Base for Question 17 and Question 22 is all 1,048 respondents. Base for Question 23 is 692 respondents who saythey have participated in work-related education or training in past 2 years.
Have you ever received work-related education or participated in
work-related training? (Question 17)
In the past two years, haveyou participated in any
work-related education or training? (Question 22)
Have you participated in a sufficient number of work-related education and training opportunities within the past
two years to meet your job requirements and professional development needs?
(Question 23)
EXHIBIT 7: SATISFACTION WITH TRAINING OFFERED BY EMPLOYER
Source: December 2006 AARP survey of individuals age 50+ employed in companieswith 10 or more employees. Question 10. Base: all 1,048 respondents
EXHIBIT 6: PARTICIPATION IN REQUESTED OR DESIRED TRAINING WITHIN PAST TWO YEARS
Source: December 2006 AARP survey of individuals age 50+ employed in companieswith 10 or more employees. Question 24. Base: all 1,048 respondents
1%
14%35%
44%
8%
8%
24%
27%
40%
Very dissatisfied
Somewhat dissatisfied
Very satisfied
Somewhat satisfied
Refused
Did not participate in any of the training requested/desired
Participated in some but not all requested/desired training
Did not request or desire any training
Participated in all training requested/desired

A REPORT FOR AARP PREPARED BY TOWERS PERRIN 11
Furthermore, as shown in Exhibit 6, approximately two
in three (67%) 50+ workers say that they received either
all of the training they requested or desired (40%) within
the past two years, or that they had no specific training
requests or desires (27%) during this period. It appears
that many companies are respecting and responding to
workers’ expressed training needs.
However, the fact that close to one in four (24%)
workers report that they were able to participate in
only some of the training requested or desired and
another eight percent were unable to participate in
any such training suggests that some 50+ workers
do face barriers to training, which will be discussed
further in a subsequent section.
DRIVERS OF SATISFACTIONEncouragingly, more than three in four of the survey
respondents (79%) indicate that they are very or some-
what satisfied with the training offered to them by their
employers (Exhibit 7).
More specifically, a more-detailed analysis of the survey
findings indicates that the availability of certain training
topics and modes is closely correlated with overall
satisfaction with training programs. As Exhibit 8 shows,
the top drivers of respondents’ satisfaction with training
include the ability to participate in specific technical or
professional skills training, access to career development
counseling, getting paid time off to pursue education or
training without losing vacation days, and the availability
of hands-on training opportunities.
The top drivers of satisfaction are interesting to note
due to their potential to influence employees’ overall
sense of fulfillment with their jobs and, by extension,
perhaps help foster employee engagement, which is
broadly defined as the level of discretionary effort
employees are willing to put into their jobs. Towers
Perrin research has shown that organizations with higher
levels of employee engagement tend to outperform
those organizations with lower levels on key financial
measures relative to industry benchmarks.9
Towers Perrin research also shows that employee
engagement is driven by many factors such as financial
and non-financial rewards, organizational culture,
company leadership, and also having the opportunity to
learn new skills. In this study, the drivers of employee
EXHIBIT 8: DRIVERS OF TRAINING SATISFACTION
Source: December 2006 AARP survey of individuals age 50+ employed in companies with 10 or more employees. Base: all 1,048 respondents.
Q11: Access to specific technical or professional skills training Q11: Access to career development counseling (Which of the following work-related education and training opportunities or programs does your employer currently pay for or provide to its employees?)Q12: Access to paid time off for education or training without affecting an employee's vacation leave Q12: Access to hands-on training (Through which of the following methods does your employer provide work-related education or training to its employees?)
*Correlation coefficient. Drivers of training satisfaction (Question 10) were determined through stepwise linear regression using the items in Question 11 (work-related education and training paid for or provided by employer) and Question 12 (methods through which employer provides work-related education or training). Items shown are those that achieve statistical significance at the .01 level.
Q11: Career development counseling
Q12: Paid time off for trainingQ10: Training satisfaction
Q11: Technical skills training
Q12: Hands-on training
.40*
.31*
.45*
.27*
9 “Working Today: Understanding What Drives Employee Engagement.” 2003 Towers Perrin Talent Report. Pages 18–21.

12 INVESTING IN TRAINING 50+ WORKERS: A TALENT MANAGEMENT STRATEGY
engagement can only be analyzed in the context of
training; but, as Exhibit 9 shows, overall satisfaction
with training programs and encouragement from one’s
boss for pursuing training emerge as important
engagement drivers.
Given the findings regarding the connection between
engagement and encouragement from supervisors to
pursue training, it is promising to note that just over
two-thirds (68%) of 50+ workers say that their
supervisor encourages them to participate in education
and training opportunities (Exhibit 10). And more than
seven in ten (72%) say that all workers at their company,
regardless of age or position, have equal access to
training. However, as discussed in the next section,
opportunities for improving training access and delivery
do exist.
SELECTED DIFFERENCES IN PARTICIPATION ANDPERCEIVED ADEQUACY (BY EDUCATION, INCOME,EMPLOYER SIZE, AND SECTOR)As with interest in training, workers’ participation in
training increases with educational level. As Exhibit 11
shows, compared to respondents with less education,
respondents with higher levels of education are more
likely to have participated in work-related training over
the past two years. Moreover, respondents with at least
a four-year college degree (30%) are more likely than
those with no formal education beyond high school
(22%) to strongly agree that their organization provides
all of the training that they need to keep their skills
up-to-date.
The reasons for these differences may vary. For example,
people who are adept at learning may receive more
learning opportunities or people with more education
may be perceived as having greater promotion potential,
prompting more company investment in training for
those better-educated workers. Alternatively, it may be
that these better-educated workers have jobs that
require more training or already have a keen sense of
what kinds of training will benefit them most and,
therefore, take the initiative to pursue such training
EXHIBIT 10: COMPANY SUPPORT FOR TRAINING
PERCENT STRONGLY/SOMEWHAT AGREE
72%
68%
64%
Source: December 2006 AARP survey of individuals age 50+ employed in companieswith 10 or more employees. Questions 9.2, 9.3, 9.9. Base: all 1,048 respondents.
All workers in my company, regardless of their age or position,
have equal access to education and training opportunities
My boss encourages me to take the training I need to do
my job well
My company offers all the education and training
opportunities that I need to keep my skills up to date
EXHIBIT 9: TRAINING-RELATED DRIVERS OF JOB MOTIVATION
Source: December 2006 AARP survey of individuals age 50+ employed in companies with 10 or more employees. Base: all 1,048 respondents.
Q9: Enjoy job (Agreement with “I enjoy working at my current job”) Q10: Overall satisfaction with training (Overall, how satisfied are you with the work-related education and training opportunities offered to you by your employer?)Q9: Encouragement from boss to take training (Agreement with “My boss encourages me to take the training I need to do my job well”)
*Correlation coefficient. Training-related drivers of job motivation (Question 7) were determined through stepwise linear regression using the items in Question 9 (general observations about training) and Question 10 (satisfaction with work-related education and training opportunities paid for or provided by employer). Items shown are those that achieve statistical significance at the .01 level.
.35*
.33*
.52*Q9: Enjoy job
Q10: Training satisfaction Q7: Job Motivation
Q9: Boss encourages me to take training

A REPORT FOR AARP PREPARED BY TOWERS PERRIN 13
successfully. Regardless of the reason for this
difference by education level, the pattern is
nevertheless clear.
Training participation also varies depending on the
kinds of organizations respondents work for and their
income level (Appendix D, Tables 4a and 4b). For
example, while more than eight in ten (83%) workers
with household incomes of $75,000 or more have
participated in work-related training in the past two
years, this is true for fewer than six in ten (57%) workers
with household incomes under $50,000. Additionally,
those in larger organizations (10,000+ employees) and
in the educational sector (public and private schools)
are more likely than other respondents to have
participated in training and to believe that their
organizations provide all the education and training
opportunities needed to keep their skills up to date. In
fact, as with the highly educated workers, respondents
in larger organizations and in the educational sector
are more likely than others to feel that their direct
supervisors encourage them to participate in training
and that access to training is independent of age
(Appendix D, Table 7).
What sets these organizations apart? One hypothesis
is that educational institutions naturally extend their
educational mission to their employees and have a
deep cultural focus on education and training in
general. As for the larger organizations, it may well
come down to investment budgets, which tend to be
larger overall for a variety of employee programs,
including training.
On the other end of the spectrum, workers in the for-
profit sector, those in smaller companies, and the more
mature workers (age 65+) are less likely to report that
they have received training in the past two years than
are other workers. It is possible that, compared to other
workers, these individuals are less focused on—or
attentive to—training as a performance improvement or
career advancement strategy or that they might not feel
the need for training as they already have the necessary
skills. It is also likely that smaller organizations and
those in certain sectors spend less on training as is
discussed on the next page.
Opportunities for Improvement in TrainingDefinitely Exist TRAINING DELIVERY METHODSWhen asked which of nine specific training methods
their employer offers, the majority (59%) of respondents
report that only four or fewer methods are available to
them. As shown in Exhibit 12, practical hands-on training
is the most common method, with more than 80 percent
of the respondents reporting that their employers
extend this option. Trailing behind in prevalence are
methods such as opportunities to participate in
professional conferences and seminars, classroom
training, computer-based learning, tuition reimbursement,
temporary assignments in other departments, and
mentoring programs.
As with other aspects of training, 50+ workers’
perceptions of the range of training methods available
to them vary by education and income level (Appendix D,
Table 8). Survey respondents with more education and
EXHIBIT 11: TRAINING PARTICIPATION BY EDUCATION LEVEL
PARTICIPATION IN WORK-RELATED EDUCATIOOR TRAINING OVER PAST TWO YEARS
HIGHEST LEVEL OFEDUCATION COMPLETED
Source: December 2006 AARP survey of individuals age 50+ employed in companieswith 10 or more employees. Question 22 (training participation) and Question 45 (education level completed). Base for each bar is shown next to each bar.
Post-graduate degree (n=152)
Some post-graduate work,but no degree (n=80)
4-year college graduate (n=133)
Associate degree,some college (n=210)
Vocational or trade school (n=94)
High school graduate (n=304)
Some high school or less (n=70) 68%32%
45%55%
34%66%
38%63%
25%75%
13%87%
892%
Yes No

14 INVESTING IN TRAINING 50+ WORKERS: A TALENT MANAGEMENT STRATEGY
higher household incomes are more likely than
respondents with less education and lower incomes to
report that their employers offer a variety of the training
delivery methods noted in Exhibit 12. One reason may
be that better-educated individuals and those with
higher incomes occupy more senior positions,
increasing the likelihood that they know about and
have access to a broader range of training modes.
Workers’ accounts of the training methods available
to them also vary by type of organization. For example,
workers from schools, government entities, and non-
profits are more likely than those from for-profits to
report access to many of the training methods. This
may be because these organizations offer generous and
flexible learning opportunities as part of their implicit
contract with employees, partly in recompense for
lower wages. Respondents from the large organizations
also report a wide variety of available training
approaches, no doubt because those organizations
have the financial resources to invest in a multifaceted
approach to training delivery.
INTEREST VS. ACCESSFurthermore, gaps exist between what employees want
or need and their perception of what their employer
provides or funds. As shown in Exhibit 13, these gaps
widen to gulfs in some cases, particularly in the areas
of computer skills, career development counseling, and
formal certification and degree courses. For example,
more than eight in ten (84%) workers ages 50-to-54
express interest in receiving computer training; however,
only approximately half (52%) of workers in this age
group believe that their employer offers such training.
Moreover, of workers age 65+, approximately six in ten
(61%) say that they would like to receive computer
training even though only about four in ten (43%)
workers in this age bracket report that their employers
make this training available.
INTEREST VS. PARTICIPATIONSimilar gaps appear between the training in which
workers age 50+ express interest and the training they
have actually received over the last two years (Exhibit 14).
For example, more than six in ten workers ages 50-to-
54 (66%) and workers ages 55-to-59 (61%) say that they
are interested in receiving management skills training,
yet only a minority of workers in this age group (12% of
workers ages 50-to-54 and 13% of workers ages 55-to-
59) have taken such training within the past two years.
Taken together, these findings suggest that there are a
number of ways employers can improve their strategies
for addressing the learning needs and interests of their
workers, particularly those of the 50-to-54 and
55-to-59 subgroups.
CERTAIN SEGMENTS PERCEIVE INSUFFICIENTEMPLOYER SUPPORT FOR TRAINING More than one-third of workers age 50+ (36%) do not
think that their company offers all of the education and
training opportunities that they need to keep their skills
up-to-date. This is particularly true of workers at smaller
EXHIBIT 12: VARIETY OF TRAINING METHODS EMPLOYERS OFFER
TRAINING METHODS PERCENT RESPONDING YES
Source: December 2006 AARP survey of individuals age 50+ employed in companieswith 10 or more employees. Question 12. Base: all 1,048 respondents.
82%Hands-on training
59%Participation at professional
conferences, seminars,or workshops
59%Classroom training (offered at your
company or another location)
46%Online or computer-based training
42%Tuition reimbursement (including
partial reimbursement)
33%Temporary assignments
in other departments
32%Paid time off for education ortraining without affecting an
employee’s vacation leave
13%Formal job rotation program
27%Formal mentoring program

A REPORT FOR AARP PREPARED BY TOWERS PERRIN 15
companies with fewer than 500 employees (44%) as
well as workers in the for-profit sector (40%) (Exhibit 15).
Moreover, nearly one-third of workers 50+ (32%) do not
feel that their boss encourages them to take the training
needed to do their job well. Compared to other workers,
workers age 65+ (46%), those with no education beyond
high school (37%), those with household incomes under
$50,000 (37%), those in companies with fewer than 500
employees (39%), and workers in the for-profit sector
(36%) are more likely to say that their boss does not
encourage them to take the training needed to do their
job well. This lack of encouragement from supervisors
to take training may be yet another reason for the lower
levels of participation in training among these workers.
Furthermore, more than one-quarter of workers age 50+
(28%) do not believe that workers in their company have
equal access to training regardless of age or position.
Encouragingly, this finding did not vary by age group
within the 50+ segment; however, it did vary by sector
as well as by education level. For example, only one-
quarter (24%) of workers with a four-year college degree
perceive that all employees do not have equal access,
EXHIBIT 13: WORKERS’ TRAINING INTERESTS VS. EMPLOYERS’ POLICIES IN PROVIDING OR PAYING FOR TRAINING
AGE GROUP: 50–54
Source: December 2006 AARP survey of individuals age 50+ employed in companies with 10 or more employees.Question 11 (employer pays for or provides program) and Question 16 (interest in participation). Base: all 1,048 respondents.
84%52%
79%62%
68%44%
66%48%
59%24%
57%34%
56%66%
55%
51%33%
24%
56%32%
Computer skills training/information andcommunication technology training
Specific technical or professional skills training
Formal courses that lead to certificationor degrees applicable to your job
Supervisory or management skills training
Career development counseling
Project management skills training
Occupational safety training
Negotiation skills training
Communication skills training
Required professional training
Percentage saying employer pays for or provides a particular training
Percentage saying very/somewhat interested
Note: Chart includes only training for which 50% or more of respondents indicated interest

16 INVESTING IN TRAINING 50+ WORKERS: A TALENT MANAGEMENT STRATEGY
EXHIBIT 13: WORKERS’ TRAINING INTERESTS VS. EMPLOYERS’ POLICIES IN PROVIDING OR PAYING FOR TRAINING (cont’d)
Source: December 2006 AARP survey of individuals age 50+ employed in companies with 10 or more employees.Question 11 (employer pays for or provides program) and Question 16 (interest in participation). Base: all 1,048 respondents.
80%60%
74%66%
61%48%
61%39%
57%43%
52%33%
51%29%
74%
55%
57%
62%
66%
52%
61%43%
34%
55%
Percentage saying employer pays for or provides a particular training
Percentage saying very/somewhat interested
Note: Chart includes only training for which 50% or more of respondents indicated interest
Computer skills training/information andcommunication technology training
Computer skills training/information andcommunication technology training
Specific technical or professional skills training
Supervisory or management skills training
Communication skills training
Formal courses that lead to certificationor degrees applicable to your job
Career development counseling
Project management skills training
Specific technical or professional skills training
Occupational safety training
Communication skills training
Computer skills training/information andcommunication technology training
AGE GROUP: 55–59
AGE GROUP: 60–64
AGE GROUP: 65+

A REPORT FOR AARP PREPARED BY TOWERS PERRIN 17
EXHIBIT 14: WORKERS’ TRAINING INTERESTS VS. ACTUAL PARTICIPATION
AGE GROUP: 50–54
Source: December 2006 AARP survey of individuals age 50+ employed in companies with 10 or more employees. Question 25b (have participated in last two years) and Question 16 (interest in participation). Base: all 1,048 respondents for Question 16, adjusted to 1,048 for Question 25b,taking into account 336 respondents who said they had not participated in work-related training in the past 2 years.
84%31%
79%41%
68%16%
66%12%
59%8%
57%3%
56%29%
56%
55%3%
7%
Computer skills training/information andcommunication technology training
Specific technical or professional skills training
Formal courses that lead to certificationor degrees applicable to your job
Supervisory or management skills training
Career development counseling
Project management skills training
Occupational safety training
Negotiation skills training
51%11%
Communication skills training
Percentage saying they participated in work-related education or training during past 2 years
Percentage saying very/somewhat interested
Note: Chart includes only training for which 50% or more of respondents indicated interest
Required professional training

18 INVESTING IN TRAINING 50+ WORKERS: A TALENT MANAGEMENT STRATEGY
EXHIBIT 14: WORKERS’ TRAINING INTERESTS VS. ACTUAL PARTICIPATION (continued)
Source: December 2006 AARP survey of individuals age 50+ employed in companies with 10 or more employees. Questions 25b (have participated in last two years) and 16 (interest in participation). Base: all 1,048 respondents for Question 16, adjusted to 1,048 for Question 25b,taking into account 336 respondents who said they had not participated in work-related training in the past 2 years.
80%34%
74%40%
61%13%
61%12%
57%8%
52%6%
51%9%
74%
66%
55%23%
52%
61%24%
10%
35%
34%
Percentage saying they participated in work-related education or training during past 2 years
Percentage saying very/somewhat interested
Note: Chart includes only training for which 50% or more of respondents indicated interest
Computer skills training/information andcommunication technology training
Computer skills training/information andcommunication technology training
Specific technical or professional skills training
Supervisory or management skills training
Communication skills training
Formal courses that lead to certificationor degrees applicable to your job
Career development counseling
Project management skills training
Specific technical or professional skills training
Occupational safety training
Communication skills training
Computer skills training/information andcommunication technology training
AGE GROUP: 55–59
AGE GROUP: 60–64
AGE GROUP: 65+

A REPORT FOR AARP PREPARED BY TOWERS PERRIN 19
compared to one-third (33%) of workers with some
vocational school or college education but less than a
four-year college degree (Exhibit 16).
SOME WORKERS FEEL THEIR SKILLS ARE LACKINGWhen directly asked to identify areas in which they are
lacking the skills, knowledge, or training needed to do
their job well, workers age 50+ are most likely to identify
foreign language training (33%) and computer skills
training (33%) (Exhibit 17). Other areas in which at least
one in five 50+ workers believe that they are lacking
skills or training important for their jobs include specific
technical or professional skills training, formal courses
that lead to certification or degrees, supervisory or
management skills training, and project management
skills training. Compared to workers with a four-year
college degree or higher, workers with less education
are more likely to believe that they need certain types
of training to do their jobs well, such as formal courses
that lead to degrees or certification and basic skills
training (Exhibit 18). Although few differences emerged
by age group, for certain skill sets including specific
professional or technical skills and communication
skills, workers age 65+ are less likely than workers in
other age groups to feel that they need additional
training in order to perform well. These differences by
education level and age may reflect differences in job
requirements, differences in the experiences and skill
sets acquired by these workers, or a combination of
these factors.
It is worthwhile to note that, even though nearly one-
third (33%) of workers age 50+ cite computer skills
training when asked to identify areas in which they
EXHIBIT 15: WORKERS WHO REPORT INSUFFICIENT COMPANY SUPPORT FOR TRAINING
BY SECTOR:
BY COMPANY SIZE:
10–49 employees (n=147)
50–499 employees (n=297)
500–9,999 employees (n=305)
Source: December 2006 AARP survey of individuals age 50+ employed in companieswith 10 or more employees. Question 9.3. Base for each bar is shown next to each bar.
10,000+ employees (n=209)
Percent of workers in each sector and employer size group who do not agree that their company offers all the education and training opportunities that they need to keep their skills up to date.
24%
29%
35%
40%
Schools--Public andPrivate (n=170)
Nonprofit (n=92)
Government (n=138)
For-profit (n=582)
23 %
32 %
43 %
45 %
EXHIBIT 16: WORKERS WHO PERCEIVE UNEQUAL ACCESS TO TRAINING
BY EDUCATION LEVEL:
BY SECTOR:
Source: December 2006 AARP survey of individuals age 50+ employed in companieswith 10 or more employees. Question 9.9. Base for each bar is shown next to each bar.
Percent of workers within each education level and sector who do not agree that all workers at their company, regardless of age or position, have equal access to education and training opportunities.
24%
33%
27%
32%
30%
25%
15%
4-Year College Degree or more (n=365)
Some College/VocationalSchool (n=304)
High School or Less (n=374)
Schools--Public andPrivate (n=170)
Government (n=138)
Nonprofit (n=92)
For-profit (n=582)

20 INVESTING IN TRAINING 50+ WORKERS: A TALENT MANAGEMENT STRATEGY
need additional training, the vast majority of workers
age 50+ (77%) state that they do not have difficulty
keeping up with the new technology required to do their
job well (Appendix C, Question 9). This clearly indicates
that most workers in this age group are not only
mastering new technology but are also committed to
keeping up with continuing technological changes.
WHAT WORKERS DISLIKE ABOUT TRAININGThese findings regarding the training that 50+ workers
feel that they lack, the gaps between the training of
interest and the training offered, and the findings
displayed in Exhibit 19 regarding the aspects of training
that they dislike suggest that it may well be time for
companies to check in with their employees (those age
50+ and others) to make sure that training investments
are allocated to the training programs that are most
valued. As shown in Exhibit 19, when asked to indicate
what they dislike the most about training, workers most
frequently mention that the training offered is not
always relevant to their needs, that they have difficulty
finding time for training, that it is not always sufficiently
challenging, and that they do not always have
opportunities at work to apply the skills acquired
through training. Employers could start by focusing on
two major factors: making training relevant to employee
needs and making certain that employees have time
to participate in training.
OBSTACLES TO TRAININGEnsuring that employees have time for training may be
particularly important because it represents one of the
chief obstacles to participation in training. As Exhibit 20
shows, lack of training availability and/or funding as
well as busy schedules were the top two reasons for
failing to participate in training in the past two years—
hurdles that every member of the workforce, regardless
of age, has, no doubt, encountered at some point.
EXHIBIT 17: AREAS IN WHICH WORKERS FEEL THEY LACK KNOWLEDGE, SKILLS, OR TRAINING NEEDED TO DO THEIR JOB WELL
Source: December 2006 AARP survey of individuals age 50+ employed in companieswith 10 or more employees Question 15. Base: all 1,048 respondents.*21% of respondents typed a response of “none of these” or “not applicable” eventhough these were not printed on the questionnaire as response options.
33%
15%Required professional training
(e.g., continuing legal or accounting credits)
16%Career development counseling
18%Negotiation skills training
20%Project management skills training
21%
21%
Formal courses that lead tocertification or degrees
applicable to your job
22%Supervisory or managementskills training
23%Specific technical or professionalskills training
33%Computer skills training/information
& communication technology training
Foreign language training
Percent of workers who selected each area when asked to mark theareas in which they felt that they lack the knowledge, skills, or trainingnecessary to do their job well.
Other 1%
None of these/not applicable*
Basic skills training 4%
New employee orientation training 7%
English as a SecondLanguage (ESL) classes 10%
Occupational safety training 10%
Awareness training on workplacediversity (other than age) 10%
Awareness trainingon age diversity 11%
Communication skills training(e.g., presentation or writing skills) 12%

A REPORT FOR AARP PREPARED BY TOWERS PERRIN 21
Selected Differences by Education, Income,
Age, and Employer Size
Among those who did not receive all of the training that
they requested or desired within the past two years or
who did not request or desire any training, perceptions
of the obstacles to training varied by age, education,
household income level, and employer size (Appendix
D, Table 10).
For example, compared to better-educated individuals
and those with higher household incomes, individuals
with less education and those with lower incomes
(probably blue-collar or service positions in many cases)
more frequently point to lack of employer funding or
lack of training availability as a reason why they have
not taken all of the training that they requested or any
training at all in the past two years. More specifically,
workers with a high school degree or less (40%) are
twice as likely as workers with at least a four-year college
degree (19%) to report that they did not participate in
training because their employer did not offer any training.
Employers may be reluctant to invest significant amounts
in training for this group. Similarly, workers at companies
with between 10 and 49 employees (47%) are more likely
than those at companies with at least 500 employees
(25%) to say that their employer offered no training.
EXHIBIT 18: AREAS IN WHICH WORKERS FEEL THEY LACK KNOWLEDGE, SKILLS, OR TRAINING: SIGNIFICANT DIFFERENCES BY EDUCATION LEVEL
Percent of workers within each education level who reported that they lack the knowledge, skills, or training in each of the areas below needed to do their job well.*
High School or LessSome College/Vocational School4-Year College Degree or More
28%
25%12%
23%12%
10%
11%6%
11%
10%6%
5%
6%4%
2%
Source: December 2006 AARP survey of individuals age 50+ employed in companies with 10 or more employees. Question 15. The bases for the three education levels represented by each bar are as follows: 374 respondents with a high school education or less, 304 respondents with some college or vocational school, and 365 respondents with a 4-year college degree or more. *Chart only shows responses that varied in a statistically significant manner based on respondent education level.
Formal courses that lead to certification or degrees
applicable to your job
Required professional training (e.g., continuing legal or
accounting credits)
English as a Second Language (ESL) classes
New employee orientation training
Basic skills training
EXHIBIT 19: REASONS FOR DISSATISFACTION WITH TRAINING
Source: December 2006 AARP survey of individuals age 50+ employed in companieswith 10 or more employees. Question 19. Base: 882 respondents who say they havereceived work-related education or training.
4%
17%
17%
35%
24%
4%
It can be difficult to follow or understand
Other (e.g., scheduled at wrong time; instructor not knowledgeable; other; refused)
It’s not always challenging enough
I do not always have a chance at work to use what I have learned
It can be too time-consuming—I do not always have time
It’s not always relevant to me/does not always meet my needs

22 INVESTING IN TRAINING 50+ WORKERS: A TALENT MANAGEMENT STRATEGY
Workers age 65+, those with no formal education
beyond high school, those with household incomes
below $50,000, and those at companies with between
10 and 49 employees are more likely than their
counterparts to indicate that they have not participated
in training within the past two years because they did
not feel the need to take any training.
Respondents in large companies and those with
relatively high incomes are more likely than workers in
smaller companies and those with lower incomes to
blame their supervisors or their busy schedules for
missing training opportunities. For example, compared
to workers with lower household incomes, those with
incomes of at least $75,000 are more likely to report
that they felt too busy at their job to take time off for
training and that their supervisor did not allow them to
participate in training due to budgetary reasons or work
demands. For workers with higher incomes (who are
more likely than lower-income workers to be in
management positions), job responsibilities (including
oversight of others) may indeed make it difficult to
schedule training.
Training Yields Valuable BenefitsUSEFULNESS OF TRAININGAs employer awareness of the strong connection
between worker training and organizational competitive-
ness continues to increase, and as the prominence of
the 50+ cohort grows within U.S. companies, it is
important to note that more than nine in ten (92%) 50+
workers say that their recent training has been at least
EXHIBIT 20: OBSTACLES TO PARTICIPATING IN TRAINING
PERCENT PERCEIVING OBSTACLES
Source: December 2006 AARP survey of individuals age 50+ employed in companies with 10 or more employees. Question 25a. Base: 624 respondents who say they did notparticipate in all the training they requested in the past two years, or did not request or desire any training.
Employer did not offer or pay for any education or training opportunities
You felt too busy at your job to take time off for training
You did not feel the need to take any training
Employer/supervisor did not allow you to participate in the training you wanted due to
work demands/ time constraints
Employer did not offer or pay for certain education or training opportunities that you
needed/wanted
Employer/supervisor did not allow you to participate in the training you wanted due to
budgetary reasons
You did not think the training offered by your employer was useful or relevant to your job
Employer/supervisor did not allow you to participate in the training because he/she did not think the training was relevant to your job
Other
Refused
30%
24%
18%
14%
13%
12%
8%
5%
31%
2%

A REPORT FOR AARP PREPARED BY TOWERS PERRIN 23
somewhat useful for their job or career, including nearly
half (47%) who feel that their training has been “very
useful” (Exhibit 21). This finding may be interpreted as
not only a testament to the “trainability” of 50+
workers, but also as a tribute to the quality of training
that many employers provide. However, the fact that
more than one-half of those who have taken training
recently describe that training as only “somewhat
useful” (45%) or not useful (8%) suggests that the
relevance and applicability of training can be improved.
Interestingly, although they are less likely than more
educated workers to receive employer-provided
training, workers with less education who do receive
training are more likely to report that the training was
very useful (Appendix D, Table 11). Specifically, more
than half (55%) of workers with a high school degree
or less who received training within the past two years
described the training as “very useful” for their job or
career, compared to four in 10 (41%) workers with at
least a four-year college degree who received some
training. Similarly, workers with lower household
incomes are also more likely than workers with higher
incomes to perceive training as very useful. These
findings clearly demonstrate the importance of
providing less-educated and lower-income workers
with access to training.
WORKERS’ PERSPECTIVES OF THE IMPACTOF TRAININGAs shown in Exhibit 22, the perceived impact of training
is felt through improvement in job-related skills. In fact,
three in four (76%) of those who have participated in
work-related training within the past two years report
that it has improved their job skills. Other benefits of
training observed by the majority of recent training
participants include an increased ability to be helpful to
coworkers (63%), increased productivity (62%), feeling
like a more valuable employee (59%), increased job
satisfaction (56%), and an increase—or a change—in
job-related responsibilities (54%).
While the majority of workers across all segments cite
positive consequences from training, workers with less
education and lower incomes are more likely than their
better-educated and higher-income counterparts to cite
certain positive consequences (Appendix D, Table 12).
For example, more than one in three (36%) workers with
household incomes of less than $25,000 indicate that
training taken within the past two years has helped
them get promoted, whereas only 20% of workers with
household incomes over $75,000 cite such a result.
EXHIBIT 21: VALUE OF TRAINING IN LAST TWO YEARS TO JOB OR CAREER
Source: December 2006 AARP survey of individuals age 50+ employed in companieswith 10 or more employees. Question 27. Base: 692 respondents who said they hadparticipated in work-related education or training within the past two years.
7%
1%
45%
47%
Very useful
Somewhat useful
Not too useful
Not at all useful
EXHIBIT 22: IMPACT OF TRAINING IN LAST TWO YEARS ON WORKERS
EFFECT OF TRAINING TAKEN OVERTHE LAST TWO YEARS:
PERCENT RESPONDING AGREAT DEAL/SOMEWHAT
Source: December 2006 AARP survey of individuals age 50+ employed in companieswith 10 or more employees. Question 28. Base: 692 respondents who said they hadparticipated in work-related education or training within the past two years.
Improved your job skills
Increased your ability to helpyour coworkers/be a
mentor to your coworkers
Increased your productivity at work
Made you feel like a morevaluable employee
Increased your satisfactionwith your job
Allowed you to take on moreor new responsibilities
Helped you to get promoted
76%
63%
62%
59%
56%
54%
24%

24 INVESTING IN TRAINING 50+ WORKERS: A TALENT MANAGEMENT STRATEGY
Furthermore, two in three (67%) workers with only a
high school degree or less report that training has
increased their productivity at work, compared to
only 58 percent of workers with at least a four-year
college degree.
In many cases, the perceived impact of training also
varies by sector. For example, compared to workers in
government, schools, and the for-profit sector, workers
in the non-profit sector are particularly likely to feel that
training within the past two years has increased their
ability to help their coworkers, made them feel like a
more valuable employee, and increased their job
satisfaction.
Providing training can also have a positive effect on
employee commitment to the organization. For example,
one in four (25%) workers age 50+ report that they
would stay with their current employer longer than
planned if their employer would pay for or provide more
work-related training (Exhibit 23). Moreover, when rating
their satisfaction with the training opportunities offered
by their employer, workers who have no plans to leave
their employers within the next few years are almost
twice as likely to report that they are “very satisfied”
(43%) with the training opportunities offered by their
employer than are those workers who are actively
looking for a new job or who would consider a new job
offer if presented to them (22%). These findings suggest
that a well-designed training program, as one component
of an organization’s retention strategy, can not only help
to prevent the loss of expert knowledge and productive
capacity, but can also help save companies the
significant costs associated with replacing lost workers.
PERSPECTIVES OF SELECTED EMPLOYERSInterviews with the small group of select employers
confirm that training can have a tangible, measurable
effect on retention as well as on a number of other
important organizational goals. Many of these organiza-
tions are finding that their training programs are also
having a positive impact on organizational productivity,
sales, employee satisfaction, and quality of work, and
some have even quantified solid returns on their
training investments. More specifically, employer
respondents report:
“We have a huge training budget and our primary focus
is on customer service. We are in the property and
casualty insurance business and as such we don’t have
products, we have intellectual capital. Over the last
several years, our company has outperformed the
industry in premium growth, profitability, combined ratio,
expense ratio, return on equity, surplus growth, staffing
efficiency and so on. I would say that training and
retaining our qualified and experienced employees does
certainly make a difference.” (ACUITY)
“Training has resulted in increased sales volumes at PNC.”
(PNC Financial Services Group) In one case, the
organization trained a group of junior sales people
in effective selling skills and then compared their
production with that of a group of more senior employees
who had received no training. The more junior staff
doubled its sales volume over the next three months,
whereas the volume of the untrained, but more
experienced, employees stayed steady.
“Over the past five years, we conducted nine detailed
ROI studies to ensure learning is delivering value. We’ve
calculated an average “Return on Learning” (ROL) of
94%, or $1,083 net benefit per participant. We’ve
also tied learning to other measures such as quality
EXHIBIT 23: IMPACT OF TRAINING ON RETENTION
Source: December 2006 AARP survey of individuals age 50+ employed in companieswith 10 or more employees. Question 30. Base: all 1,048 respondents
30%
25%
33%
13%
No
Maybe
Yes
Not sure
Would More Employer-Paid Education and Training Lead Workers to Stay with Company Longer?

A REPORT FOR AARP PREPARED BY TOWERS PERRIN 25
improvements, productivity improvements, cost
reductions, employee satisfaction, and increased
net revenue.”
(Fred Goh, Strategic Learning Manager, Caterpillar
University)
CATERPILLAR MINI CASE STUDY
Caterpillar defines itself as a global learning organization
committed to supporting ongoing learning among all
employees. The company creates learning strategies
and priorities based on business needs and organiza-
tional goals. To ensure the strategies are achieving the
company’s aims, Caterpillar conducted detailed ROI
studies designed to measure how learning is adding value
to all employees. The survey and assessment tactics
include focus groups, surveys, and studies of effectiveness.
Once those are completed, Caterpillar uses the results to
calculate a “Return on Learning.” An interesting approach
in use at Caterpillar is tapping experienced workers,
including the retired workforce, to participate in
knowledge sharing and mentoring programs.
MASSACHUSETTS INSTITUTE OF TECHNOLOGY
MINI CASE STUDY
One-third of the workforce at the Massachusetts Institute
of Technology (MIT) is over 55, and few workers retire
from the organization in the traditional sense. MIT had
always helped its workers with financial income planning
for retirement, but then realized that with few leaving the
workforce permanently, workers also needed help in
planning the next steps of their careers. To do that, MIT
implemented a program for 50+ employees called
“Shifting Gears: Transitions for Mid-life and Beyond.”
At age 55, employees with at least 10 years of service
become eligible for retiree benefits, including lifetime
health. MIT has generous retirement income and benefit
plans that tend to leave most long-term employees with a
good foundation to think about retirement. They also can
take part in a four-part course designed to help
employees address what they want to do with the rest of
their lives. The program not only helps 50+ workers realize
long-held career aspirations, but also ensures that MIT
reaps additional benefits from these workers’ knowledge,
commitment, skills and expertise. For example, one
woman, after completing the program, started a “woman’s
retreat” to help women who are in transition. Another
employee, who had been working in the organization’s
computer science lab but also had talent and passion for
space technology, “retired” from her long-held position,
completed the course, and arranged an agreement to
return part-time to contribute in the research group in the
space technology department.
IMPLICATIONSOverall, the survey findings paint a relatively promising
portrait of 50+ worker training. Most older workers
enjoy learning, want to take part in employer-sponsored
training programs, are comfortable with a variety of
learning modes, and have, in fact, participated in work-
related training within the past two years. The high
satisfaction levels they express would suggest that they
believe that their employers, on balance, are not
withholding training that would allow them to perform
better in their jobs.
This is not to say that employers should not attempt to
improve their training delivery. For example, smaller
organizations and for-profit organizations are generally
less likely to provide the broad variety of training topics
and delivery modes that workers indicate they want and
need in order to do their best.
The survey results also indicate that participation in
training—as well as access to training—varies by
education and income level. These findings suggest
that less educated and lower-income 50+ workers may
have a more difficult time getting the training that they
need to perform well. In addition to proactively ensuring
that training opportunities are offered and clearly
communicated to all workers (including workers likely to
have less formal education, many of whom are also the
workers with lower incomes), organizations may have to
consider creative ways to bridge the educational barrier
by making training more appealing and interesting to
workers with less education, perhaps through special
communication outreach or more customized
approaches to training.
Finally, the survey results indicate that employers could
do much better at matching training offerings to the
specific interests of 50+ workers.

26 INVESTING IN TRAINING 50+ WORKERS: A TALENT MANAGEMENT STRATEGY
BEST PRACTICESThe study’s two data sources—the observations of the
select group of leading companies interviewed, and the
findings from the survey of 50+ workers—may be used
in tandem to shape the beginning of a best-practice
road map for many companies that wish to ensure that
their training programs deliver appropriate value to not
only 50+ workers but all segments of the workforce.
Ultimately, although broad training strategies must be
formulated at the enterprise or business unit level,
training delivery must feel customized to the individual.
Workers or groups of workers may have learning needs
similar to those of others in a discipline or department,
but preferred learning modes may differ dramatically
from one individual to another. In addition, individual
schedules and workloads will also vary and, as a result,
so too will each individual’s ability to participate in
training. Given all this, companies need to think globally
when it comes to training strategy (ensuring they
provide the necessary range of strategically critical and
relevant offerings) while acting locally (delivering
training in ways and at times that respect individual
learning styles and schedules).
In addition, the findings and interviews also suggest
that organizations succeeding most in addressing the
training needs of their entire workforce do the following:
RECOGNIZE BOTH THE INDIVIDUAL AND STRATEGICIMPORTANCE OF TRAINING.Professional learning and skill development must be
driven by an organization’s strategic needs. And, as
evidenced by the survey findings, these initiatives must
also respond to employees’ stated needs and desires
(as expressed through surveys or focus groups aimed at
gathering information directly from employees). The
most insightful organizations understand that training
has a dual effect. At the individual level, learning aimed
at developing individual competence plays a key role in
employees’ mastery of their work. In a knowledge-
intensive workplace, people believe that acquiring new
skills will help them in finding and keeping satisfying
jobs. Learning opportunities have become central to
the social contract between individuals and organiza-
tions. This “deal” dictates what employees will
contribute to company success and how companies
will in turn compensate employees (in both financial
and non-financial currencies) for their contributions.
Importantly, the gratification that comes from learning
is part of the return on investment that workers receive
for putting time and energy into their work and working
toward mastery of tasks.
Psychologists have long recognized the importance of
such mastery. “We demand a knowledge of effects,”
said Jean Piaget, the famous child psychologist, “and to
be ourselves the producers of effects.”10 Psychologist
Robert W. White, in a seminal article written in 1959,
concluded that competence works as a motivational
concept. He referred to the motivational aspect of
competence as effectance and described it this way:
“Satisfaction of effectance contributes significantly to
those feelings of interest which often sustain us so well
in day-to-day actions, particularly when the things we
are doing have continuing elements of novelty.”11 Thus,
acting on employees’ need for learning enhances
employee engagement in their work. In Towers Perrin’s
2005 Global Workforce Study, which looked at the
drivers of attraction, retention, and engagement among
86,000 employees in 16 countries, opportunities to
learn and develop new skills was the single most
important driver of high employee engagement,
followed by having had the ability to improve skills
and capabilities within the prior year. This finding was
consistent across many of the countries in which the
research was conducted, attesting to the global
importance of skill-building in creating and sustaining
a highly engaged workforce.
On the strategic level, learning produces an asset that
organizations value. Call it knowledge, human capital,
intangible capital—it comprises the information and
10 J.Piaget, quoted in R.W. White, “Motivation Reconsidered: The Concept of Competence,” Psychological Review, 1959, 66(5), p. 316.
11 White, “Motivation Reconsidered,” pp.321, 322, 323.

A REPORT FOR AARP PREPARED BY TOWERS PERRIN 27
intelligence that individuals compile through formal
processes (such as structured training and development)
and through informal ones (such as contact with
professional communities of practice). In the most
strategically focused enterprises, the following three
areas are clearly aligned and linked to each other:
business strategy, organizational capabilities required to
execute strategy, and the individual skills and abilities
that contribute to capability-building. Interviews with
training executives at organizations with strong training
programs suggest that this three-link chain is well
understood by these organizations and forms the
foundation of their training strategy:
“We partner well with our customers to help them
move their businesses forward. We involve senior
managers in developing, delivering, and monitoring
training.” (PNC Financial Services Group)
“In the top-down approach, we meet with the
Executive Leadership council and the Chairman’s
council. We ask them to identify what their people will
need to know and do over the next two years. In the
bottom-up approach, we survey 1,000 directors, 2,500
managers and the one level above and below these
groups to ask about their needs.” (Pitney Bowes)
“The only time we really think about 50+ separately
from the overall employee group is when we do
strategic workforce planning and look at the
capability and makeup of the workforce versus
business needs.” (Hewlett-Packard)
BLEND CLASSROOM TRAINING WITH SELF-STUDY(BOTH ELECTRONIC AND CONVENTIONAL).Several of the organizations interviewed offered these
examples of their most successful (and preferred)
programs:
“We train new managers starting with a five-day
orientation followed by 14 online courses over a year’s
time. We try to build a sense of community as part of
the learning experience.” (Air Products and
Chemicals, Inc.)
“We instruct employees to read articles before the
training, offer a facilitated discussion during the
training session and follow up with e-learning and
group sessions.”
(PNC Financial Services Group)
“For all our courses—whether online, instructor-led,
or self-paced—we use the Criterion Referenced
Instruction (CRI) methodology to analyze, design and
develop job training programs. Provided by the Center
for Effective Performance, the CRI methodology allows
us to create performance-based programs that
ensure employees are learning only what they do
not already know. Those participating in self-directed
courses must pass a skill check at course conclusion.
Skill checks can take various forms--on-the-job
performance or a simulation, written tests or online,
self-administered tests.” (LL Bean)
DESIGN SPECIFIC PROGRAMS TO TARGETSPECIFIC NEEDS.Due to concerns about how the impending retirements
of many experienced workers would affect the
organization’s competitiveness, Hormel instituted a
program to broaden the functional skills of older
workers so they can add variety to their work lives
by taking on new responsibilities within the company.
“Employers that create training programs including (even
targeting) 50+ workers tend to do so because they have
significant numbers of 50+ workers within their current
workforces as well as specific business needs to
address,” said Randy Krug, Corporate Manager, Learning
and Development at Hormel. “Like many large manufac-
turing enterprises, Hormel has concerns about how the
impending retirements of many experienced workers
may affect the organization’s competitiveness. We
include workers of all ages in our programs to broaden
worker skills. For all parts of the employee population,
including workers age 50+, this training enables people
to add variety to their work lives by moving to new areas
within the company. This job enrichment, the company
hopes, will encourage more-experienced workers to
keep working.”

28 INVESTING IN TRAINING 50+ WORKERS: A TALENT MANAGEMENT STRATEGY
Some other examples of the reasons why companies
develop specific training programs for 50+ workers
include the following:
“The average age of our workforce is almost 50. We
are very sensitive to the training needs of this group.”
(Atlantic Health)
“Over 30 percent of the Massachusetts Institute of
Technology’s workforce is over 55 and there is a
built-in audience for courses targeting these workers.”
(Massachusetts Institute of Technology)
Many training leaders, however, do not consider age
when formulating their training strategies. These
companies believe training not only improves skills and
increases productivity, but also decreases turnover and
enhances job satisfaction for 50+ workers and
everyone else:
“Our training is designed to meet workers’ needs
wherever they are in their careers. We haven’t found
the need to focus our training on any particular age
group.” (Bon Secours Richmond Health System)
“Everyone has access to training without respect to
age.” (PNC Financial Services Group)
Clearly, opportunities for training and development are
important across all age groups in today’s fast-changing
workplace. Companies that succeed in this environment
are likely to be those most adept at identifying the
needs of the workforce, given the needs of the
business, and delivering focused but flexible training
suitable for the broad variety of learning styles of
workers of various ages, educational backgrounds, and
skill levels.

A REPORT FOR AARP PREPARED BY TOWERS PERRIN 29
APPENDIX A
EMPLOYER INTERVIEWS: METHODOLOGYTowers Perrin conducted telephone interviews with senior personnel in the human resources and training functions
within a targeted set of large organizations. The target companies were either recommended by AARP or were
selected by Towers Perrin due to the fact that they had received awards in the area of training and development.
A total of 20 interviews were completed between December 2006 and February 2007. Most interviewees also
completed a brief online survey describing their training practices.
Participating companies:*
ACUITY (Sheboygan, WI)
Air Products and Chemicals, Inc. (Allentown, PA)
Atlantic Health (Florham Park, NJ)
Bon Secours Richmond Health System
(Richmond, VA)
Caterpillar (Peoria, IL )
Hormel (Austin, MN)
Hewlett-Packard (Palo Alto, CA)
Johnson Controls (Milwaukee, WI)
L.L.Bean (Freeport, ME)
Lancaster General Hospital (Lancaster, PA)
Massachusetts Institute of Technology
(Cambridge, MA)
Pitney Bowes (Stamford, CT)
PNC Financial Services Group (Pittsburgh, PA)
Schneider National (Green Bay, WI)
Stanley Consultants (Muscatine, IA)
United Technologies Corporation (UTC) (Hartford, CT)
*Although 20 companies were interviewed for the study, four of the companies wished to remain anonymous and are, therefore, not listed.
30 INVESTING IN TRAINING 50+ WORKERS: A TALENT MANAGEMENT STRATEGY
APPENDIX B
50+ WORKER SURVEY: METHODOLOGYThis nationally representative survey includes responses from 1,048 workers ages 50 and older. The survey was
fielded from December 21 through December 27, 2006 by Knowledge Networks of Menlo Park, California, to
members of its nationally representative online panel.12
The initial sample fielded consisted of a nationally representative selection of panel members ages 50 and
older who work full- or part-time. Panel members who met these criteria were then screened to ensure that they
qualified for this survey. To be considered qualified for the survey, a panel member had to:
a) Be working full or part time;
b) Not be self-employed;
c) Work in a company with at least 10 employees;
d) Be at least 50 years of age.
The survey took respondents an average of 22 minutes to complete.
Of all panel members who received an invitation to take the survey, 69% responded. Of those who responded, 69%
qualified for the survey.
OVERALL COMPLETION AND INCIDENCE RATESTotal Fielded. . . . . . . . . . . . . . . . . . . . . . . . . . . . . . . . . . . . . . . . . . . . . . . . . . . . . . . . . . . . . . . . . . . . . . . . . . . . 2,198
Total Completed . . . . . . . . . . . . . . . . . . . . . . . . . . . . . . . . . . . . . . . . . . . . . . . . . . . . . . . . . . . . . . . . . . . . . . . . . 1,514
Completion Rate . . . . . . . . . . . . . . . . . . . . . . . . . . . . . . . . . . . . . . . . . . . . . . . . . . . . . . . . . . . . . . . . . . . . . . . . 68.9%
Total Qualified . . . . . . . . . . . . . . . . . . . . . . . . . . . . . . . . . . . . . . . . . . . . . . . . . . . . . . . . . . . . . . . . . . . . . . . . . . 1,048
Qualification Rate . . . . . . . . . . . . . . . . . . . . . . . . . . . . . . . . . . . . . . . . . . . . . . . . . . . . . . . . . . . . . . . . . . . . . . . 69.2%
The results were weighted to be nationally representative of workers age 50 and older (excluding those who are
self-employed) by:
age (50–54, 55–59, 60–64, 65+) ,
gender (male, female),
race/ethnicity (white (non-Hispanic), black (non-Hispanic), other (non-Hispanic), Hispanic),
region (northeast, midwest, south, west),
metro status (yes, no),
education (highest level achieved: less than high school, high school, some college, college degree or more),
employment status (full time, part time), and
household Internet access (yes, no).
12 KnowledgePanelSM is representative of the entire U.S. population. Panel members are randomly recruited by telephone through random digit dialing, and households are provided
with access to the Internet and hardware, if needed. Unlike other Internet research that covers only individuals with Internet access who volunteer for research, Knowledge
Networks surveys are based on a sampling frame which includes both listed and unlisted numbers, and is not limited to current Web users or computer owners.
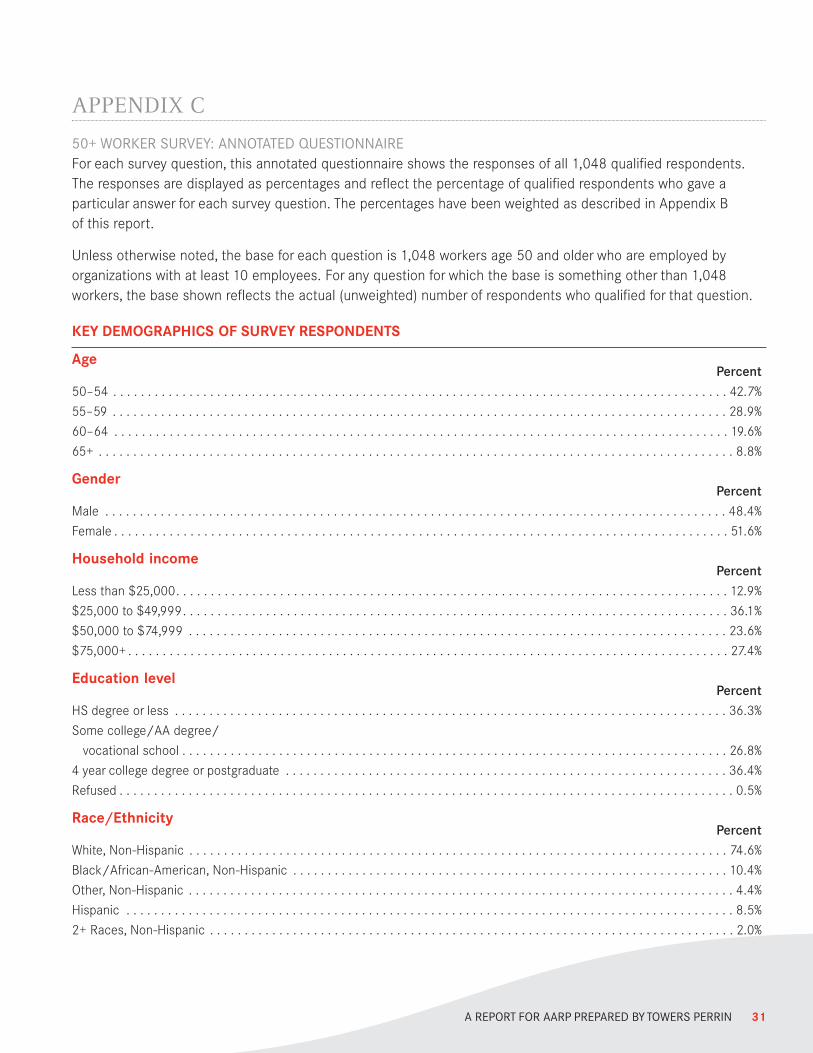
A REPORT FOR AARP PREPARED BY TOWERS PERRIN 31
APPENDIX C
50+ WORKER SURVEY: ANNOTATED QUESTIONNAIREFor each survey question, this annotated questionnaire shows the responses of all 1,048 qualified respondents.
The responses are displayed as percentages and reflect the percentage of qualified respondents who gave a
particular answer for each survey question. The percentages have been weighted as described in Appendix B
of this report.
Unless otherwise noted, the base for each question is 1,048 workers age 50 and older who are employed by
organizations with at least 10 employees. For any question for which the base is something other than 1,048
workers, the base shown reflects the actual (unweighted) number of respondents who qualified for that question.
KEY DEMOGRAPHICS OF SURVEY RESPONDENTS
AgePercent
50–54 . . . . . . . . . . . . . . . . . . . . . . . . . . . . . . . . . . . . . . . . . . . . . . . . . . . . . . . . . . . . . . . . . . . . . . . . . . . . . . . . . . . . . . . . . 42.7%
55–59 . . . . . . . . . . . . . . . . . . . . . . . . . . . . . . . . . . . . . . . . . . . . . . . . . . . . . . . . . . . . . . . . . . . . . . . . . . . . . . . . . . . . . . . . . 28.9%
60–64 . . . . . . . . . . . . . . . . . . . . . . . . . . . . . . . . . . . . . . . . . . . . . . . . . . . . . . . . . . . . . . . . . . . . . . . . . . . . . . . . . . . . . . . . . 19.6%
65+ . . . . . . . . . . . . . . . . . . . . . . . . . . . . . . . . . . . . . . . . . . . . . . . . . . . . . . . . . . . . . . . . . . . . . . . . . . . . . . . . . . . . . . . . . . . . 8.8%
GenderPercent
Male . . . . . . . . . . . . . . . . . . . . . . . . . . . . . . . . . . . . . . . . . . . . . . . . . . . . . . . . . . . . . . . . . . . . . . . . . . . . . . . . . . . . . . . . . . 48.4%
Female . . . . . . . . . . . . . . . . . . . . . . . . . . . . . . . . . . . . . . . . . . . . . . . . . . . . . . . . . . . . . . . . . . . . . . . . . . . . . . . . . . . . . . . . . 51.6%
Household incomePercent
Less than $25,000. . . . . . . . . . . . . . . . . . . . . . . . . . . . . . . . . . . . . . . . . . . . . . . . . . . . . . . . . . . . . . . . . . . . . . . . . . . . . . . . 12.9%
$25,000 to $49,999. . . . . . . . . . . . . . . . . . . . . . . . . . . . . . . . . . . . . . . . . . . . . . . . . . . . . . . . . . . . . . . . . . . . . . . . . . . . . . . 36.1%
$50,000 to $74,999 . . . . . . . . . . . . . . . . . . . . . . . . . . . . . . . . . . . . . . . . . . . . . . . . . . . . . . . . . . . . . . . . . . . . . . . . . . . . . . 23.6%
$75,000+ . . . . . . . . . . . . . . . . . . . . . . . . . . . . . . . . . . . . . . . . . . . . . . . . . . . . . . . . . . . . . . . . . . . . . . . . . . . . . . . . . . . . . . . 27.4%
Education level Percent
HS degree or less . . . . . . . . . . . . . . . . . . . . . . . . . . . . . . . . . . . . . . . . . . . . . . . . . . . . . . . . . . . . . . . . . . . . . . . . . . . . . . . . 36.3%
Some college/AA degree/
vocational school . . . . . . . . . . . . . . . . . . . . . . . . . . . . . . . . . . . . . . . . . . . . . . . . . . . . . . . . . . . . . . . . . . . . . . . . . . . . . . . 26.8%
4 year college degree or postgraduate . . . . . . . . . . . . . . . . . . . . . . . . . . . . . . . . . . . . . . . . . . . . . . . . . . . . . . . . . . . . . . . . 36.4%
Refused . . . . . . . . . . . . . . . . . . . . . . . . . . . . . . . . . . . . . . . . . . . . . . . . . . . . . . . . . . . . . . . . . . . . . . . . . . . . . . . . . . . . . . . . . 0.5%
Race/EthnicityPercent
White, Non-Hispanic . . . . . . . . . . . . . . . . . . . . . . . . . . . . . . . . . . . . . . . . . . . . . . . . . . . . . . . . . . . . . . . . . . . . . . . . . . . . . . 74.6%
Black/African-American, Non-Hispanic . . . . . . . . . . . . . . . . . . . . . . . . . . . . . . . . . . . . . . . . . . . . . . . . . . . . . . . . . . . . . . . 10.4%
Other, Non-Hispanic . . . . . . . . . . . . . . . . . . . . . . . . . . . . . . . . . . . . . . . . . . . . . . . . . . . . . . . . . . . . . . . . . . . . . . . . . . . . . . . 4.4%
Hispanic . . . . . . . . . . . . . . . . . . . . . . . . . . . . . . . . . . . . . . . . . . . . . . . . . . . . . . . . . . . . . . . . . . . . . . . . . . . . . . . . . . . . . . . . 8.5%
2+ Races, Non-Hispanic . . . . . . . . . . . . . . . . . . . . . . . . . . . . . . . . . . . . . . . . . . . . . . . . . . . . . . . . . . . . . . . . . . . . . . . . . . . . 2.0%

32 INVESTING IN TRAINING 50+ WORKERS: A TALENT MANAGEMENT STRATEGY
PLEASE ANSWER EACH QUESTION AS BEST YOU CAN AND THANK YOU IN ADVANCE FOR YOUR COOPERATIONAND PARTICIPATION.
Q2 Which of the following best describes your
current employment status?
Working full-time as a paid employee
(NOT including self-employment) . . . . . . . . . . . . . . . . . . . . . . . . . . . . . . . . . . . . . . . . . . . . . . . . . . . . . . . . . . . . . . . . . . . 86.7%
Working part-time as a paid employee
(NOT including self-employment) . . . . . . . . . . . . . . . . . . . . . . . . . . . . . . . . . . . . . . . . . . . . . . . . . . . . . . . . . . . . . . . . . . . 13.3%
Self-employed . . . . . . . . . . . . . . . . . . . . . . . . . . . . . . . . . . . . . . . . . . . . . . . . . . . . . . . . . . . . . . . . . . . . . . . . . . . . {Terminated}
Not currently employed . . . . . . . . . . . . . . . . . . . . . . . . . . . . . . . . . . . . . . . . . . . . . . . . . . . . . . . . . . . . . . . . . . . . . . {Terminated}
Refused . . . . . . . . . . . . . . . . . . . . . . . . . . . . . . . . . . . . . . . . . . . . . . . . . . . . . . . . . . . . . . . . . . . . . . . . . . . . . . . . . . . . . . . . . 0.0%
Prompt once. Terminate if Q2 = “Self-employed” or “Not currently employed”.
Q3 How many employees, in total, work for your current employer in all locations in the United States?
(Please exclude nonpermanent workers, such as contract or temporary workers.)
Less than 10 . . . . . . . . . . . . . . . . . . . . . . . . . . . . . . . . . . . . . . . . . . . . . . . . . . . . . . . . . . . . . . . . . . . . . . . . . . . . . . . {Terminated}
10 or more . . . . . . . . . . . . . . . . . . . . . . . . . . . . . . . . . . . . . . . . . . . . . . . . . . . . . . . . . . . . . . . . . . . . . . . . . . . . . . . . . . . . . 100.0%
Refused . . . . . . . . . . . . . . . . . . . . . . . . . . . . . . . . . . . . . . . . . . . . . . . . . . . . . . . . . . . . . . . . . . . . . . . . . . . . . . . . . . . . . . . . . 0.0%
Prompt once. Terminate if Q3 = “Less than 10”.
Q4 About how many hours do you work during an average week?
Fewer than 10 hours per week . . . . . . . . . . . . . . . . . . . . . . . . . . . . . . . . . . . . . . . . . . . . . . . . . . . . . . . . . . . . . . . . . . . . . . . 0.6%
At least 10, but fewer than 20 hours per week . . . . . . . . . . . . . . . . . . . . . . . . . . . . . . . . . . . . . . . . . . . . . . . . . . . . . . . . . . . 3.8%
At least 20, but fewer than 35 hours per week . . . . . . . . . . . . . . . . . . . . . . . . . . . . . . . . . . . . . . . . . . . . . . . . . . . . . . . . . . 12.3%
35 hours or more. . . . . . . . . . . . . . . . . . . . . . . . . . . . . . . . . . . . . . . . . . . . . . . . . . . . . . . . . . . . . . . . . . . . . . . . . . . . . . . . . 83.0%
Refused . . . . . . . . . . . . . . . . . . . . . . . . . . . . . . . . . . . . . . . . . . . . . . . . . . . . . . . . . . . . . . . . . . . . . . . . . . . . . . . . . . . . . . . . . 0.2%
Q5 Which of the following statements best describes your future plans with regard to your
current employer?
I have no intentions or plans to leave my current
employer in the next few years. . . . . . . . . . . . . . . . . . . . . . . . . . . . . . . . . . . . . . . . . . . . . . . . . . . . . . . . . . . . . . . . . . . . . 46.3%
I am not looking, but I would consider another offer
if one presented itself. . . . . . . . . . . . . . . . . . . . . . . . . . . . . . . . . . . . . . . . . . . . . . . . . . . . . . . . . . . . . . . . . . . . . . . . . . . . 24.8%
I am actively looking for another job . . . . . . . . . . . . . . . . . . . . . . . . . . . . . . . . . . . . . . . . . . . . . . . . . . . . . . . . . . . . . . . . . . . 4.2%
I have already accepted a job with another employer
and plan to leave my current employer soon . . . . . . . . . . . . . . . . . . . . . . . . . . . . . . . . . . . . . . . . . . . . . . . . . . . . . . . . . . . 0.5%
I plan to retire in the next few years . . . . . . . . . . . . . . . . . . . . . . . . . . . . . . . . . . . . . . . . . . . . . . . . . . . . . . . . . . . . . . . . . . 18.8%
Don’t know / Not sure . . . . . . . . . . . . . . . . . . . . . . . . . . . . . . . . . . . . . . . . . . . . . . . . . . . . . . . . . . . . . . . . . . . . . . . . . . . . . 5.4%
Refused . . . . . . . . . . . . . . . . . . . . . . . . . . . . . . . . . . . . . . . . . . . . . . . . . . . . . . . . . . . . . . . . . . . . . . . . . . . . . . . . . . . . . . . . . 0.0%

A REPORT FOR AARP PREPARED BY TOWERS PERRIN 33
Q6 Overall, how satisfied are you in your job?
Very satisfied . . . . . . . . . . . . . . . . . . . . . . . . . . . . . . . . . . . . . . . . . . . . . . . . . . . . . . . . . . . . . . . . . . . . . . . . . . . . . . . . . . . 47.6%
Somewhat satisfied . . . . . . . . . . . . . . . . . . . . . . . . . . . . . . . . . . . . . . . . . . . . . . . . . . . . . . . . . . . . . . . . . . . . . . . . . . . . . . . 44.0%
Somewhat dissatisfied. . . . . . . . . . . . . . . . . . . . . . . . . . . . . . . . . . . . . . . . . . . . . . . . . . . . . . . . . . . . . . . . . . . . . . . . . . . . . . 6.9%
Very dissatisfied. . . . . . . . . . . . . . . . . . . . . . . . . . . . . . . . . . . . . . . . . . . . . . . . . . . . . . . . . . . . . . . . . . . . . . . . . . . . . . . . . . . 1.5%
Refused . . . . . . . . . . . . . . . . . . . . . . . . . . . . . . . . . . . . . . . . . . . . . . . . . . . . . . . . . . . . . . . . . . . . . . . . . . . . . . . . . . . . . . . . . 0.0%
Q7 Using a scale of “0” to “100,” where “0” means “Completely unmotivated in your job” and “100” is
“Completely motivated to exceed expectations in your job”, please rate where you would place
yourself today.
Percent0–24 . . . . . . . . . . . . . . . . . . . . . . . . . . . . . . . . . . . . . . . . . . . . . . . . . . . . . . . . . . . . . . . . . . . . . . . . . . . . . . . . . . . . . . . . . . . 3.8%
25–50. . . . . . . . . . . . . . . . . . . . . . . . . . . . . . . . . . . . . . . . . . . . . . . . . . . . . . . . . . . . . . . . . . . . . . . . . . . . . . . . . . . . . . . . . . . 7.1%
51–74 . . . . . . . . . . . . . . . . . . . . . . . . . . . . . . . . . . . . . . . . . . . . . . . . . . . . . . . . . . . . . . . . . . . . . . . . . . . . . . . . . . . . . . . . . . 6.9%
75–100 (NET). . . . . . . . . . . . . . . . . . . . . . . . . . . . . . . . . . . . . . . . . . . . . . . . . . . . . . . . . . . . . . . . . . . . . . . . . . . . . . . . . . . . 81.8%
100 . . . . . . . . . . . . . . . . . . . . . . . . . . . . . . . . . . . . . . . . . . . . . . . . . . . . . . . . . . . . . . . . . . . . . . . . . . . . . . . . . . . . . . . . 20.1%
Refused . . . . . . . . . . . . . . . . . . . . . . . . . . . . . . . . . . . . . . . . . . . . . . . . . . . . . . . . . . . . . . . . . . . . . . . . . . . . . . . . . . . . . . . . . 0.3%
[Respondents were allowed to enter a number from 0–100]
Q8 Please select the five most important factors that influence your decision to stay with an
organization. Please select the top five factors only.
[Randomize order of categories]
Benefits and Compensation [Rotate order of items within category]
Pay/Salary . . . . . . . . . . . . . . . . . . . . . . . . . . . . . . . . . . . . . . . . . . . . . . . . . . . . . . . . . . . . . . . . . . . . . . . . . . . . . . . . . . . . . 48.2%
Health benefits (e.g., health insurance) . . . . . . . . . . . . . . . . . . . . . . . . . . . . . . . . . . . . . . . . . . . . . . . . . . . . . . . . . . . . . . . . 51.1%
Retirement benefits (e.g., pension, 401(k)) . . . . . . . . . . . . . . . . . . . . . . . . . . . . . . . . . . . . . . . . . . . . . . . . . . . . . . . . . . . . . 37.9%
Eligibility for long-term financial incentives
(e.g., stock options) . . . . . . . . . . . . . . . . . . . . . . . . . . . . . . . . . . . . . . . . . . . . . . . . . . . . . . . . . . . . . . . . . . . . . . . . . . . . . . 2.6%
Eligibility for short-term financial incentives
(e.g., employee discounts, bonuses) . . . . . . . . . . . . . . . . . . . . . . . . . . . . . . . . . . . . . . . . . . . . . . . . . . . . . . . . . . . . . . . . . 3.7%
Your Work [Rotate order of items within category]
Having the opportunity to use your best potential
and skills . . . . . . . . . . . . . . . . . . . . . . . . . . . . . . . . . . . . . . . . . . . . . . . . . . . . . . . . . . . . . . . . . . . . . . . . . . . . . . . . . . . . . 24.3%
Ability to balance work and personal life . . . . . . . . . . . . . . . . . . . . . . . . . . . . . . . . . . . . . . . . . . . . . . . . . . . . . . . . . . . . . . . 28.2%
Reasonable workload . . . . . . . . . . . . . . . . . . . . . . . . . . . . . . . . . . . . . . . . . . . . . . . . . . . . . . . . . . . . . . . . . . . . . . . . . . . . . . 17.7%
Flexibility of working hours . . . . . . . . . . . . . . . . . . . . . . . . . . . . . . . . . . . . . . . . . . . . . . . . . . . . . . . . . . . . . . . . . . . . . . . . . . 17.6%
Number of working hours . . . . . . . . . . . . . . . . . . . . . . . . . . . . . . . . . . . . . . . . . . . . . . . . . . . . . . . . . . . . . . . . . . . . . . . . . . 14.9%
Challenging work . . . . . . . . . . . . . . . . . . . . . . . . . . . . . . . . . . . . . . . . . . . . . . . . . . . . . . . . . . . . . . . . . . . . . . . . . . . . . . . . . 15.0%
Variety of work assignments . . . . . . . . . . . . . . . . . . . . . . . . . . . . . . . . . . . . . . . . . . . . . . . . . . . . . . . . . . . . . . . . . . . . . . . . 14.9%
Physical demands of your daily work. . . . . . . . . . . . . . . . . . . . . . . . . . . . . . . . . . . . . . . . . . . . . . . . . . . . . . . . . . . . . . . . . . . 4.8%
Having control/decision-making power in your job. . . . . . . . . . . . . . . . . . . . . . . . . . . . . . . . . . . . . . . . . . . . . . . . . . . . . . . 18.6%

34 INVESTING IN TRAINING 50+ WORKERS: A TALENT MANAGEMENT STRATEGY
Environment/culture [Rotate order of items within category]
Access to education, training, and professional
development opportunities . . . . . . . . . . . . . . . . . . . . . . . . . . . . . . . . . . . . . . . . . . . . . . . . . . . . . . . . . . . . . . . . . . . . . . . . 6.4%
Opportunities for advancement/promotion . . . . . . . . . . . . . . . . . . . . . . . . . . . . . . . . . . . . . . . . . . . . . . . . . . . . . . . . . . . . . 8.2%
Non-monetary recognition received for work . . . . . . . . . . . . . . . . . . . . . . . . . . . . . . . . . . . . . . . . . . . . . . . . . . . . . . . . . . . . 4.8%
Strong senior leadership . . . . . . . . . . . . . . . . . . . . . . . . . . . . . . . . . . . . . . . . . . . . . . . . . . . . . . . . . . . . . . . . . . . . . . . . . . . . 3.3%
Appealing corporate culture . . . . . . . . . . . . . . . . . . . . . . . . . . . . . . . . . . . . . . . . . . . . . . . . . . . . . . . . . . . . . . . . . . . . . . . . . 1.6%
Collaborative working environment . . . . . . . . . . . . . . . . . . . . . . . . . . . . . . . . . . . . . . . . . . . . . . . . . . . . . . . . . . . . . . . . . . . . 9.1%
Use of leading-edge technology
(e.g., computers, software, email, Internet) . . . . . . . . . . . . . . . . . . . . . . . . . . . . . . . . . . . . . . . . . . . . . . . . . . . . . . . . . . . . 6.7%
Good relationship with immediate
supervisor/manager. . . . . . . . . . . . . . . . . . . . . . . . . . . . . . . . . . . . . . . . . . . . . . . . . . . . . . . . . . . . . . . . . . . . . . . . . . . . . 33.1%
Good relationship with immediate coworkers . . . . . . . . . . . . . . . . . . . . . . . . . . . . . . . . . . . . . . . . . . . . . . . . . . . . . . . . . . . 33.8%
Opportunity to coach/mentor/supervise others. . . . . . . . . . . . . . . . . . . . . . . . . . . . . . . . . . . . . . . . . . . . . . . . . . . . . . . . . . 7.3%
Skills/competency level of people you work with . . . . . . . . . . . . . . . . . . . . . . . . . . . . . . . . . . . . . . . . . . . . . . . . . . . . . . . . . 8.0%
Organization’s financial health . . . . . . . . . . . . . . . . . . . . . . . . . . . . . . . . . . . . . . . . . . . . . . . . . . . . . . . . . . . . . . . . . . . . . . . 7.1%
Reputation of the organization . . . . . . . . . . . . . . . . . . . . . . . . . . . . . . . . . . . . . . . . . . . . . . . . . . . . . . . . . . . . . . . . . . . . . . . 8.5%
Job security (knowing you can stay in your job
as long as you want it) . . . . . . . . . . . . . . . . . . . . . . . . . . . . . . . . . . . . . . . . . . . . . . . . . . . . . . . . . . . . . . . . . . . . . . . . . . . 39.8%
Something else . . . . . . . . . . . . . . . . . . . . . . . . . . . . . . . . . . . . . . . . . . . . . . . . . . . . . . . . . . . . . . . . . . . . . . . . . . . . . . . . . . . 4.9%
Q9 For each of the following statements, please tell us to what extent you agree or disagree with
that statement.
Strongly Somewhat Somewhat Strongly Agree Agree Disagree Disagree Refused
Q9 My job often requires me to learn new
information and skills 38.6% 44.9% 11.2% 5.1% 0.3%
Q9 My boss encourages me to take the
training I need to do my job well 30.2% 37.7% 21.4% 10.1% 0.5%
Q9 My company offers all the education
and training opportunities that I need to
keep my skills up-to-date 25.5% 38.7% 22.9% 12.7% 0.3%
Q9 I have all the skills and knowledge necessary
to do my job well 38.0% 50.2% 9.6% 2.0% 0.2%
Q9 I have difficulty keeping up with all the
new technology required to do my job well 3.1% 19.5% 38.0% 38.8% 0.6%
Q9 I have difficulty keeping up with all the new
skills and knowledge required to do my job well 3.4% 15.7% 36.7% 44.0% 0.3%
Q9 I enjoy learning new things 54.4% 39.0% 3.6% 2.3% 0.7%
Q9 I enjoy working at my current job 48.5% 39.5% 9.3% 2.3% 0.4%
Q9 All workers in my company, regardless of
their age or position, have equal access to
education and training opportunities 35.8% 36.2% 18.8% 8.9% 0.3%

A REPORT FOR AARP PREPARED BY TOWERS PERRIN 35
NOW WE WOULD LIKE TO ASK YOU MORE QUESTIONS ABOUT TRAINING OFFERED BY YOUR EMPLOYER. IN THISSURVEY, “TRAINING” REFERS TO ANY WORK-RELATED EDUCATION, TRAINING, OR PROFESSIONAL DEVELOPMENTOPPORTUNITIES PROVIDED BY YOUR EMPLOYER OR AT LEAST PARTIALLY PAID FOR BY YOUR EMPLOYER.
Q10 Overall, how satisfied are you with the work-related education and training opportunities
offered to you by your employer?
Very satisfied. . . . . . . . . . . . . . . . . . . . . . . . . . . . . . . . . . . . . . . . . . . . . . . . . . . . . . . . . . . . . . . . . . . . . . . . . . . . . . . . . . . . 34.9%
Somewhat satisfied . . . . . . . . . . . . . . . . . . . . . . . . . . . . . . . . . . . . . . . . . . . . . . . . . . . . . . . . . . . . . . . . . . . . . . . . . . . . . . . 43.5%
Somewhat dissatisfied. . . . . . . . . . . . . . . . . . . . . . . . . . . . . . . . . . . . . . . . . . . . . . . . . . . . . . . . . . . . . . . . . . . . . . . . . . . . . 13.6%
Very dissatisfied. . . . . . . . . . . . . . . . . . . . . . . . . . . . . . . . . . . . . . . . . . . . . . . . . . . . . . . . . . . . . . . . . . . . . . . . . . . . . . . . . . . 7.8%
Refused . . . . . . . . . . . . . . . . . . . . . . . . . . . . . . . . . . . . . . . . . . . . . . . . . . . . . . . . . . . . . . . . . . . . . . . . . . . . . . . . . . . . . . . . . 0.2%
Q11 To the best of your knowledge, which of the following work-related education and training
opportunities or programs does your employer currently pay for or provide to its employees?
Yes No Don’t know RefusedQ11 Computer skills training/information and communication
technology training 53.8% 32.0% 13.2% 1.0%
Q11 Career development counseling (training on how to develop or
manage your career) 25.4% 51.4% 22.0% 1.2%
Q11 Foreign language training 7.3% 65.2% 26.0% 1.5%
Q11 Basic skills training (e.g., basic math, or basic writing or
reading skills) 17.4% 60.8% 21.0% 0.8%
Q11 Specific technical or professional skills training 60.7% 26.1% 12.4% 0.8%
Q11 Formal courses that lead to certification or degrees applicable
to your job 38.6% 45.3% 15.5% 0.6%
Q11 Required professional training (e.g., continuing legal or
accounting credits) 30.5% 45.6% 23.3% 0.6%
Q11 English as a Second Language (ESL) classes 9.0% 62.3% 27.4% 1.3%
Q11 Occupational safety training 64.2% 22.3% 11.9% 1.6%
Q11 New employee orientation training (that introduces new
employees to personnel and workplace practices and to overall
company policies) 73.6% 17.7% 8.3% 0.4%
Q11 Communication skills training (e.g., presentation or writing skills) 35.0% 42.5% 21.4% 1.1%
Q11 Awareness training on age diversity—concerning policies and
practices related to age diversity in the workplace or
age discrimination 36.9% 40.1% 21.9% 1.1%
Q11 Awareness training on workplace diversity (other than age)—
concerning policies and practices related to workplace diversity or
discrimination for reasons other than age (race/ethnicity, gender,
disability, etc.) 49.3% 31.7% 18.1% 0.9%
Q11 Project management skills training 31.2% 43.0% 24.8% 1.0%
Q11 Negotiation skills training 22.3% 48.9% 27.6% 1.2%
Q11 Supervisory or management skills training 44.7% 38.4% 16.1% 0.8%
Q11 Something else 15.0% 24.7% 43.4% 16.9%

36 INVESTING IN TRAINING 50+ WORKERS: A TALENT MANAGEMENT STRATEGY
Q12 Through which of the following methods does your employer provide work-related education or
training to its employees?
Yes No Don’t know RefusedQ12 Tuition reimbursement (including partial reimbursement) 41.5% 37.7% 20.3% 0.5%
Q12 Paid time off for education or training without affecting an
employee’s vacation leave 31.7% 46.0% 21.4% 0.9%
Q12 Classroom training (offered at your company or another location) 59.1% 28.4% 11.9% 0.6%
Q12 Online or computer-based training 46.2% 34.9% 17.8% 1.1%
Q12 Formal job rotation program 13.3% 57.7% 27.5% 1.5%
Q12 Temporary assignments in other departments 33.0% 47.9% 17.9% 1.2%
Q12 Formal mentoring program 27.2% 46.1% 25.9% 0.8%
Q12 Hands-on training 81.8% 10.5% 7.2% 0.5%
Q12 Participation at professional conferences, seminars, or workshops 58.5% 27.5% 13.3% 0.7%
Q13 Overall, how interested are you in participating in work-related education or training
opportunities?
Very interested . . . . . . . . . . . . . . . . . . . . . . . . . . . . . . . . . . . . . . . . . . . . . . . . . . . . . . . . . . . . . . . . . . . . . . . . . . . . . . . . . . 34.5%
Somewhat interested. . . . . . . . . . . . . . . . . . . . . . . . . . . . . . . . . . . . . . . . . . . . . . . . . . . . . . . . . . . . . . . . . . . . . . . . . . . . . . 42.9%
Not too interested . . . . . . . . . . . . . . . . . . . . . . . . . . . . . . . . . . . . . . . . . . . . . . . . . . . . . . . . . . . . . . . . . . . . . . . . . . . . . . . . 16.9%
Not at all interested . . . . . . . . . . . . . . . . . . . . . . . . . . . . . . . . . . . . . . . . . . . . . . . . . . . . . . . . . . . . . . . . . . . . . . . . . . . . . . . . 5.6%
Refused . . . . . . . . . . . . . . . . . . . . . . . . . . . . . . . . . . . . . . . . . . . . . . . . . . . . . . . . . . . . . . . . . . . . . . . . . . . . . . . . . . . . . . . . . 0.0%
Q14 To what extent are you personally interested in the following types of work-related education
and training opportunities?
Very Somewhat Not too Not at all interested interested interested interested Refused
Q14 Training that would allow you to keep
your skills and knowledge up-to-date 58.1% 31.4% 7.8% 2.5% 0.2%
Q14 Training that would allow you to learn new skills
and knowledge necessary to advance your career 51.3% 31.6% 13.8% 3.2% 0.1%
Q14 Training that would allow you to learn new skills
and knowledge necessary to get an entirely
different type of job 27.1% 30.2% 29.1% 13.3% 0.4%
Q15 In which of the following areas do you feel you lack the knowledge, skills, or training necessary
to do your job well?
[Randomize but group first 4 items together and two “awareness” items together]
Basic skills training (e.g., basic math, or basic writing or reading skills) . . . . . . . . . . . . . . . . . . . . . . . . . . . . . . . . . . . . . . . . 4.2%
Specific technical or professional skills training . . . . . . . . . . . . . . . . . . . . . . . . . . . . . . . . . . . . . . . . . . . . . . . . . . . . . . . . . 22.5%
Formal courses that lead to certification or degrees applicable to your job . . . . . . . . . . . . . . . . . . . . . . . . . . . . . . . . . . . . 21.2%
Required professional training (e.g., continuing legal or accounting credits). . . . . . . . . . . . . . . . . . . . . . . . . . . . . . . . . . . . 15.2%
Computer skills training/information and communication technology training. . . . . . . . . . . . . . . . . . . . . . . . . . . . . . . . . . 32.5%

A REPORT FOR AARP PREPARED BY TOWERS PERRIN 37
Career development counseling (training on how to develop or manage your career) . . . . . . . . . . . . . . . . . . . . . . . . . . . . 16.4%
Foreign language training . . . . . . . . . . . . . . . . . . . . . . . . . . . . . . . . . . . . . . . . . . . . . . . . . . . . . . . . . . . . . . . . . . . . . . . . . . 33.4%
English as a Second Language (ESL) classes . . . . . . . . . . . . . . . . . . . . . . . . . . . . . . . . . . . . . . . . . . . . . . . . . . . . . . . . . . . . 9.7%
Occupational safety training . . . . . . . . . . . . . . . . . . . . . . . . . . . . . . . . . . . . . . . . . . . . . . . . . . . . . . . . . . . . . . . . . . . . . . . . 10.0%
New employee orientation training (that introduces new employees to personnel and workplace
practices and to overall company policies) . . . . . . . . . . . . . . . . . . . . . . . . . . . . . . . . . . . . . . . . . . . . . . . . . . . . . . . . . . . . 6.8%
Communication skills training (e.g., presentation or writing skills) . . . . . . . . . . . . . . . . . . . . . . . . . . . . . . . . . . . . . . . . . . . 12.3%
Project management skills training . . . . . . . . . . . . . . . . . . . . . . . . . . . . . . . . . . . . . . . . . . . . . . . . . . . . . . . . . . . . . . . . . . . 19.7%
Negotiation skills training . . . . . . . . . . . . . . . . . . . . . . . . . . . . . . . . . . . . . . . . . . . . . . . . . . . . . . . . . . . . . . . . . . . . . . . . . . 18.3%
Supervisory or management skills training . . . . . . . . . . . . . . . . . . . . . . . . . . . . . . . . . . . . . . . . . . . . . . . . . . . . . . . . . . . . . 21.9%
Awareness training on age diversity—concerning policies and practices related to age diversity in the
workplace or age discrimination. . . . . . . . . . . . . . . . . . . . . . . . . . . . . . . . . . . . . . . . . . . . . . . . . . . . . . . . . . . . . . . . . . . . 10.6%
Awareness training on workplace diversity (other than age)—concerning policies and practices related
to workplace diversity or discrimination for reasons other than age (race/ethnicity, gender, disability, etc.) . . . . . . . . . 10.4%
Other . . . . . . . . . . . . . . . . . . . . . . . . . . . . . . . . . . . . . . . . . . . . . . . . . . . . . . . . . . . . . . . . . . . . . . . . . . . . . . . . . . . . . . . . . . . 0.6%
None of these/not applicable* . . . . . . . . . . . . . . . . . . . . . . . . . . . . . . . . . . . . . . . . . . . . . . . . . . . . . . . . . . . . . . . . . . . . . . 20.8%
** Responses marked with an asterisk were written in by some respondents but were not listed as response options.
Q16 Assuming that your employer would offer all of these work-related education and training
opportunities, please tell us the extent to which you would be interested in participating in
each one.Very Somewhat Not too Not at all
interested interested interested interested RefusedQ16 Computer skills training/information and
communication technology training 40.3% 38.3% 12.0% 8.8% 0.6%
Q16 Career development counseling (training on
how to develop or manage your career) 19.8% 30.8% 26.3% 22.6% 0.6%
Q16 Foreign language training 20.0% 23.0% 25.0% 31.1% 0.9%
Q16 Basic skills training (e.g., basic math, or basic
writing or reading skills) 8.9% 15.2% 32.9% 42.3% 0.6%
Q16 Specific technical or professional skills training 33.2% 38.7% 14.3% 13.1% 0.6%
Q16 Formal courses that lead to certification or
degrees applicable to your job 29.4% 29.4% 20.2% 20.4% 0.6%
Q16 Required professional training (e.g., continuing
legal or accounting credits) 23.0% 21.0% 31.9% 23.3% 0.8%
Q16 English as a Second Language (ESL) classes 5.3% 11.3% 25.1% 57.6% 0.6%
Q16 Occupational safety training 19.5% 33.0% 26.3% 20.5% 0.6%
Q16 New employee orientation training (that introduces
new employees to personnel and workplace
practices and to overall company policies) 14.9% 25.7% 28.7% 30.0% 0.7%
Q16 Communication skills training (e.g., presentation
or writing skills) 20.2% 33.2% 25.6% 20.4% 0.6%
Q16 Awareness training on age diversity—concerning
policies and practices related to age diversity
in the workplace or age discrimination 15.6% 25.1% 30.1% 28.4% 0.7%

38 INVESTING IN TRAINING 50+ WORKERS: A TALENT MANAGEMENT STRATEGY
Very Somewhat Not too Not at all interested interested interested interested Refused
Q16 Awareness training on workplace diversity
(other than age)—concerning policies and practices
related to workplace diversity or discrimination
for reasons other than age (race/ethnicity,
gender, disability, etc.) 15.6% 26.0% 30.1% 27.6% 0.8%
Q16 Project management skills training 22.0% 28.1% 27.8% 21.5% 0.6%
Q16 Negotiation skills training 21.1% 28.4% 26.6% 23.4% 0.6%
Q16 Supervisory or management skills training 24.5% 33.2% 23.6% 17.8% 1.0%
Q16 Other 3.4% 6.0% 18.9% 55.9% 15.9%
Prompt once. Show Q16b if “Other” in Q16 = “Very interested” or “Somewhat interested”.
Q16b In the previous question, you told us you would be interested in participating in another type
of work-related education or training opportunity. Please describe what this education or
training opportunity is in as much detail as possible.
Q17 Have you ever received work-related education or participated in work-related training?
Yes. . . . . . . . . . . . . . . . . . . . . . . . . . . . . . . . . . . . . . . . . . . . . . . . . . . . . . . . . . . . . . . . . . . . . . . . . . . . . . . . . . . . . . . . . . . . 84.3%
No . . . . . . . . . . . . . . . . . . . . . . . . . . . . . . . . . . . . . . . . . . . . . . . . . . . . . . . . . . . . . . . . . . . . . . . . . . . . . . . . . . . . . . . . . . . . 15.7%
Refused . . . . . . . . . . . . . . . . . . . . . . . . . . . . . . . . . . . . . . . . . . . . . . . . . . . . . . . . . . . . . . . . . . . . . . . . . . . . . . . . . . . . . . . . . 0.0%
Prompt once. Show Q18 and Q19 if Q17 = “Yes”.
Q18 Which of the following best describes what you like the most about work-related education and
training? (Check one.) (n=882)
It helps me to do my job well . . . . . . . . . . . . . . . . . . . . . . . . . . . . . . . . . . . . . . . . . . . . . . . . . . . . . . . . . . . . . . . . . . . . . . . . 47.3%
It helps me to advance my career . . . . . . . . . . . . . . . . . . . . . . . . . . . . . . . . . . . . . . . . . . . . . . . . . . . . . . . . . . . . . . . . . . . . . 9.0%
I like learning new things, regardless of the topic . . . . . . . . . . . . . . . . . . . . . . . . . . . . . . . . . . . . . . . . . . . . . . . . . . . . . . . . 22.0%
It gives me a chance to meet new people . . . . . . . . . . . . . . . . . . . . . . . . . . . . . . . . . . . . . . . . . . . . . . . . . . . . . . . . . . . . . . . 2.7%
It gives me a chance to interact with other workers/professionals working in my field/area . . . . . . . . . . . . . . . . . . . . . . . 17.7%
Other . . . . . . . . . . . . . . . . . . . . . . . . . . . . . . . . . . . . . . . . . . . . . . . . . . . . . . . . . . . . . . . . . . . . . . . . . . . . . . . . . . . . . . . . . . . 0.6%
Refused . . . . . . . . . . . . . . . . . . . . . . . . . . . . . . . . . . . . . . . . . . . . . . . . . . . . . . . . . . . . . . . . . . . . . . . . . . . . . . . . . . . . . . . . . 0.7%
[Randomize except “other”]

A REPORT FOR AARP PREPARED BY TOWERS PERRIN 39
Q19 Which of the following best describes what you dislike the most about work-related education
and training? (Check one.) (n=882)
It is not always relevant to me; it does not always meet my needs. . . . . . . . . . . . . . . . . . . . . . . . . . . . . . . . . . . . . . . . . . . 34.7%
It can be too time-consuming; I do not always have the time . . . . . . . . . . . . . . . . . . . . . . . . . . . . . . . . . . . . . . . . . . . . . . . 23.5%
It is not always challenging enough; it can be boring . . . . . . . . . . . . . . . . . . . . . . . . . . . . . . . . . . . . . . . . . . . . . . . . . . . . . 16.9%
It can be difficult to follow or understand . . . . . . . . . . . . . . . . . . . . . . . . . . . . . . . . . . . . . . . . . . . . . . . . . . . . . . . . . . . . . . . 4.0%
I do not always have a chance at work to use the skills or knowledge that I have learned. . . . . . . . . . . . . . . . . . . . . . . . . 16.6%
Other (NET) . . . . . . . . . . . . . . . . . . . . . . . . . . . . . . . . . . . . . . . . . . . . . . . . . . . . . . . . . . . . . . . . . . . . . . . . . . . . . . . . . . . . . . 2.1%
None/nothing I disliked* . . . . . . . . . . . . . . . . . . . . . . . . . . . . . . . . . . . . . . . . . . . . . . . . . . . . . . . . . . . . . . . . . . . . . . . . . . . 0.7%
Scheduled at wrong time* . . . . . . . . . . . . . . . . . . . . . . . . . . . . . . . . . . . . . . . . . . . . . . . . . . . . . . . . . . . . . . . . . . . . . . . . . . 0.6%
Other . . . . . . . . . . . . . . . . . . . . . . . . . . . . . . . . . . . . . . . . . . . . . . . . . . . . . . . . . . . . . . . . . . . . . . . . . . . . . . . . . . . . . . . . . . 0.8%
Refused . . . . . . . . . . . . . . . . . . . . . . . . . . . . . . . . . . . . . . . . . . . . . . . . . . . . . . . . . . . . . . . . . . . . . . . . . . . . . . . . . . . . . . . . . 2.3%
*Responses marked with an asterisk were written in by some respondents but were not listed as response options.
[Randomize except “other”]
Q20 There are various ways in which workers can learn new skills and knowledge. For each of the
following, please tell us the extent to which you personally feel or would feel comfortable with
this way of learning new work-related skills and knowledge.
Very Somewhat Not too Not at allcomfortable comfortable comfortable comfortable Refused
Q20 Classroom training in a small group
(fewer than five participants) 61.7% 28.1% 5.4% 3.2% 1.6%
Q20 Classroom training in a larger group
(five or more participants) 44.0% 36.6% 13.4% 5.1% 0.9%
Q20 Formal one-on-one training 47.6% 32.6% 14.2% 4.4% 1.2%
Q20 Being mentored or taught on the job by
other employee(s) 45.3% 37.3% 11.7% 4.5% 1.1%
Q20 Self-study online or computer-based 32.0% 38.4% 20.7% 7.5% 1.3%
Q20 Self-study using written/paper materials
(not computer-based) 28.3% 38.8% 24.2% 7.7% 1.0%
Q20 Live online training with an instructor 26.0% 35.7% 25.7% 11.4% 1.3%
Q20 Conferences, workshops, seminars 45.1% 34.8% 12.5% 6.0% 1.6%
Q21 How often would you like to have the opportunity to participate in work-related education or
training? (Check one.)
Weekly or more often . . . . . . . . . . . . . . . . . . . . . . . . . . . . . . . . . . . . . . . . . . . . . . . . . . . . . . . . . . . . . . . . . . . . . . . . . . . . . . 7.3%
Every other week . . . . . . . . . . . . . . . . . . . . . . . . . . . . . . . . . . . . . . . . . . . . . . . . . . . . . . . . . . . . . . . . . . . . . . . . . . . . . . . . . 4.8%
Monthly . . . . . . . . . . . . . . . . . . . . . . . . . . . . . . . . . . . . . . . . . . . . . . . . . . . . . . . . . . . . . . . . . . . . . . . . . . . . . . . . . . . . . . . . 15.8%
Quarterly (4 times a year) . . . . . . . . . . . . . . . . . . . . . . . . . . . . . . . . . . . . . . . . . . . . . . . . . . . . . . . . . . . . . . . . . . . . . . . . . . 27.3%
Less often (1-3 times a year). . . . . . . . . . . . . . . . . . . . . . . . . . . . . . . . . . . . . . . . . . . . . . . . . . . . . . . . . . . . . . . . . . . . . . . . 20.4%
Never . . . . . . . . . . . . . . . . . . . . . . . . . . . . . . . . . . . . . . . . . . . . . . . . . . . . . . . . . . . . . . . . . . . . . . . . . . . . . . . . . . . . . . . . . . 5.5%
Not sure; it depends . . . . . . . . . . . . . . . . . . . . . . . . . . . . . . . . . . . . . . . . . . . . . . . . . . . . . . . . . . . . . . . . . . . . . . . . . . . . . . 18.7%
Refused . . . . . . . . . . . . . . . . . . . . . . . . . . . . . . . . . . . . . . . . . . . . . . . . . . . . . . . . . . . . . . . . . . . . . . . . . . . . . . . . . . . . . . . . . 0.2%

40 INVESTING IN TRAINING 50+ WORKERS: A TALENT MANAGEMENT STRATEGY
Q22 In the past two years, have you participated in any work-related education or training opportunities?
Yes. . . . . . . . . . . . . . . . . . . . . . . . . . . . . . . . . . . . . . . . . . . . . . . . . . . . . . . . . . . . . . . . . . . . . . . . . . . . . . . . . . . . . . . . . . . . 66.4%
No . . . . . . . . . . . . . . . . . . . . . . . . . . . . . . . . . . . . . . . . . . . . . . . . . . . . . . . . . . . . . . . . . . . . . . . . . . . . . . . . . . . . . . . . . . . . 33.5%
Refused . . . . . . . . . . . . . . . . . . . . . . . . . . . . . . . . . . . . . . . . . . . . . . . . . . . . . . . . . . . . . . . . . . . . . . . . . . . . . . . . . . . . . . . . . 0.1%
Prompt once. Show Q23 if Q22 = “Yes”.
Q23 Do you feel you have participated in a sufficient number of work-related education and training
opportunities within the past two years to meet your job requirements and professional
development needs? (n=692)
Yes. . . . . . . . . . . . . . . . . . . . . . . . . . . . . . . . . . . . . . . . . . . . . . . . . . . . . . . . . . . . . . . . . . . . . . . . . . . . . . . . . . . . . . . . . . . . 75.3%
No . . . . . . . . . . . . . . . . . . . . . . . . . . . . . . . . . . . . . . . . . . . . . . . . . . . . . . . . . . . . . . . . . . . . . . . . . . . . . . . . . . . . . . . . . . . . 24.6%
Refused . . . . . . . . . . . . . . . . . . . . . . . . . . . . . . . . . . . . . . . . . . . . . . . . . . . . . . . . . . . . . . . . . . . . . . . . . . . . . . . . . . . . . . . . . 0.2%
Q24 Did you participate in all the work-related education and training opportunities that you
requested or desired within the past two years? Please select the option that best describes
what happened. (Check one)
Yes, you participated in all of the training that you requested/desired. . . . . . . . . . . . . . . . . . . . . . . . . . . . . . . . . . . . . . . . 40.3%
You participated in some but not all of the training that you requested/desired . . . . . . . . . . . . . . . . . . . . . . . . . . . . . . . . 24.2%
No, you did not participate in any of the training that you requested/desired . . . . . . . . . . . . . . . . . . . . . . . . . . . . . . . . . . . 7.6%
You did not request or desire any training in the past two years . . . . . . . . . . . . . . . . . . . . . . . . . . . . . . . . . . . . . . . . . . . . . 27.2%
Refused . . . . . . . . . . . . . . . . . . . . . . . . . . . . . . . . . . . . . . . . . . . . . . . . . . . . . . . . . . . . . . . . . . . . . . . . . . . . . . . . . . . . . . . . . 0.6%
Prompt once. Show Q25a if Q24 = 2, 3 or 4.
Q25a What obstacles, if any, prevented you from participating in work-related education and
training opportunities in the past two years? (n=624)
Employer did not offer or pay for any education or training opportunities. . . . . . . . . . . . . . . . . . . . . . . . . . . . . . . . . . . . . . 30.5%
Employer did not offer or pay for certain education or training opportunities that you needed/wanted . . . . . . . . . . . . . . . 14.1%
Employer/supervisor/boss did not allow you to participate in the training you wanted due to
work demands/time constraints . . . . . . . . . . . . . . . . . . . . . . . . . . . . . . . . . . . . . . . . . . . . . . . . . . . . . . . . . . . . . . . . . . . 18.3%
Employer/supervisor/boss did not allow you to participate in the training you wanted due to budgetary reasons . . . . . . 12.7%
Employer/supervisor/boss did not allow you to participate in the training because he/she did
not think the training was relevant to your job . . . . . . . . . . . . . . . . . . . . . . . . . . . . . . . . . . . . . . . . . . . . . . . . . . . . . . . . . . 8.4%
You felt too busy at your job to take time off for training . . . . . . . . . . . . . . . . . . . . . . . . . . . . . . . . . . . . . . . . . . . . . . . . . . . 29.5%
You did not think the training offered by your employer was useful or relevant to your job . . . . . . . . . . . . . . . . . . . . . . . . 11.6%
You did not feel the need to take any training. . . . . . . . . . . . . . . . . . . . . . . . . . . . . . . . . . . . . . . . . . . . . . . . . . . . . . . . . . . 23.7%
Other (NET) . . . . . . . . . . . . . . . . . . . . . . . . . . . . . . . . . . . . . . . . . . . . . . . . . . . . . . . . . . . . . . . . . . . . . . . . . . . . . . . . . . . . . . 4.7%
Personal obligations prevented training* . . . . . . . . . . . . . . . . . . . . . . . . . . . . . . . . . . . . . . . . . . . . . . . . . . . . . . . . . . . . 1.4%
Class was cancelled or full* . . . . . . . . . . . . . . . . . . . . . . . . . . . . . . . . . . . . . . . . . . . . . . . . . . . . . . . . . . . . . . . . . . . . . . 1.1%
None/no obstacles* . . . . . . . . . . . . . . . . . . . . . . . . . . . . . . . . . . . . . . . . . . . . . . . . . . . . . . . . . . . . . . . . . . . . . . . . . . . 0.7%
Other. . . . . . . . . . . . . . . . . . . . . . . . . . . . . . . . . . . . . . . . . . . . . . . . . . . . . . . . . . . . . . . . . . . . . . . . . . . . . . . . . . . . . . . . 1.4%
Refused . . . . . . . . . . . . . . . . . . . . . . . . . . . . . . . . . . . . . . . . . . . . . . . . . . . . . . . . . . . . . . . . . . . . . . . . . . . . . . . . . . . . . . . . . 2.4%
*Responses marked with an asterisk were written in by some respondents but were not listed as response options.
Show Q25b and Q26 if Q22 = “Yes”.

A REPORT FOR AARP PREPARED BY TOWERS PERRIN 41
Q25b In which of the following types of work-related education or training opportunities have you
participated during the past two years? (n=692)
[Randomize but group first 4 items together and two “awareness” items together]
Basic skills training (e.g., basic math, or basic writing or reading skills) . . . . . . . . . . . . . . . . . . . . . . . . . . . . . . . . . . . . . . . . 4.4%
Specific technical or professional skills training . . . . . . . . . . . . . . . . . . . . . . . . . . . . . . . . . . . . . . . . . . . . . . . . . . . . . . . . . 57.5%
Formal courses that lead to certification or degrees applicable to your job . . . . . . . . . . . . . . . . . . . . . . . . . . . . . . . . . . . . 19.3%
Required professional training (e.g., continuing legal or accounting credits). . . . . . . . . . . . . . . . . . . . . . . . . . . . . . . . . . . . 16.4%
Computer skills training/information and communication technology training . . . . . . . . . . . . . . . . . . . . . . . . . . . . . . . . . 48.4%
Career development counseling (training on how to develop or manage your career) . . . . . . . . . . . . . . . . . . . . . . . . . . . . 12.3%
Foreign language training. . . . . . . . . . . . . . . . . . . . . . . . . . . . . . . . . . . . . . . . . . . . . . . . . . . . . . . . . . . . . . . . . . . . . . . . . . . . 1.5%
English as a Second Language (ESL) classes . . . . . . . . . . . . . . . . . . . . . . . . . . . . . . . . . . . . . . . . . . . . . . . . . . . . . . . . . . . . 1.4%
Occupational safety training . . . . . . . . . . . . . . . . . . . . . . . . . . . . . . . . . . . . . . . . . . . . . . . . . . . . . . . . . . . . . . . . . . . . . . . . 38.6%
New employee orientation training (that introduces new employees to personnel and workplace practices
and to overall company policies) . . . . . . . . . . . . . . . . . . . . . . . . . . . . . . . . . . . . . . . . . . . . . . . . . . . . . . . . . . . . . . . . . . . 17.7%
Communication skills training (e.g., presentation or writing skills) . . . . . . . . . . . . . . . . . . . . . . . . . . . . . . . . . . . . . . . . . . . 12.0%
Project management skills training . . . . . . . . . . . . . . . . . . . . . . . . . . . . . . . . . . . . . . . . . . . . . . . . . . . . . . . . . . . . . . . . . . . . 6.8%
Negotiation skills training . . . . . . . . . . . . . . . . . . . . . . . . . . . . . . . . . . . . . . . . . . . . . . . . . . . . . . . . . . . . . . . . . . . . . . . . . . . 4.6%
Supervisory or management skills training . . . . . . . . . . . . . . . . . . . . . . . . . . . . . . . . . . . . . . . . . . . . . . . . . . . . . . . . . . . . . 16.9%
Awareness training on age diversity—concerning policies and practices related to age diversity in the
workplace or age discrimination . . . . . . . . . . . . . . . . . . . . . . . . . . . . . . . . . . . . . . . . . . . . . . . . . . . . . . . . . . . . . . . . . . . . 19.2%
Awareness training on workplace diversity (other than age)—concerning policies and practices related to
workplace diversity or discrimination for reasons other than age (race/ethnicity, gender, disability, etc.). . . . . . . . . . . . 27.6%
Other . . . . . . . . . . . . . . . . . . . . . . . . . . . . . . . . . . . . . . . . . . . . . . . . . . . . . . . . . . . . . . . . . . . . . . . . . . . . . . . . . . . . . . . . . . . 8.6%
Refused . . . . . . . . . . . . . . . . . . . . . . . . . . . . . . . . . . . . . . . . . . . . . . . . . . . . . . . . . . . . . . . . . . . . . . . . . . . . . . . . . . . . . . . . . 0.1%
Prompt once. Show Q25c if “Other” in Q25b = “Yes”.
Q25c In the previous question, you told us that you participated in another type of work-related
education or training opportunity in the past two years. Please describe what this education
or training opportunity was in as much detail as possible.
Show Q26, Q27, Q28 and Q29 if Q22 = “Yes”.

42 INVESTING IN TRAINING 50+ WORKERS: A TALENT MANAGEMENT STRATEGY
Q26 Was all or some of the training in which you participated in the past two years mandatory? (n=692)
All training was mandatory . . . . . . . . . . . . . . . . . . . . . . . . . . . . . . . . . . . . . . . . . . . . . . . . . . . . . . . . . . . . . . . . . . . . . . . . . 38.7%
Some training was mandatory . . . . . . . . . . . . . . . . . . . . . . . . . . . . . . . . . . . . . . . . . . . . . . . . . . . . . . . . . . . . . . . . . . . . . . 41.5%
No training was mandatory . . . . . . . . . . . . . . . . . . . . . . . . . . . . . . . . . . . . . . . . . . . . . . . . . . . . . . . . . . . . . . . . . . . . . . . . . 19.7%
Refused . . . . . . . . . . . . . . . . . . . . . . . . . . . . . . . . . . . . . . . . . . . . . . . . . . . . . . . . . . . . . . . . . . . . . . . . . . . . . . . . . . . . . . . . . 0.2%
Q27 Overall, to what extent did you find the work-related education or training you received in the
past two years useful for your job or career? (n=692)
Very useful . . . . . . . . . . . . . . . . . . . . . . . . . . . . . . . . . . . . . . . . . . . . . . . . . . . . . . . . . . . . . . . . . . . . . . . . . . . . . . . . . . . . . . 47.1%
Somewhat useful . . . . . . . . . . . . . . . . . . . . . . . . . . . . . . . . . . . . . . . . . . . . . . . . . . . . . . . . . . . . . . . . . . . . . . . . . . . . . . . . . 45.3%
Not too useful . . . . . . . . . . . . . . . . . . . . . . . . . . . . . . . . . . . . . . . . . . . . . . . . . . . . . . . . . . . . . . . . . . . . . . . . . . . . . . . . . . . . 6.5%
Not at all useful . . . . . . . . . . . . . . . . . . . . . . . . . . . . . . . . . . . . . . . . . . . . . . . . . . . . . . . . . . . . . . . . . . . . . . . . . . . . . . . . . . . 1.1%
Refused . . . . . . . . . . . . . . . . . . . . . . . . . . . . . . . . . . . . . . . . . . . . . . . . . . . . . . . . . . . . . . . . . . . . . . . . . . . . . . . . . . . . . . . . . 0.0%
Q28 For each of the following, please tell us the extent to which the training you took in the past
two years affected that aspect of your work? (n=692)
The training you took in the past 2 years...
A great deal Somewhat A little Not at all RefusedQ28 Increased your productivity at work 19.5% 42.7% 16.0% 21.3% 0.4%
Q28 Improved your job skills 30.7% 45.2% 14.1% 9.3% 0.7%
Q28 Allowed you to take on more or new
responsibilities 23.7% 30.3% 15.8% 29.3% 0.8%
Q28 Increased your satisfaction with your job 22.4% 33.2% 23.8% 19.4% 1.1%
Q28 Made you feel like a more valuable
employee 26.5% 32.9% 18.7% 21.2% 0.8%
Q28 Increased your ability to help your
coworkers/be a mentor to your coworkers 26.9% 36.0% 18.4% 18.1% 0.6%
Q28 Helped you to get promoted 7.4% 16.6% 11.3% 62.2% 2.5%
Q29 Have you had to cover any expenses associated with any work-related education or training
that you received in the past two years? (n=692)
Yes . . . . . . . . . . . . . . . . . . . . . . . . . . . . . . . . . . . . . . . . . . . . . . . . . . . . . . . . . . . . . . . . . . . . . . . . . . . . . . . . . . . . . . . . . . . . 17.8%
No . . . . . . . . . . . . . . . . . . . . . . . . . . . . . . . . . . . . . . . . . . . . . . . . . . . . . . . . . . . . . . . . . . . . . . . . . . . . . . . . . . . . . . . . . . . . 82.2%
Refused . . . . . . . . . . . . . . . . . . . . . . . . . . . . . . . . . . . . . . . . . . . . . . . . . . . . . . . . . . . . . . . . . . . . . . . . . . . . . . . . . . . . . . . . . 0.0%
Prompt once. Show Q29b if Q29 = “Yes”.

A REPORT FOR AARP PREPARED BY TOWERS PERRIN 43
Q29b In the previous question, you told us you have had to cover expenses associated with work-
related education or training received in the past two years. How much have you had to cover?
(Your best guess is fine.) (n=120)
$1–100 . . . . . . . . . . . . . . . . . . . . . . . . . . . . . . . . . . . . . . . . . . . . . . . . . . . . . . . . . . . . . . . . . . . . . . . . . . . . . . . . . . . . . . . . 45.2%
101–500 . . . . . . . . . . . . . . . . . . . . . . . . . . . . . . . . . . . . . . . . . . . . . . . . . . . . . . . . . . . . . . . . . . . . . . . . . . . . . . . . . . . . . . . 33.5%
501–1000 . . . . . . . . . . . . . . . . . . . . . . . . . . . . . . . . . . . . . . . . . . . . . . . . . . . . . . . . . . . . . . . . . . . . . . . . . . . . . . . . . . . . . . . 5.1%
$1001+ . . . . . . . . . . . . . . . . . . . . . . . . . . . . . . . . . . . . . . . . . . . . . . . . . . . . . . . . . . . . . . . . . . . . . . . . . . . . . . . . . . . . . . . . 15.1%
Refused . . . . . . . . . . . . . . . . . . . . . . . . . . . . . . . . . . . . . . . . . . . . . . . . . . . . . . . . . . . . . . . . . . . . . . . . . . . . . . . . . . . . . . . . . 1.1%
Median . . . . . . . . . . . . . . . . . . . . . . . . . . . . . . . . . . . . . . . . . . . . . . . . . . . . . . . . . . . . . . . . . . . . . . . . . . . . . . . . . . . . . . . . . $135
Mean. . . . . . . . . . . . . . . . . . . . . . . . . . . . . . . . . . . . . . . . . . . . . . . . . . . . . . . . . . . . . . . . . . . . . . . . . . . . . . . . . . . . . . . . . . . $791
[Respondents were allowed to enter a number from 0 to 999999]
Q30 If your employer paid for or allowed you to participate in more work-related education, training,
or professional development opportunities than you participate in now, would that lead you to
stay with this employer longer than you would otherwise?
Yes . . . . . . . . . . . . . . . . . . . . . . . . . . . . . . . . . . . . . . . . . . . . . . . . . . . . . . . . . . . . . . . . . . . . . . . . . . . . . . . . . . . . . . . . . . . . 25.1%
No . . . . . . . . . . . . . . . . . . . . . . . . . . . . . . . . . . . . . . . . . . . . . . . . . . . . . . . . . . . . . . . . . . . . . . . . . . . . . . . . . . . . . . . . . . . . 32.5%
Maybe . . . . . . . . . . . . . . . . . . . . . . . . . . . . . . . . . . . . . . . . . . . . . . . . . . . . . . . . . . . . . . . . . . . . . . . . . . . . . . . . . . . . . . . . . 29.5%
Not sure . . . . . . . . . . . . . . . . . . . . . . . . . . . . . . . . . . . . . . . . . . . . . . . . . . . . . . . . . . . . . . . . . . . . . . . . . . . . . . . . . . . . . . . . 12.6%
Refused . . . . . . . . . . . . . . . . . . . . . . . . . . . . . . . . . . . . . . . . . . . . . . . . . . . . . . . . . . . . . . . . . . . . . . . . . . . . . . . . . . . . . . . . . 0.3%
AND NOW WE HAVE SOME FINAL QUESTIONS FOR CLASSIFICATION PURPOSES ONLY.
Q31 To the best of your knowledge, which of the following benefits does your employer offer to
its employees?
Yes No Don’t know RefusedQ31 Health insurance 92.6% 6.2% 1.0% 0.3%
Q31 Pension or retirement savings plan 86.6% 10.5% 2.1% 0.7%
Q31 Flexible work arrangements (e.g., flextime, compressed
work schedules, telecommuting) 41.7% 44.4% 12.5% 1.4%
Q32 Which of the following best describes your current employer?
Public or private school or university . . . . . . . . . . . . . . . . . . . . . . . . . . . . . . . . . . . . . . . . . . . . . . . . . . . . . . . . . . . . . . . . . . 15.9%
Federal, state, or local government . . . . . . . . . . . . . . . . . . . . . . . . . . . . . . . . . . . . . . . . . . . . . . . . . . . . . . . . . . . . . . . . . . . 13.4%
Nonprofit organization (other than government) . . . . . . . . . . . . . . . . . . . . . . . . . . . . . . . . . . . . . . . . . . . . . . . . . . . . . . . . . . 9.5%
For-profit company . . . . . . . . . . . . . . . . . . . . . . . . . . . . . . . . . . . . . . . . . . . . . . . . . . . . . . . . . . . . . . . . . . . . . . . . . . . . . . . 44.3%
Small or family-run business . . . . . . . . . . . . . . . . . . . . . . . . . . . . . . . . . . . . . . . . . . . . . . . . . . . . . . . . . . . . . . . . . . . . . . . . 10.5%
Other . . . . . . . . . . . . . . . . . . . . . . . . . . . . . . . . . . . . . . . . . . . . . . . . . . . . . . . . . . . . . . . . . . . . . . . . . . . . . . . . . . . . . . . . . . 6.3%
Refused . . . . . . . . . . . . . . . . . . . . . . . . . . . . . . . . . . . . . . . . . . . . . . . . . . . . . . . . . . . . . . . . . . . . . . . . . . . . . . . . . . . . . . . . . 0.1%

44 INVESTING IN TRAINING 50+ WORKERS: A TALENT MANAGEMENT STRATEGY
Q33 In what industry or type of business is your current employer primarily involved? Please select
one option from the following list or write your answer in the box provided below.
Agriculture/forestry/fishing/and related . . . . . . . . . . . . . . . . . . . . . . . . . . . . . . . . . . . . . . . . . . . . . . . . . . . . . . . . . . . . . . . 0.6%
Mining . . . . . . . . . . . . . . . . . . . . . . . . . . . . . . . . . . . . . . . . . . . . . . . . . . . . . . . . . . . . . . . . . . . . . . . . . . . . . . . . . . . . . . . . . . 0.4%
Construction . . . . . . . . . . . . . . . . . . . . . . . . . . . . . . . . . . . . . . . . . . . . . . . . . . . . . . . . . . . . . . . . . . . . . . . . . . . . . . . . . . . . . 4.3%
Manufacturing . . . . . . . . . . . . . . . . . . . . . . . . . . . . . . . . . . . . . . . . . . . . . . . . . . . . . . . . . . . . . . . . . . . . . . . . . . . . . . . . . . . 15.5%
Wholesale Trade. . . . . . . . . . . . . . . . . . . . . . . . . . . . . . . . . . . . . . . . . . . . . . . . . . . . . . . . . . . . . . . . . . . . . . . . . . . . . . . . . . . 2.5%
Retail Trade . . . . . . . . . . . . . . . . . . . . . . . . . . . . . . . . . . . . . . . . . . . . . . . . . . . . . . . . . . . . . . . . . . . . . . . . . . . . . . . . . . . . . . 9.7%
Transportation and Utilities . . . . . . . . . . . . . . . . . . . . . . . . . . . . . . . . . . . . . . . . . . . . . . . . . . . . . . . . . . . . . . . . . . . . . . . . . . 7.8%
Information and Information Services . . . . . . . . . . . . . . . . . . . . . . . . . . . . . . . . . . . . . . . . . . . . . . . . . . . . . . . . . . . . . . . . . . 5.0%
Finance/insurance/real estate. . . . . . . . . . . . . . . . . . . . . . . . . . . . . . . . . . . . . . . . . . . . . . . . . . . . . . . . . . . . . . . . . . . . . . . 6.2%
Professional and Business Services . . . . . . . . . . . . . . . . . . . . . . . . . . . . . . . . . . . . . . . . . . . . . . . . . . . . . . . . . . . . . . . . . . . 5.6%
Education services . . . . . . . . . . . . . . . . . . . . . . . . . . . . . . . . . . . . . . . . . . . . . . . . . . . . . . . . . . . . . . . . . . . . . . . . . . . . . . . . 17.2%
Health services . . . . . . . . . . . . . . . . . . . . . . . . . . . . . . . . . . . . . . . . . . . . . . . . . . . . . . . . . . . . . . . . . . . . . . . . . . . . . . . . . . 14.0%
Leisure and Hospitality (arts, entertainment, recreation, food services, lodging) . . . . . . . . . . . . . . . . . . . . . . . . . . . . . . . . . 5.3%
Other (NET) . . . . . . . . . . . . . . . . . . . . . . . . . . . . . . . . . . . . . . . . . . . . . . . . . . . . . . . . . . . . . . . . . . . . . . . . . . . . . . . . . . . . . . 5.0%
Government Service*. . . . . . . . . . . . . . . . . . . . . . . . . . . . . . . . . . . . . . . . . . . . . . . . . . . . . . . . . . . . . . . . . . . . . . . . . . . . . 2.1%
Law/Legal Enforcement*. . . . . . . . . . . . . . . . . . . . . . . . . . . . . . . . . . . . . . . . . . . . . . . . . . . . . . . . . . . . . . . . . . . . . . . . . . 1.5%
Security* . . . . . . . . . . . . . . . . . . . . . . . . . . . . . . . . . . . . . . . . . . . . . . . . . . . . . . . . . . . . . . . . . . . . . . . . . . . . . . . . . . . . . . 0.5%
Religious Organization* . . . . . . . . . . . . . . . . . . . . . . . . . . . . . . . . . . . . . . . . . . . . . . . . . . . . . . . . . . . . . . . . . . . . . . . . . . . 0.5%
Other . . . . . . . . . . . . . . . . . . . . . . . . . . . . . . . . . . . . . . . . . . . . . . . . . . . . . . . . . . . . . . . . . . . . . . . . . . . . . . . . . . . . . . . . . 0.4%
Refused . . . . . . . . . . . . . . . . . . . . . . . . . . . . . . . . . . . . . . . . . . . . . . . . . . . . . . . . . . . . . . . . . . . . . . . . . . . . . . . . . . . . . . . . . 1.0%
*Responses marked with an asterisk were written in by some respondents but were not listed as response options.
Q34 How many employees, in total, work for your current employer in all locations in the United
States? (Please exclude nonpermanent workers, such as temporary or contract workers.) Just
your best estimate is fine.
10–19 . . . . . . . . . . . . . . . . . . . . . . . . . . . . . . . . . . . . . . . . . . . . . . . . . . . . . . . . . . . . . . . . . . . . . . . . . . . . . . . . . . . . . . . . . . 5.3%
20–49 . . . . . . . . . . . . . . . . . . . . . . . . . . . . . . . . . . . . . . . . . . . . . . . . . . . . . . . . . . . . . . . . . . . . . . . . . . . . . . . . . . . . . . . . . . 8.1%
50–99 . . . . . . . . . . . . . . . . . . . . . . . . . . . . . . . . . . . . . . . . . . . . . . . . . . . . . . . . . . . . . . . . . . . . . . . . . . . . . . . . . . . . . . . . . . 8.9%
100–499 . . . . . . . . . . . . . . . . . . . . . . . . . . . . . . . . . . . . . . . . . . . . . . . . . . . . . . . . . . . . . . . . . . . . . . . . . . . . . . . . . . . . . . . 22.0%
500–999 . . . . . . . . . . . . . . . . . . . . . . . . . . . . . . . . . . . . . . . . . . . . . . . . . . . . . . . . . . . . . . . . . . . . . . . . . . . . . . . . . . . . . . . 10.5%
1,000–9,999 . . . . . . . . . . . . . . . . . . . . . . . . . . . . . . . . . . . . . . . . . . . . . . . . . . . . . . . . . . . . . . . . . . . . . . . . . . . . . . . . . . . . 18.5%
10,000 or more . . . . . . . . . . . . . . . . . . . . . . . . . . . . . . . . . . . . . . . . . . . . . . . . . . . . . . . . . . . . . . . . . . . . . . . . . . . . . . . . . . 18.2%
Do not know . . . . . . . . . . . . . . . . . . . . . . . . . . . . . . . . . . . . . . . . . . . . . . . . . . . . . . . . . . . . . . . . . . . . . . . . . . . . . . . . . . . . . 8.4%
Refused . . . . . . . . . . . . . . . . . . . . . . . . . . . . . . . . . . . . . . . . . . . . . . . . . . . . . . . . . . . . . . . . . . . . . . . . . . . . . . . . . . . . . . . . . 0.0%

A REPORT FOR AARP PREPARED BY TOWERS PERRIN 45
Q35 How long have you been working for your current employer?
Less than 6 months. . . . . . . . . . . . . . . . . . . . . . . . . . . . . . . . . . . . . . . . . . . . . . . . . . . . . . . . . . . . . . . . . . . . . . . . . . . . . . . . 3.7%
6 months to less than 12 months . . . . . . . . . . . . . . . . . . . . . . . . . . . . . . . . . . . . . . . . . . . . . . . . . . . . . . . . . . . . . . . . . . . . . 3.3%
1 year to less than 3 years . . . . . . . . . . . . . . . . . . . . . . . . . . . . . . . . . . . . . . . . . . . . . . . . . . . . . . . . . . . . . . . . . . . . . . . . . . 11.9%
3 years to less than 5 years. . . . . . . . . . . . . . . . . . . . . . . . . . . . . . . . . . . . . . . . . . . . . . . . . . . . . . . . . . . . . . . . . . . . . . . . . . 9.8%
5 years to less than 10 years . . . . . . . . . . . . . . . . . . . . . . . . . . . . . . . . . . . . . . . . . . . . . . . . . . . . . . . . . . . . . . . . . . . . . . . 20.3%
10 years to less than 20 years . . . . . . . . . . . . . . . . . . . . . . . . . . . . . . . . . . . . . . . . . . . . . . . . . . . . . . . . . . . . . . . . . . . . . . 25.9%
20 years or more . . . . . . . . . . . . . . . . . . . . . . . . . . . . . . . . . . . . . . . . . . . . . . . . . . . . . . . . . . . . . . . . . . . . . . . . . . . . . . . . . 24.6%
Refused/no answer. . . . . . . . . . . . . . . . . . . . . . . . . . . . . . . . . . . . . . . . . . . . . . . . . . . . . . . . . . . . . . . . . . . . . . . . . . . . . . . . 0.3%
Q36 How long have you been working at your current position?
Less than 6 months . . . . . . . . . . . . . . . . . . . . . . . . . . . . . . . . . . . . . . . . . . . . . . . . . . . . . . . . . . . . . . . . . . . . . . . . . . . . . . . . 6.1%
6 months to less than 12 months . . . . . . . . . . . . . . . . . . . . . . . . . . . . . . . . . . . . . . . . . . . . . . . . . . . . . . . . . . . . . . . . . . . . . 4.7%
1 year to less than 3 years . . . . . . . . . . . . . . . . . . . . . . . . . . . . . . . . . . . . . . . . . . . . . . . . . . . . . . . . . . . . . . . . . . . . . . . . . . 17.0%
3 years to less than 5 years . . . . . . . . . . . . . . . . . . . . . . . . . . . . . . . . . . . . . . . . . . . . . . . . . . . . . . . . . . . . . . . . . . . . . . . . 13.6%
5 years to less than 10 years . . . . . . . . . . . . . . . . . . . . . . . . . . . . . . . . . . . . . . . . . . . . . . . . . . . . . . . . . . . . . . . . . . . . . . . . 21.1%
10 years to less than 20 years . . . . . . . . . . . . . . . . . . . . . . . . . . . . . . . . . . . . . . . . . . . . . . . . . . . . . . . . . . . . . . . . . . . . . . 24.3%
20 years or more . . . . . . . . . . . . . . . . . . . . . . . . . . . . . . . . . . . . . . . . . . . . . . . . . . . . . . . . . . . . . . . . . . . . . . . . . . . . . . . . . 12.3%
Refused . . . . . . . . . . . . . . . . . . . . . . . . . . . . . . . . . . . . . . . . . . . . . . . . . . . . . . . . . . . . . . . . . . . . . . . . . . . . . . . . . . . . . . . . . 0.8%
Q37 What is your current position?
Staff, non-managerial employee . . . . . . . . . . . . . . . . . . . . . . . . . . . . . . . . . . . . . . . . . . . . . . . . . . . . . . . . . . . . . . . . . . . . . 55.3%
Middle management . . . . . . . . . . . . . . . . . . . . . . . . . . . . . . . . . . . . . . . . . . . . . . . . . . . . . . . . . . . . . . . . . . . . . . . . . . . . . . 24.5%
Upper/senior management/business owner . . . . . . . . . . . . . . . . . . . . . . . . . . . . . . . . . . . . . . . . . . . . . . . . . . . . . . . . . . . . 5.1%
Something else . . . . . . . . . . . . . . . . . . . . . . . . . . . . . . . . . . . . . . . . . . . . . . . . . . . . . . . . . . . . . . . . . . . . . . . . . . . . . . . . . . 15.0%
Refused . . . . . . . . . . . . . . . . . . . . . . . . . . . . . . . . . . . . . . . . . . . . . . . . . . . . . . . . . . . . . . . . . . . . . . . . . . . . . . . . . . . . . . . . . 0.1%
Q38 What is your current occupation exactly?*
Management/business and financial occupations . . . . . . . . . . . . . . . . . . . . . . . . . . . . . . . . . . . . . . . . . . . . . . . . . . . . . . . 12.4%
Professional and related occupations . . . . . . . . . . . . . . . . . . . . . . . . . . . . . . . . . . . . . . . . . . . . . . . . . . . . . . . . . . . . . . . . . 25.2%
Service occupation (including protective services) . . . . . . . . . . . . . . . . . . . . . . . . . . . . . . . . . . . . . . . . . . . . . . . . . . . . . . . 12.8%
Sales and related occupations. . . . . . . . . . . . . . . . . . . . . . . . . . . . . . . . . . . . . . . . . . . . . . . . . . . . . . . . . . . . . . . . . . . . . . . . 7.6%
Office and administrative support occupations. . . . . . . . . . . . . . . . . . . . . . . . . . . . . . . . . . . . . . . . . . . . . . . . . . . . . . . . . . . 8.5%
Fishing/forestry occupations . . . . . . . . . . . . . . . . . . . . . . . . . . . . . . . . . . . . . . . . . . . . . . . . . . . . . . . . . . . . . . . . . . . . . . . . 0.0%
Construction and extraction occupations . . . . . . . . . . . . . . . . . . . . . . . . . . . . . . . . . . . . . . . . . . . . . . . . . . . . . . . . . . . . . . . 2.0%
Installation/maintenance/repair occupations. . . . . . . . . . . . . . . . . . . . . . . . . . . . . . . . . . . . . . . . . . . . . . . . . . . . . . . . . . . . 7.8%
Production occupations. . . . . . . . . . . . . . . . . . . . . . . . . . . . . . . . . . . . . . . . . . . . . . . . . . . . . . . . . . . . . . . . . . . . . . . . . . . . . 5.0%
Transportation and material moving occupations . . . . . . . . . . . . . . . . . . . . . . . . . . . . . . . . . . . . . . . . . . . . . . . . . . . . . . . . . 6.5%
Other . . . . . . . . . . . . . . . . . . . . . . . . . . . . . . . . . . . . . . . . . . . . . . . . . . . . . . . . . . . . . . . . . . . . . . . . . . . . . . . . . . . . . . . . . . . 6.2%
Don’t know/no answer . . . . . . . . . . . . . . . . . . . . . . . . . . . . . . . . . . . . . . . . . . . . . . . . . . . . . . . . . . . . . . . . . . . . . . . . . . . . . 0.2%
Refused . . . . . . . . . . . . . . . . . . . . . . . . . . . . . . . . . . . . . . . . . . . . . . . . . . . . . . . . . . . . . . . . . . . . . . . . . . . . . . . . . . . . . . . . . 5.9%
*This was an open-ended question. Responses written in by respondents were coded into the above categories.

46 INVESTING IN TRAINING 50+ WORKERS: A TALENT MANAGEMENT STRATEGY
Q39 How many years in total have you worked since you were 18 years old?
Percent0-5. . . . . . . . . . . . . . . . . . . . . . . . . . . . . . . . . . . . . . . . . . . . . . . . . . . . . . . . . . . . . . . . . . . . . . . . . . . . . . . . . . . . . . . . . . . . . 0.2%
6–10 . . . . . . . . . . . . . . . . . . . . . . . . . . . . . . . . . . . . . . . . . . . . . . . . . . . . . . . . . . . . . . . . . . . . . . . . . . . . . . . . . . . . . . . . . . . 0.3%
11–15. . . . . . . . . . . . . . . . . . . . . . . . . . . . . . . . . . . . . . . . . . . . . . . . . . . . . . . . . . . . . . . . . . . . . . . . . . . . . . . . . . . . . . . . . . . 1.0%
16–20 . . . . . . . . . . . . . . . . . . . . . . . . . . . . . . . . . . . . . . . . . . . . . . . . . . . . . . . . . . . . . . . . . . . . . . . . . . . . . . . . . . . . . . . . . . 2.4%
21+ . . . . . . . . . . . . . . . . . . . . . . . . . . . . . . . . . . . . . . . . . . . . . . . . . . . . . . . . . . . . . . . . . . . . . . . . . . . . . . . . . . . . . . . . . . . 94.8%
Don’t know/no answer . . . . . . . . . . . . . . . . . . . . . . . . . . . . . . . . . . . . . . . . . . . . . . . . . . . . . . . . . . . . . . . . . . . . . . . . . . . . . 1.3%
[Respondents were allowed to enter a number from 0 to 100]
Q40 Have you ever officially retired from a job?
Yes . . . . . . . . . . . . . . . . . . . . . . . . . . . . . . . . . . . . . . . . . . . . . . . . . . . . . . . . . . . . . . . . . . . . . . . . . . . . . . . . . . . . . . . . . . . . 11.7%
No . . . . . . . . . . . . . . . . . . . . . . . . . . . . . . . . . . . . . . . . . . . . . . . . . . . . . . . . . . . . . . . . . . . . . . . . . . . . . . . . . . . . . . . . . . . 88.2%
Refused . . . . . . . . . . . . . . . . . . . . . . . . . . . . . . . . . . . . . . . . . . . . . . . . . . . . . . . . . . . . . . . . . . . . . . . . . . . . . . . . . . . . . . . . . 0.2%
Q41 How many more years do you plan to work for your current employer? (Your best guess is fine.)
Less than one year . . . . . . . . . . . . . . . . . . . . . . . . . . . . . . . . . . . . . . . . . . . . . . . . . . . . . . . . . . . . . . . . . . . . . . . . . . . . . . . . 5.8%
One year or longer (NET) . . . . . . . . . . . . . . . . . . . . . . . . . . . . . . . . . . . . . . . . . . . . . . . . . . . . . . . . . . . . . . . . . . . . . . . . . . . 54.2%
1–2 years* . . . . . . . . . . . . . . . . . . . . . . . . . . . . . . . . . . . . . . . . . . . . . . . . . . . . . . . . . . . . . . . . . . . . . . . . . . . . . . . . . . . 7.3%
3–4 years* . . . . . . . . . . . . . . . . . . . . . . . . . . . . . . . . . . . . . . . . . . . . . . . . . . . . . . . . . . . . . . . . . . . . . . . . . . . . . . . . . . . 6.6%
5–6 years* . . . . . . . . . . . . . . . . . . . . . . . . . . . . . . . . . . . . . . . . . . . . . . . . . . . . . . . . . . . . . . . . . . . . . . . . . . . . . . . . . . 11.2%
7–8 years* . . . . . . . . . . . . . . . . . . . . . . . . . . . . . . . . . . . . . . . . . . . . . . . . . . . . . . . . . . . . . . . . . . . . . . . . . . . . . . . . . . . 7.3%
9–10 years* . . . . . . . . . . . . . . . . . . . . . . . . . . . . . . . . . . . . . . . . . . . . . . . . . . . . . . . . . . . . . . . . . . . . . . . . . . . . . . . . . . 8.4%
11+ years* . . . . . . . . . . . . . . . . . . . . . . . . . . . . . . . . . . . . . . . . . . . . . . . . . . . . . . . . . . . . . . . . . . . . . . . . . . . . . . . . . . 13.3%
Refused . . . . . . . . . . . . . . . . . . . . . . . . . . . . . . . . . . . . . . . . . . . . . . . . . . . . . . . . . . . . . . . . . . . . . . . . . . . . . . . . . . . . . 0.2%
Not sure. . . . . . . . . . . . . . . . . . . . . . . . . . . . . . . . . . . . . . . . . . . . . . . . . . . . . . . . . . . . . . . . . . . . . . . . . . . . . . . . . . . . . . . . 39.9%
Refused . . . . . . . . . . . . . . . . . . . . . . . . . . . . . . . . . . . . . . . . . . . . . . . . . . . . . . . . . . . . . . . . . . . . . . . . . . . . . . . . . . . . . . . . . 0.1%
*Responses marked with an asterisk were written in by respondents who indicated that they plan to work one more year or longer with their current employer.
Q42 How many more years do you plan to work in general before you retire and stop working
completely? (Your best guess is fine.)
Less than one year . . . . . . . . . . . . . . . . . . . . . . . . . . . . . . . . . . . . . . . . . . . . . . . . . . . . . . . . . . . . . . . . . . . . . . . . . . . . . . . . 3.3%
One year or longer (NET) . . . . . . . . . . . . . . . . . . . . . . . . . . . . . . . . . . . . . . . . . . . . . . . . . . . . . . . . . . . . . . . . . . . . . . . . . . . 57.7%
1-2 years* . . . . . . . . . . . . . . . . . . . . . . . . . . . . . . . . . . . . . . . . . . . . . . . . . . . . . . . . . . . . . . . . . . . . . . . . . . . . . . . . . . . . . 4,2%
3-4 years* . . . . . . . . . . . . . . . . . . . . . . . . . . . . . . . . . . . . . . . . . . . . . . . . . . . . . . . . . . . . . . . . . . . . . . . . . . . . . . . . . . . . . 5.1%
5-6 years* . . . . . . . . . . . . . . . . . . . . . . . . . . . . . . . . . . . . . . . . . . . . . . . . . . . . . . . . . . . . . . . . . . . . . . . . . . . . . . . . . . . . . 9.8%
7-8 years* . . . . . . . . . . . . . . . . . . . . . . . . . . . . . . . . . . . . . . . . . . . . . . . . . . . . . . . . . . . . . . . . . . . . . . . . . . . . . . . . . . . . . 7.8%
9-10 years* . . . . . . . . . . . . . . . . . . . . . . . . . . . . . . . . . . . . . . . . . . . . . . . . . . . . . . . . . . . . . . . . . . . . . . . . . . . . . . . . . . . 10.5%
11+ years* . . . . . . . . . . . . . . . . . . . . . . . . . . . . . . . . . . . . . . . . . . . . . . . . . . . . . . . . . . . . . . . . . . . . . . . . . . . . . . . . . . . . 20.1%
Refused . . . . . . . . . . . . . . . . . . . . . . . . . . . . . . . . . . . . . . . . . . . . . . . . . . . . . . . . . . . . . . . . . . . . . . . . . . . . . . . . . . . . . . . 0.1%
Not sure. . . . . . . . . . . . . . . . . . . . . . . . . . . . . . . . . . . . . . . . . . . . . . . . . . . . . . . . . . . . . . . . . . . . . . . . . . . . . . . . . . . . . . . . 38.9%
Refused . . . . . . . . . . . . . . . . . . . . . . . . . . . . . . . . . . . . . . . . . . . . . . . . . . . . . . . . . . . . . . . . . . . . . . . . . . . . . . . . . . . . . . . . . 0.1%
*Responses marked with an asterisk were written in by respondents who indicated that they plan to work one more year or longer before they retire and stop
working completely.
Prompt if “One year or longer” selected and no number entered.

A REPORT FOR AARP PREPARED BY TOWERS PERRIN 47
Q43 Which of the following, if any, do you plan to do during your retirement?
Not work at all . . . . . . . . . . . . . . . . . . . . . . . . . . . . . . . . . . . . . . . . . . . . . . . . . . . . . . . . . . . . . . . . . . . . . . . . . . . . . . . . . . . 11.1%
Work part time . . . . . . . . . . . . . . . . . . . . . . . . . . . . . . . . . . . . . . . . . . . . . . . . . . . . . . . . . . . . . . . . . . . . . . . . . . . . . . . . . . 27.4%
Retire from current job or career but work full time doing something else . . . . . . . . . . . . . . . . . . . . . . . . . . . . . . . . . . . . . . 3.2%
Start your own business or go into business for yourself. . . . . . . . . . . . . . . . . . . . . . . . . . . . . . . . . . . . . . . . . . . . . . . . . . . . 6.8%
Volunteer, but not work for pay. . . . . . . . . . . . . . . . . . . . . . . . . . . . . . . . . . . . . . . . . . . . . . . . . . . . . . . . . . . . . . . . . . . . . . . . 9.1%
Something else . . . . . . . . . . . . . . . . . . . . . . . . . . . . . . . . . . . . . . . . . . . . . . . . . . . . . . . . . . . . . . . . . . . . . . . . . . . . . . . . . . . 5.9%
Do not know yet . . . . . . . . . . . . . . . . . . . . . . . . . . . . . . . . . . . . . . . . . . . . . . . . . . . . . . . . . . . . . . . . . . . . . . . . . . . . . . . . . 36.2%
Refused . . . . . . . . . . . . . . . . . . . . . . . . . . . . . . . . . . . . . . . . . . . . . . . . . . . . . . . . . . . . . . . . . . . . . . . . . . . . . . . . . . . . . . . . . 0.2%
Q44 What is your current marital status?
Married . . . . . . . . . . . . . . . . . . . . . . . . . . . . . . . . . . . . . . . . . . . . . . . . . . . . . . . . . . . . . . . . . . . . . . . . . . . . . . . . . . . . . . . . 58.3%
Living with a partner, but not married . . . . . . . . . . . . . . . . . . . . . . . . . . . . . . . . . . . . . . . . . . . . . . . . . . . . . . . . . . . . . . . . . . 4.4%
Divorced . . . . . . . . . . . . . . . . . . . . . . . . . . . . . . . . . . . . . . . . . . . . . . . . . . . . . . . . . . . . . . . . . . . . . . . . . . . . . . . . . . . . . . . 18.9%
Separated . . . . . . . . . . . . . . . . . . . . . . . . . . . . . . . . . . . . . . . . . . . . . . . . . . . . . . . . . . . . . . . . . . . . . . . . . . . . . . . . . . . . . . . 2.8%
Widowed . . . . . . . . . . . . . . . . . . . . . . . . . . . . . . . . . . . . . . . . . . . . . . . . . . . . . . . . . . . . . . . . . . . . . . . . . . . . . . . . . . . . . . . . 5.4%
Single, never married . . . . . . . . . . . . . . . . . . . . . . . . . . . . . . . . . . . . . . . . . . . . . . . . . . . . . . . . . . . . . . . . . . . . . . . . . . . . . . . 9.6%
Refused . . . . . . . . . . . . . . . . . . . . . . . . . . . . . . . . . . . . . . . . . . . . . . . . . . . . . . . . . . . . . . . . . . . . . . . . . . . . . . . . . . . . . . . . . 0.6%
Q45 What is the highest level of education that you completed?
Grades 1–8 . . . . . . . . . . . . . . . . . . . . . . . . . . . . . . . . . . . . . . . . . . . . . . . . . . . . . . . . . . . . . . . . . . . . . . . . . . . . . . . . . . . . . . 0.4%
Some high school, grades 9–11. . . . . . . . . . . . . . . . . . . . . . . . . . . . . . . . . . . . . . . . . . . . . . . . . . . . . . . . . . . . . . . . . . . . . . . 7.0%
High school graduate. . . . . . . . . . . . . . . . . . . . . . . . . . . . . . . . . . . . . . . . . . . . . . . . . . . . . . . . . . . . . . . . . . . . . . . . . . . . . . 29.0%
Vocational or trade school . . . . . . . . . . . . . . . . . . . . . . . . . . . . . . . . . . . . . . . . . . . . . . . . . . . . . . . . . . . . . . . . . . . . . . . . . . . 9.2%
Associate degree, some college. . . . . . . . . . . . . . . . . . . . . . . . . . . . . . . . . . . . . . . . . . . . . . . . . . . . . . . . . . . . . . . . . . . . . . 17.6%
4-year college graduate . . . . . . . . . . . . . . . . . . . . . . . . . . . . . . . . . . . . . . . . . . . . . . . . . . . . . . . . . . . . . . . . . . . . . . . . . . . . 13.6%
Some postgraduate work, but no degree. . . . . . . . . . . . . . . . . . . . . . . . . . . . . . . . . . . . . . . . . . . . . . . . . . . . . . . . . . . . . . . . 7.4%
Postgraduate degree . . . . . . . . . . . . . . . . . . . . . . . . . . . . . . . . . . . . . . . . . . . . . . . . . . . . . . . . . . . . . . . . . . . . . . . . . . . . . . 15.4%
Refused . . . . . . . . . . . . . . . . . . . . . . . . . . . . . . . . . . . . . . . . . . . . . . . . . . . . . . . . . . . . . . . . . . . . . . . . . . . . . . . . . . . . . . . . . 0.5%
Q46–Q47 Not asked
Q48 How would you describe your current health?
Excellent. . . . . . . . . . . . . . . . . . . . . . . . . . . . . . . . . . . . . . . . . . . . . . . . . . . . . . . . . . . . . . . . . . . . . . . . . . . . . . . . . . . . . . . . 17.6%
Very good. . . . . . . . . . . . . . . . . . . . . . . . . . . . . . . . . . . . . . . . . . . . . . . . . . . . . . . . . . . . . . . . . . . . . . . . . . . . . . . . . . . . . . . 41.2%
Good . . . . . . . . . . . . . . . . . . . . . . . . . . . . . . . . . . . . . . . . . . . . . . . . . . . . . . . . . . . . . . . . . . . . . . . . . . . . . . . . . . . . . . . . . . 32.4%
Fair. . . . . . . . . . . . . . . . . . . . . . . . . . . . . . . . . . . . . . . . . . . . . . . . . . . . . . . . . . . . . . . . . . . . . . . . . . . . . . . . . . . . . . . . . . . . . 7.6%
Poor . . . . . . . . . . . . . . . . . . . . . . . . . . . . . . . . . . . . . . . . . . . . . . . . . . . . . . . . . . . . . . . . . . . . . . . . . . . . . . . . . . . . . . . . . . . . 1.2%
Refused . . . . . . . . . . . . . . . . . . . . . . . . . . . . . . . . . . . . . . . . . . . . . . . . . . . . . . . . . . . . . . . . . . . . . . . . . . . . . . . . . . . . . . . . . 0.1%

48 INVESTING IN TRAINING 50+ WORKERS: A TALENT MANAGEMENT STRATEGY
Q49 Not asked
Q50 Which of the following categories best describes YOUR current annual income, before taxes,
including wages or salary, Social Security, pensions, and interest or dividends on savings and
investments?
Less than $15,000. . . . . . . . . . . . . . . . . . . . . . . . . . . . . . . . . . . . . . . . . . . . . . . . . . . . . . . . . . . . . . . . . . . . . . . . . . . . . . . . . 5.9%
$15,000 up to $25,000 . . . . . . . . . . . . . . . . . . . . . . . . . . . . . . . . . . . . . . . . . . . . . . . . . . . . . . . . . . . . . . . . . . . . . . . . . . . . 13.8%
$25,000 up to $50,000 . . . . . . . . . . . . . . . . . . . . . . . . . . . . . . . . . . . . . . . . . . . . . . . . . . . . . . . . . . . . . . . . . . . . . . . . . . . . 39.1%
$50,000 up to $75,000 . . . . . . . . . . . . . . . . . . . . . . . . . . . . . . . . . . . . . . . . . . . . . . . . . . . . . . . . . . . . . . . . . . . . . . . . . . . . 21.4%
$75,000 up to $100,000. . . . . . . . . . . . . . . . . . . . . . . . . . . . . . . . . . . . . . . . . . . . . . . . . . . . . . . . . . . . . . . . . . . . . . . . . . . . 8.9%
$100,000 up to $150,000 . . . . . . . . . . . . . . . . . . . . . . . . . . . . . . . . . . . . . . . . . . . . . . . . . . . . . . . . . . . . . . . . . . . . . . . . . . . 5.2%
$150,000 or more . . . . . . . . . . . . . . . . . . . . . . . . . . . . . . . . . . . . . . . . . . . . . . . . . . . . . . . . . . . . . . . . . . . . . . . . . . . . . . . . . 1.3%
Refused . . . . . . . . . . . . . . . . . . . . . . . . . . . . . . . . . . . . . . . . . . . . . . . . . . . . . . . . . . . . . . . . . . . . . . . . . . . . . . . . . . . . . . . . . 4.4%
Q51 Are you currently a member of AARP?
Yes . . . . . . . . . . . . . . . . . . . . . . . . . . . . . . . . . . . . . . . . . . . . . . . . . . . . . . . . . . . . . . . . . . . . . . . . . . . . . . . . . . . . . . . . . . . . 37.7%
No . . . . . . . . . . . . . . . . . . . . . . . . . . . . . . . . . . . . . . . . . . . . . . . . . . . . . . . . . . . . . . . . . . . . . . . . . . . . . . . . . . . . . . . . . . . . 62.3%
Refused . . . . . . . . . . . . . . . . . . . . . . . . . . . . . . . . . . . . . . . . . . . . . . . . . . . . . . . . . . . . . . . . . . . . . . . . . . . . . . . . . . . . . . . . . 0.0%

A REPORT FOR AARP PREPARED BY TOWERS PERRIN 49
APPENDIX D50+ Worker Survey: Detailed Data Tables for Selected Questions
Q14. “To what extent are you personally interested in the following types of work-related education and training opportunities?” Source: December 2006 AARP survey of individuals age 50+ employed in companies with 10 or more employees.Notes. n=Unweighted total number of respondents in a given category.Uppercase letters indicate significant differences at the 95% confidence level, while lowercase letters indicate significant differences at the 90% confidence level.
TABLE 1: 50+ WORKERS’ INTEREST IN VARIOUS TYPES OF WORK-RELATED TRAINING
PERCENTAGE VERY/SOMEWHAT INTERESTED
Age Education Annual Household Income
SurveyTotal 50–54 55–59 60–64 65+
HighSchool
Degree orLess
SomeCollege
4-YearCollegeDegreeor More
Lessthan
$25,000
$25,000to
$49,999
$50,000to
$74,999
$75,000and
Above
n=1,048 n=393 n=383 n=183 n=89 n=374 n=304 n=365 n=135 n=347 n=255 n=311
(A) (B) (C) (D) (E) (F) (G) (H) (I) (J) (K) (L)
Training that would allow you tokeep your skills and knowledgeup-to-date
90% 92%(D,E)
93%(D,E)
85% 76% 83% 93%(F)
94%(F)
85% 88% 89% 94%(I,J,K)
Training that would allow you tolearn new skills and knowledgenecessary to advance your career
83% 90%(D,E)
88%(D,E)
72%(E)
57% 75% 87%(F)
88%(F)
81% 81% 85% 85%
Training that would allow you tolearn new skills and knowledgenecessary to get an entirely differenttype of job
57% 63%(D,E)
60%(d,E)
51%(e)
38% 52% 63%(F)
59% 68%(K,L)
60% 53% 53%
Q14. “To what extent are you personally interested in the following types of work-related education and training opportunities?” Source: December 2006 AARP survey of individuals age 50+ employed in companies with 10 or more employees.Notes: n=Unweighted total number of respondents in a given category.Uppercase letters indicate significant differences at the 95% confidence level, while lowercase letters indicate significant differences at the 90% confidence level.
TABLE 1: 50+ WORKERS’ INTEREST IN VARIOUS TYPES OF WORK-RELATED TRAINING (continued)
PERCENTAGE VERY/SOMEWHAT INTERESTED
Sector Number of Employees
SurveyTotal
Schools–Public and
Private Government Nonprofit
For-ProfitCompany(including
SmallFamily-RunBusiness) 10–49 50–499
500–9,999 10,000+
n=1,048 n=170 n=138 n=92 n=582 n=147 n=297 n=305 n=209
(A) (M) (N) (O) (P) (Q) (R) (S) (T)
Training that would allow you to keep your skills andknowledge up to date
90% 94%(p)
93% 93% 87% 81% 92%(Q)
90%(Q)
95%(Q)
Training that would allow you to learn new skills andknowledge necessary to advance your career
83% 87% 86% 84% 81% 77% 81% 87%(Q,r)
88%(Q)
Training that would allow you to learn new skills andknowledge necessary to get an entirely different typeof job
57% 58% 64% 56% 56% 46% 56% 61%(Q)
66%(Q,r)

50 INVESTING IN TRAINING 50+ WORKERS: A TALENT MANAGEMENT STRATEGY
TABLE 2: RANGE OF DESIRED TRAINING TOPICS
SurveyTotal 50–54 55–59 60–64 65+
HighSchoolDegreeor Less
SomeCollege
4-YearCollege
Degree orMore
Lessthan
$25,000
$25,000to
$49,999
$50,000to
$74,999
$75,000and
Above
n=1,048 n=393 n=383 n=183 n=89 n=374 n=304 n=365 n=135 n=347 n=255 n=311
(A) (B) (C) (D) (E) (F) (G) (H) (I) (J) (K) (L)
Computer skills training/information and communicationtechnology training
79% 84%(D,E)
80%(E)
74%(e)
61% 70% 81%(F)
85%(F)
76% 79% 76% 81%
Specific technical orprofessional skills training
72% 79%(D,E)
74%(E)
66%(E)
45% 64% 76%(F)
79%(F)
68% 67% 72% 80%(I,J,K)
Formal courses that lead tocertification or degrees applicableto your job
59% 68%(c,D,E)
61%(D,E)
48%(e)
34% 54% 67%(F,h)
58% 63% 58% 56% 60%
Supervisory or management skillstraining
58% 66%(D,E)
61%(D,E)
47%(E)
30% 48% 63%(F)
64%(F)
58% 55% 54% 64%(j,K)
Occupational safety training 53% 56%(c)
48% 55% 46% 59%(H)
56%(H)
44% 57% 58%(k,L)
48% 47%
Communication skills training(e.g., presentation or writing skills)
53% 56%(E)
57%(E)
52%(E)
32% 46% 58%(F)
58%(F)
53% 49% 55% 58%(j)
Career development counseling(training on how to develop ormanage your career)
51% 59%(c,D,E)
51%(E)
42%(e)
29% 45% 56% 52% 55% 51% 47% 51%
Project management skillstraining
50% 57%(D,E)
52%(D,E)
40% 32% 42% 52%(F)
57%(F)
47% 48% 45% 58%(i,J,K)
Negotiation skills training 50% 53%(c,E)
48%(e)
46% 34% 43% 51%(f)
56%(F)
49% 49% 47% 53%
Required professional training(e.g., continuing legal or accountingcredits)
44% 51%(D,E)
46%(D,E)
33% 30% 33% 49%(F)
51%(F)
44% 40% 40% 53%(J,K)
Foreign language training 43% 47% (E) 44% (E) 39% 30% 32% 40% (f) 56% (F,G) 43% 40% 42% 48%
Awareness training on workplacediversity (other than age) concerningpolicies and practices related toworkplace diversity or discriminationfor reasons other than age (race/ethnicity, gender, disability, etc.)
42% 44%(E)
42%(E)
42%(E)
27% 40% 43% 42% 50%(K)
44%(k)
35% 41%
New employee orientation training(that introduces new employees topersonnel and workplace practicesand to overall company policies)
41% 43%(e)
41% 41% 30 43% 38% 40% 44% 43% 35% 41%
Awareness training on agediversity— concerning policies andpractices related to age diversity inthe workplace or age discrimination
41% 41%(E)
42%(E)
45%(E)
27% 41% 41% 41% 50%(K)
41% 35% 41%
Basic skills training (e.g., basicmath, or basic writing or readingskills)
24% 24% 24% 28% 17% 32%(g,H)
25%(H)
16% 34%(K,L)
27%(L)
22% 18%
English as a Second Language(ESL classes)
17% 19% 14% 16% 13% 18% 15% 17% 23%(K)
19%(K)
10% 16%
Other 9% 12% (D) 10% (D) 4% 5% 9% 10% 9% 9% 9% 9% 11%
PERCENTAGE VERY/SOMEWHAT INTERESTED
Age Education Annual Household Income
Q16. “Assuming that your employer would offer all of these work-related education and training opportunities, please tell us the extent to which you would be interested inparticipating in each one.”Source: December 2006 AARP survey of individuals age 50+ employed in companies with 10 or more employees:Notes: n=Unweighted total number of respondents in a given category.Uppercase letters indicate significant differences at the 95% confidence level, while lowercase letters indicate significant differences at the 90% confidence level.

A REPORT FOR AARP PREPARED BY TOWERS PERRIN 51
TABLE 2: RANGE OF DESIRED TRAINING TOPICS (Continued)
PERCENTAGE VERY/SOMEWHAT INTERESTED
Sector Number of Employees
Q16. “Assuming that your employer would offer all of these work-related education and training opportunities, please tell us the extent to which you would be interested inparticipating in each one.”Source: December 2006 AARP survey of individuals age 50+ employed in companies with 10 or more employees:Notes: n=Unweighted total number of respondents in a given category.Uppercase letters indicate significant differences at the 95% confidence level, while lowercase letters indicate significant differences at the 90% confidence level.
SurveyTotal
Schools–Public and
Private Government Nonprofit
For-ProfitCompany(including
SmallFamily-RunBusiness) 10–49 50–499
500–9,999 10,000+
n=1,048 n=170 n=138 n=92 n=582 n=147 n=297 n=305 n=209
(A) (M) (N) (O) (P) (Q) (R) (S) (T)
Computer skills training/information andcommunication technology training
79% 86%(P)
83% 85% 75% 74% 79% 83%(q)
83%(q)
Specific technical orprofessional skills training
72% 73% 80% (p) 80% 70% 68% 75% 72% 78% (q)
Formal courses that lead to certification or degreesapplicable to your job
59% 66%(P)
64% 66% 55% 55% 58% 59% 66%(q)
Supervisory or management skills training 58% 57% 67% (P) 66% 55% 54% 60% 58% 64%
Occupational safety training 53% 50% 59% (p) 56% 50% 46% 53% 51% 57% (q)
Communication skills training(e.g., presentation or writing skills)
53% 54% 62%(P)
68%(m,P)
50% 43% 51% 59%(Q)
59%(Q)
Career development counseling (training on howto develop or manage your career)
51% 48% 55% 62%(m,p)
49% 39% 48% 54%(Q)
59%(Q,r)
Project management skillstraining
50% 44% 64% (M,P) 57% 49% 40% 49% 56%(Q)
56%(Q)
Negotiation skills training 50% 49% 56% 63%(m,P)
47% 39% 51%(q)
50%(Q)
58%(Q)
Required professional training(e.g., continuing legal or accounting credits)
44% 57%(P)
52%(P)
57%(P)
37% 39% 45% 50%(q,t)
40%
Foreign language training 43% 52%(P)
42% 61%(N,P)
40% 31% 44%(Q)
47%(Q)
52%(Q)
Awareness training on workplace diversity (otherthan age) concerning policies and practices relatedto workplace diversity or discrimination for reasonsother than age (race/ethnicity, gender, disability, etc.)
42% 42% 47% 56%(m,P)
38% 32% 38% 48%(Q,r)
46%(Q)
New employee orientation training (that introducesnew employees to personnel and workplace prac-tices and to overall company policies)
41% 47%(p)
41% 52%(P)
37% 31% 45%(Q)
39% 44%(q)
Awareness training on agediversity— concerning policies and practicesrelated to age diversity in the workplace or agediscrimination
41% 41% 45% 51%(P)
38% 31% 38% 47%(Q,r)
45%(Q)
Basic skills training (e.g., basic math, or basic writ-ing or reading skills)
24% 28% 22% 31% 21% 23% 22% 22% 31%(r,s)
English as a Second Language(ESL classes)
17% 30%(N,P)
13% 22%(p)
14% 12% 18% 16% 20%
Other 9% 9% 12% 14% 9% 4% 9% 10% (q) 12% (Q)

52 INVESTING IN TRAINING 50+ WORKERS: A TALENT MANAGEMENT STRATEGY
Q21. “How often would you like to have the opportunity to participate in work-related education or training?”Source: December 2006 AARP survey of individuals age 50+ employed in companies with 10 or more employees.Notes: n=Unweighted total number of respondents in a given category. Uppercase letters indicate significant differences at the 95% confidence level, while lowercase letters indicate significant differences at the 90% confidence level.
TABLE 3: DESIRED FREQUENCY OF TRAINING
PERCENTAGE SELECTING EACH ITEM
Age Education Annual Household Income
SurveyTotal 50–54 55–59 60–64 65+
HighSchool
Degree orLess
SomeCollege
4-YearCollege
Degree orMore
Less than$25,000
$25,000to
$49,999
$50,000to
$74,999
$75,000and
Above
n=1,048 n=393 n=383 n=183 n=89 n=374 n=304 n=365 n=135 n=347 n=255 n=311
(A) (B) (C) (D) (E) (F) (G) (H) (I) (J) (K) (L)
Weekly or more often 7% 10% (d) 6% 5% 6% 10% (h) 7% 5% 9% 8% 7% 6%
Every other week 5% 5% 4% 6% 6% 7%(h)
4% 3% 9%(L)
6% 4% 2%
Monthly 16% 14% 19% 16% 14% 14% 15% 18% 14% 15% 16% 18%
Quarterly(4 times a year)
27% 31% 27% 23% 23% 20% 30%(F)
33%(F)
24% 22% 27% 36%(I,J,K)
Less Often(1–3 times a year)
20% 21%(E)
24%(E)
19%(E)
7% 15% 20% 26%(F)
11% 17% 24%(I)
26%(I,J)
Never 6% 4% 3% 6% 21%(B,C,D)
10%(G,H)
3% 3% 8%(L)
7%(L)
6%(L)
2%
Not sure/it depends 19% 16% 18% 25%(B,c)
21% 24%(H)
20%(H)
12% 24%(L)
25%(k,L)
17%(L)
10%
Refused 0% 0% 0% 0% 1% 0% 0% 0% 1% 0% 0% 1%

A REPORT FOR AARP PREPARED BY TOWERS PERRIN 53
TABLE 3: DESIRED FREQUENCY OF TRAINING (Continued)
PERCENTAGE SELECTING EACH ITEM
Sector Number of Employees
Q21. “How often would you like to have the opportunity to participate in work-related education or training?”Source: December 2006 AARP survey of individuals age 50+ employed in companies with 10 or more employees.Notes: n=Unweighted total number of respondents in a given category. Uppercase letters indicate significant differences at the 95% confidence level, while lowercase letters indicate significant differences at the 90% confidence level.
SurveyTotal
Schools–Public and
Private Government Nonprofit
For-ProfitCompany
(including SmallFamily-RunBusiness) 10–49 50–499
500–9,999 10,000+
n=1,048 n=170 n=138 n=92 n=582 n=147 n=297 n=305 n=209
(A) (M) (N) (O) (P) (Q) (R) (S) (T)
Weekly or more often 7% 4% 8% 7% 8% 6% 9% 8% 5%
Every other week 5% 3% 7% (o) 1% 6% 5% 4% 4% 7%
Monthly 16% 19% 14% 24% (p) 14% 10% 16% 20% (Q) 16%
Quarterly(4 times a year)
27% 32% 30% 32% 26% 25% 28% 27% 33%
Less Often(1–3 times a year)
20% 22% 23% 18% 19% 17% 20% 23% 21%
Never 6% 2% 4% 8% (m) 6% (m) 13% (R,S,T) 5% (t) 3% 2%
Not sure/it depends 19% 17% 14% 11% 21% (o) 24% (s) 17% 15% 18%
Refused 0% 0% 0% 0% 0% 0% 0% 0% 0%

54 INVESTING IN TRAINING 50+ WORKERS: A TALENT MANAGEMENT STRATEGY
TABLES 4a + 4b: OVERALL PARTICIPATION IN TRAINING
PERCENTAGE RESPONDING YES
Age Education Annual Household Income
PERCENTAGE RESPONDING YES
Age Education Annual Household Income
Q17. “Have you ever received work-related education or participated in work-related training?” Q22. “In the past two years, have you participated in any work-related education or training opportunities?”
Q23. “Do you feel you have participated in a sufficient number of work-related education and training opportunities within the past two years to meet your job requirementsand professional development needs?” Notes: n=Unweighted total number of respondents in a given category who have participated in work-related training within the past two years.Uppercase letters indicate significant differences at the 95% confidence level, while lowercase letters indicate significant differences at the 90% confidence level.
SurveyTotal 50–54 55–59 60–64 65+
HighSchool
Degree orLess
SomeCollege
4-YearCollege
Degree orMore
Less than$25,000
$25,000to
$49,999
$50,000to
$74,999
$75,000and
Above
n=1,048 n=393 n=383 n=183 n=89 n=374 n=304 n=365 n=135 n=347 n=255 n=311
(A) (B) (C) (D) (E) (F) (G) (H) (I) (J) (K) (L)
Ever received work-related education orparticipated in work-related training
84% 84%(E)
88%(E)
87%(E)
67% 74% 85%(F)
95%(F,G)
80% 79% 86%(j)
92%(I,J,k)
Participated in anywork-relatededucation or trainingin the past two years
66% 68%(E)
71%(E)
67%(E)
46% 50% 64%(F)
85%(F,G)
60% 56% 67%(J)
83%(I,J,K)
SurveyTotal 50–54 55–59 60–64 65+
HighSchool
Degree orLess
SomeCollege
4-YearCollege
Degree orMore
Lessthan
$25,000
$25,000to
$49,999
$50,000to
$74,999
$75,000and
Above
n=692 n=267 n=261 n=118 n=46 n=190 n=190 n=309 n=79 n=187 n=170 n=256
(A) (B) (C) (D) (E) (F) (G) (H) (I) (J) (K) (L)
Feels that participated in asufficient number of work-related education and trainingopportunities within the pasttwo years to meet jobrequirements and professionaldevelopment needs (n= 692;those who participated intraining in the past two years)
75% 76% 70% 79% 86%(c)
75% 72% 77% 76% 74% 77% 75%
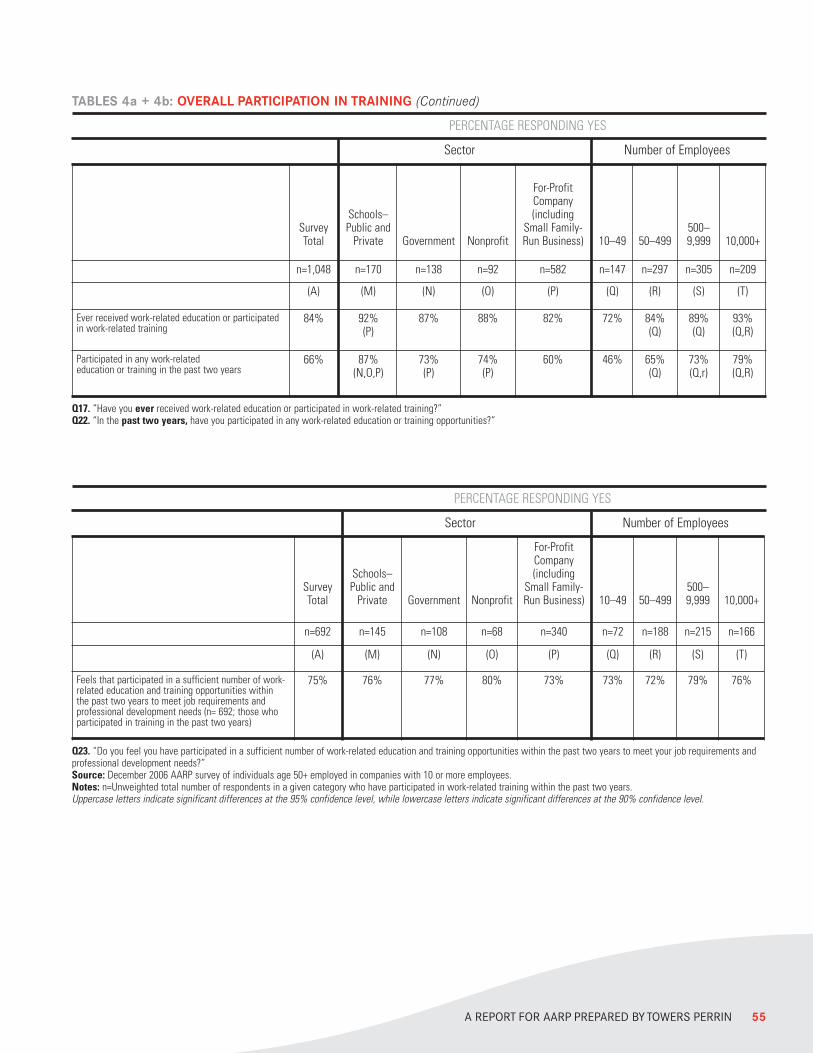
A REPORT FOR AARP PREPARED BY TOWERS PERRIN 55
TABLES 4a + 4b: OVERALL PARTICIPATION IN TRAINING (Continued)
PERCENTAGE RESPONDING YES
Sector Number of Employees
PERCENTAGE RESPONDING YES
Sector Number of Employees
Q17. “Have you ever received work-related education or participated in work-related training?” Q22. “In the past two years, have you participated in any work-related education or training opportunities?”
SurveyTotal
Schools–Public and
Private Government Nonprofit
For-ProfitCompany(including
Small Family-Run Business) 10–49 50–499
500–9,999 10,000+
n=1,048 n=170 n=138 n=92 n=582 n=147 n=297 n=305 n=209
(A) (M) (N) (O) (P) (Q) (R) (S) (T)
Ever received work-related education or participatedin work-related training
84% 92%(P)
87% 88% 82% 72% 84%(Q)
89%(Q)
93%(Q,R)
Participated in any work-relatededucation or training in the past two years
66% 87%(N,O,P)
73%(P)
74%(P)
60% 46% 65%(Q)
73%(Q,r)
79%(Q,R)
Q23. “Do you feel you have participated in a sufficient number of work-related education and training opportunities within the past two years to meet your job requirements andprofessional development needs?” Source: December 2006 AARP survey of individuals age 50+ employed in companies with 10 or more employees.Notes: n=Unweighted total number of respondents in a given category who have participated in work-related training within the past two years.Uppercase letters indicate significant differences at the 95% confidence level, while lowercase letters indicate significant differences at the 90% confidence level.
SurveyTotal
Schools–Public and
Private Government Nonprofit
For-ProfitCompany(including
Small Family-Run Business) 10–49 50–499
500–9,999 10,000+
n=692 n=145 n=108 n=68 n=340 n=72 n=188 n=215 n=166
(A) (M) (N) (O) (P) (Q) (R) (S) (T)
Feels that participated in a sufficient number of work-related education and training opportunities withinthe past two years to meet job requirements andprofessional development needs (n= 692; those whoparticipated in training in the past two years)
75% 76% 77% 80% 73% 73% 72% 79% 76%
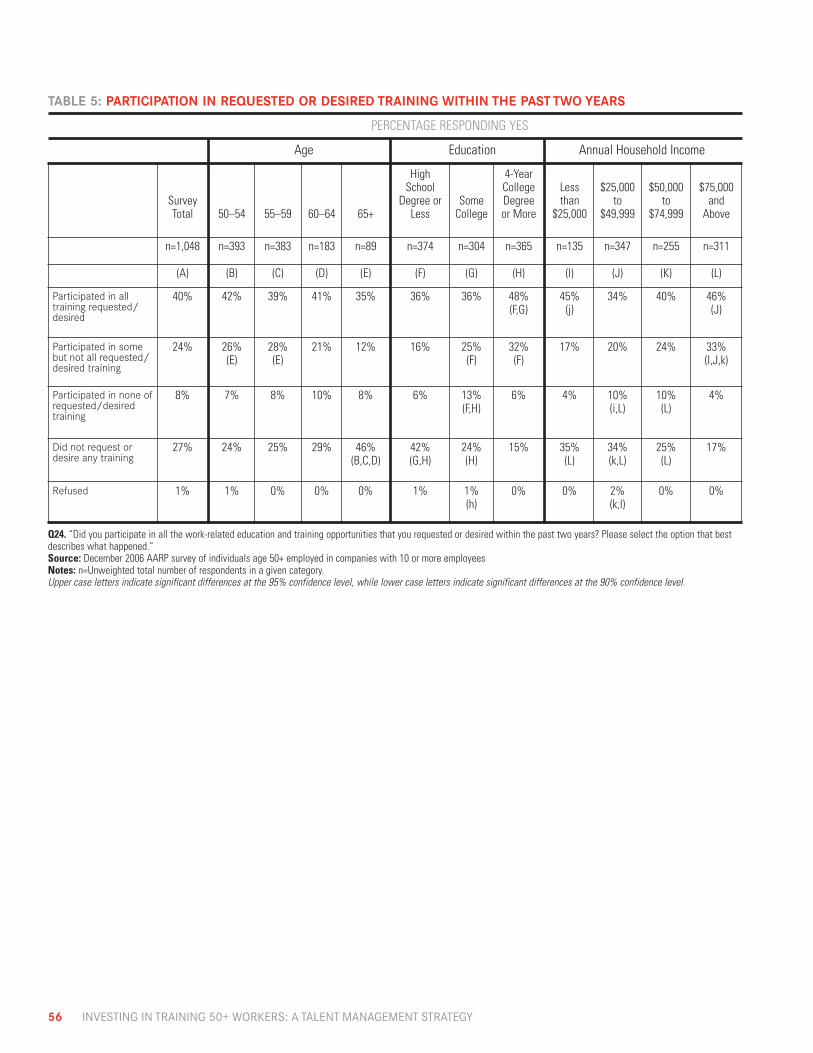
56 INVESTING IN TRAINING 50+ WORKERS: A TALENT MANAGEMENT STRATEGY
TABLE 5: PARTICIPATION IN REQUESTED OR DESIRED TRAINING WITHIN THE PAST TWO YEARS
PERCENTAGE RESPONDING YES
Age Education Annual Household Income
Q24. “Did you participate in all the work-related education and training opportunities that you requested or desired within the past two years? Please select the option that bestdescribes what happened.”Source: December 2006 AARP survey of individuals age 50+ employed in companies with 10 or more employeesNotes: n=Unweighted total number of respondents in a given category. Upper case letters indicate significant differences at the 95% confidence level, while lower case letters indicate significant differences at the 90% confidence level.
SurveyTotal 50–54 55–59 60–64 65+
HighSchool
Degree orLess
SomeCollege
4-YearCollegeDegreeor More
Lessthan
$25,000
$25,000to
$49,999
$50,000to
$74,999
$75,000and
Above
n=1,048 n=393 n=383 n=183 n=89 n=374 n=304 n=365 n=135 n=347 n=255 n=311
(A) (B) (C) (D) (E) (F) (G) (H) (I) (J) (K) (L)
Participated in alltraining requested/desired
40% 42% 39% 41% 35% 36% 36% 48%(F,G)
45%(j)
34% 40% 46%(J)
Participated in somebut not all requested/desired training
24% 26%(E)
28%(E)
21% 12% 16% 25%(F)
32%(F)
17% 20% 24% 33%(I,J,k)
Participated in none ofrequested/desiredtraining
8% 7% 8% 10% 8% 6% 13%(F,H)
6% 4% 10%(i,L)
10%(L)
4%
Did not request ordesire any training
27% 24% 25% 29% 46%(B,C,D)
42%(G,H)
24%(H)
15% 35%(L)
34%(k,L)
25%(L)
17%
Refused 1% 1% 0% 0% 0% 1% 1%(h)
0% 0% 2%(k,l)
0% 0%

A REPORT FOR AARP PREPARED BY TOWERS PERRIN 57
TABLE 5: PARTICIPATION IN REQUESTED OR DESIRED TRAINING WITHIN THE PAST TWO YEARS (Continued)
PERCENTAGE RESPONDING YES
Sector Number of Employees
Q24. “Did you participate in all the work-related education and training opportunities that you requested or desired within the past two years? Please select the option that bestdescribes what happened.”Source: December 2006 AARP survey of individuals age 50+ employed in companies with 10 or more employees.Notes: n=Unweighted total number of respondents in a given category. Uppercase letters indicate significant differences at the 95% confidence level, while lowercase letters indicate significant differences at the 90% confidence level.
SurveyTotal
Schools–Public and
Private Government Nonprofit
For-ProfitCompany(including
Small Family-Run Business) 10–49 50–499
500–9,999 10,000+
n=1,048 n=170 n=138 n=92 n=582 n=147 n=297 n=305 n=209
(A) (M) (N) (O) (P) (Q) (R) (S) (T)
Participated in all training requested/desired
40% 50%(P)
45% 41% 37% 34% 40% 42% 45%
Participated in some but not allrequested/desired training
24% 25% 30%(p)
36%(P)
21% 13% 27%(Q)
26%(Q)
30%(Q)
Participated in none ofrequested/desired training
8% 9% 9% 8% 7% 13%(R)
5% 8% 10%(R)
Did not request or desire any training 27% 15% 16% 15% 34%(M,N,O)
40%(r,S,T)
29%(T)
22% 16%
Refused 1% 0% 0% 0% 1% 0% 0% 2%(R,t)
0%

58 INVESTING IN TRAINING 50+ WORKERS: A TALENT MANAGEMENT STRATEGY
TABLE 6: SATISFACTION WITH TRAINING OFFERED BY EMPLOYER
PERCENT SELECTING EACH ITEM
Age Education Annual Household Income
TABLE 6: SATISFACTION WITH TRAINING OFFERED BY EMPLOYER (Continued)
PERCENT SELECTING EACH ITEM
Sector Number of Employees
Q10. “Overall, how satisfied are you with the work-related education and training opportunities offered to you by your employer?”Source: December 2006 AARP survey of individuals age 50+ employed in companies with 10 or more employees.Notes: n=Unweighted total number of respondents in a given category. Uppercase letters indicate significant differences at the 95% confidence level, while lowercase letters indicate significant differences at the 90% confidence level.
Q10. “Overall, how satisfied are you with the work-related education and training opportunities offered to you by your employer?”Source: December 2006 AARP survey of individuals age 50+ employed in companies with 10 or more employees.Notes: n=Unweighted total number of respondents in a given category. Uppercase letters indicate significant differences at the 95% confidence level, while lowercase letters indicate significant differences at the 90% confidence level.
SurveyTotal
Schools–Public and
Private Government Nonprofit
For-ProfitCompany(including
Small Family-Run Business) 10–49 50–499
500–9,999 10,000+
n=1,048 n=170 n=138 n=92 n=582 n=147 n=297 n=305 n=209
(A) (M) (N) (O) (P) (Q) (R) (S) (T)
Very Satisfied 35% 46%(n,P)
33% 40% 31% 30% 29% 42%(q,R)
38%(r)
Somewhat Satisfied 44% 37% 44% 47% 46%(m)
46%(s)
48%(S)
35% 47%(S)
Somewhat Dissatisfied 14% 11% 15% 7% 14% 17% 15% 14% 11%
Very Dissatisfied 8% 6% 9% 6% 9% 7% 8% 10%(t)
5%
Refused 0% 0% 0% 1% 0% 0% 0% 0% 0%
SurveyTotal 50–54 55–59 60–64 65+
HighSchool
Degree orLess
SomeCollege
4-YearCollegeDegreeor More
Lessthan
$25,000
$25,000to
$49,999
$50,000to
$74,999
$75,000and
Above
n=1,048 n=393 n=383 n=183 n=89 n=374 n=304 n=365 n=135 n=347 n=255 n=311
(A) (B) (C) (D) (E) (F) (G) (H) (I) (J) (K) (L)
Very Satisfied 35% 35% 31% 37% 41% 35% 29% 39%(G)
34% 35% 35% 35%
Somewhat Satisfied 44% 44% 48% 37% 41% 43% 47% 41% 46% 40% 44% 46%
Somewhat Dissatisfied 14% 11% 15% 19%(B)
14% 15% 14% 13% 14% 16%(k)
10% 14%
Very Dissatisfied 8% 10% 7% 6% 4% 7% 10% 7% 6% 8% 11%(L)
5%
Refused 0% 0% 0% 1% 0% 0% 0% 0% 0% 1% 0% 0%

A REPORT FOR AARP PREPARED BY TOWERS PERRIN 59
Q9. “For each of the following statements, please tell us to what extent you agree or disagree with that statement.“Source: December 2006 AARP survey of individuals age 50+ employed in companies with 10 or more employees.Notes: n=Unweighted total number of respondents in a given category. Uppercase letters indicate significant differences at the 95% confidence level, while lowercase letters indicate significant differences at the 90% confidence level.
TABLE 7: COMPANY SUPPORT FOR TRAINING
PERCENTAGE STRONGLY/SOMEWHAT AGREEING
Age Education Annual Household Income
SurveyTotal 50–54 55–59 60–64 65+
HighSchool
Degree orLess
SomeCollege
4-YearCollegeDegreeor More
Lessthan
$25,000
$25,000to
$49,999
$50,000to
$74,999
$75,000and
Above
n=1,048 n=393 n=383 n=183 n=89 n=374 n=304 n=365 n=135 n=347 n=255 n=311
(A) (B) (C) (D) (E) (F) (G) (H) (I) (J) (K) (L)
All workers in my company,regardless of their age or position,have equal access to educationand training
72% 70% 73% 75% 71% 72% 67% 76%(G)
71% 70% 70% 77%
My boss encourages me to take thetraining I need to do my job well
68% 68%(E)
73%(E)
67%(e)
54% 62% 67% 74%(F)
65% 61% 72%(J)
75%(J)
My company offers all the educationand training opportunities that Ineed to keep my skills up-to-date
64% 66% 65% 62% 56% 62% 63% 68% 66% 59% 67% 68%(j)
Q9. “For each of the following statements, please tell us to what extent you agree or disagree with that statement.“Source: December 2006 AARP survey of individuals age 50+ employed in companies with 10 or more employees.Notes: n=Unweighted total number of respondents in a given category. Uppercase letters indicate significant differences at the 95% confidence level, while lowercase letters indicate significant differences at the 90% confidence level.
TABLE 7: COMPANY SUPPORT FOR TRAINING (Continued)
PERCENTAGE STRONGLY/SOMEWHAT AGREEING
Sector Number of Employees
SurveyTotal
Schools–Public and
Private Government Nonprofit
For-ProfitCompany(including
SmallFamily-RunBusiness) 10–49 50–499
500–9,999 10,000+
n=1,048 n=170 n=138 n=92 n=582 n=147 n=297 n=305 n=209
(A) (M) (N) (O) (P) (Q) (R) (S) (T)
All workers in my company, regardless of their age orposition, have equal access to education and training
72% 84%(O,P)
75% 70% 68% 72% 67% 73% 80%(R)
My boss encourages me to take the training I needto do my job well
68% 79%(n,P)
69% 80%(P)
63% 63% 58% 74%(Q,R)
76%(Q,R)
My company offers all the education and trainingopportunities that I need to keep my skills up to date
64% 76%(n,P)
65% 72%(p)
60% 54% 57% 68%(Q,R)
77%(Q,R,s)

60 INVESTING IN TRAINING 50+ WORKERS: A TALENT MANAGEMENT STRATEGY
Q12. “Through which of the following methods does your employer provide work-related education or training to its employees?” Source: December 2006 AARP survey of individuals age 50+ employed in companies with 10 or more employees.Notes: n=Unweighted total number of respondents in a given category. Uppercase letters indicate significant differences at the 95% confidence level, while lowercase letters indicate significant differences at the 90% confidence level.
TABLE 8: VARIETY OF TRAINING METHODS EMPLOYERS OFFER
PERCENTAGE RESPONDING YES
Age Education Annual Household Income
SurveyTotal 50–54 55–59 60–64 65+
HighSchoolDegreeor Less
SomeCollege
4-YearCollegeDegreeor More
Lessthan
$25,000
$25,000to
$49,999
$50,000to
$74,999
$75,000and
Above
n=1,048 n=393 n=383 n=183 n=89 n=374 n=304 n=365 n=135 n=347 n=255 n=311
(A) (B) (C) (D) (E) (F) (G) (H) (I) (J) (K) (L)
Hands-on-training 82% 81% 81% 84% 81% 83% 81% 81% 82% 81% 79% 85%
Participation at professionalconferences, seminars, orworkshops
59% 60%(E)
61%(E)
59%(E)
42% 42% 55%(F)
77%(F,G)
49% 48% 63%(I,J)
73%(I,J,K)
Classroom training (offered atcompany or another location)
59% 63%(d,E)
63%(d,E)
53% 45% 46% 55%(f)
76%(F,G)
53% 50% 60%(J)
72%(I,J,K)
Online or computer-basedtraining
46% 45% 48% 49% 39% 36% 38% 62%(F,G)
31% 42%(i)
48%(I)
58%(I,J,K)
Tuition reimbursement(including partialreimbursement)
42% 44%(E)
47%(d,E)
37%(E)
22% 29% 41%(F)
53%(F,G)
31% 34% 42% 56%(I,J,K)
Temporary assignments in otherdepartments
33% 33% 34% 31% 35% 41%(g,H)
33%(h)
25% 45%(J,K,L)
32% 30% 32%
Paid time off for education ortraining without affecting anemployee’s vacation leave
32% 33% 34%(e)
31% 23% 23% 29% 42%(F,G)
26% 30% 33% 36%(i)
Formal mentoring program 27% 31%(E)
27%(E)
26%(e)
14% 19% 20% 41%(F,G)
25% 18% 29%(J)
39%(I,J,K)
Formal job rotation program 13% 16% 13% 10% 10% 15% 11% 13% 16% 14% 12% 12%

A REPORT FOR AARP PREPARED BY TOWERS PERRIN 61
Q12. “Through which of the following methods does your employer provide work-related education or training to its employees?” Source: December 2006 AARP survey of individuals age 50+ employed in companies with 10 or more employees.Notes: n=Unweighted total number of respondents in a given category. Uppercase letters indicate significant differences at the 95% confidence level, while lowercase letters indicate significant differences at the 90% confidence level.
TABLE 8: VARIETY OF TRAINING METHODS EMPLOYERS OFFER (Continued)
PERCENTAGE RESPONDING YES
Sector Number of Employees
SurveyTotal
Schools–Public and
Private Government Nonprofit
For-Profit Company(including
SmallFamily-RunBusiness) 10–49 50–499
500–9,999 10,000+
n=1,048 n=170 n=138 n=92 n=582 n=147 n=297 n=305 n=209
(A) (M) (N) (O) (P) (Q) (R) (S) (T)
Hands-on-training 82% 76% 83% 79% 83%(m)
77% 83% 81% 88%(Q,s)
Participation at professional conferences,seminars, or workshops
59% 85%(N,P)
72%(P)
76%(P)
46% 43% 59%(Q)
67%(Q,r)
66%(Q)
Classroom training (offered at company oranother location)
59% 79%(O,P)
73%(P)
65%(P)
50% 34% 55%(Q)
68%(Q,R)
75%(Q,R)
Online or computer-basedtraining
46% 60%(N,O,P)
46% 43% 44% 22% 38%(Q)
55%(Q,R)
70%(Q,R,S)
Tuition reimbursement (includingpartial reimbursement)
42% 51%(P)
42% 59%(N,P)
36% 18% 34%(Q)
51%(Q,R)
59%(Q,R)
Temporary assignments in other departments 33% 16% 40%(M)
30%(M)
37%(M)
27% 27% 30% 50%(Q,R,S)
Paid time off for education or training withoutaffecting an employee’s vacation leave
32% 49%(n,P)
36%(P)
49%(n,P)
23% 29% 30% 38%(r)
34%
Formal mentoring program 27% 54%(N,O,P)
26% 31%(P)
19% 10% 22%(Q)
36%(Q,R)
41%(Q,R)
Formal job rotation program 13% 12% 18% 12% 12% 7% 9% 17%(Q,R)
25%(Q,R,s)

62 INVESTING IN TRAINING 50+ WORKERS: A TALENT MANAGEMENT STRATEGY
TABLES 9: REASONS FOR DISSATISFACTION WITH TRAINING
PERCENTAGE SELECTING EACH ITEM
Age Education Annual Household Income
Q19. “Which of the following best describes what you dislike the most about work-related education and training?”Source: December 2006 AARP survey of individuals age 50+ employed in companies with 10 or more employees.Notes: n=Unweighted total number of respondents in a given category who indicated that they have participated in work-related training. Uppercase letters indicate significant differences at the 95% confidence level, while lowercase letters indicate significant differences at the 90% confidence level.
SurveyTotal 50–54 55–59 60–64 65+
HighSchoolDegreeor Less
SomeCollege
4-YearCollege
Degree orMore
Lessthan
$25,000
$25,000to
$49,999
$50,000to
$74,999
$75,000and
Above
n=882 n=330 n=330 n=159 n=63 n=273 n=261 n=343 n=108 n=266 n=222 n=286
(A) (B) (C) (D) (E) (F) (G) (H) (I) (J) (K) (L)
It’s not always relevant to me/doesnot always meet my needs
35% 33% 38% 34% 37% 33% 36% 36% 32% 32% 35% 39%
It’s too time-consuming 24% 20% 23% 30%(B)
30% 23% 24% 23% 23% 23% 24% 24%
It’s not always challenging enough 17% 19% 19% 12% 10% 11% 21%(F)
19%(F)
21% 15% 15% 19%
I do not always have a chance atwork to use what I have learned
17% 19% 15% 16% 13% 20% 17% 14% 11% 22%(I,L)
18% 12%
Difficult to understand 4% 5% 3% 4% 7% 7%(G,H)
2% 3% 8%(I)
4% 4% 3%
Other (e.g., scheduled at wrong time;instructor not knowledgeable;nothing I disliked)
2% 3%(c)
1% 3% 0% 3% 1% 3% 3% 3% 2% 1%

A REPORT FOR AARP PREPARED BY TOWERS PERRIN 63
TABLES 9: REASONS FOR DISSATISFACTION WITH TRAINING (Continued)
PERCENTAGE SELECTING EACH ITEM
Sector Number of Employees
Q19. “Which of the following best describes what you dislike the most about work-related education and training?”Source: December 2006 AARP survey of individuals age 50+ employed in companies with 10 or more employees.Notes: n=Unweighted total number of respondents in a given category who indicated that they have participated in work-related training. Uppercase letters indicate significant differences at the 95% confidence level, while lowercase letters indicate significant differences at the 90% confidence level.
SurveyTotal
Schools–Public and
Private Government Nonprofit
For-Profit Company
(including SmallFamily-RunBusiness) 10–49 50–499
500–9,999 10,000+
n=882 n=156 n=125 n=79 n=472 n=108 n=247 n=268 n=191
(A) (M) (N) (O) (P) (Q) (R) (S) (T)
It’s not always relevant to me/does not alwaysmeet my needs
35% 44%(O,P)
41%(o,p)
26% 32% 42% 32% 33% 36%
It’s too time-consuming 24% 22% 18% 27% 24% 23% 26% 23% 21%
It’s not always challenging enough 17% 13% 21% 21% 16% 19% 16% 17% 21%
I do not always have a chance at work to usewhat I have learned
17% 12% 13% 12% 20%(m)
9% 19%(q)
19%(q)
14%
Difficult to understand 4% 2% 4% 3% 5% 5% 5% 3% 3%
Other (e.g., scheduled at wrong time; instructornot knowledgeable; nothing I disliked)
2% 4% 3% 1% 2% 0% 1% 3% 4%(q)

64 INVESTING IN TRAINING 50+ WORKERS: A TALENT MANAGEMENT STRATEGY
Q25a. “What obstacles, if any, prevented you from participating in work-related education and training opportunities in the past 2 years?”Source: December 2006 AARP survey of individuals age 50+ employed in companies with 10 or more employees.Notes: n=Unweighted total number of respondents in a given category who did not receive all of the training that they requested or desired within the past two years or who didnot request or desire any training within the past two years.Uppercase letters indicate significant differences at the 95% confidence level, while lowercase letters indicate significant differences at the 90% confidence level.
TABLES 10: OBSTACLES TO PARTICIPATING IN TRAINING
PERCENTAGE SELECTING EACH ITEM
Age Education Annual Household Income
SurveyTotal 50–54 55–59 60–64 65+
HighSchoolDegreeor Less
SomeCollege
4-YearCollegeDegreeor More
Lessthan
$25,000
$25,000to
$49,999
$50,000to
$74,999
$75,000and
Above
n=624 n=228 n=231 n=109 n=56 n=248 n=184 n=187 n=82 n=226 n=150 n=166
(A) (B) (C) (D) (E) (F) (G) (H) (I) (J) (K) (L)
Employer did not offer or payfor any education or trainingopportunities
31% 29% 27% 32% 45%(b,C)
40%(H)
31%(H)
19% 29%(I)
41%(k,L)
29%(I)
18%
You felt too busy at your jobto take time off for training
30% 30% 32%(e)
29% 18% 28% 21% 38%(f,G)
15% 24% 25% 49%(I,J,K)
You did not feel the need totake any training
24% 20% 20% 26% 48%(B,C,D)
32%(g,H)
22% 15% 38%(j,K.L)
26%(L)
23% 15%
Employer/supervisor/boss didnot allow you to participate inthe training you wanted due towork demands/time constraints
18% 21% 21% 13% 11% 12% 21%(F)
25%(F)
16% 14% 18% 26%(J)
Employer did not offer or payfor certain education or trainingopportunities that you needed/wanted
14% 17%(d)
16% 9% 7% 11% 12% 21%(F,g)
9% 11% 15% 20%(I,J)
Employer/supervisor/boss didnot allow you to participate inthe training you wanted due tobudgetary reasons
13% 14% 12% 15% 6% 5% 18%(F)
17%(F)
5% 11% 10% 21%(I,J,K)
You did not think the trainingoffered by your employer wasuseful to your job
12% 9% 18%(B,d)
9% 9% 7% 11% 18%(F,g)
12% 7% 18%(J)
13%
Employer/supervisor/boss didnot allow you to participate inthe training because he/she didnot think the training was rele-vant to your job
8% 9% 8% 7% 10% 7% 9% 10% 7% 11% 6% 7%
Other 5% 4% 6% 7%(g)
– 2% 3% 9%(F,g)
1% 6%(I)
7%(I)
2%

A REPORT FOR AARP PREPARED BY TOWERS PERRIN 65
Q25a. “What obstacles, if any, prevented you from participating in work-related education and training opportunities in the past 2 years?”Source: December 2006 AARP survey of individuals age 50+ employed in companies with 10 or more employees.Notes: n=Unweighted total number of respondents in a given category who did not receive all of the training that they requested or desired within the past two years or who didnot request or desire any training within the past two years.Uppercase letters indicate significant differences at the 95% confidence level, while lowercase letters indicate significant differences at the 90% confidence level.
TABLES 10: OBSTACLES TO PARTICIPATING IN TRAINING (Continued)
PERCENTAGE SELECTING EACH ITEM
Sector Number of Employees
SurveyTotal
Schools–Public and
Private Government Nonprofit
For-Profit Company(including
SmallFamily-RunBusiness) 10–49 50–499
500–9,999 10,000+
n=624 n=85 n=74 n=55 n=364 n=97 n=176 n=177 n=116
(A) (M) (N) (O) (P) (Q) (R) (S) (T)
Employer did not offer or pay for any educationor training opportunities
31% 28% 22% 17% 34%(n,O)
47%(R,S,T)
30% 28% 21%
You felt too busy at your job to take time offfor training
30% 36% 23% 28% 30% 21% 37%(Q)
28% 29%
You did not feel the need to take any training 24% 14% 17% 18% 27%(M)
34%(r,S,T)
23% 20% 15%
Employer/supervisor/boss did not allow you toparticipate in the training you wanted due towork demands/time constraints
18% 30%(P)
23% 16% 17% 7% 12% 22%(Q,r)
34%(Q,R,s)
Employer did not offer or pay for certaineducation or training opportunities that youneeded/wanted
14% 30%(O,P)
18% 10% 12% 8% 13% 16% 19%(q)
Employer/supervisor/boss did not allow you toparticipate in the training you wanted due tobudgetary reasons
13% 22%(P)
13% 22%(p)
11% 11% 9% 18%(R)
15%
You did not think the training offered by youremployer was useful to your job
12% 23%(P)
18%(P)
16%(p)
8% 8% 17%(q)
10% 10%
Employer/supervisor/boss did not allow you toparticipate in the training because he/she didnot think the training was relevant to your job
8% 7% 9% 10% 9% 4% 7% 13%(q)
8%
Other 5% 7% 4% 12%(P)
4% 5% 4% 6% 3%

66 INVESTING IN TRAINING 50+ WORKERS: A TALENT MANAGEMENT STRATEGY
Q27. “Overall, to what extent did you find the work-related education or training you received in the past 2 years useful for your job or career?” Source: December 2006 AARP survey of individuals age 50+ employed in companies with 10 or more employees.Notes: n=Unweighted total number of respondents in a given category who participated in work-related training within the past 2 years.Uppercase letters indicate significant differences at the 95% confidence level, while lowercase letters indicate significant differences at the 90% confidence level.
TABLES 11: VALUE OF TRAINING IN LAST TWO YEARS TO JOB OR CAREER
PERCENTAGE SELECTING EACH ITEM
Age Education Annual Household Income
Q27. “Overall, to what extent did you find the work-related education or training you received in the past 2 years useful for your job or career?” Source: December 2006 AARP survey of individuals age 50+ employed in companies with 10 or more employees.Notes: n=Unweighted total number of respondents in a given category who participated in work-related training within the past 2 years.Uppercase letters indicate significant differences at the 95% confidence level, while lowercase letters indicate significant differences at the 90% confidence level.
TABLES 11: VALUE OF TRAINING IN LAST TWO YEARS TO JOB OR CAREER (Continued)
PERCENTAGE SELECTING EACH ITEM
Sector Number of Employees
SurveyTotal 50–54 55–59 60–64 65+
HighSchool
Degree orLess
SomeCollege
4-YearCollege
Degree orMore
Less than$25,000
$25,000to
$49,999
$50,000to
$74,999
$75,000and
Above
n=692 n=267 n=261 n=118 n=46 n=190 n=190 n=309 n=79 n=187 n=170 n=256
(A) (B) (C) (D) (E) (F) (G) (H) (I) (J) (K) (L)
Very useful 47% 51% 42% 44% 58%(c)
55%(H)
50% 41% 53%(L)
57%(L)
46% 38%
Somewhat useful 45% 44% 51%(e)
42% 35% 37% 42% 52%(F,g)
29% 39% 45%(I)
57%(I,J,K)
Not too useful 7% 5% 5% 14%(B,C)
4% 8% 7% 5% 15%(J,L)
4% 8% 5%
Not at all useful 1% 0% 3%(b)
0% 3%(d)
0% 1% 2% 3% 1% 1% 1%
SurveyTotal
Schools–Public and
Private Government Nonprofit
For-Profit Company(including
Small Family-Run Business) 10–49 50–499
500–9,999 10,000+
n=692 n=145 n=108 n=68 n=340 n=72 n=188 n=215 n=166
(A) (M) (N) (O) (P) (Q) (R) (S) (T)
Very useful 47% 42% 44% 58%(m)
47% 46% 44% 50% 48%
Somewhat useful 45% 53% 43% 40% 45% 48% 52% 42% 42%
Not too useful 7% 4% 11%(m,o)
2% 7% 7% 4% 6% 7%
Not at all useful 1% 1% 2% 0% 1% 0% 0% 1% 3%(r)

A REPORT FOR AARP PREPARED BY TOWERS PERRIN 67
Q28. “For each of the following, please tell us the extent to which the training you took in the past 2 years affected that aspect of your work?” Source: December 2006 AARP survey of individuals age 50+ employed in companies with 10 or more employees.Notes: n=Unweighted total number of respondents in a given category who participated in work-related training within the past 2 years.Uppercase letters indicate significant differences at the 95% confidence level, while lowercase letters indicate significant differences at the 90% confidence level.
TABLE 12: IMPACT OF TRAINING IN LAST TWO YEARS ON WORKERS
PERCENT RESPONDING A GREAT DEAL/SOMEWHAT
Age Education Annual Household Income
SurveyTotal 50–54 55–59 60–64 65+
HighSchoolDegreeor Less
SomeCollege
4-YearCollegeDegreeor More
Lessthan
$25,000
$25,000to
$49,999
$50,000to
$74,999
$75,000and
Above
n=692 n=267 n=261 n=118 n=46 n=190 n=190 n=309 n=79 n=187 n=170 n=256
(A) (B) (C) (D) (E) (F) (G) (H) (I) (J) (K) (L)
Improved your job skills 76% 78% 73% 78% 73% 77% 69% 79%(G)
71% 77% 74% 79%
Increased your ability to helpyour coworkers/be a mentorto your coworkers
63% 65% 60% 61% 71% 69%(h)
62% 60% 61% 68%(k)
56% 64%
Increased your productivity atwork
62% 62% 61% 64% 65% 67%(h)
64% 58% 57% 70%(i,k,I)
59% 60%
Made you feel like a morevaluable employee
59% 61% 58% 56% 65% 64% 58% 58% 57% 65% 54% 59%
Increased your satisfactionwith your job
56% 59% 53% 50% 63% 60% 56% 53% 54% 63%(I)
53% 52%
Allowed you to take on moreresponsibilities
54% 53% 54% 56% 58% 57% 55% 52% 53% 63%(k,L)
52% 47%
Helped you to get promoted 24% 26% 24% 18% 31% 27% 24% 22% 36%(K,L)
29%(k,I)
18% 20%

68 INVESTING IN TRAINING 50+ WORKERS: A TALENT MANAGEMENT STRATEGY
Q28. “For each of the following, please tell us the extent to which the training you took in the past 2 years affected that aspect of your work?” Source: December 2006 AARP survey of individuals age 50+ employed in companies with 10 or more employees.Notes: n=Unweighted total number of respondents in a given category who participated in work-related training within the past 2 years.Uppercase letters indicate significant differences at the 95% confidence level, while lowercase letters indicate significant differences at the 90% confidence level.
TABLE 12: IMPACT OF TRAINING IN LAST TWO YEARS ON WORKERS (Continued)
PERCENT RESPONDING A GREAT DEAL/SOMEWHAT
Sector Number of Employees
SurveyTotal
Schools–Public and
Private Government Nonprofit
For-Profit Company(including
Small Family-Run Business) 10–49 50–499
500–9,999 10,000+
n=692 n=145 n=108 n=68 n=340 n=72 n=188 n=215 n=166
(A) (M) (N) (O) (P) (Q) (R) (S) (T)
Improved your job skills 76% 80% 72% 82% 75% 82% 80% 75% 73%
Increased your ability to help yourcoworkers/be a mentor to yourcoworkers
63% 58% 60% 86%(M,N,P)
61% 64% 61% 68% 59%
Increased your productivity at work 62% 64% 55% 61% 63% 72% 68% 61% 58%
Made you feel like a more valuableemployee
59% 55% 52% 72%(m,N)
61% 59% 65%(T)
58% 52%
Increased your satisfaction with your job 56% 49% 52% 72%(M,N,p)
56% 56% 59% 55% 53%
Allowed you to take on moreresponsibilities
54% 53% 49% 67%(n)
53% 59% 59%(t)
54% 48%
Helped you to get promoted 24% 19% 25% 30% 24% 19% 26% 24% 22%

A REPORT FOR AARP PREPARED BY TOWERS PERRIN 69
TABLE 13: IMPACT OF TRAINING ON RETENTION
PERCENTAGE SELECTING EACH ITEM
Age Education Annual Household Income
Q30. “If your employer paid for or allowed you to participate in more work-related education, training, or professional development opportunities than you participate in now,would that lead you to stay with this employer longer than you would otherwise?”Source: December 2006 AARP survey of individuals age 50+ employed in companies with 10 or more employees.Notes: n=Unweighted total number of respondents in a given category. Uppercase letters indicate significant differences at the 95% confidence level, while lowercase letters indicate significant differences at the 90% confidence level.
SurveyTotal 50–54 55–59 60–64 65+
HighSchool
Degree orLess
SomeCollege
4-YearCollegeDegreeor More
Lessthan
$25,000
$25,000to
$49,999
$50,000to
$74,999
$75,000and
Above
n=1,048 n=393 n=383 n=183 n=89 n=374 n=304 n=365 n=135 n=347 n=255 n=311
(A) (B) (C) (D) (E) (F) (G) (H) (I) (J) (K) (L)
Yes 25% 29% 24% 21% 20% 23% 26% 26% 34%(j,K)
24% 22% 25%
No 33% 28% 31% 39%(B)
47%(B,C)
32% 30% 35% 23% 31% 37%(I)
35%(i)
Maybe 30% 31%(E)
32%(E)
28% 17% 27% 33% 30% 25% 32% 28% 30%
Not sure 13% 12% 13% 12% 15% 17%(g,H)
11% 10% 17%(I)
14% 13% 9%
Refused 0% 0% 1% 0% 1%(b)
0% 0% 0% 1% 0% 0% 1%
TABLE 13: IMPACT OF TRAINING ON RETENTION (Continued)
PERCENTAGE SELECTING EACH ITEM
Sector Number of Employees
Q30. “If your employer paid for or allowed you to participate in more work-related education, training, or professional development opportunities than you participate in now,would that lead you to stay with this employer longer than you would otherwise?”Source: December 2006 AARP survey of individuals age 50+ employed in companies with 10 or more employees.Notes: n=Unweighted total number of respondents in a given category. Uppercase letters indicate significant differences at the 95% confidence level, while lowercase letters indicate significant differences at the 90% confidence level.
SurveyTotal
Schools–Public and
Private Government Nonprofit
For-ProfitCompany(including
Small Family-Run Business) 10–49 50–499
500–9,999 10,000+
n=1,048 n=170 n=138 n=92 n=582 n=147 n=297 n=305 n=209
(A) (M) (N) (O) (P) (Q) (R) (S) (T)
Yes 25% 27% 25% 26% 26% 21% 26% 23% 30%
No 33% 34% 37% 32% 30% 33% 33% 33% 34%
Maybe 30% 25% 25% 37% 32% 32% 29% 30% 27%
Not sure 13% 14%(o)
12% 6% 12% 14% 12% 13% 9%
Refused 0% 0% 1%(p)
0% 0% 0% 0% 1% 0%
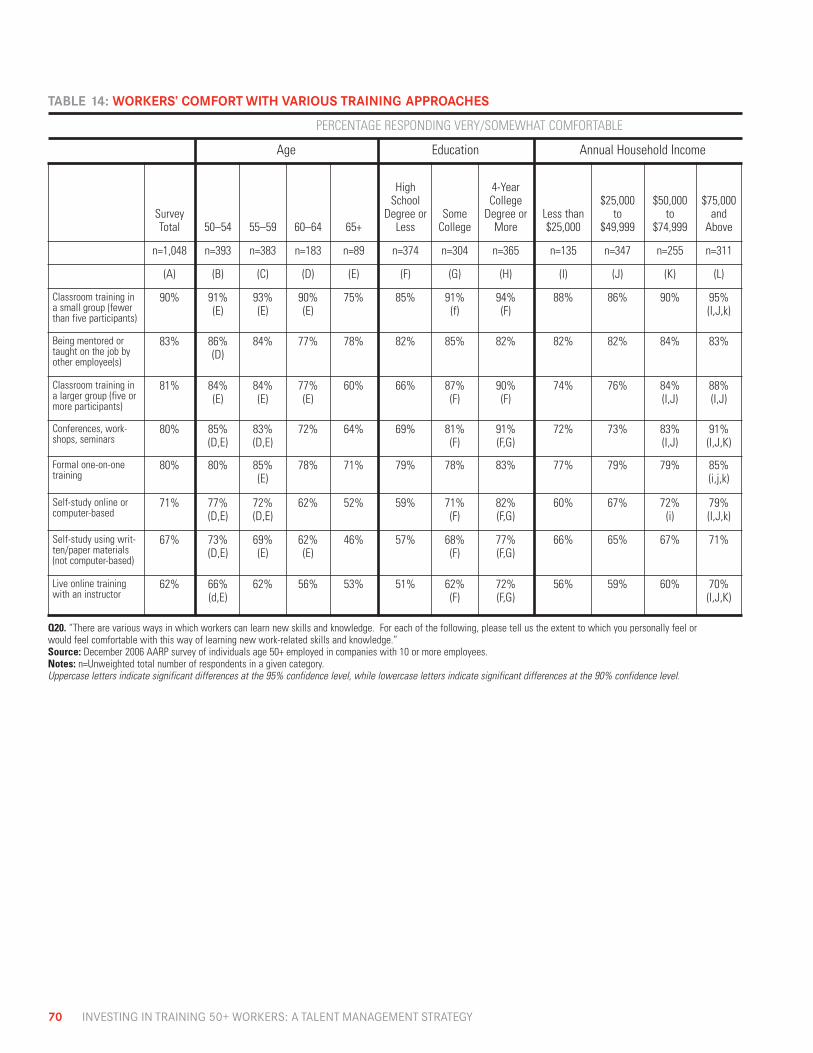
70 INVESTING IN TRAINING 50+ WORKERS: A TALENT MANAGEMENT STRATEGY
Q20. “There are various ways in which workers can learn new skills and knowledge. For each of the following, please tell us the extent to which you personally feel orwould feel comfortable with this way of learning new work-related skills and knowledge.” Source: December 2006 AARP survey of individuals age 50+ employed in companies with 10 or more employees.Notes: n=Unweighted total number of respondents in a given category. Uppercase letters indicate significant differences at the 95% confidence level, while lowercase letters indicate significant differences at the 90% confidence level.
TABLE 14: WORKERS’ COMFORT WITH VARIOUS TRAINING APPROACHES
PERCENTAGE RESPONDING VERY/SOMEWHAT COMFORTABLE
Age Education Annual Household Income
SurveyTotal 50–54 55–59 60–64 65+
HighSchool
Degree orLess
SomeCollege
4-YearCollege
Degree orMore
Less than$25,000
$25,000to
$49,999
$50,000to
$74,999
$75,000and
Above
n=1,048 n=393 n=383 n=183 n=89 n=374 n=304 n=365 n=135 n=347 n=255 n=311
(A) (B) (C) (D) (E) (F) (G) (H) (I) (J) (K) (L)
Classroom training ina small group (fewerthan five participants)
90% 91%(E)
93%(E)
90%(E)
75% 85% 91%(f)
94%(F)
88% 86% 90% 95%(I,J,k)
Being mentored ortaught on the job byother employee(s)
83% 86%(D)
84% 77% 78% 82% 85% 82% 82% 82% 84% 83%
Classroom training ina larger group (five ormore participants)
81% 84%(E)
84%(E)
77%(E)
60% 66% 87%(F)
90%(F)
74% 76% 84%(I,J)
88%(I,J)
Conferences, work-shops, seminars
80% 85%(D,E)
83%(D,E)
72% 64% 69% 81%(F)
91%(F,G)
72% 73% 83%(I,J)
91%(I,J,K)
Formal one-on-onetraining
80% 80% 85%(E)
78% 71% 79% 78% 83% 77% 79% 79% 85%(i,j,k)
Self-study online orcomputer-based
71% 77%(D,E)
72%(D,E)
62% 52% 59% 71%(F)
82%(F,G)
60% 67% 72%(i)
79%(I,J,k)
Self-study using writ-ten/paper materials(not computer-based)
67% 73%(D,E)
69%(E)
62%(E)
46% 57% 68%(F)
77%(F,G)
66% 65% 67% 71%
Live online trainingwith an instructor
62% 66%(d,E)
62% 56% 53% 51% 62%(F)
72%(F,G)
56% 59% 60% 70%(I,J,K)

A REPORT FOR AARP PREPARED BY TOWERS PERRIN 71
TABLE 14: WORKERS’ COMFORT WITH VARIOUS TRAINING APPROACHES (Continued)
PERCENTAGE RESPONDING VERY/SOMEWHAT COMFORTABLE
Sector Number of Employees
Q20. “There are various ways in which workers can learn new skills and knowledge. For each of the following, please tell us the extent to which you personally feel orwould feel comfortable with this way of learning new work-related skills and knowledge.” Source: December 2006 AARP survey of individuals age 50+ employed in companies with 10 or more employees.Notes: n=Unweighted total number of respondents in a given category. Uppercase letters indicate significant differences at the 95% confidence level, while lowercase letters indicate significant differences at the 90% confidence level.
SurveyTotal
Schools–Public and
Private Government Nonprofit
For-ProfitCompany
(including SmallFamily-RunBusiness) 10–49 50–499
500–9,999 10,000+
n=1,048 n=170 n=138 n=92 n=582 n=147 n=297 n=305 n=209
(A) (M) (N) (O) (P) (Q) (R) (S) (T)
Classroom training in a small group(fewer than five participants)
90% 94% 91% 93% 89% 85% 90% 91% 93%(Q)
Being mentored or taught on the jobby other employee(s)
83% 81% 82% 83% 84% 81% 83% 82% 85%
Classroom training in a larger group(five or more participants)
81% 87%(p)
85% 85% 79% 70% 79%(q)
86%(Q,r)
84%(Q)
Conferences, workshops, seminars 80% 90%(n,P)
82% 86% 77% 69% 78%(q)
84%(Q)
87%(Q,R)
Formal one-on-one training 80% 83% 75% 83% 82% 80% 77% 81% 84%
Self-study online or computer-based 71% 73% 73% 65% 71% 58% 70%(Q)
76%(Q)
78%(Q)
Self-study using written/paper mate-rials (not computer-based)
67% 70% 67% 61% 69% 61% 63% 70% 75%(Q,R)
Live online training with an instructor 62% 68%(o)
64% 55% 61% 51% 61% 66%(Q)
70%(Q,r)

Knowledge Management601 E Street, NWWashington, DC 20049www.aarp.org/research
Copyright © 2008 Reprinting with Permission
D18956