a sustainable business model based on innovation ... - roche · 1 roche a sustainable business...
TRANSCRIPT

11
RocheA sustainable business model based on innovation and productivity gains
Karl Mahler, Head of Investor Relations

2
(1) pricing and product initiatives of competitors; (2) legislative and regulatory developments and economic conditions;(3) delay or inability in obtaining regulatory approvals or bringing products to market;(4) developments in financial market conditions, including the market for acquisition financing and other capital markets and fluctuations in
currency exchange rates;(5) uncertainties in the discovery, development or marketing of new products or new uses of existing products, including without limitation
negative results of clinical trials or research projects and unexpected side-effects of pipeline or marketed products; (6) increased government pricing pressures or changes in third party reimbursement rates; (7) interruptions in production;(8) loss of or inability to obtain adequate protection for intellectual property rights;(9) Litigation;(10) the inherent uncertainties involved in negotiations with the special committee of Genentech and that there can be no assurances that a
negotiated transaction will ultimately be agreed to or consummated;(11) potential difficulties in integrating the businesses of Genentech and Roche, and that some or all of the anticipated benefits of the
proposed transaction may not be realized on the schedule contemplated or at all;(12) that future dividends are subject to the discretion of the board of directors of Roche and a number of other factors, some of which are
beyond the control of Roche;(13) the ability of Roche to generate cash flow to, among other things, repay acquisition-related debt as currently contemplated; (14) loss of key executives or other employees; and(15) adverse publicity and news coverage.
The directors of Genentech who are also employees of Roche will not take part in the consideration of the proposed transaction by the Genentech board and accordingly are not permitted to comment or respond to questions regarding the transaction as representatives of Genentech.
For marketed products discussed in this presentation, please see full prescribing information on our website – www.roche.com
All mentioned trademarks are legally protected.
This presentation contains certain forward-looking statements. These forward-looking statements may be identified by words such as “believes”, “expects”, “anticipates”, “projects”, “intends”, “should”, “seeks”, “estimates”, “future” or similar expressions or by discussion of, among other things,strategy, goals, plans or intentions. Various factors may cause actual results to differ materially in the future from those reflected in forward-looking statements contained in this document, including among others:

3
Performance up-date
Strategy
Main trends influencing long term value propositions
Summary

4
2008 Sales: ~CHF 4 bn underlying organic sales
Strong impact by currencies and Tamiflu pandemic
2'018
2'713
4'306
-1,593
-516
978
1'185
125
-3,229
+9 % +11 % +4 % +10 % +10 % +6 %-86 % -1 %
Roche Pharma
Genentech Chugai Diagnostics Division
Group
Tamiflupandemic
Group incl. Tamiflu pandemic
FX Group CHF~CHF 4 bn organic
sales growth
CHF m

5
Sales 46.1 45.6 -0.5 -1 +6
Operating profit 14.5 13.9 -0.5 -4 +4
as % of sales 31.4 30.5
Net income 11.4 10.8 -0.6 -5
as % of sales 24.8 23.8
Core EPS 11.85 11.04 -7 +2
ChangeCHF billion 2007 2008 CHF billion % loc %
2008: Core EPS target achieved
While increasing investments in R&D and despite difficult financial environment

6
Performance up-date
Our Strategy and the changing environment
Main trends influencing long term value propositions
Summary

7
Roche’s unique window of opportunity
The industry
Low replacement power of current earnings levels
Poor pipelines
Cost cutting
2007 2013-14
Growth
Bridging the cliffs, Cost-cutting, Diversification
Peers
Roche
Roche’s unique position
Stability of
business model
Roche
Extended stability
Low generic exposure
Investment into the future

8
Focus on our core businesses
Generics
Low
High
Premium for Innovation
Roche Focus Dia
MedTech
OTC
Pharma
High
Medical
Differentiation

9
Roche’s strategy focuses along either dimension
Source: SDI Analysis
Proximityto Core
(regardingproducts)
Proximity to Core(regarding business model)
Gen
erics
Gen
erics
Vacc
ines
Vacc
ines
Corixa
Zentiva
Lek
Hexal
Chiron
Domantis
Sirtris
Sabex
Bubble size depicts value of acquisition
*
BioVeris
NimbleGen
GlycArt
Phar
ma
Phar
ma

10
Major arguments for and against diversification
For Diversification Against Diversification
• Risk mitigation • If not a top tier performer- potential value
destruction
• Potentially lower acquisition
costs vs. pharma acquisitions
• Different business models increase
integration complexity
• Lower overall R&D investment
spend / risk for generic drugs• Lower margins (e.g. for generic drugs)
• Broader R&D pipeline (e.g.
vaccines)
• Oversight of good pharma deals due to
lack of focus
Risk mitigation vs. lack of focus

11SDI Analysis; Source: Annual Reports of corresponding companies, datastream, currency rates (average 365 days)
200720052004 20062003
150
100
200
50
0
Operative Cash Flow per employee250
CHF 000’s
Novartis
Roche
Sanofi-Aventis
GSK
Profitability measures
Operating cash flow per employee

12
Years
NDA Review
Not to invest in the future means being out of business in ten years
1 2 3 4 5 6 7 8 9 10
Drug development timeline*
Pre-clinical R&D
Clinical R&D
*Source: www.fda.gov/fdac/graphics/newdrugspecial/drugchart.pdf
Refill of top line
Maturing portfolio

13
A well risk balanced approach to investment
Most projects in late stage de-risked
2007 2008
New Molecular
Entities
Line
Extensions
����
����
����
����
����
����
*PPARαγαγαγαγ
1 LE in Phase I
11 LEs in Phase II
36 LEs in Phase III
NMEsin
Phase III
16 NMEs in Phase II
40 NMEs in Phase I
pertuzumab
ocrelizumab
TDM-1
taspoglutide (GLP-1)
dalcetrapib (CETPi)
% of Pharma Development spend
Proof of Concept
* Formal decision to move into phase III pending
42% 40%

14
Roche: Late stage projects with high success rate
Roche R&D pipeline, phase III projects
0
15
30
45
2005 2006 2007 2008
Other
Oncology
Metabolic
Autoimmune
41
33
3842
Terminations 0 1 1 2
Attrition rates % 0 2.6 2.4 4.9

0
20
40
60
80
100
'95-'99
'96-'00
'97-'01
'98-'02
'99-'03
'00-'04
'01-'05
'02-'06
Success Rate (%)
Industry Median
Roche
60
70
80
90
100
'95-'99
'96-'00
'97-'01
'98-'02
'99-'03
'00-'04
'01-'05
'02-'06
Attrition Rate (%)
Industry Median
Roche
Responsible management of R&D spend Higher attrition in early stage - higher success in late stage
Preclinical, Phase I and II Phase III and Registration
Source: R&D General Metrics Study, KMR GROUP, INC

16
Performance up-date
Strategy
Main trends influencing long term value propositions
Personalized Healthcare- Roche best positioned
Summary

17
Main trends influencing the long-term value propositions
Maximizing assets on hand
Personalised Healthcare

1818
Personalised Healthcare
Increasing demand by stakeholders
Better cost / benefit
Payers
More competitive
Industry
Better efficacy & safety profile
Regulators
Best treatment
Patients &
Physicians

19
Scenarios for PHC Added Value Distribution
Value captured by different stakeholders depending on IP and timing of diagnostic
Diagnostic afterDrug Launch
Diagnostic withDrug Launch
IP for Diagnostic
No IP for Diagnostic
Breast CancerAssay
Rx
Payor
Dx
Low
High
High
K-Ras Test
Rx
Payor
Dx
Low
High
Medium
Herceptin andHer2 test
Rx
Dx
Payor
High
Medium
Neutral
B-Raf inhibitor B-Raf mutant test
Rx
Dx
Payor
High
High
Neutral

20
Main trends influencing the long-term value propositions
Maximizing assets on hand
Personalised Healthcare

21
Major growth opportunities outside the US for key products
4451 51
59 65 71 76
5649 49
41 35 29 24
0
20
40
60
80
100
AVASTIN MABTHERA CELLCEPT TARCEVA XELODA HERCEPTIN PEGASYS
% of sales
Nth AmericaEU / ROW (incl. Japan)
Time on
market

22
Key drivers for long term development in place
Develop the short term drivers while not neglecting the long term opportunities
existing Earlier Phases
ILLUSTRATIVE
Inherent development risk
Maturity of portfolio
Low
High
Oncology
Inflammation
Metabolic
CNSVirology

23
Each cancer type is different
And needs a specific treatment approach
0%
20%
40%
60%
80%
100%
CRC BC NSCLC
3rd line
2nd line
1st line
adjuvant
Adjuvant DFS at 3 years*
Metastatic median OS * 25 months 36 months
* Assuming best current care, Incidence: GLOBOCAN 2002 and Roche market research
11 months
81 %72 % 50 %
Incidence
Survival

24
First in class mechanisms establishing new standards of care
Rank Drug Sales ($m) MAT 3Q08
1 MabThera 4,189
2 Herceptin 4,129
3 Avastin 4,052
4 Glivec 3,491
5 Taxotere 2745
6 Eloxatine 2,236
7 Arimidex 1,944
8 Gemzar 1,601
9 Erbitux 1,412
10 Casodex 1,343
First in class
Successful products need to be first class entrants –the race begins early in R&D

25
Top 10 Oncology Products Sales and market shares in seven major markets in 2007
Roche/Genetech’s MabThera, Herceptin and Avastin
dominate the current cancer brands market
Rituxan$3,216m
Herceptin$2,653m
Avastin$2,651m
Gleevec$1,990m
Eloxatin$1,964m
Taxotere$1,837m
Lupron$1,411m
Arimidex$1,364m
Gemzar$1,156m
Erbitux$1,040m
-10%
0%
10%
20%
30%
40%
50%
0% 2% 4% 6% 8% 10% 12%
Market share, 2007
CA
GR
, 200
6-07
Bubble size represents 2007 sales
Source: Datamonitor, MIDAS Sales Data, IMS Health, April 2008, Copyright ©, reprinted with permission
DMHC2416: Commercial Insight: Top 20 Therapy Cancer Brands (08/2008)
26
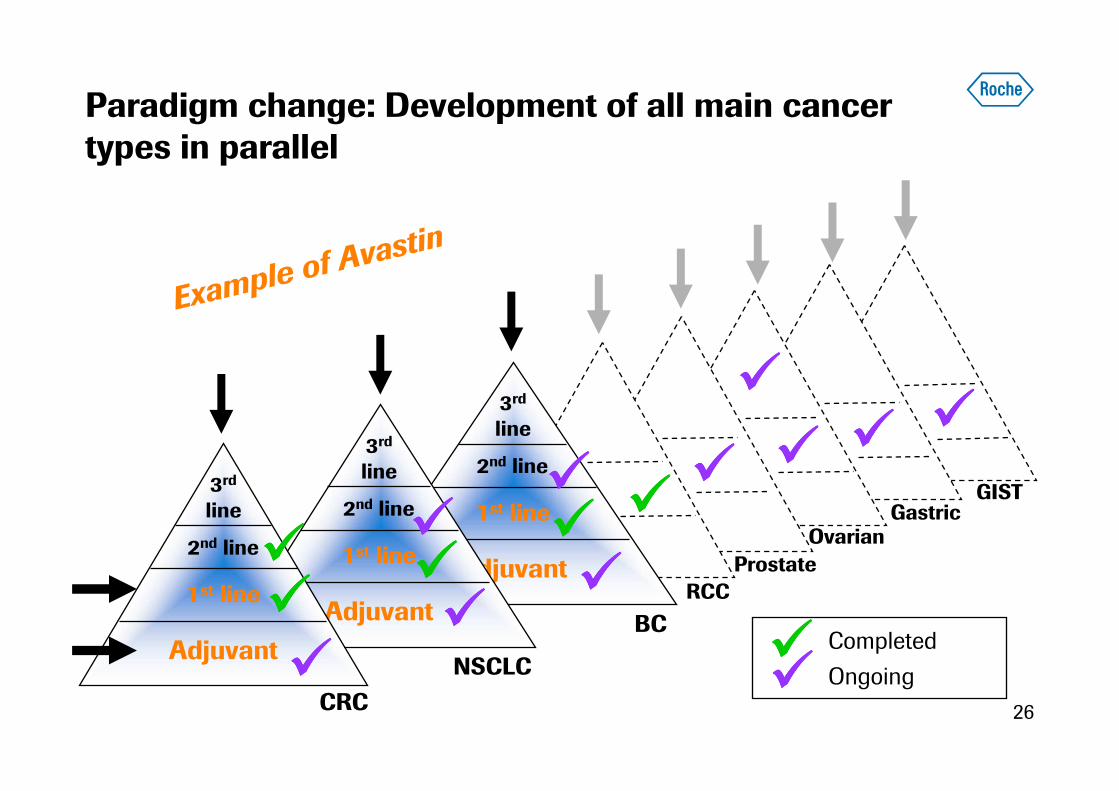
GIST
3rd
line
2nd line
1st line
Adjuvant
BC
3rd
line
2nd line
1st line
Adjuvant
NSCLC
Paradigm change: Development of all main cancer types in parallel
3rd
line
2nd line
1st line
Adjuvant
CRC
Completed
Ongoing
RCC
Prostate
OvarianGastric
��������
����
�������� ����
�������� ����
��������
����
��������
����
Example o
f Avastin
��������

27
Double-digit growth continues
Europe/RoW
• Continued strong increase in Avastin sales,
driven by strong uptake in mCRC and mBC
• Emerging markets contributing to
continued growth of MabThera, Herceptin
and Tarceva
Japan
• Strong launches of Avastin, Tarceva, and
adjuvant Herceptin
Oncology franchise approaches CHF 20 billion in sales
0.0
4.0
8.0
12.0
16.0
20.0
2004 2005 2006 2007 2008
Europe/RoW US Japan
local growth
+27 %
+9 %
+20 %
+15 %
Oncology sales(CHF billion)
53%
40%
7%

28
Exciting mid / early-stage opportunities in oncology
3rd generation anti-CD20- potential for improvement over MabThera based on Glycart technology
ADCC= (antibody dependent cell-mediated cytotoxicity); CDC= (complement dependent cytotoxicity)
Improved product features
Increased direct cell death
Increased ADCC
Lower CDC
Phase I in NHL
GA101: Phase II ongoingPhase I data presented at ASH 2009
Extended patent life for many other monocloncal antibodies?
MabThera
Herceptin
Pertuzumab.

29
Key drivers for long term development in place
Develop the short term drivers while not neglecting the long term opportunities
existing Earlier Phases
ILLUSTRATIVE
Inherent development risk
Maturity of portfolio
Low
High
Oncology
Inflammation
Metabolic
CNSVirology

30
Rheumatoid Arthritis: Not all patients respond to current therapy
Gold standard therapy anti-TNF + MTX
MTX alone
anti-TNF + MTX
anti-TNF alone
Only 1 of 3 patients receives significant benefit
% A
CR
70 R
espo
nder
s Unmet Medical Need
ACR 70====70%%%% Improvement in:
Disease activity – patientDisease activity – physicianPatient assessment of PainPhysical disabilityAcute phase reactants – CRP,ESR

31
Comprehensive development program in RA
Covers all treatment stages
ActemraTOWARD*(DMARDs IR)
RADIATE*(Anti-TNF IR)
MabTheraMIRROR*
(MTX IR, dose escalation)
SCORE**(DMARDs IR)
LITHE**(MTX IR, X-ray study)
current Tx paradigm
IMAGE**(MTX naive, X-ray study)
OPTION*(MTX IR)
REFLEX(Anti-TNF IR)
SERENE*(MTX IR)
AMBITION*(6 mnth MTX free/ MTX naive,
monotherapy)
NSAIDs or Cox-2 TNF inhibitors 2nd biologic(+/-MTX) (+/-MTX)
DMARDs
* Indication not yet approved, awaiting regulatory approval
** Phase III trial in progress

32
Key drivers for long term development in place
Develop the short term drivers while not neglecting the long term opportunities
existing Earlier Phases
ILLUSTRATIVE
Inherent development risk
Maturity of portfolio
Low
High
Oncology
Inflammation
Metabolic
CNSVirology

33
CD20 targeting: new treatment strategy for MS
Very promising signals from Phase II with rituximab
• Total cumulative mean number of
gadolinium lesions was reduced by 91
%, p<0.0001)
• Patients with relapses over 24 weeks in
the treated arm was 14.5 % compared
to 34.3 % in the placebo (58 percent
relative reduction, p = 0.0238)
Ocrelizumab: Phase II placebo-controlled program in RRMS

34
Performance up-date
Strategy
Main trends influencing long term value propositions
Summary

35
Roche Pharma pipeline overview
Focused on five Disease Biology Areas
MabThera
AvastinHerceptin
TarcevaPertuzumab
Oncology
Xeloda
ApomabApo2L/TRAIL
On HandPromising Late
StageEmerging Mid-Term
Early Stage
RA/Inflammation
Virology
R7128 HCV pol. Inh.
TamifluR3484 HPV16
Pegasys
R7227 HCV prot. inh.
R1594 ocrelizumab
9 ph. I compounds
ActemraMabThera
R667 RARγγγγ
16 ph. I compounds
R1507 (IGF-1R mAb)
R1583 GLP-1
Metabolic/CV
9 ph. I compoundsR1439 dual PPAR
R1658 CETP Inh.
CNS
4 ph. I compoundsR3487 Alzheimer’s
ocrelizumab RRMSR1678 Schizophrenia
R7159 3rd gen anti-CD20
Anti-CD40 mAbHedgehog inhibitor
T-DM1

36
Roche: M&D and G&A % to sales
Freeing up resources for innovation
20%
25%
30%
35%
40%
2002 2003 2004 2005 2006 2007
Roche (Prescription)
GSK
Sanofi-Aventis
Eli Lilly
AstraZeneca
Merck & Co.
Novartis

37
Investing into the future
R&D % to sales
10%
15%
20%
25%
2002 2003 2004 2005 2006 2007
Roche (Prescription)
GSK
Sanofi-Aventis
Eli Lilly
AstraZeneca
Merck & Co.
Novartis

38
Patent expiry 2008-2012
Roche short-/medium-term has the strongest patent protected portfolio… and highest share of biotech products
42
6962
54 51 48 4841
36
24
14
0
20
40
60
80
100
Total
Market
GSK
Pfizer
AZ
S-A J&J
MSD
Lilly
Novartis
Abbott
Roche
2008-2012 2013 & beyond
Source: IMS Health MIDAS Market Segmentation MAT June 2008, Ethical protected brand sales only.
SHARE OF PROTECTED SALES EXPIRING % US$
Top 10 Corporations Protected Sales Expiring to 2012 & Beyond (US$ Const)

39
Roche: A unique “investment case”
Clear and focused strategy
– Medically differentiated products
– Poised to become leader in Personalised Healthcare
Attractive risk profile
– Low generic risk; lowest among European large-cap players
Assets in place for sustained success
– World market leader in Oncology
– Emerging Rheumatology & Autoimmune, and Metabolic franchises
Industry-leading organic growth
Unique high-tech healthcare investment

40
We Innovate Healthcare

41
Personalised Healthcare
Benefit for industry
Today Future
Reduced Patient pool
Price increase /stability
Faster penetration
Better patient
compliance
Increased market share
Time to market, line extensions
Benefit from patient stratification

42
0%
5%
10%
15%
20%
25%
30%
35%
Q405
Q106
Q206
Q306
Q406
Q107
Q207
Q307
Q407
Q108
Q208
Q308
Q408
0%
5%
10%
15%
20%
25%
30%
35%
Q405
Q106
Q206
Q306
Q406
Q107
Q207
Q307
Q407
Q108
Q208
Q308
Q408
First line Second line
Source: Synovate Patient Monitor and Top-Up, Top-5 EU
Avastin
Patient share Patient share
Avastin
Avastin in mCRC: Strong uptake continues