a summary of studies - cdc.gov
TRANSCRIPT
DATA EVALUATION AND METHODS RESEARCH
A Summary of Studiesof Interviewing Methodology
A summary of methodological studies designed to test theeffectiveness of certain questionnaire designs and interviewingtechniques used in the collection of data on health events inhousehold interviews and to investigate the role of behaviors,attitudes, perceptions, and information levels of both the respond-ent and the interviewer.
DHEW Publication No. (H RA) 77-1343
U.S. DEPARTMENT OF HEALTH, EDUCATION, AND WELFAREPublic Health Service
Series 2Number 69
Health Resources AdministrationNational Center for Health Statistics
Rockville, Md. March 1977
Library of Congress Cataloging in Publication Data
Cannell, Charles F
A summary of research studies of intervimving methodology, 1959-1970.
(Vital and health statistics: Series 2, Data evaluation and methods rexmch; no. 69)(DHEW publication; no. (HRA) 77-1343)
Supt. of Dots. no.: HE 20.6209:2/69Bibliography: p.1. Health surveys. 2. Interviewing. 3. \ledical history taking. I. Ylarquis, Kent 11.,
joint author. II. Laurent, Andrd, joint author. HI. Title. IV. Series: United States. NationalCenter for Health Statistics. Vital and health statistics: Series 2, Data evaluation andmethods research; no. 69. V. Series: United States. Dept. of Health, Education, and Welfare.DHEW publication; no. (HRA) 77-1343. [DNLM: 1. hfedical history taking. W2 AN148vbno. 69]RA 409.U45 no. 69 312’.07’23s [312’.07’23]ISBN 0-8406 -0062-3 75-619406
For sale by t he Superintendent of Documents, U.S. Government Printing OfficeWashington, D. C. 20402- Price $1.45
Stock No. 017+12H1053M
NATIONAL CENTER FOR HEALTH STATISTICS
DOROTHY P. RICE, Director
ROBERT A. ISRAEL, Depu ty Director
JACOB J. FELDMAN, Ph.D., Associate Director for Analysis
GAIL F. FISHER, Associate Direc tor for the Cooperative Health Statistics System
ELIJAH L. WHITE, Associate Director for Data Systems
ANDERS S. LUNDE, Ph.D., Associate Director for International Statistics
ROBERT C. HUBER, Associate Director for Management
MONROE G. SIRKEN, Ph.D., Associate Director for Mathematical Statistics
PETER L. HURLEY, Associate Director for Operations
JAMES M. ROBEY, Ph.D., Associate Director for Program Development
PAUL E. LEAVERTON, Ph.D., Associate Director for Statistical Research
ALICE HAYWOOD, Information Officer
DIVISION OF HEALTH INTERVIEW STATISTICS
ROBERT R. FUCHSBERG, Director
PETER RIES, ph. D., Chief 12bzess and Dkability Statistics Branch
ROBERT A. WRIGHT, Acting ChieJ Utilization and Expenditure Statistics Branch
CLINTON E. BURNHAM, Chief Survey Pbrming and Development Branch
COOPERATION OF THE U.S. BUREAU OF THE CENSUS
In accordance with specifications established by the National HealthSurvey, the Bureau of the Census, under a contractual agreement, partici-pated in the design and selection of the sample, and carried out the first stageof the field interviewing and certain parts of the statistical processing.
Vital and Health Statistics - Series 2- No. 69
DHEW Publication No. (HRA) 77-1343
Library of Congress Catalog Card Number 75-619406
ii
PREFACEFor more than a decade the Survey Research Center of the
University of Michigan and the Division of Health InterviewStatistics of the National Center for Health Statistics (NCHS) havehad a continuous contractual arrangement for the investigation ofresponse problems in reporting health information in samplingsurveys.
The contract program, which started in the late 1950’s shortlyafter the initiation of the Health Interview Survey, began with aseries of validity studies in which sampIes drawn from medicalrecords were compared with data collected by interview. Thesestudies were designed to identify patterns of response bias as abasis for developing procedures to improve reporting. Theseinvestigations of levels of underreporting and characteristics ofresponse patterns were evaluated in terms of respondent status,the attitudes and behavior of the interviewer and the respondent,and nature of the events being reported. These studies arediscussed in the sections, “Behavior in Interviews,” and “Inter-viewer Performance Difference” of this publication.
The more recent studies, which have developed out of findingsof the preceding research, involved experimental proceduresdesigned to improve reporting. Investigated were such proceduresas the use of verbal reinforcement of the respondent, probing as amethod of improving memory and information retrieval, andvarying the length of questions in an attempt to increaserespondent participation in the interview. These studies aredescribed in the sections “The Use of Verbal Reinforcement inInterviews and Its Data Accuracy,” “Memory and InformationRetrieval in the Interview,” and “Question Length and ReportingBehavior in the Inte&ew” of this publication.
All but one of the NCHS studies summarized in this reporthave appeared as complete research reports in series 2 of Vital andHealth Statistics. The study by Cannell and Fowler (1963)1 onvalidity of reporting visits to physicians was not published in theseries. The second study of interviewer-respondent interactions byMarquis and Canne112 was done in 1969 under a contract with theDepartment of Labor, Manpower Administration. All others werecontracted for by NCHS. In addition, two NCHS studies notconducted by the Survey Research Center are frequently referredto here because they had as their subject some of the sameproblems of reporting: one in 1967 by W. G. Madow, the StanfordResearch Institute report published as Series 2-Number 233 ; andthe other in 1961 by E. Balamuth, et al., the Health InsurancePlan study, most recently published as Series 2-Number 74.
Because these studies have had considerable interestmethodologists and for survey researchers more generzdly, it
forwas
...Ill
thought useful to review them in a single volume so that thesequence of the major lines of inquiry could be followed. Thisreport does not include a review of literature nor does itattempt to integrate underlying theories. It does present thefindings in such a way as to make apparent their consistencies orinconsistencies, and does discuss some underlying hypotheses. Thiscompilation also allows more emphasis to be placed on interpreta-tion and explanation than was possible in the individual presenta-tions.
In the concluding sections of this report the findings of
the several studies are synthesized, a model of reporting isdeveloped, and a description is offered of how the researchperformed at the Survey Research Center (SRC) has been appliedto collection procedures used in the Health Interview Survey (HIS)to improve the quality of the collected data.
Since these studies were completed, much additional method-ological work has been conducted by the Survey Research Centerfocusing on experimental procedures for improving the validity ofreporting. This newer research at times confirms findings in thisreport, provides further support for these hypotheses and, attimes, runs counter to some of the conclusions. Some of thesefindings can be found in a forthcoming report, “Experiment inInterviewing Techniques,” summarizing research conducted bySRC for the National Center for Health Services Research.
The contractual relationship between the SRC and the HISdoes not consist solely of a financial arrangement; much of theresearch is the cooperative work of the two organizations. TheBureau of the Census has also been an active participant in severalof the studies, both in the planning and data collection phases.
Charles F. CannellProgram Director,Survey Research Center,University of Michigan
ACKNOWLEDGMENTSIn a cooperative and integrated research program it is difficult
to acknowledge the contribution of alI participants. This isespecially true of this project because the studies have extendedmore than a decade and the research staff has changed during thattime. In addition to the authors, others who have had majorresponsibility in one or more of the studies include Mr. ThomasBakker, Professor Gordon Fisher, Floyd Fowler, Ph.D., andThomas deKoning, Ph.D. Special assistance in the preparation ofthe manuscripts was provided by Linda Winter and Marion Wirick.
v
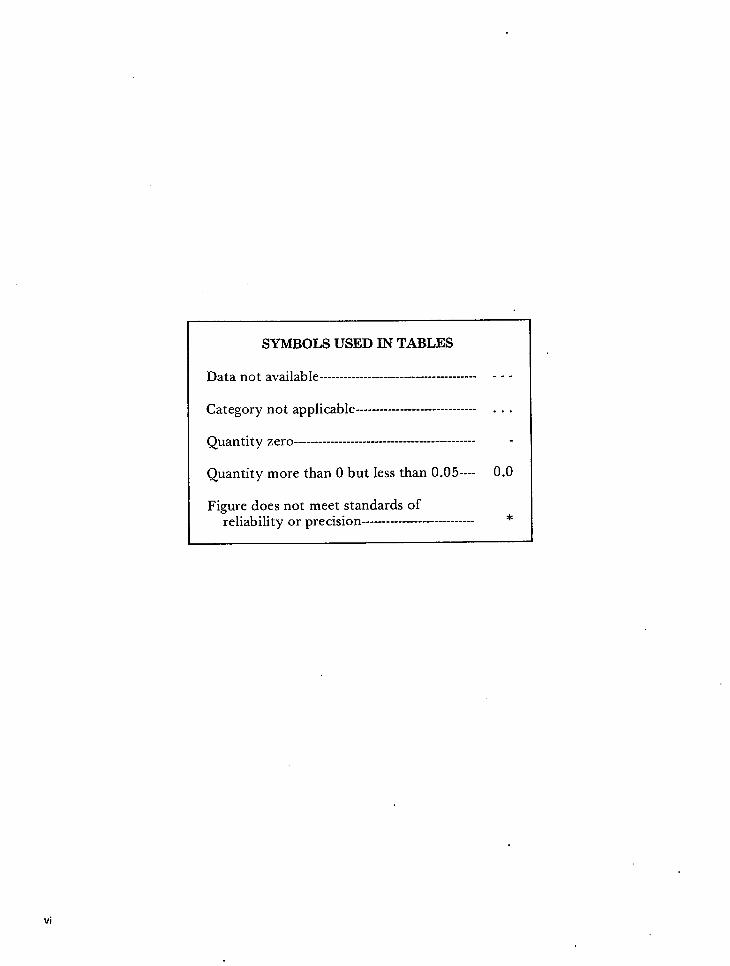
SYMBOLS USED IN TABLES
I Data not available --------------------------------------- --- ICategory not applicable ------------------------------ . . .
I Quantity zero --------------------------------------------- - IQuantity more than O but less than 0.05---- 0.0
Figure does not meet standards ofreliabilityy or precision ---------------------------- *
CONTENTS
Page
Preface . . . . . . . . . . . . . . . . . . . . . . . . . . . . . . . . . . . . . . . . .
Acknowledgments . . . . . . . . . . . . . . . . . - +...-.-.. --------
Introduction . . . . . . . . . . . . . . . . . . . . . . .- . . . . . . . . . .. . . .UnderstandingtheInterviewProcess . . . . . . . . . . . . . . . . . . . . . . . . .
InfluenceoftheInterviewer . . . . . . . . . . . . . . . . . . . . . . . . - .Response Error . . . . . . . . . . . . . . . . . . . . . .. . .- . . . . . . .Problems of Recall and Information Retrieval . . . . . . . . . . . . . . . . .Bias Introduced Through Interviewer Feedback . . . . . . . . . . . . . . . .Research Needs . . . . . . . . . . . . . . . . . . . . . . . . . . . . . . . . .
Studies of Underreporting of Health Events in the Household Interview . . . . . . . .Underreporting and Characteristics of Health Events . . . . . . . . . . . . . . . .
Effect of Elapsed Time on Reporting . . . . . . . . . . . . . . . . . . . . . .Effect of Impact of the Event Upon Reporting . . . . . . . . . . . . . . . . .Effect of Social and Personal Threat Upon Reporting . . . . . . . . . . . . .Summary . . . . . . . . . . . . . . . . . . . . . . . . . . . . . . . . . . . .
Underreporting and Characteristics of Respondents . . . . . . . . . . . . . . . . .Age of Respondent . . . . . . . . . . . . . . . . . . . . . . . . . . . . . . .Sex of Respondent . . . . . . . . . . . . . . . . . . . . . . . . . . . . . . .Education of Respondent . . . . . . . . . . . . . . . . . . . . . . . . . . . .Family Income of Respondent.. . . . . . . . . . . . . . . . . . . . . . . .Color of Respondent . . . . . . . . . . . . . . . . . . . . . . . . . . . . . .Reporting for Self Versus Reporting for Other Family Member . . . . . . . .Conclusions . . . . . . . . . . . . . . . . . . . . . . . . . . . . . . . . . . .
Behavior in Interviews . . . . . . . . . . . . . . . . . ...”. . . . . . . . . . . . .Health Interview Survey Observation Study . .,. . . . . . . . . . . . . . . . . . .
Health Interview Survey Data.... . . . . . . . . . . . . . . . . . . . . . .Observation . . . . . . . . . . . . . . . . . . . . . . . . . . . . . . . . . . .Interviewer Ratings of the Respondent . . . . . . . . . . . . . . . . . . . . .Reinterview With the Respondent . . . . . . . . . . . . . . . . . . . . . . .Interview With the Health Interviewer . . . . . . . . . . . . . . . . . . . . .Results . . . . . . . . . . . . . . . . . . . . . . . . . . . . . . . . . . . . .
Urban Employment Survey Behavior Interaction Study . . . . . . . . . . . . . . .New Coding Scheme . . . . . . . . . . . . . . . . . . . . . . . . . . . . . .Main Findings . . . . . . ...’. . . . . . . . . . . . . . . . . . . . . . . . .
Interviewer Performance Difference: Some Implications for Field Supervision andTraining . . . . . . . . . . . . . . . . . . . . . . . . . . . . . . . . .......
Conclusions and Discussion.. . . . . . . . . . . . . . . . . . . . . . . . . . .
...m
v
1112234
45589
111111131314151516
1717171819191919222222
3036
vii
Page
The Use of Verbal Reinforcement in Interviews and Its Data Accuracy . . . . . . . . 37Research on Interviewer Reinforcement . . . . . . . . . . . . . . . . . . . . . . . 38
Operant Conditioning Studies With Verbal Reinforcement . . . . . . . . . . . 38Effects of Feedback on Amount Reported . . . . . . . . . . . . . . . . . . . 38Useof Feedback To Increase Accuracy . . . . . . . . . . . . . . . . . . . . . 39Use of Feedback in a Nonexperimental Interview . . . . . . . . . . . . . . . 42Discussion . . . . . . . . . . . . . . . . . . . . . . . . . . . . . . . . ...42
Three Kinds of Interviewer Verbal Reinforcement Effects . . . . . . . . . . . . . . 43Cognitive Effects of Reinforcement . . . . . . . . . . . . . . . . . . . . . . 43Conditioning Effects of Reinforcement . . . . . . . . . . . . . . . . . . . . . 46Motivational Effects of Reinforcement . . . . . . . . . . . . . . . . . . . . . 48
Experimental Study . . . . . . . . . . . . . . . . . . . . . . . . . . . . . . ...50
Memory and Information Retrieval in the Interview . . . . . . . . . . . . . . . . . . 52The Inadequate Search Hypothesis . . . . . . . . . . . . . . . . . . . . . . . . . . 52An Integrative Hypothesis: Cognitive Inadequacy of Stimuli Questions . . . . . . . 53Design of an Experimental Interviewing Approach . . . . . . . . . . . . . . . . . . 53
The Extensive Questionnaire.. . . . . . . . . . . . . . . . . . . . . . ...55Control Questionnaire . . . . . . . . . . . . . . . . . . . . . . . . . . ...55Field Experiment . . . . . . . . . . . . . . . . . . . . . . . . . . . . . . . . . ...56Dependent Vmiables . . . . . . . . . . . . . . . . . . . . . . . . . . . ...56Hypothesis . . . . . . . . . . . . . . . . . . . . . . . . . . . . . . . . ...56Results and Discussion . . . . . . . . . . . . . . . . . . . . . . . . . . . ...57Conclusions . . . . . . . . . . . . . . . . . . . . . . . . . . . . . . . . ...59
Question Length and Reporting Behavior in the Interview: PreliminaryInvestigations . . . . . . . . . . . . . . . . . . . . . . . . . . . . . . . . . ...60
Empirical Findings on Behavior Matching in the Interview . . . . . . . . . . . . 61Hypotheses About the Effects of Question Length on Reporting Behavior . . . . 61Experiment I: Effects of Question Length on Answer Duration and
Reporting Frequency . . . . . . . . . . . . . . . . . . . . . . . . . . . ...62Questionnaire Procedures . . . . . . . . . . . . . . . . . . . . . . . ...62Field Procedures . . . . . . . . . . . . . . . . . . . . . . . . . . . . ...63Dependent Variables . . . . . . . . . . . . . . . . . . . . . . . . . . . . .&IResults and Discussion . . . . . . . . . . . . . . . . . . . . . . . . . ...64
Experiment II: Effects of Question Length on Vflldity of Report . . . . . . . 66Results and Discussion . . . . . . . . . . . . . . . . . . . . . . . . . ...67Conclusions . . . . . . . . . . . . . . . . . . . . . . . . . . . . . . ...70
References . . . . . . . . . . . . . . . . . . . . . . . . . . . . . . . . . . . . ...72
Appendix. Application of Survey Research Center Findings to HealthInterview Survey Procedures . . . . . . . . . . . . . . . . . . . . . . . . . . ...75
Recall of Health Events . . . . . . . . . . . . . . . . . . . . . . . . ...75Effective Probing for Health Events . . . . . . . . . . . . . . . . . . . . . 76Interviewer-Respondent Communication . . . . . . . . . . . . . . . . . . 77Other Considerations . . . . . . . . . . . . . . . . . . . . . . . . . . ...77
...Vlll
A SUMMARY OF STUDIESOF INTERVIEWING METHODOLOGY
Charles F. Cannell, Kent H. Marquis, and Andr6 Laurent,Survey Research Center, Institute for Social Research The University of Michigan
INTRODUCTION
Survey interviewing as a technique of datacollection has developed from early attempts tocollect simple demographic information to thecurrent more sophisticated inquiries concerningattitudes, motives, and a wide variety of factualinformation. Despite the increasingly complexdem,ands on the survey interview, methodologiesfor question construction and interviewer be-havior have not changed a ~eat deal.
Much research on interview method has beendirected to the general problems of underreport-ing, to inaccuracies in interview data due tointerviewer bias or response error, and to theproblems of recall and information retrieval. Theinadequacies of the interview method have beenwell documented and the need for improvedtectilques in data collection is readily apparent.However, little has been done toward perfectingthe interview procedure as a method of datacollection.
One reason interviewing techniques have ad-vanced slowly may be that interviewing has nocomprehensive theory to draw upon for cause-and-effect relationships. Ideas about effectivequestioning must be drawn from fragments ofpsychological theory or, more often, from folk-lore, experience, and common sense. Beforemajor advances can be made, it is necessary tolearn more about what happens in the interviewsituation and to develop some theories about thecause-and-effect sequences that occur. In severalstudies of experimental interviewing techniques
and their effect on reporting behavior describedin this publication, an attempt has been made toidentify the elements of the interview processthat are potential sources for improving datacollection.
UNDERSTANDINGTHE INTERVIEW PROCESS
lnf Iuence of the Interviewer
Early attempts to investigate inaccuratereporting in interview surveys were focusedprimarily on the interviewer. Results of theseearly studies suggested that the interviewer’sattitudes, expectations, background, and physi-cal characteristics introduced important sourcesof bias into the household interview.
In a 1929 pioneer study of interviewer effectreported by Stuart Rice,s it was found thatinterviewers who were prohibitionists werelikely to ascribe the sad pIight of destituterespondents to the excessive use of alcohol,while socialist interviewers attributed indigencyof their respondents to generally bad economicconditions.
The influence of interviewer expectations onthe interview process was demonstrated in 1942by Stanton and Baker.G Respondents wereshown 6 geometric designs and were later askedin an interview to select from 12 designs the 6which they had seen previously. The inter-
1
viewers were given “inside information” aboutwhich designs were originally shown to respond-ents, but were purposely told the wrong sixdesigns. During the interview, the designs whichthe interviewers thought were the correct oneswere identified more often than the designsoriginally shown to the respondents.
Another type of study demonstrated a lessdirect, but still powerful interviewer effect.Katz7 found in 1942 that interviewers fromworking-class backgrounds consistently obtainedmore radical opinions, both social and political,from respondents than did interviewers from themiddle class. Robinson and Rohde8 conducted astudy in 1946 on attitudes toward Jews in whichinterviewers in one group were Jewish in appear-ance and those in another group appeared to benon-Semitic. The Jewish-appearing interviewersobtained significantly fewer reports of anti-Semitic attitudes than did the interviewers whoappeared to be non-Semitic.
Response Error
In a household interview, a respondent can beexpected to provide information: (a) that per-tains to items about which he is knowledgeable;(b) that he can remember at the time of theinterview; and (c) that he is willing to report toan interviewer. Underreporting or inaccuracies inreporting on the part of a respondent may resultfrom lapses in any or all of these three cate-gories.
Myersg published data in 1940 from the 1930decennial census that showed a suspiciouspattern of reported ages ending in zero (30, 40,50, etc.). In the 1930’s Twila Neelyl 0 foundthat one out of every nine families receiving cityrelief failed to report this fact. Perry andCrossleyl 1 published data in 1950 showing thata comparison of interviews with agency recordsproduced significant differences on such items asvoting and registration, contributions to theCommunity Chest, age, and ownership of alibrary card.
Validity studies comparing data obtainedfrom interviews with data obtained from objec-tive records show discrepancies between the twosources of irlformation for topics such as bankaccountsl Z~13 ; airplane trips 14; pediatric his-
toryl 5 ; work historyl 6 ; and publichealth.t,A,17,1s
One way to interpret underreporting on thepart of the respondent is to consider it aconsequence of poor memory. The disusetheory, described by Thorndikel 9 in 1913 inaccordance with the findings in 1885 of Ebbing-haus,z 0 suggests that events from the moredistant past are more likely to be forgotten thanare recent events. Thorndike assumed that thesheer passage of time brings about a weakeningof the memory trace. Similarly, one could derivefrom the Gestalt theoryz 1YZz a prediction of thehigh probability of the respondent to forgetevents of low impact, particularly with thepassage of time.
There is, however, another theory of forget-ting. According to McGeoch,z 3 who first ( 1’932)explicity stated the basic ideas of the moderninterferences theory later (1961 ) expounded byPostman,z 4 forgetting does not occur in anabsolute sense. Information does not disappearfrom memory but may be more difficult toretrieve from storage because of competingassociations or interferences. Only the accessi-bility of information declines, resulting, in a“lessening probability of retrieval from thestorehouse. $>i?5 Thjs would indicate that m-d=
reporting is a problem of retrieval, and thatreporting can be improved by manipulatingconditions that facilitate the recall of informa-tion.
Problems of Recall and Information Retrieval
There are two critical stages for a respondentwho is asked to report information from mem-ory. First, he has to search for and retrieve therequested information from his memory; thenhe has to transmit this information to aninterviewer. While performance may vary ac-cording to the level of the respondent’s generalmotivation or dedication to the role, it is usefulto think of recalling and reporting as twospecific variables that can affect the accuracy ofdata. For example, underreporting may resultfrom failure of recall or from failure of com-munication. An example of the latter case is thetendency of the respondent to withholdthreatening or embarrassing information.z 6 Afertile field for study is the type of underreport-
2
ing that results from the failure of the cognitiveprocesses in searching for and retrieving informa-tion from memory.
The three major activites of the interviewerare: (a) question asking, (b) probing, and (3) giv-ing feedback. If a question is not properlyworded, the probability y of obtaining accuratedata is low. A question that is improperlyworded, inserted out of context, or that conveysto the respondent the type of answer the inter-viewer wants can produce data that are biased.Probing refers to repetition or rephrasing of aquestion or the addition of a new question toobtain an adequate response when a previousresponse has not been adequate. The problem ofintroducing unwanted bias into the data throughprobing is solved by distinguishing betweendirective and nondirective probes. Interviewerfeedback consists of evaluative statements thatthe interviewer makes after the respondentanswers a question. These statements may con-sist of verbalizations indicating approval, atten-tion, or understanding, varying from a simple“Um-hmm/’ acknowledging the successful com-munication of an answer, to an elaborate rein-forcement of the respondent’s behavior.
Several classic experimental studies havedemonstrated that simple positive verbal rein-forcement can have marked effects on adultperformance. Taffe127 in 1955 gave his experi-mental subjects a pack of 3-inch-by-5-inch cardseach containing a single verb in the simple pasttense as well as a list of six pronouns. Heinstructed each subject to form a sentence fromeach card beginning with any of the pronounsand using the verb. In the first part of thesession, during which the experimenter remainedsilent, the subject showed a preference for usingeach of the pronouns on the card. In the secondpart of the session the task remained the samefor the subjects, but the experimenter said“Um-hmm” or “All right” whenever the subjectsused either the pronoun “I” or “we” in con-structing a sentence. Consequently, the rate ofusing “I” or “we” increased significantly duringthe second part of the session.
Research by Greenspoon28 showed that ver-bal reinforcement after a respondent mentioneda plural noun in a free-association test increasedthe rate at which plural nouns were named.
Another method of demonstrating the effects ofverbal reinforcement involves the occurrence ofcertain kinds of behavior in a casual conversa-tion setting. Verplanckz 9 in 1955 was apparent-ly the first to publish results from this type ofstudy. However, subsequent research30 indicatesthat the conditioning effect obtained was prob-ably due to several extraneous variables (pri-marily experimenter cheating, conscious orunconscious) in using the procedures or report-ing the data. More recently, Centers31 hassuccessfully shown that with great care, one canobtain an increase in the rate with which aperson gives opinion statements in a conversa-tion setting if such statements are reinforced byanother person.
In 1962, Kanfer and McBrearty3 Z interviewed32 female undergraduates about 4 predeter-mined topics. During the first part of theinterview, in which the women were handedcards designating four topics and asked to talkabout each, the experimenter remained silent.During the second part of the session theexperimenter reinforced the respondent when-ever she talked about a predetermined two ofthe four possible topics. Reinforcement con-sisted of a posture of interest, including smiles,and the phrases “I see,” “Um-hmm,” and“Yes.” During the second phase of the experi-ment the students spent more time talking aboutthe reinforced topics than about those that hadnot been reinforced.
Bias Introduced Through Interviewer Feedback
The foregoing studies indicate that inter-viewer feedback may have important effects onthe amount of information reported, but theyreveal very little about how different kinds offeedback procedures affect interview data.
Hildrum and Brown33 were the first investi-gators to show systematically, in a surveyinterview setting, that interviewer feedback canproduce response bias. Two groups of 10Harvard University students were telephonedand asked their opinions about Harvard Univeri-sity’s philosophy of general education. Onegroup was reinforced by the investigators (whoused the word “Good”) each time a favorablecomment was made, and the other group wasreinforced after each unfavorable comment.
3
Responses of the group reinforced for positiveopinions were significantly more favorable to-ward Harvard’s philosophy of general educationthan those of the group receiving reinforcementfor unfavorable comments. Interviewer feedbackapplied in this systematic way produced a majordistortion in the overall attitude responses.
In 1957, Nuthman3,4 asked two groups ofcollege students a series of questions aboutthemselves. In one group the experimenter said“Good” when the respondent answered a ques-tion in a way that indicated self-acceptance. Theother group was given no reinforcement.Respondents who received reinforcement forself-acceptance responses gave more answers ofthis kind than did the group that was notreinforced.
A. W. Staats and his colleagues have doneseveral studies in this general area. In a 1962study~s the experimenter said “Good,” “Verygood,” or “That’s fine” whenever the respond-ent scored in a positive direction on sociabilityitems. Another group was given the same inter-view but no reinforcement. Staats et al. foundthat the group receiving the reinforcementscored significantly higher on the sociabilityscale than did the group not receiving reinforce-ment. Studies by Singers G and Insko3 T followed
&
these general kinds of experimental designs andobtained similar results.
Research Needs
One of the conclusions that can be drawnfrom this background information on the inter-view process is that research on the improve-ment of reporting can fruitfully be devoted tothe cause-and-effect relationship between theoccurrence of different kinds of behavior orpatterns of behavior and the validity of datareported. The behavior that occurs during theinterview situation includes not only that of theindividual interviewer and respondent, but alsothat involved in the interaction between thetwo. Behavior may be motivated by controlledinterviewer feedback, techniques designed tofacilitate recall, verbal reinforcement, and aneffective interviewing instrument, namely, thequestionnaire.38 >3g
Obtaining good information in an interview isnot simply a matter of asking many questions.More must be learned about the basic principlesof memory and retrieval in order to provide abetter understanding of the way ,in ‘whichinformation is stored and to devise more effec-tive ways of retrieving that information.
STUDIES OF UNDERREPORTING
OF HEALTH EVENTS IN THE HOUSEHOLD INTERVIEW
This section summarizes some major findingsof validity studies about the reporting of healthevents and health-related behavior in thehousehold interview. It focuses primarily onunderreporting, since health events are morelikely to be underreported than overreported.Estimates of the magnitude of bias in surveysand calculations of correction indexes for dataanalysis are not kcluded in this discussion, sincethe studies show only underreporting bias, notnet bias.
The five major studies discussed here wereconducted for the National Center for HealthStatistics. Their focus was not on the inter-viewer, but on the characteristics of the
respondents and their reporting patterns. Partic-ular attention was also paid to the nature of theinformation being reported. In five studiessimilar questionnaires and comparable interview-ing procedures were used, and the reports ofrespondents were compared with independentrecords assumed to be valid. The studies areidentified as follows:
. HIP: a study of the Health Insurance Planof Greater New York, in which interviewreports were compared with medicalrecords;4
. SRC: Three studiesl z1Tj18 conducted bythe Survey Research Center, in two of
4
.
which reports of hospitalizations werecompared with hospital dischargerecords,l 7Y18 and a third in which reportsof physician visits were compared withclinic records;lSRI: a study carried out by the StanfordResearch Institute in which respondentreports were checked against physicianrecords.=~
Since the studies were designed to investigatevalidity of reporting and were directed towardprobIems of underreporting, they were based onsamples of records of presumed high accuracy.Hospital discharge records, clinic records, andphysicians’ records were used as sample frames.Samples were usually weighted for certaincharacteristics and in some cases certain types ofrecords were omitted from the sample. (Forexample, in the second SRC study of hospitali-zation reporting,l 8 normal deliveries wereomitted and the sample was weighted withhospitalizations of more than 3-months’ dura-tion.)
In each of these studies, interviewers weregiven, the family names and addresses of therespondents. Usually a dummy sample was alsodrawn from the phone book or city directory tohelp disguise the aims of the study. Interviewerswere toId that the study was special, but werenot told its purpose. Formal inquiry conductedafter the studies were completed showed that inno case had an interviewer guessed the study’strue purpose.
Interviewers were either experienced in theHealth Interview Survey of the National HealthSurvey, or were given a 2-week intensive trainingsession. Standard interviewing techniques of theHealth Interview Survey were used in thesestudies. While the questionnaires differed insome ways, they were alI essentially the same asthose used in the Health Interview Survey.
In four of the studlesl~4~17Y18 the usualprocedure of using proxy respondents wasfollowed. The interviewer personally questionedall adults who were home at the time and used aproxy respondent for all adults not present and
‘A more recent report from thk study is VitaI und HealthStatistics, Series 2, No. 57.
for all children. One study (SRI)3 included onlyself-respondents.
The analysis consisted of matching reportsfrom the interview with information containedin the medical records. The first part of theanalysis involved an examination of therelationship between the characteristics of thehealth events investigated and the patterns ofunderreporting. The second part of the analysiswas confined to the relationship betweencharacteristics of the respondents and patternsof underreporting.
UNDERREPORTING AND CHARACTERIS-TICS OF HEALTH EVENTS
Effect of Elapsed Time on Reporting’
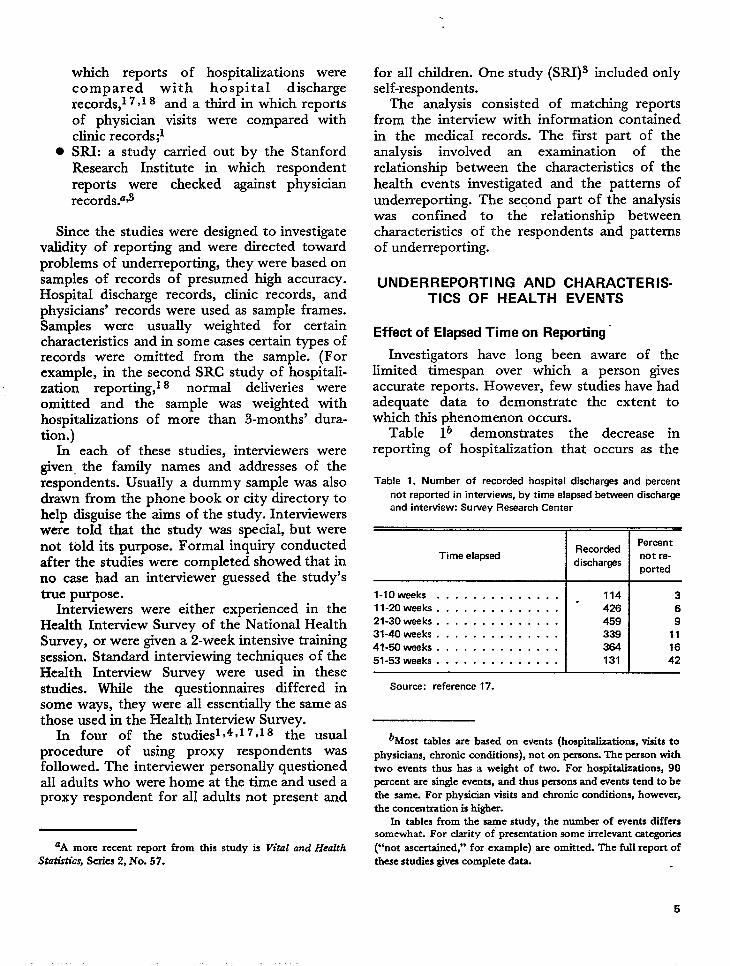
Investigators have long been aware of thelimited timespan over which a person givesaccurate reports. However, few studies have hadadequate data to demonstrate the extent towhich this phenomenon occurs.
Table lb demonstrates the decrease inreporting of hospitalization that occurs as the
Table 1. Number of recorded hospital discharges and percent
not reported in interviews, by time elapsed between dischar~
and interview: Survey Research Center
Time elapsed
l-lOweeks . . . . . . . . . . . . . .
ll-mweeks. . . . . . . . . . . . . .
21-30 weeks . . . . . . . . . . . . . .
31-40 weeks . . . . . . . . . . . . . .
41-50 weeks . . . . . . . . . . . . . .
51-53 weeks . . . . . . . . . . . . . .
Source: reference 17.
Recorded
discharges
114
426
459
339
364
131
—
Percent
not re-
ported
3
6
9
11
16
42
bMost tables are based on events [hospitalizations, visits to
physicians, chronic conditions), not on &ons. The ~“kon withtwo events thus has a weight of two. For hospitalizations, 90percent are single evcrsts, and thus persons and events tend to bethe same. For physician visits and chronic conditions, however,the conccntr-ation is higher.
In tables from the sarpe study, the number of events differssomewhat. For clarity of presentation some imelevant categories
(“not asccrtainedj’ for example) are omitted. The full report ofthese studies gives complete data.
5
interval increases between the date of the eventand the date of the interview. This appears to bea typical “forgetting” curve in which failure toreport an event grows as time passes. The samecurves are evident for both male and femalerespondents. The curve rises more slowly forself-reports than for reports given by anotherfamily member. Both SRC studies of hospitaliza-tion 7 ~ 18 showed very similar patterns.
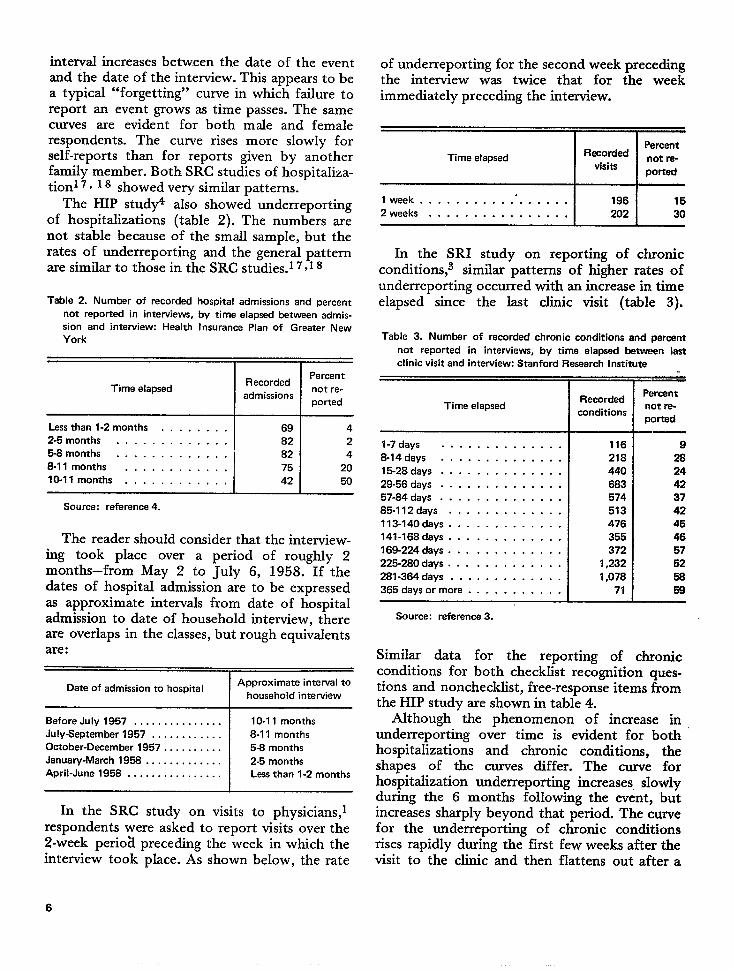
The HIP study4 also showed underreportingof hospitalizations (table 2). The numbers arenot stable because of the small sample, but therates of underreporting and the general patternare similar to those in the SRC studies.1 7, I g
Table 2. Number of recorded hospital admissions and percent
not reported in interviews, by time elapsed between admis-
sion and interview: Health Insurance Plan of Greater New
York
RecordedPercent
Time elapsed not re-admission
ported
Source: reference 4.
The reader should consider that the interview-ing took place over a period of roughly 2months–from May 2 to July 6, 1958. If thedates of hospital admission are to be expressedas approximate intervals from date of hospitaladmission to date of household interview, thereare overlaps in the classes, but rough equivalentsare:
Date of admission to hospital IApproximate interval to
household interview
Before July 1957 . . . . . . . . . . . . . . . 10-11 months
July-September 1957 . . . . . . . . . . . . 8-11 months
October-December 1957 . . . . . . . . . . 5-8 months
January -March 1958 . . . . . . . . . . . . . 2-5 months
April-June 195B . . . . . . . . . . . . . . . . Less than 1-2 months
In the SRC study on visits to physicians,lrespondents were asked to report visits over the2-week perio~ preceding the week in which theinterview took place. As shown below, the rate
of underreporting for the second week precedingthe interview was twice that for the weekimmediately preceding the interview.
Time elapsed IIPercent
Recordednot ra-
visitsported
I week . . . . . . . . ...”.... . . 196 15
2 weeka . . . . . . . . . . . . . . . . 202 30
In the SRI study on reporting of chronicconditions,a similar patterns of higher rates ofunderreporting occurred with an increase in timeelapsed since the last clinic visit (table 3).
Table 3. Number of recorded chronic conditions and percent
not reported in interviews, by time elapsed between last
clinic visit and interview: Stanford Research Institute
Time elapsed
l-7days . . . . . . . . . . . . . .
B-14days . . . . . . . . . . . . . .
15-28 days . . . . . . . . . . . . . .
29-56 days . . . . . . . . . . . . . .
57-84 days . . . . . . . . . . . . . .
85-112days . . . . . . . . . . . . .
113-140days . . . . . . . . . . . . .
141-168 days . . . . . . . . . . . . .
169-224 days . . . . . . . . . . . . .
225-280 days . . . . . . . . . . . . .
281-364 days . . . . . . . . . . . . .
365days ormore . . . . . . . . . . .
Source: reference 3.
Recorded
conditions
116
218
440
683
!574
513
476
355
372
1,232
1,078
71
.—.—Percent
not re-
ported——
9
28
24
42
37
42
45
46
57
62
58
68.—
Similar data for the reporting of chronicconditions for both checklist recognition ques-tions and nonchecklist, free-response items fromthe HIP study are shown in table 4.
Although the phenomenon of increase inunderreporting over time is evident for bothhospitalizations and chronic conditions, theshapes of the curves differ. The curve forhospitalization underreporting increases slowlyduring the 6 months folIowing the event, ‘butincreases shardv bevond that period. The curvefor the und&r~por;ing ofrises rapidly during the firstvisit to the clinic and then
chronic conditionsfew weeks after theflattens out after a
6
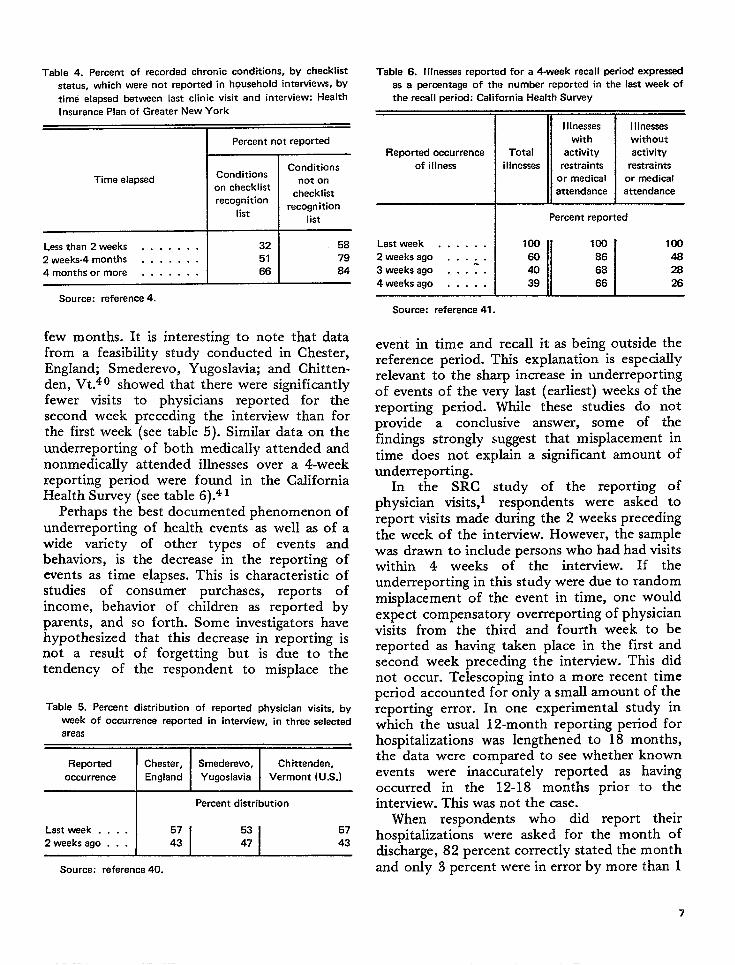
Table 4. Percent of recorded chronic conditions, by checklist
status, which were not reported in household interviews, by
time elapsed between last clinic visit and interview: Health
Insurance Plan of Greater New York
I Percent not reported
ConditionsConditions
Time elapsed not onon checklist
checklistrecognition
listrecognition
list
Lessthan2 weeks . . . . . . . 32 58
2 weeks-4 months . . . . . . . 51 79
4monthsor more . . . . . . . 66 84
Table 6. I Ilnessas reported for a 4-week recall period expressed
as a percentage of the number reported in the last week of
the recall period: California Health Survey
Illnesses
with
Reported occurrence Total activity
of illness i IInesses restraints
or medical
attendance
Percent reported
Lastweek . . . . . . 100
II I100100
2 weeks ago . . . . . 60 86 48
3 weeks ago . . .:. 40 66 284weeks ago . . . . . 39 66 26
Source: reference 4.Source: refarence 41.
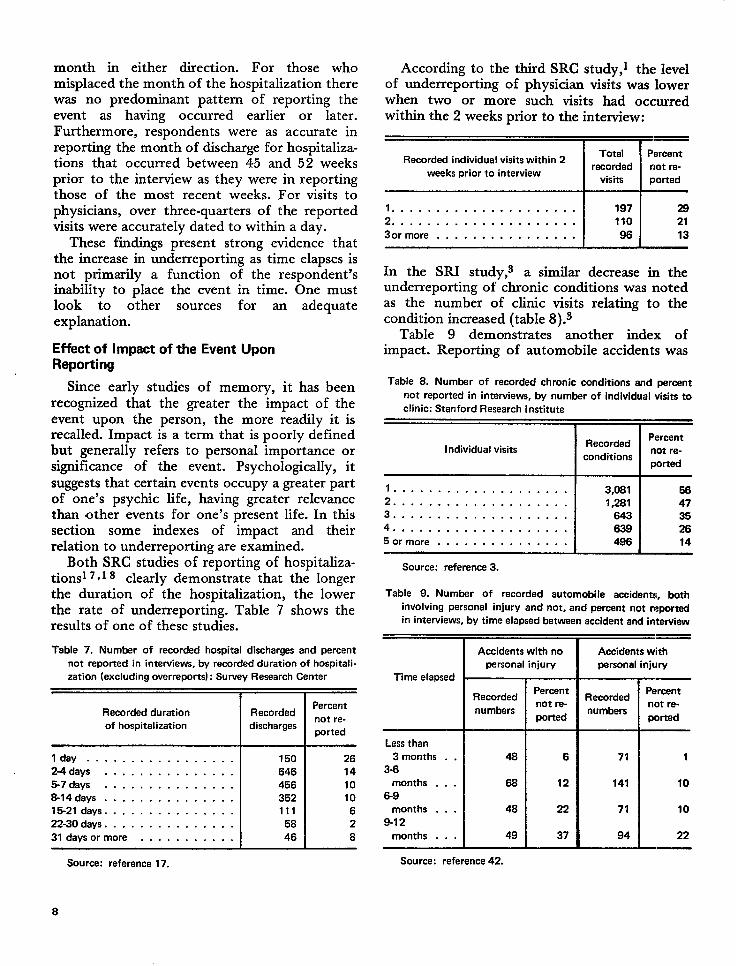
few months. It is interesting to note that datafrom a feasibility study conducted in Chester,England; Smederevo, Yugoslavia; and Chitten-den, Vt.40 showed that there were significantlyfewer visits to physicians reported for thesecond week preceding the interview than forthe first week (see table 5). Similar data on theunderreporting of both medically attended andnonmedically attended illnesses over a 4-weekreporting period were found in the CaliforniaHealth Survey (see table 6).4 1
Perhaps the best documented phenomenon ofunderreporting of health events as well as of awide variety of other types of events andbehaviors, is the decrease in the reporting ofevents as time elapses. This is characteristic ofstudies of consumer purchases, reports ofincome, behavior of children as reported byparents, and so forth. Some investigators havehypothesized that this decrease in reporting isnot a result of forgetting but is due to thetendency of the respondent to misplace the
Table 5. Percent distribution of reported physician visits, by
week of occurrence reported in interview, in three selected
areas
Reported IChester, ISmederevo, Chittenden,
occurrence England Yugoslavia Vermont (U.S.)
I Percent distribution
Last week . . . . 57
2 weeks ago . . . 43
Source: reference 40.
I Ilnesses
without
activity
restraints
or medical
attendance
event in time and recall it as being outside thereference period. This explanation is especiallyrelevant to the sharp increase in underreportingof events of the very last (earliest) weeks of thereporting period. While these studies do notprovide a conclusive answer, some of thefindings strongly suggest that misplacement intime does not explain a significant amount ofunderreporting.
In the SRC study of the reporting ofphysician visits, 1 respondents were asked toreport visits made during the 2 weeks precedingthe week of the interview. However, the samplewas drawn to include persons who had had visitswithin 4 weeks of the interview. If theunderreporting in this study were due to randommisplacement of the event in time, one wouldexpect compensatory overreporting of physicianvisits from the third and fourth week to bereported as having taken place in the first andsecond week precedkg the interview. This didnot occur. Telescoping into a more recent timeperiod accounted for only a small amount of thereporting error. In one experimental study inwhich the usual 12-month reporting period forhospitalizations was lengthened to 18 months,the data were compared to see whether knownevents were inaccurately reported as havingoccurred in the 12-18 months prior to theinterview. This was not the case.
When respondents who did report theirhospitalizations were asked for the month ofdischarge, 82 percent correctly stated the monthand only 3 percent were in error by more than 1
7
month in either direction. For those whomisplaced the month of the hospitalization therewaa no predominant pattern of reporting theevent as having occurred earlier or later.Furthermore, respondents were as accurate inreporting the month of discharge for hospitaliza-tions that occurred between 45 and 52 weeksprior to the interview as they were in reportingthose of the most recent weeks. For visits tophysicians, over three-quarters of the reportedvisits were accurately dated to within a day.
These findings present strong evidence thatthe increase in underreporting as time elapses isnot primarily a function of the respondent’sinability to place the event in time. One mustlook to other sources for an adequateexplanation.
Effect of Impact of the Event UponReporting
Since early studies of memory, it has beenrecognized that the greater the impact of theevent upon the person, the more readily it isrecalled. Impact is a term that is poorly definedbut generally refers to personal importance orsignificance of the event. Psychologically, itsuggests that certain events occupy a greater partof one’s psychic life, having greater relevancethan other events for one’s present life. In thissection some indexes of impact and theirrelation to underreporting are examined.
Both SRC studies of reporting of hospitaliza-tions 7*1s clearly demonstrate that the longerthe duration of the hospitalization, the lowerthe rate of underreporting. Table 7 shows theresults of one of these studies.
Table 7. Number of recorded hospital discharges and percent
not reported in interviews, by recorded duration of hospitali-
zation (excluding overreports): Survey Research Center
I I
Recorded durationPercent
Recorded
of hospitalization dischargesnot re-
ported
I day . . . . . . . . . . . . . . . . . 150 26
2-4days . . . . . . . . . . . . . . . 646 14
5-7days . . . . . . . . . . . . . . . 456 10
8-14days . . . . . . . . . . . . . . . 352 10
15-21 days . . . . . . . . . . . . . . . 111 6
22-30 days . . . . . . . . . . . . . . . 58 2
31days or more . . . . . . . . . . . 46 8
Source: reference 17.
According to the third SRC study,l the levelof underreporting of physician visits was lowerwhen two or more such visits had occurredwithin the 2 weeks prior to the interview:
IITotal Percent
Recorded individual visits within 2recorded not re-
weeks prior to interviewvisits ported
1.. .. ... . .. ... ... .....2 . . . . . . . . . . . . . . . . . . . . .
3or more . . . . . . . . . . . . . . . .
197 28
110 21
96 13
In the SRI study,s a similar decrease in theunderreporting of chronic conditions was notedas the number of clinic visits relating to thecondition increased (table 8).3
Table 9 demonstrates another index ofimpact. Reporting of automobile accidents was
Table 8. Number of recorded chronic conditions and percent
not reported in interviews, by number of individual visits to
clinic: Stanford Research Institute
IIRecordedPercant
Individual visits not re-conditions
ported
1... ... ..... ... ..... . 3,081 582 . . . . . . . . . . . . . . . . . . . . 1,281 473 . . . . . . . . . . . . . . . . . . . . 643 354 . . . . . . . . . . . . . . . . . . . . 639 265 or more . . . . . . . . . . . . . . . 496 14
Source: reference 3.
Table 9. Number of recorded automobile accidents, both
involving personal injury and not, and percant not reported
in interviews, by time elapsed between accident and intewiew
PercentRecorded
not re-numbers
ported
Less than
3 months . .
3-6
months . . .
6-9
months . . .
9-12
months . . .
48
66
48
49
Source: reference 42.
6
12
22
37
Accidents with
personal injury
RecordedPercent
not re-numbers
ported
71
141
71
94
1
10
10
22.—
8
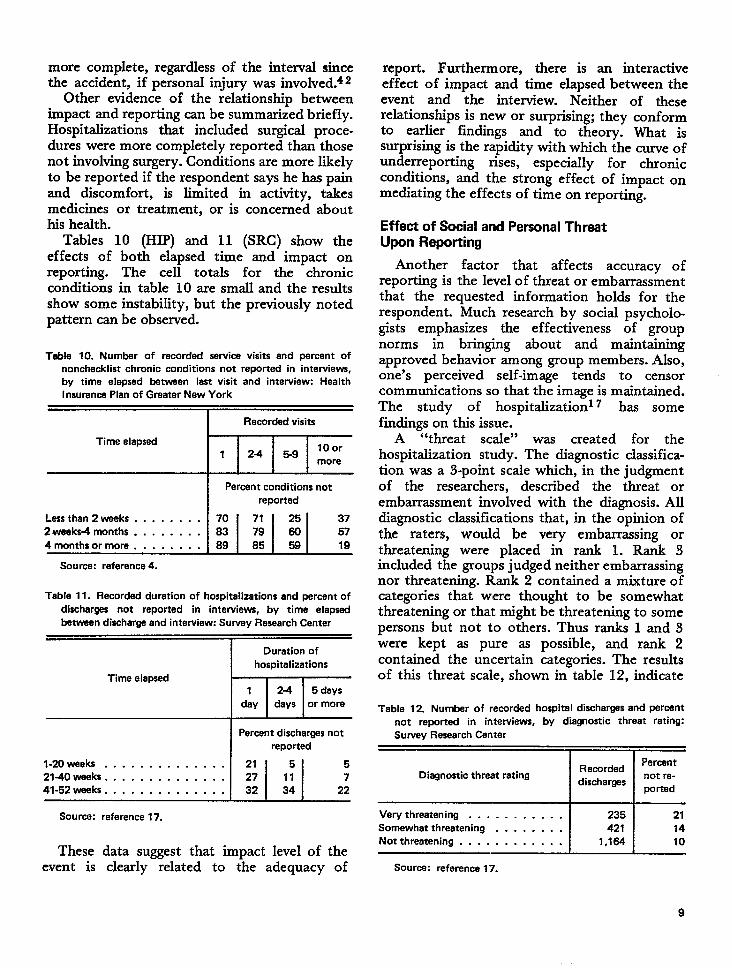
more complete, regardless of the interval sincethe accident, if personaI injury was involved.4 z
Other evidence of the relationship betweenimpact and reporting can be summaized briefly.Hospitalizations that included surgical proce-dures were more completely reported than thosenot involving surgery. Conditions are more likelyto be reported if the respondent says he has painand discomfort, is limited in activity, takesmedicines or treatment, or is concerned abouthis health.
Tables 10 (HIP) and 11 (SRC) show theeffects of both elapsed time and impact onreporting. The cell totals for the chronicconditions in table 10 are small and the resultsshow some instability, but the previously notedpattern can be observed.
Table 10. Number of recorded service visits and percant of
nonchecklist chronic conditions not reportad in interviews,
by time elefwad betwaan last visit and interview: Health
Insurance Plan of Graater New York
Time elapsed
*
i~Source: reference 4.
Table 11. Recorded duration of hospitalizations and percent of
discharges not reported in interviews, by time elapsed
between discharge and interview: Survey Research Center
tll-Duration of
hospitalizations
Time elapsed1 24 5 days
day days or more
IPercent discharges not
reported
l-20weeks . . . . . . . . . . . . . . 21 5 5
2140waaks . . . . . . . . . . . . . . 27 11 7
41-52 wads. . . . . . . . . . . . . . 32 34 22
Source: reference 17.
These data suggest that impact level of theevent is clearly related to the adequacy of
report. Furthermore, there is an interactiveeffect of impact and time elapsed between theevent and the interview. Neither of theserelationships is new or surprising; they conformto earlier findings and to theory. What issurprising is the rapidity with which the curve ofunderreporting rises, especially for chronicconditions, and the strong effect of impact onmediating the effects of time on reporting.
Effect of Social and Personal ThreatUpon Reporting
Another factor that affects accuracy ofreporting is the level of threat or embarrassmentthat the requested information holds for therespondent. Much research by social psycholo.gists emphasizes the effectiveness of groupnorms in bringing about and maintainingapproved behavior among group members. Also,one’s perceived self-image tends to censorcommunications so that the image is maintained.The study of hospitalization 7 has somefindings on this issue.
A “threat scale” was created for thehospitalization study. The diagnostic classifica-tion was a 3-point scaIe which, in the judgmentof the researchers, described the threat orembarrassment invoIved with the diagnosis. Alldiagnostic classifications that, in the opinion ofthe raters, would be very embarrassing orthreatening were placed in rank 1. Rank 3included the groups judged neither embarrassingnor threatening. Rank 2 contained a mixture ofcategories that were thought to be somewhatthreatening or that might be threatening to somepersons but not to others. Thus ranks 1 and 3were kept as pure as possible, and rank 2contained the uncertain categories. The resultsof this threat scale, shown in table 12, indicate
Table 12. Number of recorded hospital discharges and percent
not reportad in interviews, by diagnostic threat rating:
Survey Research Center
r nPercent
Diagnostic thraat ratingRecorded
dischargesnot re-
ported
Verythreatening . . . . . . . . . . . 235 21
Somewhat threatening . . . . . . . . 421 14
Notthreatening . . . . . . . . . . . . 1,164 10
Source: reference 17.
9
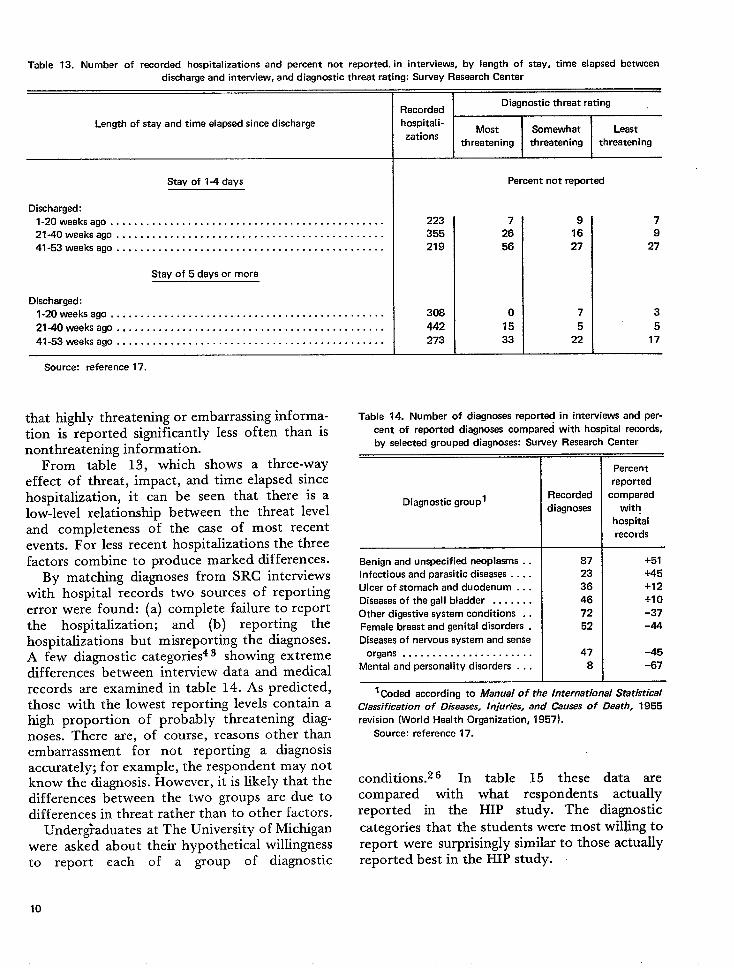
Table 13. Number of recorded hospitalizations and percent not reported, in interviews, by length of stay, time elapsed between
discharge and interview, and diagnostic threat rating: Survey Research Center
Length of stay and time elapsed since discharge
Stay of 1-4 days
Discharged:
l-20weeksago . . . . . . . . . . . . . . . . . . . . . . . . . . . . . . . . . . . . . . . . . . . . . .
21-40weeksago . . . . . . . . . . . . . . . . . . . . . . . . . . . . . . . . . . . . . . . . . . . . .
41-53weeksago . . . . . . . . . . . . . . . . . . . . . . . . . . . . . . . . . . . . . . . . . . . . .
Stay of 5 days or more
Discharged:
l-20weeksago . . . . . . . . . . . . . . . . . . . . . . . . . . . . . . . . . . . . . . . . . . . . . .
21-40weeksago . . . . . . . . . . . . . . . . . . . . . . . . . . . . . . . . . . . . . . . . . . . . .
41-53weeks ago . . . . . . . . . . . . . . . . . . . . . . . . . . . . . . . . . . . . . . . . . . . . .
Source: reference 17.
that highly threatening or embarrassing informa-tion is reported significantly less often than isnonthreatening information.
From table 13, which shows a three-wayeffect of threat, impact, and time elapsed sincehospitalization, it can be seen that there is alow-level relationship between the threat leveland completeness of the case of most recentevents. For less recent hospitalizations the threefactors combineto produce marked differences.
By matching diagnoses from SRC interviewswith hospital records two sources of reportingerror were found: (a) complete failure to reportthe hospitalization; and (b) reporting thehospitalizations but misreporting the diagnoses.A few diagnostic categories43 showing extremedifferences between interview data and medicalrecords are examined in table 14. As predicted,those with the lowest reporting levels contain ahigh proportion of probably threatening diag-noses. There are, of course, reasons other thanembarrassment for not reporting a diagnosisaccurately; for example, the respondent may notknow the diagnosis. However, it is likely that thedifferences between the two groups are due todifferences in threat rather than to other factors.
Undergraduateswere asked aboutto report each
10
at The University of Michigantheir hypothetical willingnessof a group of diagnostic
IRecorded
Diagnostic threat rating
hospitali-Most Somewhat Least
zationsthreatening threatening threatening
Percent not reported
223
355
219
308
442
273
7
26
56
015
33
9 7
16 9
27 27
7 3
5 5
Table 14. Number of diagnoses reported in interviews and per-
cent of reportad diagnoses compared with hospital records,
by selected grouped diagnoses: Survey Research Center
Diagnostic group’
Benign and unspecified neoplasms . .
Infectious and parasitic diseases . . . .
Ulcer of stomach and duodenum . . .
Diseases of the gall bladder . . . . . . .
Other digestive system conditions . .
Famale breast and genital disorders .
Diseases of nervous system and sense
organs . . . . . . . . . . . . . . . . . . . . . .
Mental and personality disorders . . .
Recorded
diagnoses
87
23
36
46
72
52
47
8
—.Percent
reported
compared
with
hospital
records
+51
+45
+12
+1 o-37
-44
-45
-67
1Coded according to Manual of tha international Statistical
Classification of Diseases, Injuries, and Causes of Death, 1955
revision (World Health Organization, 1957).
Source: reference 17.
conditions.z 6 In table 15 these data arecompared with what respondents actuallyreported in the HIP study. The diagnostic
categories that the students were most willing toreport were surprisingly similar to those actuallyreported best in the HIP study.
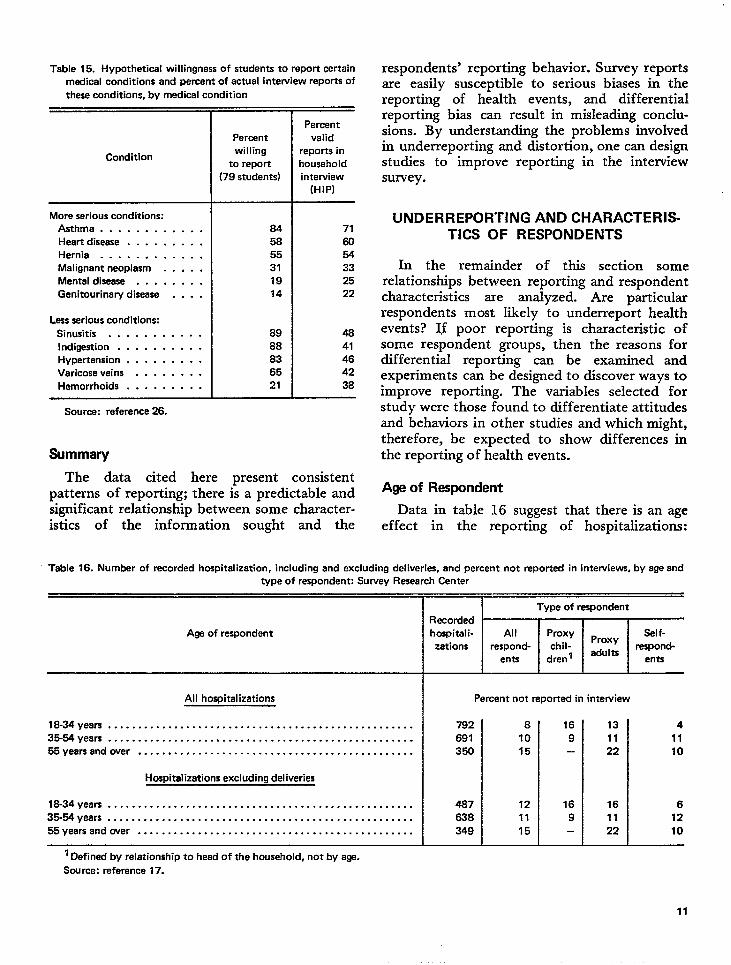
Table 15. Hypothetical willingness of students to report certain
medical conditions and percent of actual interview reports of
these conditions, by medical condition
More serious conditions:
Asthma . . . . . . . . . . . .
Heart disease . . . . . . . . .
Hernia . . . . . . . . . . . .
Malignant neoplasm . . . . .
Mental disease . . . . . . . .
Genitourinary disease . . . .
Less serious conditions:
Sinusitis . . . . . . . . . . .
Indigestion . . . . . . . . . .Hypertension . . . . . . . . .
Varicose veins . . . . . . . .
Hemorrhoids . . . . . . . . .
Source: reference 26.
Summary
Percent
willing
to report
(79 students)
84
58
55
31
19
14
89
88
83
65
21
Percent
valid
reports in
nousehold
interview
(HIP)
71
60
54
33
25
22
48
41
46
42
38
The data cited here present consistentpatterns of reporting; there is a predictable andsignificant relationship between some character-istics of the information sought and the
respondents’ reporting behavior. Survey reportsare easily susceptible to serious biases in thereporting of health events, and differentialreporting bias can result in misleading conclu-sions. By understanding the problems involvedin underreporting and distortion, one can designstudies to improve reporting in the interviewsurvey.
UNDERREPORIVNG AND CHARACTERIS-TICS OF RESPONDENTS
In the remainder of this section somerelationships between reporting and respondentcharacteristics are analyzed. Are particularrespondents most likely to underreport healthevents? If poor reporting is characteristic ofsome respondent groups, then the reasons fordifferential reporting can be examined andexperiments can be designed to discover ways toimprove reporting. The variables selected forstudy were those found to differentiate attitudesand behaviors in other studies and which might,therefore, be expected to show differences inthe reporting of health events.
Age of Respondent
Data in table 16 suggest that there is an ageef feet in the reporting of hospitalizations:
Table 16. Number of recorded hospitalization, including and excluding deliveries. and percent not reported in interviews, by ege and
type of respondent: Survey Research center
Age of respondent
All hospitalizations
18-34 years . . . . . . . . . . . . . . . . . . . . . . . . . . . . . . . . . . . . . . . . . . . . . . . . . . .
35-E4 years . . . . . . . . . . . . . . . . . . . . . . . . . . . . . . . . . . . . . . . . . . . . . . . . . . .
55 years and over . . . . . . . . . . . . . . . . . . . . . . . . . . . . . . . . . . . . . . . . . . . . . .
Hospitalizations excluding deliveries
18-34 years . . . . . . . . . . . . . . . . . . . . . . . . . . . . . . . . . . . . . . . . . . . . . . . . . . .
36-54 years . . . . . . . . . . . . . . . . . . . . . . . . . . . . . . . . . . . . . . . . . . . . . . . . . . .
55 years and over . . . . . . . . . . . . . . . . . . . . . . . . . . . . . . . . . . . . . . . . . . . . . .
Percent not reported in intewiew
782 8
691 10
350 15
487 12
638 11
349 15 L16 13 4
9 11 11— 22 10
16 16 6
9 11 12— 22 10
‘ Defined by relationship to head of the household, not by age.
Source: reference 17.
11
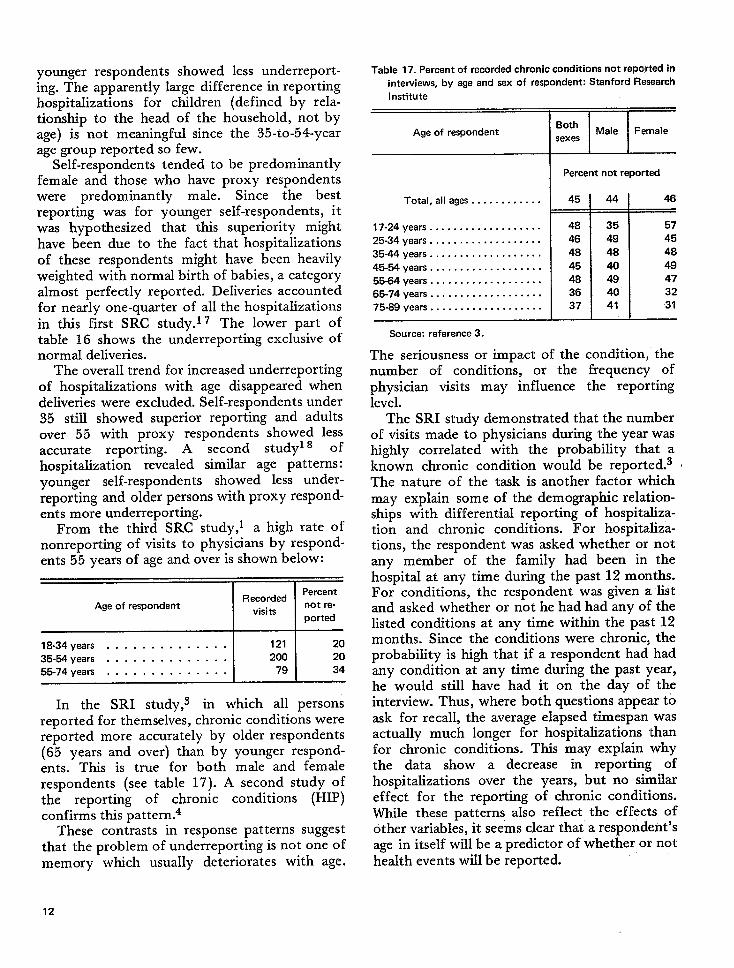
youngering. Thehomitaliz~t;ons for cfildren (defined by rela-
respondents showed less underreport-apparently large difference in reporting
tio&hip to the head of the household, not byage) is not meaningful since the 35-to-54-yearage group reported so few.
Self-respondents tended to be predominantlyfemale and those who have proxy respondentswere predominantly male. Since the bestreporting was for younger self-respondents, itwas hypothesized that this superiority mighthave been due to the fact that hospitalizationsof these respondents might have been heavilyweighted with normal birth of babies, a categoryalmost perfectly reported. Deliveries accountedfor nearly one-quarter of all the hospitalizationsin this first SRC study.17 The lower part oftable 16 shows the underreporting exclusive ofnormal deliveries.
The overall trend for increased underreportingof hospitalizations with age disappeared whendeliveries were excluded. Self-respondents under35 still showed superior reporting and adultsover 55 with proxy respondents showed lessaccurate reporting. A second studyl 8 ofhospitalization revealed similar age patterns:younger self-respondents showed less under-reporting and older persons with proxy respond-ents more underreporting.
From the third SRC study,l a high rate ofnonreporting of visits to physicians by respond-ents 55 years of age and over is shown below:
RecordedPercent
Age of respondent not re-visits
ported
18-34 years . . . . . . . . . . . . . . 121 2035-54 years . . . . . . . . . . . . . . 200 2055-74 years . . . . . . . . . . . . . . 79 34
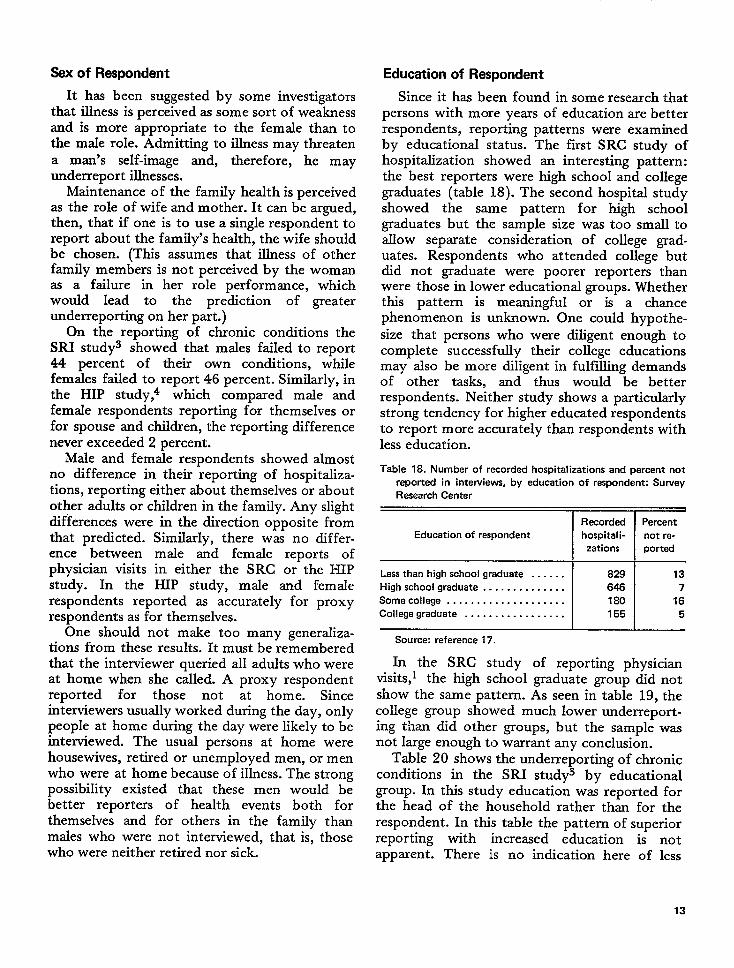
In the SRI study, s in which all personsreported for themselves, chronic conditions werereported more accurately by older respondents(65 years and over) than by younger respond-ents. This is true for both male and femalerespondents (see table 17). A second study ofthe reporting of chronic conditions (HIP)confirms this pattern.4
These contrasts in response patterns suggestthat the problem of underreporting is not one ofmemory which usually deteriorates with age.
Table 17. Percent of recorded chronic conditions not reported in
interviews, by age and sex of respondent: Stanford Research
Institute
1 I t
Age of respondent IBothMale Female
sexes
Total, all ages . . . . . . . . . . . .
17-24 years . . . . . . . . . . .. c..... .
25-34 years . . . . . . . . . . . . . . . . . . .
35-44 years . . . . . . . . . . . . . . . . . . .
45-54 years . . . . . . . . . . . . . . . . . . .
55-64 years . . . . . . . . . . . . . . . . . . .
65-74 years . . . . . . . . . . . . . . . . . . .
75-89 years . . . . . . . . . . . . . . . . . . .
Source: reference 3.
I Percent not reported
45
48
46
48
45
48
36
37
44
35
49
48
40494041
46
57
45
48
49
47
32
31
The seriousness or impact of the condition, thenumber of conditions, or the frequency ofphysician visits may inffuence the reportinglevel.
The SRI study demonstrated that the numberof visits made to physicians during the year washighly correlated with the probability that aknown chronic condition would be reported.3 ~The nature of the task is another factor whichmay explain some of the demographic relation-ships with differential reporting of hospitaliza-tion and chronic conditions. For hospitaliza-tions, the respondent was asked whether or notany member of the family had been in thehospital at any time during the past 12 months.For conditions, the respondent was given a listand asked whether or not he had had any of thelisted conditions at any time within the past 12months. Since the conditions were chronic; theprobability is high that if a respondent had hadany condition at any time during the past year,he would still have had it on the day of theinterview. Thus, where both questions appear toask for recall, the average elapsed timespan wasactually much longer for hospitalizations thanfor chronic conditions. This may explain whythe data show a decrease in reporting ofhospitalizations over the years, but no similaref feet for the reporting of chronic conditions.WMe these patterns also reflect the effects ofother variables, it seems clear that a respondent’sage in itself will be a predictor of whether or nothealth events will be reported.
12
Sex of Respondent Education of Respondent
It has been suggested by some investigatorsthat illness is perceived as some sort of weaknessand is more appropriate to the female than tothe male role. Admitting to illness may threatena man’s self-image and, therefore, he mayunderreport illnesses.
Maintenance of the family health is perceivedas the role of wife and mother. It can be argued,then, that if one is to use a single respondent toreport about the family’s health, the wife shouldbe chosen. (This assumes that illness of otherfamily members is not perceived by the womanas a failure in her role performance, whichwould lead to the prediction of greaterunderreporting on her part.)
On the reporting of chronic conditions theSRI study3 showed that males failed to report44 percent of their own conditions, whilefemales failed to report 46 percent. Similarly, inthe HIP study,A which compared male andfemale respondents reporting for themselves orfor spouse and children, the reporting differencenever exceeded 2 percent.
Male and female respondents showed almostno difference in their reporting of hospitaliza-tions, reporting either about themselves or aboutother adults or children in the family. Any slightdifferences were in the direction opposite fromthat predicted. Similarly, there was no differ-ence between male and female reports ofphysician visits in either the SRC or the HIPstudy. In the HIP study, male and femalerespondents reported as accurately for proxyrespondents as for themselves.
One should not make too many generaliza-tions from these results. It must be rememberedthat the interviewer queried all adults who wereat home when she called. A proxy respondentreported for those not at home. Sinceinterviewers usually worked during the day, onlypeople at home during the day were likely to beinterviewed. The usual persons at home werehousewives, retired or unemployed men, or menwho were at home because of illness. The strongpossibility existed that these men would bebetter reporters of health events both forthemselves and for others in the family thanmales who were not interviewed, that is, thosewho were neither retired nor sick.
Since it has been found in some research thatpersons with more years of education are betterrespondents, reporting patterns were examinedby educational status. The first SRC study ofhospitalization showed an interesting pattern:the best reporters were high school and collegegraduates (table 18). The second hospital studyshowed the same pattern for high schoolgraduates but the sample size was too small toallow separate consideration of college grad-uates. Respondents who attended college butdid not graduate were poorer reporters thanwere those in lower educational groups. Whetherthis pattern is meaningful or is a chancephenomenon is unknown. One could hypothe-size that persons who were diligent enough tocompIete successfully their college educationsmay also be more diligent in fulfilling demandsof other tasks, and thus would be betterrespondents. Neither study shows a particularlystrong tendency for higher educated respondentsto report more accurately than respondents withless education.
Table 18. Number of recorded hospitalizations and percent not
reported in interviews, by education of respondent: Survey
Research Center
Recorded Percent
Education of respondent hospital i- not re-
zations ported
Less than high school graduate . . . . . . 829 13
High school graduate . . . . . . . . . . . . . . 646 7
Somecollege . . . . . . . . . . . . . . . . . . . . 180 16
College graduate . . . . . . . . . . . . . . . . . 155 5
Source: reference 17.
In the SRC study of reporting physicianvisits,l the high school graduate group did notshow the same pattern. As seen in table 19, thecollege group showed much lower underreport-ing than did other groups, but the sample wasnot large enough to warrant any conclusion.
Table 20 shows the underreporting of chronicconditions in the SRI study3 by educationalgroup. In this study education was reported forthe head of the household rather than for therespondent. In this table the pattern of superiorreporting with increased education is notapparent. There is no indication here of less
13
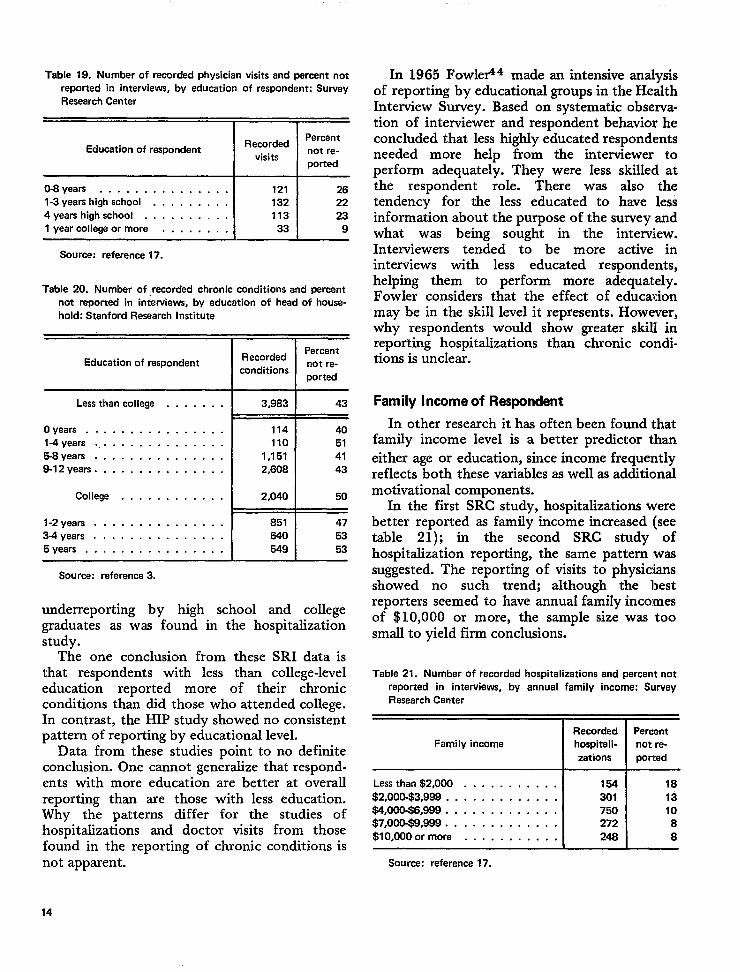
Table 19. Number of recorded physician visits and percent notreported in interviews, by education of respondent: SurveyResearch Center
PercentEducation of respondant Racorded
not re-visits
ported
O-8years . . . . . . . . . . . . . . . 121 261-3 years high school . . . . . . . . . 132 224yeara highschool . . . . . . . . . . 113 231 year collega or more . . . . . , . . 33 9
Source: reference 17.
Table 20. Number of recorded chronic conditions and percentnot reported in interviews, by educetion of head of house-hold: Stanford Research Institute
RecordedPercent
Education of respondent not re-conditions
ported
Lessthan college . . . . . . .
Oyears . . . . . . . . . . . . . . . .l-4years . . . . . . . . . . . . . . . .5-8years . . . . . . . . . . . . . . .8-12years . . . . . . . . . . . . . . . T
3,983 43
114 40110 51
1,151 412,608 43
Source: raferenca3.
underreporting by high school and collegegraduates as was found in the hospitalizationstudy.
The one conclusion from these SRI data isthat respondents with less than college-leveleducation reported more of their chronicconditions than dld those who attended college.In contrast, the HIP study showed no consistentpattern of reporting by educational level.
Data from these studies point to no definiteconclusion. One cannot generalize that respond-ents with more education are better at overallreporting than are those with less education.Why the patterns differ for the studies ofhospitalizations and doctor visits from thosefound in the reporting of chronic conditions isnot apparent.
In 1965 Fowler44 made an intensive analysisof reporting by educational groups in the HealthInterview Survey. Based on systematic observa-tion of interviewer and respondent behavior heconcluded that less highly educated respondentsneeded more help from the interviewer toperform adequately. They were less skilled atthe respondent role. There was also thetendency for the less educated to have lessinformation about the purpose of the survey andwhat was being sought in the interview.Interviewers tended to be more active ininterviews with less educated respondents,helping them to perform more adequately.Fowler considers that the effect of educationmay be in the skill level it represents. However,why respondents would show greater skill inreporting hospitalizations than chronic condi-tions is unclear.
Family Income of Respondent
In other research it has often been found thatfamily income level is a better predictor thaneither age or education, since income frequentlyreflects both these variables as well as additicmalmotivational components.
In the first SRC study, hospitalizations werebetter reported as family income increased (seetable 21); in the second SRC study ofhospitalization reporting, the same pattern wassuggested. The reporting of visits to physiciansshowed no such trend; although the bestreporters seemed to have annual family incomesof $10,000 or more, the sample size was toosmall to yield firm conclusions.
Table 21. Number of recorded hospitalizations and percant notreported in interviews, by annual fami Iy income: SurveyResearch Center
Racorded PercentFamily income hospitali- not re-
zetions ported
Lessthan $2,000 . . . . . . . . . . . 154 18
$2,000-$3,999 . . . . . . . . . . . . . 301 13$4,000-$6,999 . . . . . . . . . . . . . 750 10$7,000-$9,988 . . . . . . . . . . . . . 272 8
$l0,000ormore . . . . . . . . . . . 248 8
Source: reference 17.
14
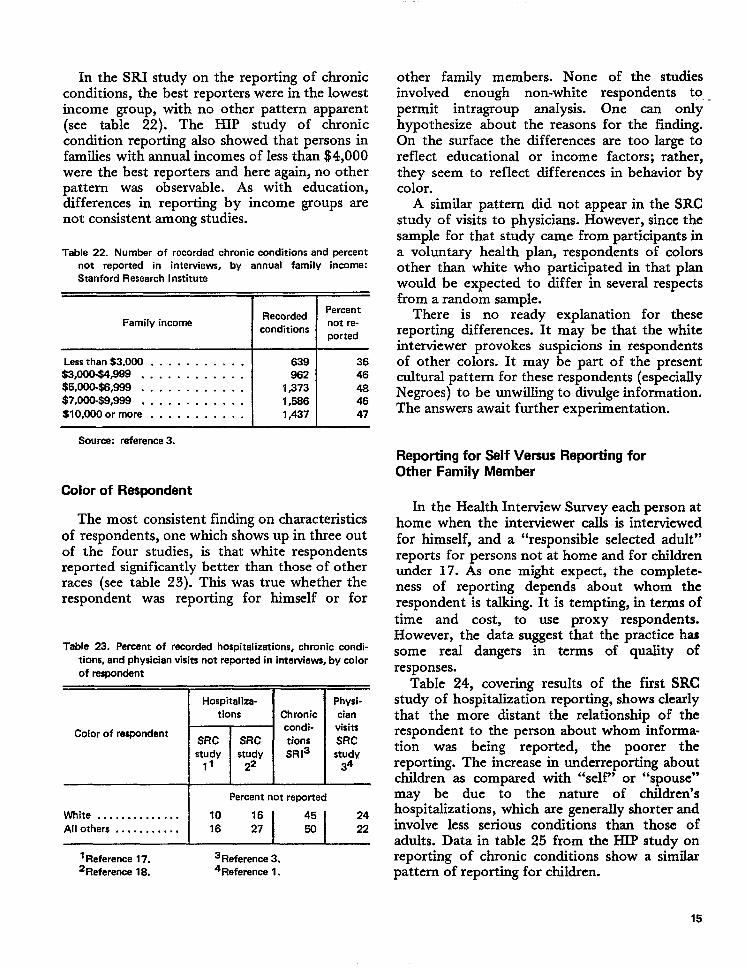
In the SRI study on the reporting of chronicconditions, the best reporters were in the lowestincome group, with no other pattern apparent(see table 22). The HIP study of chroniccondition reporting also showed that persons infamilies with annual incomes of less than $4,000were the best reporters and here again, no otherpattern was observable. As with education,differences in reporting by income groups arenot consistent among studies.
Table 22. Number of racorded chronic conditions and percentnot reported in interviews, by annual family income:Stanford Research Institute
IIRecordedPercent
Family income not re-conditions
ported
Lessthan$3,000 . . . . . . . . . . .$3,000$4,W . . . . . . . . . . . .$5,000-$6,999 . . . . . . . . . . . .$7toock$9,999, . . . . . . . . . . .$lO,OOOor more . . . . . . . . . . .
639962
1,3731,5S61,437
3646464647
other family members. None of the studiesinvolved enough non-white respondents to, -permit intragroup analysis. One can onlyhypothesize about the reasons for the finding.On the surface the differences are too large toreflect educational or income factors; rather,they seem to reflect differences in behavior bycolor.
A similar pattern did not appear in the SRCstudy of visits to physicians. However, since thesample for that study came from participants ina voluntary health plan, respondents of colorsother than white who participated in that planwould be expected to differ in several respectsfrom a random sample.
There is no ready explanation for thesereporting differences. It may be that the whiteinterviewer provokes suspicions in respondentsof other colors. It may be part of the presentcultural pattern for these respondents (especiallyNegroes) to be unwihg to divulge information.The answers await further experimentation.
Source: rafarence 3.
Reporting for Self Versus Reporting forOther Family Member
Color of Respondent
The most consistent finding on characteristicsof respondents, one which shows up in three outof the four studies, is that white respondentsreported significantly better than those of otherraces (see table 23). This was true whether therespondent was reporting for himself or for
Table 23. Percent of recorded hospitalizations, chronic condi-tions, and physician visits not reported in intewiews, by colorof respondent
1-1--Hospitaliza-
tions
Color of respondentSRC SRCstudy Istudy
11 22I I
Chroniccondi-tionsSR13
Physi-cianvisitsSRCstudy
34
I Percent not reported
White . . . . . . . . . . . . . . 10All others . . . . . . . . . . . 16 :!I $1 :
‘Reference 17. 3Reference 3.2Reference 18. 4Reference 1.
In the Health Interview Survey each person athome when the interviewer calls is interviewedfor himself, and a “responsible selected adult”reports for persons not at home and for childrenunder 17. As one might expect, the complete-
ness of reporting depends about whom therespondent is talking. It is tempting, in terms oftime and cost, to use proxy respondents.However, the data suggest that the practice hassome real dangers in terms of quality ofresponses.
Table 24, covering results of the first SRCstudy of hospitzdization reporting, shows clearlythat the more distant the relationship of therespondent to the person about whom informa-tion was being reported, the poorer thereporting. The increase in underreporting aboutchildren as compared with “self” or “spouse”may be due to the nature of children’shospitalizations, which are generally shorter andinvolve less serious conditions than those ofadults. Data in table 25 from the HIP study onreporting of chronic conditions show a similarpattern of reporting for children.
15
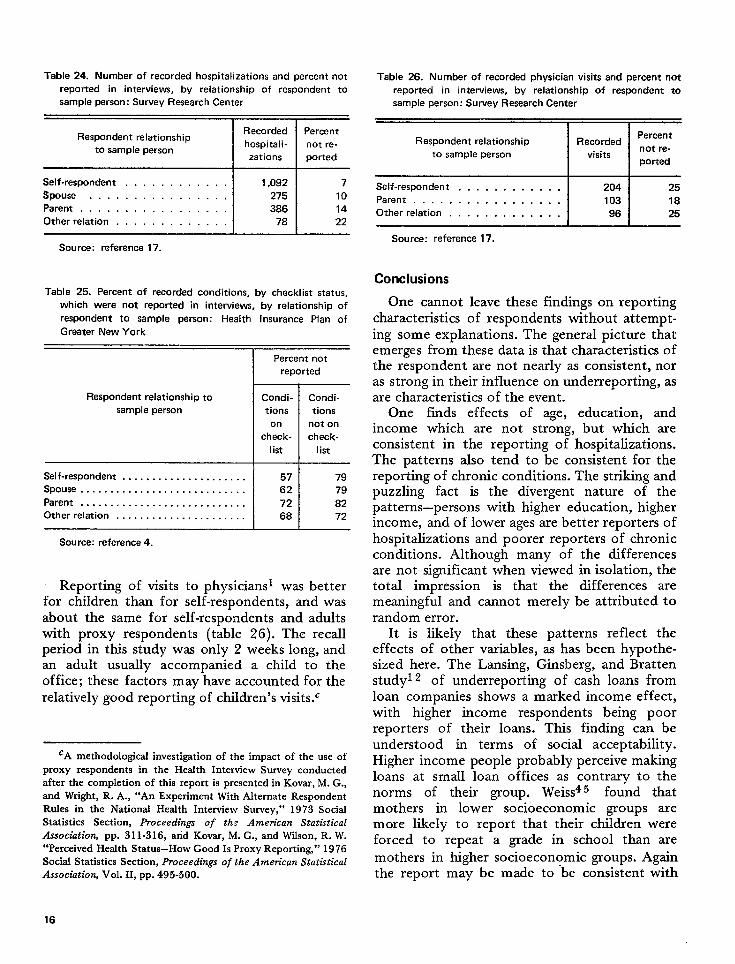
Table 24. Number of recorded hospitalizations and percent not
reported in interviews, by relationship of respondent to
sample person: Survey Research Center
Table 26. Number of recorded physician visits and percent not
reported in interviews, by relationship of respondent to
sample person: Survey Research Center
Recorded ParcentRespondent relationship
hospitali-ty sample person
not re-
zations ported
Self-respondent . . . . . . . . . . . 1,092 7
Spouse . . . . . . . . . . . . . . . . 275 10Parent . . . . . . . . . . . . . . . . . 386 14Other relation . . . . . . . . . . . . . 78 22
Source: reference 17.
Table 25. Percent of recordad conditions, by checklist status,
which were not reported in interviews, by relationship of
respondent to sample person: Health Insurance Plan of
Greater New York
Percent not
reported
Respondent relationship to Condi- Condi-sampla person tions tions
on not on
check- check-
1ist list
Self-respondent . . . . . . . . . . . . . . . . . . . . . 57 79Spouse . . . . . . . . . . . . . . . . . . . . . . . . . . . . 62 79Parent . . . . . . . . . . . . . . . . . . . . . . . . . . . . 72 82Otherrelation . . . . . . . . . . . . . . . . . . . . . . 68 72
Source: reference.
Reporting of visits to physicians was betterfor children than for self-respondents, and wasabout the same for self-respondents and adultswith proxy respondents (table 26). The recallperiod inthis study was only 2weekslong, andan adult usually accompanied a child to theoffice; these factors may have accounted for therelatively good reporting of children’s visits.c
CA methodological investigation of the impact of the use ofproxy respondents in the Health Interview Survey conductedafter the completion of this report is presented in Kovar, M. G.,and Wright, R. A., “An Experiment With Alternate RespondentRules in the Nationaf Herdth Interview Survey,” 1973 SocialStatistics Section, Proceedings of the Amen”can StatisticalAssociatiofi pp. 311-316, and Kovar, M. G., and Wilson, R. W.“Perceived Health Status-How Good Is Proxy Reporting,” 1976Social Statistics Section, Proceed~ngs of the Amm”can StatsMcalAssociation, Vol. II, pp. 495-500.
Respondent relationship RecordedPercent
not re-to sample person visits
pouted
Salf-respondent . . . . . . . . . . . 204 25Parent . . . . . . . . . . . . . . . . . 103 18Other relation . . . . . . . . . . . . . 96 25
Source: reference 17.
Conclusions
One cannot leave these findings on reportingcharacteristics of respondents without attempt-ing some explanations. The general picture thatemerges from these data is that characteristics ofthe respondent are not nearly as consistent, noras strong in their influence on underreporting, asare characteristics of the event.
One finds effects of age, education, andincome which are not strong, but which areconsistent in the reporting of hospitalizaticms.The patterns also tend to be consistent for thereporting of chronic conditions. The striking andpuzzling fact is the divergent nature of thepatterns–persons with higher education, higherincome, and of lower ages are better reporters ofhospitalizations and poorer reporters of chronicconditions. Although many of the differencesare not significant when viewed in isolation, thetotal impression is that the differences aremeaningful and cannot merely be attributed torandom error.
It is likely that these patterns reflect theeffects of other variables, as has been hypothe-sized here. The Lansing, Ginsberg, and Brattenstudyl z of underreporting of cash loans fromloan companies shows a marked income effect,with higher income respondents being poorreporters of their loans. This finding can beunderstood in terms of social acceptability.Higher income people probably perceive makingloans at small loan offices as contrary to thenorms of their group. Weiss45 found thatmothers in lower socioeconomic groups aremore likely to report that their children wereforced to repeat a grade in school than are
mothers in higher socioeconomic groups. Againthe report may be made to be consistent with
16
behavior perceived as acceptable. Anotherexplanation may be that lower socioeconomicgroups have more sickness; therefore, it hasgreater impact and is reported better. Hospitali-zations, on the other hand, tend to be singleevents and thus may be more difficult to recall.That the task requirements are different in termsof recall and motivation leveI are other tenablehypotheses. Research is needed to explain thesephenomena.
In the studies presented here there is noindication that special groups are characteristi-
cally poor reporters, with the exception ofpersons of races other than white who aresufficiently consistent in showing high under-reporting to suggest that special research bedevoted to them.
The general conclusion from these studies isthat research on improving reporting can mostfruitfully be devoted to the nature of events andthe factors underlying the characteristics ofevents. Problems of elapsed time, impact, andthreat or embarrassment appear to be the mostsignificant issues for research.
BEHAV1OR IN INTERVIEWS
Before effective theories about the cause-and-effect sequences in the interview situation canbe developed, there must be accurate descrip-tions and classifications of the material reportedin interviews. It is to help meet this need thatthe Survey Research Center has continuedstudies which describe the basic nature of theverbal interaction between interviewer andrespondent. Since both SRC observation studiesdiscussed here are available in full report form,this discussion will eliminate many of themethodological details and concentrate on themajor findings and their possible implications.
HEALTH INTERVIEW SURVEYOBSERVATION STUDY
The first SRC observation study46 byCannell, Fowler, and Marquis was carried out incooperation with the National Center for HealthStatistics.d Five kinds of measurements weretaken for each respondent:
a. Information about respondent demo-graphic characteristics and family health inthe regular health interview;
b. A detailed account of the interviewer andrespondent behavior as recorded by a thirdperson observing the intemiew;
‘A report of this study may be obtained from the NationalCenter for Heafth Statistics, Vital and Health Statistics, PHSPub. No. 1000-Series 2-No. 26.
c. The interviewer’s rating of the respondentfollowing each interview;
d. A reinterview with the respondent con-ducted by a second interviewer within 2days following the original health inter-view; and
e. A staff interview with each health inter-viewer following the completion of herassignment.
Complete data are available for 412 respond-ents from a cross section sample of the area eastof the Mississippi (excluding the extremeNortheast). About four-fifths of the respondentswere women, and about half of the respondentshad less than a high school education.Experienced female interviewers employed bythe U.S. Bureau of the Census conducted thehealth interviewing. Another group of women,also employed by the U.S. Bureau of the Census,carried out the behavior observation. Thereinterview with respondents was conducted bya Survey Research Center interviewer, ratherthan the original health interviewer. The staffinterview with the health interviewer was alsoconducted by a Survey Research Centerinterviewer.
Health Interview Survey Data
The information that the respondent fur-nished about his own health during the regularhealth interview was used in this study to createa dependent variable. The dependent variable
17
was the number of chronic and acute conditionsthe respondent reported for himself, withadjustment for gross differences in actualsickness which could be predicted from knowingthe respondent’s age. The previously cited fullreport of the study details the rationale for thechoice of this particular dependent variable.Evidence is presented which suggests that thenumber of chronic and acute conditions therespondent reports for himself is an indicationof the accuracy of other health data reported byhim.
Obsewation
During the health interview an observerrecorded what the interviewer and respondentsaid and did. A wide range of behavior classifiedin small segments of easily identifiable acts wasrecorded for both interviewer and respondent.In order to record different kinds of behavior,the interview was divided into segments, eachcontaining a specific set of questions. For eachsegment several particular kinds of behaviorwere observed and recorded. In this way, a widevariety of behavior could be recorded while thetask was kept within the observer’s capabilities.
While the interviewer was still at the door, theobserver recorded such things as: the time ofday, how long the interviewer had to wait forthe respondent to open the door, what theinterviewer said as she introduced herself andthe study, how many questions the respondentasked, and who took what kind of initiative toget the interview started. The observer also madetwo ratings about how receptive the respondenthad been to this point in the interview. After theactual interviewing started, the observer re-corded the occurrence of different kinds ofbehavior at different points in the interview.Special attention was paid to irrelevant behaviorwhich departed from the task of asking andanswering the questions on the questionnaire.Among the categories used to classify thisirrelevant behavior were: talking about the otherperson (such as giving praise), asking irrelevantquestions, and giving suggestions. Conversationabout the respondent or his family, friends, etc.,was also considered irrelevant when it was notdirected to the specific question asked. Anothermajor category of irrelevant behavior was
humor, consisting of laughter, jokes, and othermeans of relieving tension. The observer alsorecorded the reaction which the other personhad to each instance of irrelevant behavior.Reactions were rated on a 3-point scale, from“very encouraging” to “very discouraging.”Throughout the interview the observer kepttrack of the kinds of potential distractionspresent (children, other adults, TV, radio).
During three separate parts of the interviewthe observer concentrated on the question-answer interaction between the interviewer andthe respondent. Seven types of behavior wererecorded for the respondent:
a. Adequacy of answer;b. Elaborateness of response;c. Inadequacy of answer;d. Need for clarification or repetition;e. Checking with another person or with
records;: f. Reference to calendar; and‘ g. Doubt about the adequacy of an answer.
Five specific kinds of interviewer behaviorwere also counted. They were:
a.
b.
c.
d.e.
Repeating the answer from the question-naire;Asking a question, not on the question-naire, which did not suggest an answer(nondirective probe);Asking a question, not from schedule,which might have suggested a specificanswer, or asking respondent if she agreedwith a specific answer (directive probe);Clarifying the meaning of the question; andSuggesting that records, calendar, or otherpeople be consulted.
Several other attempts were made to examinedifferent aspects of task-oriented behavior. Inone section the interviewer counted the numberof times the respondent paused before giving ananswer, the number of times the respondentasked for clarification or elaborated on ananswer, and the number of times the interviewerasked additional questions. During one particu-larly difficult part of the interview, specialattention was given to the frequency with which
the respondent had to ask for help, to theinterviewer’s behavior when the respondentmade such a request, and to the effort made bythe respondent during this difficult paxt of theinterview. Between sections of the interviewwhere the observer recorded task-relevantbehavior, she recorded her impressions of therespondent’s reactions. For example, she ratedthe respondent’s attitude (enthusiastic, bored,irritated), his understanding of the question, andthe smoothness of the interaction betweeninterviewer and respondent.
At the end of the interview the observerrecorded the length of time spent in conversa-tion after the last question was asked and triedto determine whether the interviewer or therespondent was more willing to continue this
conversation. After the interview was com-pleted, the observer filled out two pages ofratings on the respondent and recorded her ownimpressions of the interview.
Interviewer Ratings of the Respondent
After the health interview, the interviewerrated the respondent by describing her ownperceptions of respondent attitude and her ownattitude toward the respondent. The ratingscales used by the interviewer were similar to theones used by the observer at the end of eachhealth interview.
Reintewiew With the Respondent
A major attempt was made to ascertain therespondent’s reactions to being interviewed byconducting a second interview withh 2 daysfollowing the original health interview. Thequestionnaire used in this reinterview focused onthe respondent’s feelings and attitudes about theinterview and interviewer: his level of informa-tion about surveys in general and this one inparticular, his motives for cooperating with theinterviewer, and his feelings about the questionsand about his role as a respondent. A specialattempt was made, using semiprojective tech-niques, to uncover any negative feelings that therespondent had about the original interview thatmight be difficult to express directly to anotherinterviewer.
Intewiew With the Health Intewiewer
After all her observed interviews werecompleted, each of the 35 health interviewerswas in turn interviewed by an SRC interviewer.The health interviewer was questioned about herattitudes toward her job, her feelings concerningthe interviewing of different kinds of respond-ents, her reactions to specific aspects of herwork, and her reactions to the questions on thehealth interview schedule.
Results
It was originally hypothesized that severalkinds of respondent psychological variableswould have a major effect on the quality of datareported. Specifically, it was felt that reportingaccuracy would depend on the amount ofinformation which the respondent had about theinterview and its sponsors in combination withthe respondent’s general attitudes, motivationpatterns, and particular perceptions of theinterview. It was expected that the informationlevel, attitude, motivation, and perceptioncharacteristics of the respondent would also bereflected in the behavior observed in the originalinterview.
This attitude-based interpretation of thecauses of accurate and inaccurate reporting isnot new. Experience has been accumulated over
many years (both from the psychologicallaboratory and from the world of advertisingand mzwketing) which would enable theresearcher to clesign techniques to changerespondent attitudes, motivations, and percep-tions and to supply information or correctmisinformation. Based on the assumption thatpoor reporting was due to such variables as lowlevels of information and inappropriate atti-tudes, new studies were designed and testing wasstarted on some attitude- and information-level-change techniques. However, as the main databecame available, it became clear that thehypotheses concerning the causes of poorreporting were unsupported. There was practi-cally no correlation between the dependentvariable (a measure of reporting quality) and thecomplex indexes of information level, attitudes,motivation, and perception. (See Mueller,Schuessler, and Costner47 for further informa-tion.) These cognitive variables were for the
19
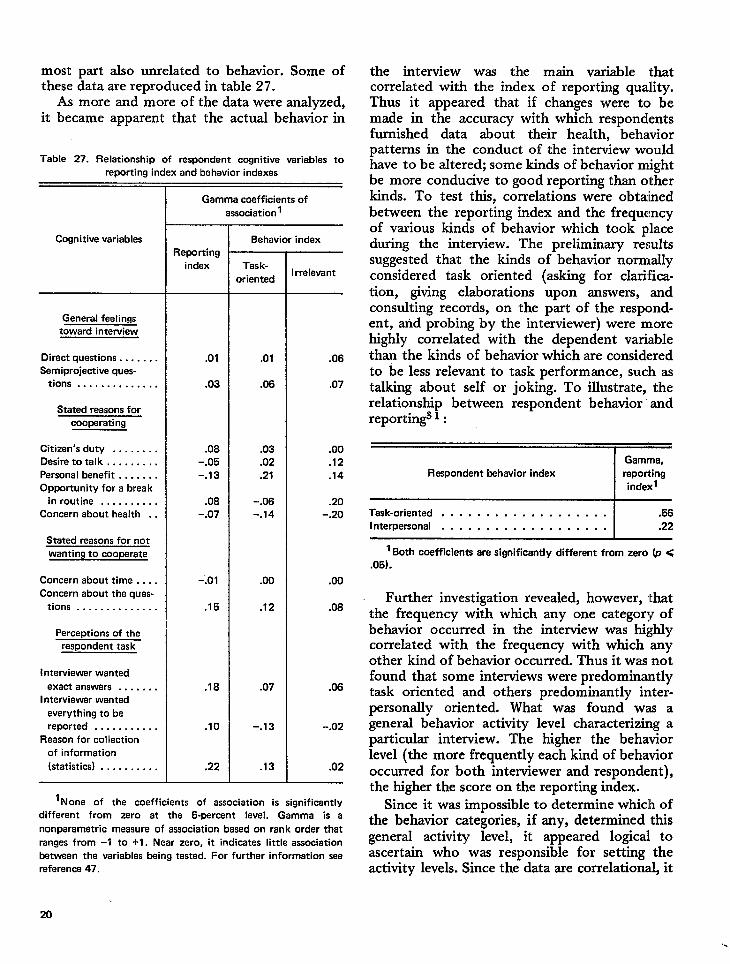
most part also unrelated to behavior. Some ofthese data are reproduced in table 27.
As more and more of the data were analyzed,it became apparent that the actual behavior in
Table 27. Relationship of respondent cognitive variables to
reporting index and behavior indexes
Cognitive variables
General feelings
toward interview
Direct questions . . . . . . .
Semiprojective ques-tions . . . . . . . . . . . . . .
Stated reasons for
cooperating
Citizen’s duty . . . . . . . .
Desire totalk . . . . . . . . .
Personal benefit . . . . . . .
Opportunity for a break
in routine . . . . . . . . . .
Concern about health . .
Stated reasons for not
wanting to cooperate
Concern about time . . . .
Concern about the ques-
tions . . . . . . . . . . . . . .
Perceptions of the
respondent task
Interviewer wanted
axact answers . . . . . . .
Interviewer wanted
everything to be
reported . . . . . . . . . . .
Reason for collection
of information
(statistics) . . . . . . . . . .
Gamma coefficients of
association 1
Reporting
index
.01
.03
.08
-.05
-.13
.08
-.07
-.01
.15
.18
.10
.22
Behavior index
Task-
oriented
.01
.06
.03
.02
.21
-.06
-.14
.00
.12
.07
-.13
.13
Irrelevant
.06
.07
.00
.12
.74
.20
-.20
.00
.08
.06
-.02
.02
1None of the coefficients of association is sicmificentlv
different from zero at the 5-percent level. Ga;ma is a
non parametric measure of association based on rank order that
ranges from –1 to +1. Near zero, it indicates little association
between the variables being tested. For further information see
reference 47.
the interview was the main variable thatcorrelated with the index of reporting quality.Thus it appeared that if changes were tc~ bemade in the accuracy with which respondentsfurnished data about their health, behaviorpatterns in the conduct of the interview wouldhave to be altered; some kinds of behavior mightbe more conducive to good reporting than otherkinds. To test this, correlations were obtainedbetween the reporting index and the frequencyof various kinds of behavior which took placeduring the interview. The preliminary resultssuggested that the kinds of behavior normallyconsidered task oriented (asking for clarifica-tion, giving elaborations upon answers, andconsulting records, on the part of the respond-ent, and probing by the interviewer) were morehighly correlated with the dependent variablethan the kinds of behavior which are consideredto be less relevant to task performance, such astalking about self or joking. To illustrate, therelationship between respondent behavior’ andreportin~ 1:
~Gamma,
Respondent behavior indax reporting
indexl
Task-oriented . . . . . . . . . . . . . . . . . . . .56
Interpersonal . . . . . . . . . . . . . . . . . . . .22
1 Both coefficients are significantly different from zero (p <
.05).
Further investigation revealed, however, thatthe frequency with which any one category ofbehavior occurred in the interview was highlycorrelated with the frequency with which anyother kind of behavior occurred. Thus it was notfound that some interviews were predominantlytask oriented and others predominantly inter-personally oriented. What was found was ageneral behavior activity level characterizing aparticular interview. The higher the behaviorlevel (the more frequently each kind of behavioroccurred for both interviewer and respondent),the higher the score on the reporting index.
Since it was impossible to determine whiclh ofthe behavior categories, if any, determined thisgeneral activity level, it appeared logical toascertain who was responsible for setting theactivity levels. Since the data are correlational, it
20
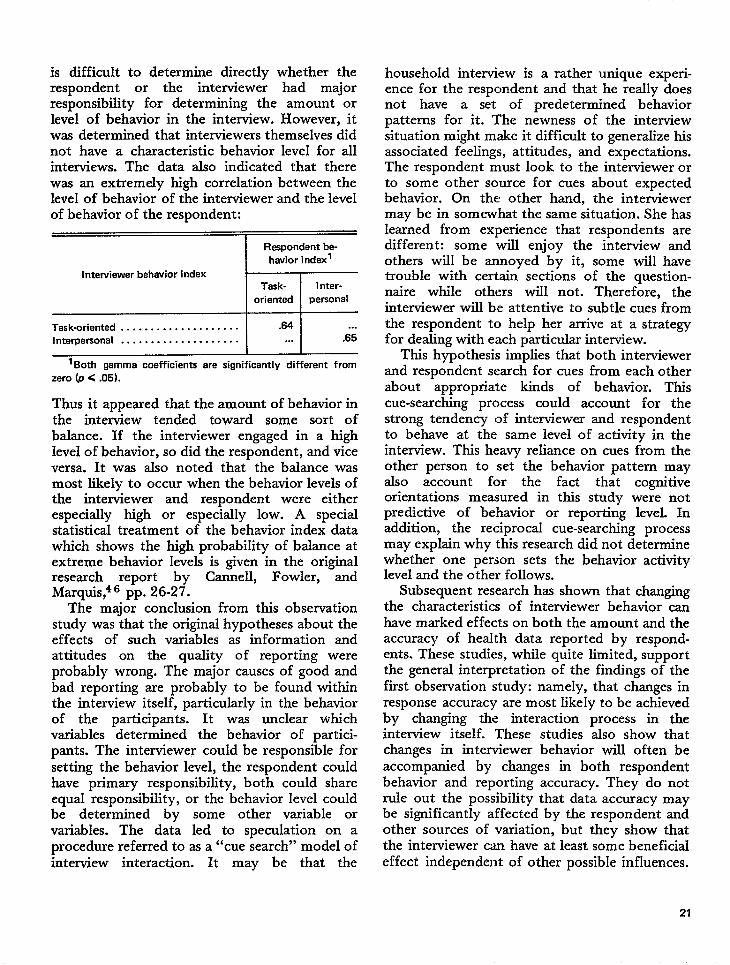
is difficult to determine directly whether therespondent or the interviewer had majorresponsibility for determining the amount orlevel of behavior in the interview. However, itwas determined that interviewers themselves didnot have a characteristic behavior level for allinterviews. The data also indicated that therewas an extremely high correlation between thelevel of behavior of the interviewer and the levelof behavior of the respondent:
Respondent be-
havior index’
Interviewer behavior indexTask- 1nter-
oriented personal
Task-oriented . . . . . . . . . . . . . . . . . . . . .64 .. .
Interpersonal . . . . . . . . . . . . . . . . . . . . ... .65
I I
1Both gamma coefficients are significantly different from
zero (p < .05).
Thus it appeared that the amount of behavior inthe interview tended toward some sort ofbalance. If the interviewer engaged in a highlevel of behavior, so did the respondent, and viceversa. It was also noted that the balance wasmost likely to occur when the behavior levels ofthe interviewer and respondent were eitherespecially high or especially low. A specialstatistical treatment of the behavior index datawhich shows the high probability of balance atextreme behavior levels is given in the originalresearch report by Cannell, Fowler, andMarquis,46 pp. 26-27.
The major conclusion from this observationstudy was that the original hypotheses about theeffects of such variables as information andattitudes on the quality of reporting wereprobably wrong. The major causes of good andbad reporting are probably to be found withinthe interview itself, particularly in the behaviorof the participants. It was unclear whichvariables determined the behavior of partici-pants. The interviewer could be responsible forsetting the behavior level, the respondent couldhave primary responsibility, both could shareequal responsibility, or the behavior level couldbe determined by some other variable orvariables. The data led to speculation on aprocedure referred to as a “cue search” model ofinterview interaction. It may be that the
household interview is a rather unique experi-ence for the respondent and that he really doesnot have a set of predetermined behaviorpatterns for it. The newness of the interviewsituation might make it difficult to generalize hisassociated feelings, attitudes, and expectations.The respondent must look to the interviewer orto some other source for cues about expectedbehavior. On the other hand, the interviewermay be in somewhat the same situation. She hasIearned from experience that respondents aredifferent: some will enjoy the interview andothers will be annoyed by it, some will havetrouble with certain sections of the question-naire while others will not. Therefore, theinterviewer will be attentive to subtle cues fromthe respondent to help her arrive at a strategyfor dealing with each particular interview.
This hypothesis impIies that both interviewerand respondent search for cues from each otherabout appropriate kinds of behavior. Thiscue-searching process could account for thestrong tendency of interviewer and respondentto behave at the same level of activity in theinterview. This heavy rek.nce on cues from theother person to set the behavior pattern mayalso account for the fact that cognitiveorientations measured in this study were notpredictive of behavior or reporting level. Inaddition, the reciprocal cue-searching processmay expksin why this research did not determinewhether one person sets the behavior activitylevel and the other folIows.
Subsequent research has shown that changingthe characteristics of interviewer behavior canhave marked effects on both the amount and theaccuracy of health data reported by respond-ents. These studies, while quite limited, supportthe general interpretation of the findings of thefirst observation study: namely, that changes inresponse accuracy are most likely to be achievedby changing the interaction process in theinterview itself. These studies also show thatchanges in interviewer behavior wiIl often beaccompanied by changes in both respondentbehavior and reporting accuracy. They do notrule out the possibility that data accuracy maybe significantly affected by the respondent andother sources of variation, but they show thatthe interviewer can have at least some beneficizdeffect independent of other possible influences.
21
URBAN EMPLOYMENT SURVEYBEHAVIOR INTERACTION STUDY
With the cooperation of the U. S. Departmentof Labor, Urban Employment Survey, theSurvey Research Center conducted anotherstudy2 of the behavior of the interviewer andrespondent in the household interview. Thisstudy by Marquis and Cannell differed in anumber of ways from the observation studydescribed above. Data on the verbal behavior ofthe interviewer and respondent were obtainedthrough a tape recording of the interview ratherthan through the recording of impressions by athird-person observer. The tape-recording proce-dure substantially reduces data collection costsand allows a much more detailed and refinedcoding of the verbal behavior that occurs duringthe interview.
In this study, a cross-sectional sample of 181employed male respondents residing within thecity limits of Detroit were interviewed. Therewere four interviewers-all of whom were white,female, middle-aged, and residents of thesuburbs.
New Coding Scheme
The study employed a revised coding schemefor interviewer and respondent verbal behavior.The coding scheme omitted all nonverbalbehavior. It also included more code categoriesfor task-related behavior: several categoriesreflected the way in which the question wasasked, and more detailed codes recorded theway the respondent answered questions. Becauseof the research on the effects of interviewerreinforcement which had taken place betweenthe first and second observation studies, a codefor interviewer feedback and respondent feed-back was included in the new scheme. Severalcodes dealing with irrelevant conversation weredeleted since they had not proved useful in theprevious study. A summary of the new codingscheme is presented in table 28. Additionalitems derived from more recent studies end thetable.
Main Findings
Behavior balance. –One offrom the original observation
22
the main findingsstudy was that the
behavior of the interviewer and the respondentwas best described in terms of a “balance”model. That is, if one person was engaging in agreat deal of behavior, so was the other. This isin contrast to another pattern which might beexpected: namely, that a low level of respondentbehavior would be compensated for by a hlighlevel of interviewer behavior, and conversely, ahigh level of respondent behavior would beaccompanied by a low level of interviewerbehavior. In this second observation study it waspossible to control, both in the questionnairedesign and in the statistical treatment of thedata, the number of questions asked over theentire interview. Thus it was possible tocompute an index of interviewer behavior leveland respondent behavior level per question. Theability to control the number of questions madeit possible to remove one source of variationwhich might have accounted for the behaviorbalance phenomenon observed in the firstobservation study. The correlation coefficientbetween the amount of interview behavior perquestion and the amount of respondent behaviorper question was .77. This demonstrates againthe strong interdependence of interviewer amdrespondent behavior during the interview. It alsoindicates that the variables or parameters whichhave a causal effect on reporting quality areprobably to be found in the behavior interactionwithin the interview rather than in the personalcharacteristics (e.g., attitudes) of either of theparticipants.
Question asking and probing. –Because of theexpanded coding scheme and because theinteractions were tape recorded rather thancoded during the interview, the second studyprovided a much more detailed description ofthe kinds of verbal behavior that occurredduring the interview. The descriptivedata
confirmed that those interviewing proceduresfor which the interviewers were trained, such asquestion asking and probing, were carried outeffectively in accordance with accepted pro,ce”dures. Interviewers asked the question in thecorrect manner more than 90 percent of thetime. Respondents gave many answers which didnot meet the objectives of the question, andinterviewers used many probes in attempts toget adequate information. The probes used weregenerally nondirective; that is, they did not
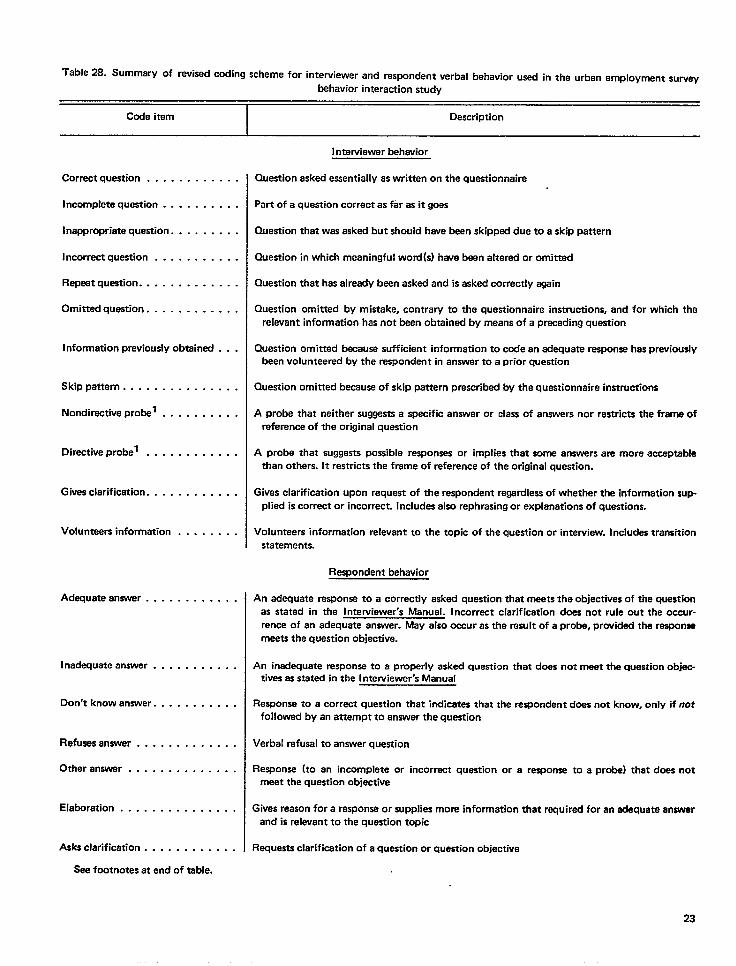
Table 28. Summery of revised coding scheme for interviewer and respondent verbal behavior used in the urban amplovment survev
behavior interaction study
Code itam Description
I nterviawer behavior
Correct question . . . . . . . . . . . .
Incomplete question . . . . . . . . . .
Inappropriate question. . . . . . . . .
Incorrect question
Repeat question. .
Omitted question.
. . . . . . . . . . .
. . . . . . . . . . .
. . . . . . . . . . .
Information previously obtained . . .
Skippattern . . . . . . . . . . . . . . .
Nondiractive probel . . . . . . . . . .
Directive probel .
Gives clarification.
. . . . . . . . . . .
. . . . . . . . . . .
Volunteers information . . . . . . . .
Adequate answer . . . . . . . . . . . .
Inadequataanswer . . . . . . . . . . .
Don’t knowanswer. . . . . . . . . . .
Refuses answar . . . . . . . . . . . . .
Other answer . . . . . . . . . . . . . .
Elaboration . . . . . . . . . . . . . . .
Asks clarification . . . . . . . . . . . .
See footnotes at end of table.
Question asked e~antially as writtan on the questionnaire
Part of a question correct as far es it goas
Quastion that was asked but should hawe been skipped due to a skip pattern
Question in which meaningful word(s) have been altered or omitted
Question that has already been asked and is asked correctly again
Question omitted by mistake, contrary to the questionnaire instructions, and for which the
I relevant information has not bean obtained by means of a preceding question
Question omitted because sufficient information to cede an edequate response has prwioudy
bean volunteered by the respondent in answer to a prior question
Question omitted because of skip pettern prescribed by tha questionnaire instructions
A probe that neither suggests a specific answer or class of answers nor restricts the frame of
reference of the original question
A probe that suggests possible responses or implies that some answers am more acceptable
than others. It restricts the frame of reference of the original question.
Gives clarification upon request of tha respondent regardless of whether the information sup-
plied is corrector incorrect. Includes elso rephrasing or explanations of questions.
Volunteers information relevant to the topic of the question or interview. Includes transition
statements.
Respondent behavior
An adequate response to a correctly asked question that meets the objectives of the quest.mn
as stated in the I nterviewer’s Manual. Incorrect clarification dces not rule out the occur-
rence of an adequate answer. May also occur as the result of a prob, providad the response
meets the question objective.
An inadequate response to a properly asked question that does not meet the question objec-
tives as stated in the I ntewievver”s Manual
Response to a correct question that indicates that the respondent does not know, only if not
followed by an attempt to answer the question
Verbal refusal to answer question
Response (to an incomplete or incorrect question or a response to a probe) that does not
meet the question objective
Gives reason for a response or supplies more information thet required for an adequate answer
and is relwant to the question topic
Requests clarification of a question or quastion objective
23
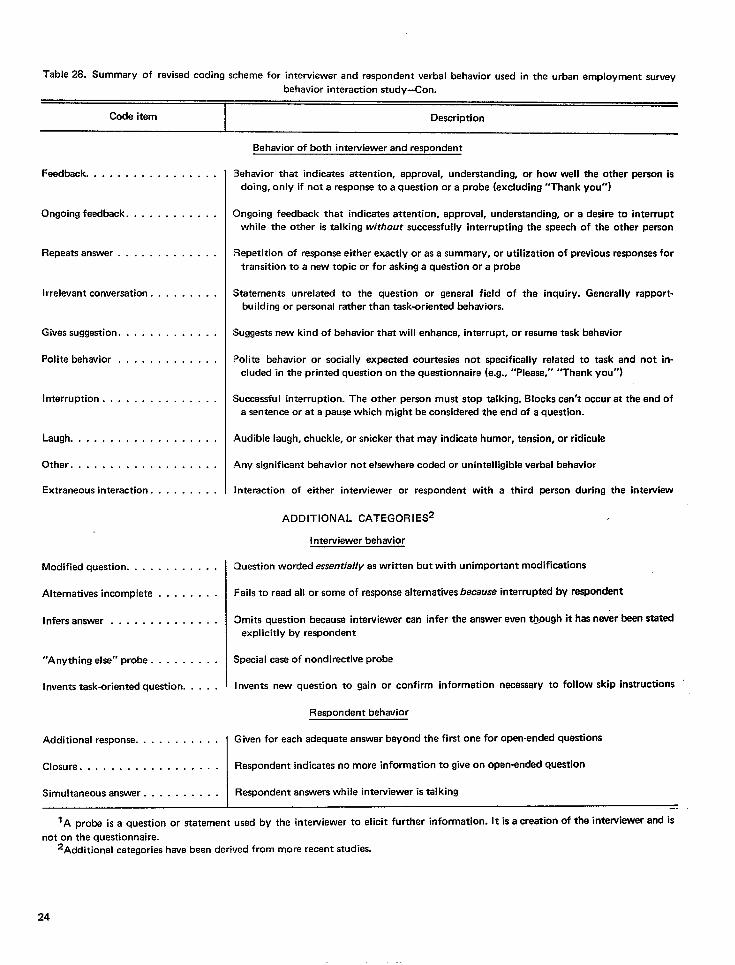
Table 28. Summary of revised coding scheme for interviewer and respondent verbal behavior used in the urban employment survey
behavior interaction study–Con.
-
Code item Description
Feedback . . . . . . . . . . . . . . . . .
Ongoing feedback. . . . . . . . . . . .
Repeats answer . . . . . . . . . . . . .
Irrelevant conversation . . . . . . . . .
Gives suggestion. . . . . . . . . . . . .
Polite behavior . . . . . . . . . . . . .
Interruption . . . . . . . . . . . . . . .
Laugh . . . . . . . . . . . . . . . . . . .
Other . . . . . . . . . . . . . . . . . . .
Extraneous interaction. . . . . . . . .
Modified question. . . . . . . . . . . .
Alternatives incomplete . . . . . . . .
Infers answer . . . . . . . . . . . . . .
“Anything else” probe . . . . . . . . .
Invents task-oriented question. . . . .
Additional response. . . . . . . . . . .
Closure . . . . . . . . . . . . . . . . . .
Simultaneous answer . . . . . . . . . .
Behavior of both interviewer and respondent
Behavior that indicates attention, approval, understanding, or how well the other person is
doing, only if not a response to a question or a probe (excluding “Thank You”)
Ongoing feedback that indicates attention, approval, understanding, or a desire to interrupt
while the other is talking without succeaef uli y interrupting the speech of the other person
Repetition of response either exactly or as a summary, or utilization of previous responses for
transition to a new topic or for asking a question or a probe
Statements unrelated to the question or general field of the inquiry. Generally rapport-
building or personal rather than task-oriented behaviors.
Suggests new kind of behavior that will enhance, interrupt, or resume task behavior
Polite behavior or socially expected courtesies not specifically related to task and not in-
cluded in the printed question on the questionnaire (e.g., “Please,’r “Thank you”)
Successful interruption. The other person must stop talking. Blocks can’t occur at the end of
a sentence or at a pause which might be considered the end of a question.
Audible laugh, chuckle, or snicker that may indicate humor, tension, or ridicule
Any significant behavior not elsewhere coded or unintelligible verbal behavior
Interaction of either interviewer or respondent with a third person during the interview
ADDITIONAL CATEGORIES
Interviewer behavior
Question worded esserrtia//y as written but with unimportant modifications
Fails to read all or some of response alternatives because interrupted by respondent
Omits question because intewiewer can infer the answer even [email protected] it has never been slatedexplicitly by respondent
Special case of nondirective probe
Invents new question to gain or confirm information necessary to follow skip instructions
Respondent behavior
Given for each adequate answer beyond the first one for open-ended questions
Respondent indicates no more information to give on open-ended question
Respondent answers while interviewer is talking
—.
1A pro~ is a question or ~atement used by the intewiewer to elicit further information. It is a creation of the intewiewer and’s
not on the questionnaire.2Additional categorieshavebeen derived from more recent studies.
24
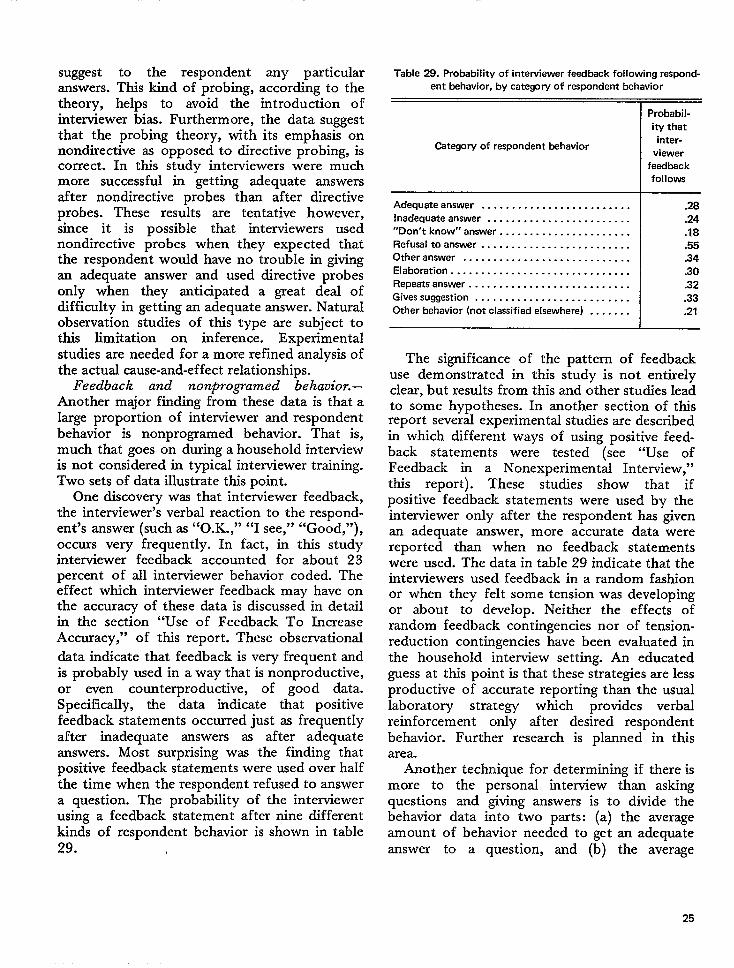
suggest to the respondent any particularanswers. This kind of probing, according to thetheory, helps to avoid the introduction ofinterviewer bias. Furthermore, the data suggestthat the probing theory, with its emphasis onnondirective as opposed to directive probing, iscorrect. In this study interviewers were muchmore successful in getting adequate answersafter nondirective probes than after directiveprobes. These results are tentative however,since it is possible that interviewers usednondirective probes when they expected thatthe respondent would have no trouble in givingan adequate answer and used directive probesonly when they anticipated a great deal ofdifficulty in getting an adequate answer. NaturaIobservation studies of this type are subject tothis limitation on inference. Experimentalstudies are needed for a more refined analysis ofthe actuzd cause-and-effect relationships.
Feedback and nonprogamed behavior.–Another major finding from these data is that alarge proportion of interviewer and respondentbehavior is nonprogramed behavior. That is,much that goes on during a household interviewis not considered in typical interviewer training.Two sets of data illustrate this point.
One discovery was that interviewer feedback,the interviewer’s verbal reaction to the respond-ent’s answer (such as “O.K.,” “I see,” “Good,”),occurs very frequently. In fact, in this studyinterviewer feedback accounted for about 23percent of all interviewer behavior coded. Theeffect which interviewer feedback may have onthe accuracy of these data is discussed in detailin the section “Use of Feedback To IncreaseAccuracy,” of this report. These observational
data indicate that feedback is very frequent andis probably used in a way that is nonproductive,or even counterproductive, of good data.Specifically, the data indicate that positivefeedback statements occurred just as frequentlyafter inadequate answers as after adequateanswers. Most surprising was the finding thatpositive feedback statements were used over halfthe time when the respondent refused to answera question. The probability y of the interviewerusing a feedback statement after nine differentkinds of respondent behavior is shown in table29.
Table 29. Probability of interviewer feedback following respond-
ent behavior, by category of respondent behavior
Probabil-
ity that
Category of respondent behaviorinter-
viewer
feedback
follows
Adequate answer . . . . . . . . . . . . . . . . . . . . . . . . . .28
Inadequate answer . . . . . . . . . . . . . . . . . . . . . . . . .24
“Don’tk now’’answer . . . . . . . . . . . . . . . . . . . . . . .18
Refusel to answer . . . . . . . . . . . . . . . . . . . . . . . . . .55
Other answer . . . . . . . . . . . . . . . . . . . . . . . . . . . . .34
Elaboration . . . . . . . . . . . . . . . . . . . . . . . . . . . . . . .30Repeats answer . . . . . . . . . . . . . . . . . . . . . . . . . . . .32
Gives suggestion . . . . . . . . . . . . . . . . . . . . . . . . . . .33
Other behavior (not classified elsewhere) . . . . . . . .21
The significance of the pattern of feedbackuse demonstrated in this study is not entirelyclear, but resuIts from thk and other studies leadto some hypotheses. In another section of thisreport several experimental studies are describedin which different ways of using positive feed-back statements were tested (see “Use ofFeedback in a Nonexperimental Interview,”this report). These studies show that ifpositive feedback statements were used by theinterviewer only after the respondent has givenan adequate answer, more accurate data werereported than when no feedback statementswere used. The data in table 29 indicate that theinterviewers used feedback in a random fashionor when they felt some tension was developingor about to develop. Neither the effects ofrandom feedback contingencies nor of tension-reduction contingencies have been evaluated inthe househoId interview setting. An educatedguess at this point is that these strategies are lessproductive of accurate reporting than the usuallaboratory strategy which provides verbalreinforcement only after desired respondentbehavior. Further research is planned in thisarea.
Another technique for determining if there ismore to the personal interview than askingquestions and giving answers is to divide thebehavior data into two parts: (a) the averageamount of behavior needed to get an adequateanswer to a question, and (b) the average
25
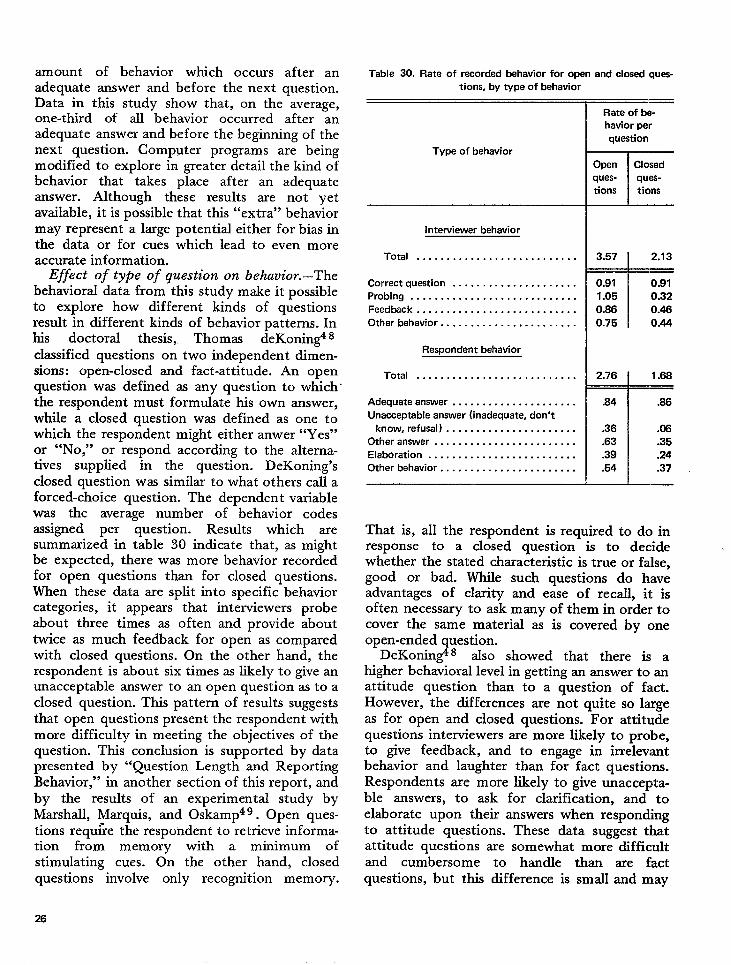
amount of behavior which occurs after anadequate answer and before the next question.Data in this study show that, on the average,one-thhd of all behavior occurred after anadequate answer and before the beginning of thenext question. Computer programs are beingmodified to explore in greater detail the kind ofbehavior that takes place after an adequateanswer. Although these results are not yetavailable, it is possible that this “extra” behaviormay represent a large potential either for bias inthe data or for cues which lead to even moreaccurate information.
Effect of type of question on behavior.–Thebehaviorzd data from this study make it possibleto explore how different kinds of questionsresult in different kinds of behavior patterns. Inhis doctoral thesis, Thomas deKonin& 8classified questions on two independent dimen-sions: open-closed and fact-attitude. An openquestion was defined as any question to which’the respondent must formulate his own answer,while a closed question was defined as one towhich the respondent might either anwer “Yes”or “No,” or respond according to the alterna-tives supplied in the question. DeKoning’sclosed question was similar to what others call aforced-choice question. The dependent variablewas the average number of behavior codesassigned per question. Results which aresummarized in table 30 indicate that, as mightbe expected, there was more behavior recordedfor open questions than for closed questions.When these data are split into specific behaviorcategories, it appears that interviewers probeabout three times as often and provide abouttwice as much feedback for open as comparedwith closed questions. On the other hand, therespondent is about six times as likely to give anunacceptable answer to an open question as to aclosed question. This pattern of results suggeststhat open questions present the respondent withmore difficult y in meeting the objectives of thequestion. This conclusion is supported by datapresented by “Question Length and ReportingBehavior, “ in another section of this report, andby the results of an experimental study byMarshall, Marquis, and 0skamp49. Open ques-tions requfre the respo~dent to retrieve informa-tion from memory with a minimum ofstimulating cues. On the other hand, closedquestions involve only recognition memory.
Table 30. Rate of recorded behavior for open and closed quas-
tions, by type of behavior
Type of behavior
Interviewer behavior
Total . . . . . . . . . . . . . . . . . . . . . . . . . . .
Correct question . . . . . . . . . . . . . . . . . . . . .
Probing . . . . . . . . . . . . . . . . . . . . . . . . . . . .
Feedback . . . . . . . . . . . . . . . . . . . . . . . . . . .
Other behavior . . . . . . . . . . . . . . . . . . . . . . .
Respondent behavior
Total . . . . . . . . . . . . . . . . . . . . . . . . . . .
Adequate answer . . . . . . . . . . . . . . . . . . . . .
Unacceptable answer (inadequate, don’t
know, refusal ) . . . . . . . . . . . . . . . . . . . . . .
Other answer . . . . . . . . . . . . . . . . . . . . . . . .
Elaboration . . . . . . . . . . . . . . . . . . . . . . . . .
Other behavior . . . . . . . . . . . . . . . . . . . . . . .
Rate of be-
havior per
question
I
Open Closed
ques- quas-
tions ticms
T3.57 2.13
~
0.91 0.91
1.05 0.32
0.86 0.46
0.75 0.44
12.76 1.68
.84 .86
.36 .06
.63 .35
.39 .24
.54 .37
That is, all the respondent is required to do inresponse to a closed question is to decidewhether the stated characteristic is true or false,good or bad. While such questions do haveadvantages of clarity and ease of recall, it isoften necessary to ask many of them in order tocover the same material as is covered by oneopen-ended question.
DeKonin& 8 also showed that there is ahigher behavioral level in getting an answer to anattitude question than to a question of fact.However, the differences are not quite so largeas for open and closed questions. For attitudequestions interviewers are more likely to probe,to give feedback, and to engage in irrelevantbehavior and laughter than for fact questions.Respondents are more likely to give unaccepta-ble answers, to ask for clarification, and toelaborate upon their answers when respondhgto attitude questions. These data suggest thatattitude questions are somewhat more difficultand cumbersome to handle than are factquestions, but this difference is small and may
26
be due to other variablesattitude-fact distinction.
confounded with the
Diaposhg specific question problems. –Oneof the intriguing motives for using the behaviorcoding technique is to arrive at a systematicevaluation of the adequacy of specific questionsas they appear on the interview schedule. Thiskind of evaluation procedure maybe very usefulin the pretest phase of questionnaire construc-tion. Social science strives to be a scientificdiscipline, but the procedures used by socialscientists to develop and validate questions andquestionnaires are generally crude. One usuallysends a group of interviewers into the field withthe questionnaire developed in the office. Thereis then a meeting (or series of meetings) duringwhich interviewers and the researcher dkcuss thequestionnaire. One hears familiar statementssuch as “This question seems to work well,” or“This question seems to do what we want it tobecause we have the distribution of responses.”The interviewer might say, “I don’t think therespondents really understood this question,” or“This question irritates people.” It is on thebasis of such higidy subjective evaluations thatquestionnaires are developed.
In preliminary work done for the U.S.Department of Labor, the behavior-codingmethod has shown considerable promise forevaluating some aspects of pretest interviewing.
There seem to be three kinds of problemswith questions: (a) those attributable to theinterviewer, (b) those that reflect respondentdifficulty, such as failure to understand thequestion or trouble in recalling information, and(c) problems caused by the questions them-selves, such as poor syntax, “skip” instructionsthat are difficult to follow, or obscureplacement on the interview schedule. Asmall-scale attempt was made to trace questionproblems to one or more of these sources byusing a small number of the “codes obtained inthe behavior observation study.
For example, those questions that were askedincorrectly by the interviewers at least 15percent of the time were identified. A questionwas coded as “incorrectly asked” if importantwords or phrases were changed or omitted.= The
‘More stringent criteria were used in the last section of thequestionnaire which contained mostly attitude questions.
list ofseveralphrases,
w
incorrectly asked questions revealeditems which contained parentheticalothers which contained difficult syntax,
‘md stiI1 others which were extremely cumber-some to handle in verbal form. The first set ofquestions pointed to the fact that duringtraining, interviewers had been given incon-sistent rules about handling parentheticalphrases. The second group of questions,containing awkward syntax, pointed to aproblem that has been overlooked by manyquestionnaire designers: When questions areextremely long and complex, respondents ofteninterrupt at the end of a clause to answerwithout allowing the interviewer to finish thequestion.
Another set of 39 questions was identified ashaving been answered inadequately more than14 percent of the time even though they wereasked correctly. From this list there appeared tobe two reasons why a question would receive aninadequate answer code a high percentage of thetime: (a) the respondent was unable to answerbecause the required information was not easilyaccessible from memory, and (b) the interviewercould not discriminate between an adequate andinadequate answer, and therefore mistakenlyaccepted the inadequate answer as meeting theobjective of the question.
Another analysis of question problems wastried in which two kinds of interviewer omissioncodes were combined to show different kinds ofquestion problems. The logic of that analysis isas follows:
Nature of problem Code (N}l Code (*)2
Interviewer error . . . . . . . . . . . . . . High High
Questionnaire redundancy . . . . . . . High Low
Skip pattern or format problem . . . Low High
No problem . . . . . . . . . . . . . . . . . . Low Low
1Code N indicate$ a qu~tion was omitted becausetheanswerwas already given.
2Code * indicates that the question was omitted by mistake.
NOTES: “High” indicates the question was omitted 10 per-
cent of the time or more.
“Low” indicates the question was omitted less than 10 per-
cent of the time.
There were 27 questions identified as beingomitted many times , either because of error or
27
because the interviewer thought the answer hadalready been given. The data suggest thatomission problems like these might be overcomeif interviewers received better instruction as towhat constitutes an adequate answer. Thirteenquestions were identified as belonging to groupthree, questions which were omitted often bymistake but were not skipped because an answerhad already been obtained. This finding alsosuggests the need for better interviewer trainingsince these questions are often skipped becausethe interviewers assume they have been an-swered adequately through previous questions—when indeed they have not.
On the other hand, better interviewer trainingconcerning the objectives of each question maynot entirely solve the omission problem. Otherdata indicate that omission rates are above 10percent only when a question is to be asked of asubsample of respondents. Questions which
must be asked of all respondents are almostnever subject: to high omission rates. Of the 71questions in this interview which were to beasked of all respondents, only 1 was omittedmore than 10 percent of the time, while of the102 questions to be asked of subsamples ofrespondents, 55 (54 percent) were skipped morethan 10 percent of the time, either by mistakeor because an adequate answer had already beenobtained. Thus, omission problems may betraced to skip instructions and other subsam-pling techniques. While these procedures areoften necessary, the questionnaire designershould be aware of the potential for intervieweromission error whenever subsampling techniquesare used. The subsampling omission bias may beespecially acute in an interview such as the onetested, in which skip patterns occur frequently.
Other procedures to identify question prob-lems have been or will be tried. The possibilityof obtaining systematic data on questionproblems in the pretest phase of a survey studyremains intriguing. Much work is still to be donein devising procedures relating to questiondesign. The Survey Research Center methodol-ogy program is working to develop additionalkinds of logical analysis of question problems, aswell as to reduce the cost and time involved inobtaining suchproblems are
28
data. When some of these lattersolved, other survey research
agencies should be encouraged to experimentwith these appropriate procedures. There areenough experimental and observation studiesnow in the literature to indicate that questionvariables such as structure and content areimportant determinants of data accuracy insurvey interviews. WMe many factors maypotentially affect data accuracy, the questionvariables probably have a much greater potentialeffect on overall accuracy and completenessthan does any other single class of variables. Athorough understanding of how question con-struction and question content affect dataaccuracy should do a great deal to advance theusefulness of the survey interview for researchpurposes.
Effect of respondent age and race onbehavior. –Social scientists and those responsiblefor the conduct of cross-sectional sample surveysoften hypothesize that the demographic charac-teristics of the interviewer and the respondent,such as age, race, education, and income, willhave some effect on survey data accuracy. Forexample, earlier research has shown that whiterespondents are reluctant to admit prejudicetoward blacks when the interviewer is black.Such results are interpreted as being reasonablein terms of cultural norms concerning prejudice.
The question remains, however, whether theresults of these studies are applicable to thereporting of all information in all surveyinterviews. For example, there is evidence tosuggest that the accuracy of data obtained aboutsuch things as physician visits or financial factsdoes not differ by race of respondent. Thissecond SRC observation study included anexperimental design which provided for theinvestigation of interaction patterns by respond-ent age and race. White middle-class femaleinterviewers interviewed employed male re-spondents. There were four experimental groupsof respondents: (a) white, 18-34 years (N=47);(b) black, 18-34 years (N=44); (c) white, 35-64years (N=43); and (d) black, 35-64 years(N=47).
With respect to the effect of age on behaviorduring the interview, the data confirm theresults of the first observation study. Olderrespondents were much more likely to engage ina large amount and wide variety of behavior
during the interview. The proportion of theirbehavior devoted to good task performance wasmuch lower than that of younger respondents.In addition, when interviewing older respond-ents, the interviewers displayed high frequenciesof a variety of behavior. Thus, an interview witha younger respondent was quite different froman interview with an older respondent. Theformer appeared to be task oriented while thelatter was characterized by a great deal of extrabehavior which may have resulted in keeping theinteraction at a relatively tension-free level.
The effects of respondent race on the kind ofbehavior shown in the interview were not clear.Two attempts have been made to analyze andexplain these data,zY48 and both produced asomewhat similar set of inferences based for themost part on nonsignificant statistical trends.The overriding conclusion is that when age wascontrolled, the effect of respondent race on thekind of behavior in an interview was not markedfor the kind of information contained in theinterview. However, the data do suggest that ifthere was a race effect, it was in the areas ofinterviewer probing behavior and respondentinadequate answering behavior. Although thedifferences were not always statistically signifi-cant, it appeared that the proportion ofinadequate answers (answers which normallyrequire probing) was higher among black thanamong white respondents, and that interviewersprobed more with black than with whiterespondents. Also, black respondents tended togive more “don’t know” answers, repeat more oftheir answers, and ask for clarification morefrequently than did their white counterparts.These racial differences are very small but mayindicate alight differences in difficulty with thequestions. The pattern viewed as a whole doesnot indicate any active resistance or lack ofmotivation to cooperate.
There was a slight tendency for whiterespondents to exhibit more ability to giveadequate answers than did their black counter-parts, and interactions with the female inter-viewers seemed to be less task oriented amongwhite respondents. For example, white malerespondents engaged in slightly more politebehavior, feedback, and elaborations than didblack males. White males also seemed to show
more resistance or more dominance whileperforming their task, as indicated by a slightlyhigher percentage of refusals to answer,suggestions to the interviewer, and unsuccessfulattempts to interrupt the interviewer.
In summary, the age effect was found to befairly reliabIe. It was quantitative rather thanqualitative. Older respondents in comparison toyounger respondents engaged in a higherpercentage of almost every kind of behaviorexcept providing adequate answers and makingrequests for clarification. The race effect wasmuch smaller than was the age effect. Blackrespondents showed a pattern of behaviorcharacteristic of well-motivated performance ona difficult task. White respondents seemed tohave an easier time at the task, interacted moresmoothly with the interviewer, and showed aslightly greater tendency toward dominance orresistance. It seems likely that whateverdifferences exist may reflect variables such aseducational background of respondents ratherthan race as such.
Interpretation problems–The difficult y intrying to interpret the nonsignificant differencesbetween the two raciaI groups points to anapparent problem or handicap in the currentbehavior observation scheme. The problemseems to be that the readily coded behaviorcategories such as “asks question correctly,”“refuses to answer,” and “laughs” are difficultto define in an abstract sense. Social scientistsare accustomed to dealing with abstractconcepts about human interaction, such as:“shows hostility,” “is annoyed,” “interactssmoothly,” or “is having conceptual difficulty.”At an even higher level of abstraction theseconcepts might be: “is ingratiating,” “showslack of rapport, “ “enjoys the interview,” or “ismotivated.” A point to be made in defense ofthe observation technique and its scheme ofcategorizing behavior into small units is thatextrapolating behavior codes to a higher level of
abstraction does not really provide much moremeaning to the data. The theories of humaninteraction to which some have attempted to fitthe existing data have not themselves beenvalidated to any great extent. Interpreting thepresent data in these frames of reference will
29
probably not yieldpredictive power.
any greater understanding or
It is suggested, however, that the problem ofattributing meaning to the observational datamay be carried out in a different way. If it isrecognized that the problem of the surveyresearcher is to obtain complete and valid data,the strategy for assigning meaning to the variousbehavior observation codes becomes fairly clear.Empirical research is needed to establish thecause-and-effect relationship between the occur-rence of different kinds of behavior or patternsof behavior and the validity of data reported.
Thus, the next research steps might includeseveral kinds of studies which record and codethe behavior that takes place in an interview andwhich, in addition, obtain independent verificat-ion of the accuracy and completeness of thedata the respondent has reported in his answers.Correlations between the accuracy measures andthe behavior measures would then yieldsignificant insights into the meaning of thebehavior codes or combinations of behaviorcodes.
INTERVIEWER PERFORMANCE DIFFERENCE:
SOME IMPLICATIONS FOR FIELD SUPERVISION AND TRAINING
Most survey researchers believe the adage thatpractice makes perfect, or at least makes forimprovement. Thus, they expect seasoned inter-viewers when compared with less experiencedones to be more skilled at adapting to variousinterviewing situations, more at ease in interact-ing with respondents from various social classes,and more proficient in using nonbiasing proce-dures. Interviews conducted by an experiencedstaff usually present fewer problems in coding;the responses are clearer and more adequate tothe objectives, contingencies are followed morestrictly, and, with a minimum of omitted ques-tions, there are fewer noncodable replies.
Data from methodological studies which wererecently examined raise questions about thepositive effects of experience in interviewing.Since the analysis of interviewer behavior wasnot planned as part of these studies, the researchdesigns are inadequate to produce conclusivefindings but are sufficiently intriguing to en-courage further study. As an incidental analysisin one study, the data on failure to reportknown hospitalizations were tabulated for eachitem separately. These data showed a surprisingtrend: The larger the number of interviews takenby a single interviewer, the fewer the hospitaliza-tions reported by the respondents. Althoughrandom assi~ment of interviewers was notmade, and the results therefore might reflect adifference in types of respondents interviewed
by each interviewer, the finding was sufficientlyinteresting to raise questions about the positiveeffects of experience in interviewing and to leadto an analysis of interviewer performance inother studies.
The first SRC studyl 7 was designed toinvestigate the underreporting of hospitaliza-tions. A sample of approximately 2,000 hospitalrecords was selected from patients who weredischarged from a hospital within the 12 monthspreceding the interview. The sample was takenfrom hospitals located in counties that were apart of the Health Interview Survey (HIS)fregular national sample. The family name andaddress of the person discharged were given tothe Bureau of the Census interviewers whoregularly conducted the interviews for the inter-view survey in that county. Twenty-seven ex-perienced Bureau of the Census interviewerswere included in this study. All interviewersworking in the areas in which sample hospitalswere located did some interviewing. Because thenumber of sampled discharges varied consid-erably by county, interviewers received varyingnumbers of sample addresses each week.
The questionnaire and interviewing proce-dures used were identical to those of the regular
-fFor details of the sample, the procedures used, and the
findings of this Health Interview Survey, see reference 17.
30
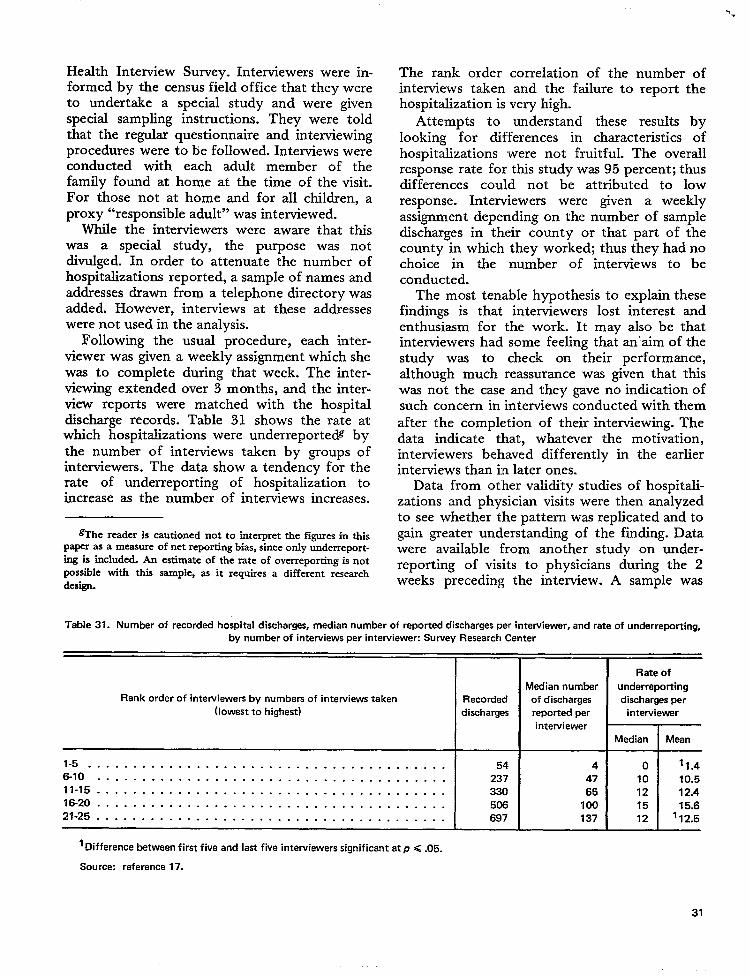
Health Interview Survey. Interviewers were in-formed by the census field office that they wereto undertake a special study and were givenspecial sampling instructions. They were toldthat the regular questionnaire and interviewingprocedures were to be followed. Interviews wereconducted with each adult member of thefamily found at home at the time of the visit.For those not at home and for all children, aproxy “responsible adult” was interviewed.
While the interviewers were aware that thiswas a special study, the purpose was notdivulged. In order to attenuate the number ofhospitalizations reported, a sample of names andaddresses drawn from a telephone directory wasadded. However, interviews at these addresseswere not used in the analysis.
Following the usual procedure, each inter-viewer was given a weekly assignment which shewas to complete during that week. The inter-viewing extended over 3 months, and the inter-view reports were matched with the hospitaldischarge records. Table 31 shows the rate atwhich hospitalizations were underreported bythe number of interviews taken by groups ofinterviewers. The data show a tendency for therate of underreporting of hospitalization toincrease as the number of interviews increases.
@he reader is cautioned not to interpret the figures in this
paper as a measure of net reporting bias, since only underreport-ing is included. An estimate of the rate of overreporting is notPOSSI%IC with th~ sample, as it requires a different researchdesign.
+.
The rank order correlation of the number ofinterviews taken and the failure to report thehospitalization is very high.
Attempts to understand these results bylooking for differences in characteristics ofhospitalizations ‘were not fruitful. The overallresponse rate for this study was 95 percent; thusdifferences could not be attributed to lowresponse. Interviewers were given a weeklyassignment depending on the number of sampledischarges in their county or that part of thecounty in which they worked; thus they had nochoice in the number of interviews to beconducted.
The most tenable hypothesis to expktin thesefindings is that interviewers lost interest andenthusiasm for the work. It may also be thatinterviewers had some feeling that an’ aim of thestudy was to check on their performance,although much reassurance was given that thiswas not the case and they gave no indication ofsuch concern in interviews conducted with themafter the completion of their interviewing. Thedata indicate that, whatever the motivation,interviewers behaved differently in the earlierinterviews than in later ones.
Data from other valicKty studies of hospitali-zations and physician visits were then analyzedto see whether the pattern was replicated and togain greater understanding of the finding. Datawere available from another study on under-reporting of visits to physicians during the 2weeks preceding the interview. A sample was
Table 31. Number of recorded hospital discharges, median number of reported discharges per interviewer, and rate of underreporting,
by number of intewiews per interviewer: Survey Research Center
Rate of
Madian number underreporting
Rank order of interviewers by numbers of interviews taken Recorded of discharges discharges per
(lowest to highest) discharges reported per interviewer
intewiewer
Median Mean
1-5 . . . . . . . . . . . . . . . . . . . . . . . . . . . . . . . . . . . . . . . - 54 4 0 ‘1.4
6-1o . . . . . . . . . . . . . . . . . . . . . . . . . . . . . . . . . . . . . . . 237 47 10 10.5
11-15 . . . . . . . . . . . . . . . . . . . . . . . . . . . . . . . . . . . . . . . 330 65 12 12.4
16-20 . . . . . . . . . . . . . . . . . . . . . . . . . . . . . . . . . . . . . . . 506 100 15 15.6
21-25 . . . . . . . . . . . . . . . . . . . . . . . . . . . . . . . . . . . . . . . 697 137 12 ‘ 12.5
1Difference between first five and last five interviewers significant at p <.05.
Source: reference 17.
31
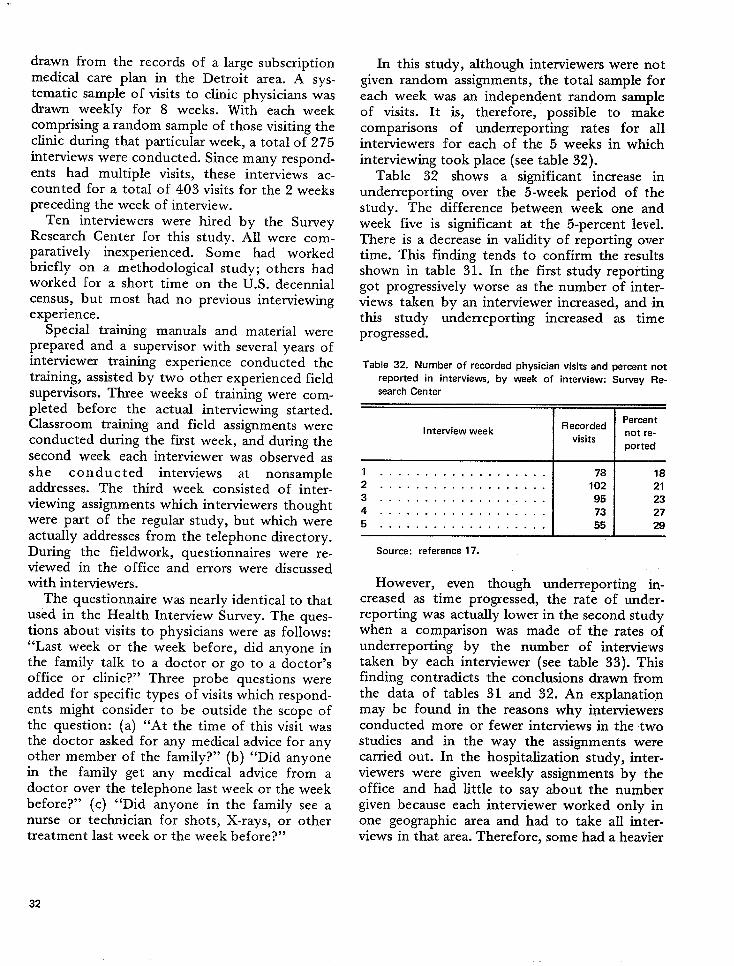
drawn from the records of a large subscriptionmedical care plan in the Detroit area. A sys-tematic sample of visits to clinic physicians wasdrawn weekly for 8 weeks. With each weekcomprising a random sample of those visiting theclinic during that particular week, a total of 275interviews were conducted. Since many respond-ents had multiple visits, these intemiews ac-counted for a total of 403 visits for the 2 weekspreceding the week of interview.
Ten interviewers were hired by the SurveyResearch Center for this study. All were com-paratively inexperienced. Some had workedbriefly on a methodological study; others hadworked for a short time on the U.S. decennialcensus, but most had no previous interviewingexperience.
Special training manuals and material wereprepared and a supervisor with several years ofinterviewer training experience conducted thetraining, assisted by two other experienced fieldsupervisors. Three weeks of training were com-pleted before the actual interviewing started.Classroom training and field assignments wereconducted during the first week, and during thesecond week each interviewer was observed asshe c o n du c t ed interviews at nonsampleaddresses. The third week consisted of inter-viewing assignments which interviewers thoughtwere part of the regular study, but which wereactually addresses from the telephone directory.During the fieldwork, questionnaires were re-viewed in the office and errors were discussedwith interviewers.
The questionnaire was nearly identical to thatused in the Health Interview Survey. The ques-tions about visits to physicians were as follows:“Last week or the week before, did anyone inthe family talk to a doctor or go to a doctor’soffice or clinic?” Three probe questions wereadded for specific types of visits which respond-ents might consider to be outside the scope ofthe question: (a) “At the time of this visit wasthe doctor asked for any medical advice for anyother member of the family?” (b) “Did anyonein the family get any medical advice from adoctor over the telephone last week or the weekbefore?” (c) “Did anyone in the family see anurse or technician for shots, X-rays, or othertreatment last week or the week before?”
In this study, although interviewers were notgiven random assignments, the total sample foreach week was an independent random sampleof visits. It is, therefore, possible to makecomparisons of underreporting rates for allinterviewers for each of the 5 weeks in whichinterviewing took place (see table 32).
Table 32 shows a significant increase inunderreporting over the 5-week period of thestudy. The difference between week one andweek five is significant at the 5-percent level.There is a decrease in validity of reporting overtime. This finding tends to confirm the resultsshown in table 31. In the first study reportinggot progressively worse as the number of inter-views taken by an interviewer increased, and inthis study underreporting increased as timeprogressed.
Table 32. Number of recorded physician visits and percent not
reported in interviews, by week of interview: Survey Re-
search Center
=
RecordedPercent
Interview week not re-visits
ported
Source: reference 17.
However, even though underreporting in-creased as time progressed, the rate of underr-eporting was actually lower in the second studywhen a comparison was made of the rates ofunderreporting by the number of interviewstaken by each interviewer (see table 33). Thisfinding contradicts the conclusions drawn fromthe data of tables 31 and 32. An explanationmay be found in the reasons why interviewersconducted more or fewer interviews in the twostudies and in the way the assignments werecarried out. In the hospitalization study, inter-viewers were given weekly assignments by theoffice and had little to say about the numblergiven because each interviewer worked only inone geographic area and had to take all inter-views in that area. Therefore, some had a heavier
32
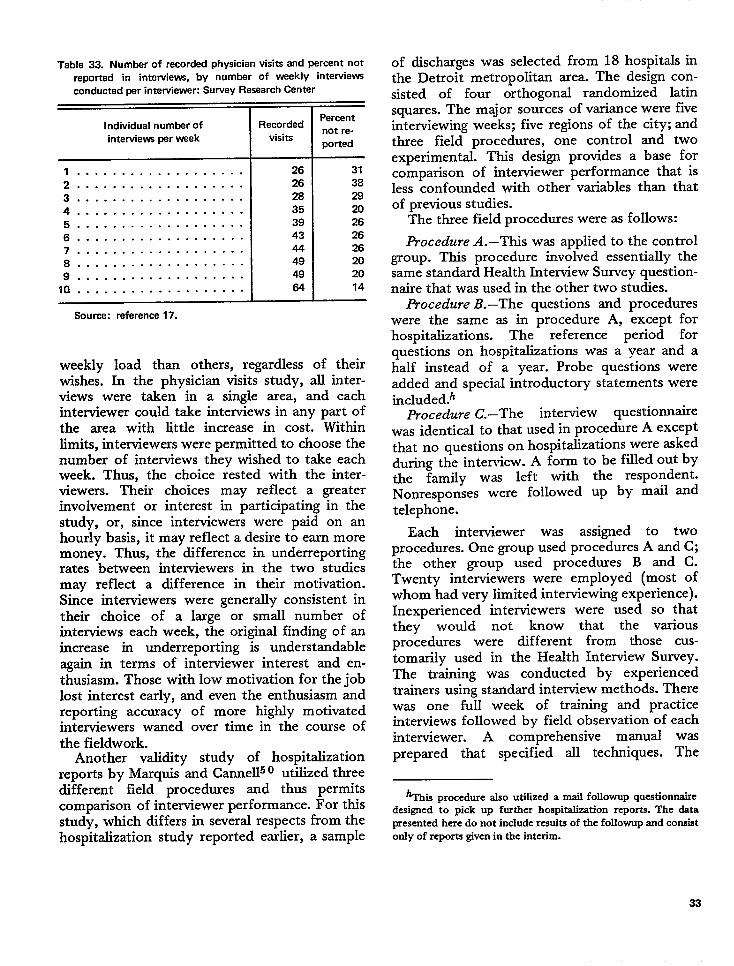
Table 33. Number of recorded physician visits and percent not
reported in interviews, by number of weekly interviews
conducted per interviewer: Survey Research Center
1
IPercent
Individual number of Recordadnot re-
intewiews per weak visitsported
1 .. ... .. ... .. .. .. .. .2 . . . . . . . . . . . . . . . . . . .
3 . . . . . . . . . . . . . . . . . . .
4 . . . . . . . . . . . . . . . . . . .
5 . . . . . . . . . . . . . . . . . . .
6 . . . . . . . . . . . . . . . . . . .
7 . . . . . . . . . . . . . . . . . . .
8 . . . . . . . . . . . . . . . . . . -
9 . . . . . . . . . . . . . . . . . . .
10 . . . . . . . . . . . . . . . . . . .
Source: reference 17.
I26 31
26 38
28 29
35 2039 2643 2644 2649 2049 2064 14
weekly load than others, regardless of theirwishes. In the physician visits study, all inter-views were taken in a single area, and eachinterviewer could take interviews in any part ofthe area with little increase in cost. Witbinlimits, interviewers were permitted to choose thenumber of interviews they wished to take eachweek. Thus, the choice rested with the inter-viewers. Their choices may reflect a greaterinvolvement or interest in participating in thestudy, or, since interviewers were paid on anhourly basis, it may reflect a desire to earn moremoney. Thus, the difference in underreportingrates between interviewers in the two studiesmay reflect a difference in their motivation.Since interviewers were generally consistent intheir choice of a large or small number ofinterviews each week, the original finding of anincrease in underreporting is understandableagain in terms of interviewer interest and en-thusiasm. Those with low motivation for the joblost interest early, and even the enthusiasm andreporting accuracy of more highly motivatedinterviewers waned over time in the course ofthe fieldwork.
Another validity study of hospitalizationreports by Marquis and Canne1150 utifized threedifferent field procedures and thus permitscomparison of interviewer performance. For thisstudy, which differs in several respects from thehospitalization study reported earlier, a sample
of discharges was selected from 18 hospitals inthe Detroit metropolitan area. The design con-sisted of four orthogonal randomized latinsquares. The major sources of variance were fiveinterviewing weeks; five regions of the city; andthree field procedures, one control and twoexperimental. This design provides a base forcomparison of interviewer performance that isless confounded with other variables than thatof previous studies.
The three field procedures were as follows:
Procedure A.–This was applied to the controlgroup. This procedure involved essentially thesame standard Health Interview Survey question-naire that was used in the other two studies.
Procedure B.–The questions and procedureswere the same as in procedure A, except forhospitrdizations. The reference period forquestions on hospitalizations was a year and ahalf instead of a year. Probe questions wereadded and special introductory statements wereincluded.~
Procedure C.–The interview questionnairewas identical to that used in procedure A exceptthat no questions on hospitalizations were askedduring the interview. A form to be filled out bythe family was left with the respondent.Nonresponses were followed up by mail andtelephone.
Each interviewer was assigned to twoprocedures. One group used procedures A and C;the other group used procedures B and C.Twenty interviewers were employed (most ofwhom had very limited interviewing experience).Inexperienced interviewers were used so thatthey would not know that the variousprocedures were different from those cus-tomarily used in the Health Interview Survey.The training was conducted by experiencedtrainers using standard interview methods. Therewas one full week of training and practiceinterviews followed by field observation of eachinterviewer. A comprehensive manual wasprepared that specified all techniques. The
‘This procedure also utilized a mail followup questionnairedesigned to pick up further hospitalization reports. The datapresented here do not include results of the followup and consistonly of reports given in the intcsim.
33
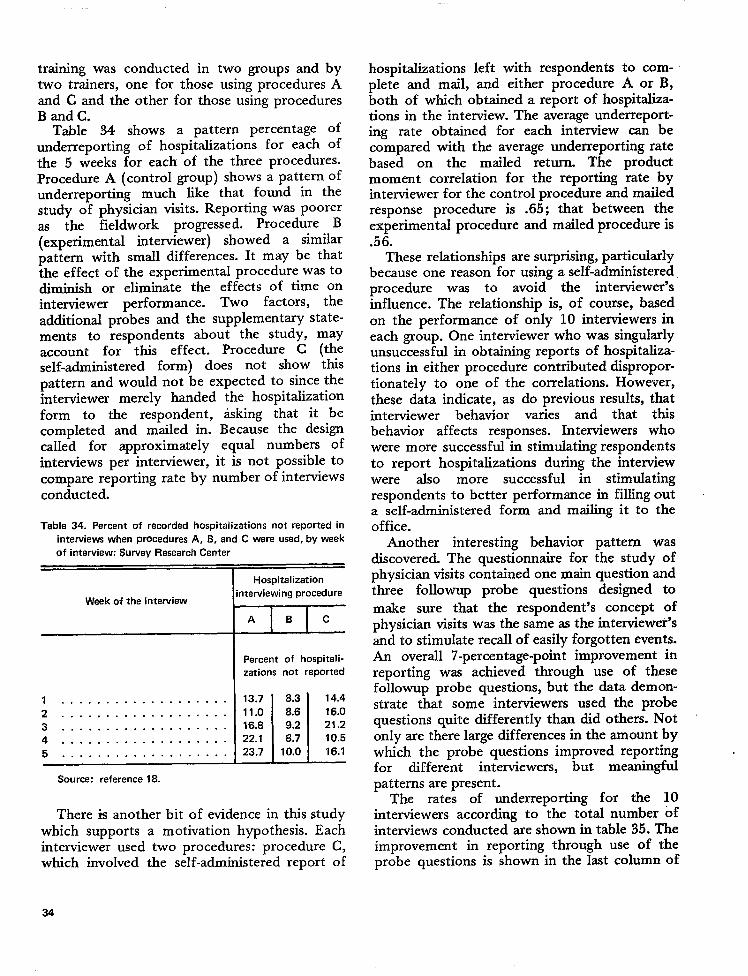
training was conducted intwo trainers, one for those
two groups and byusing procedures A-.
and C and the other for those using proceduresB and C.
Table 34 shows a pattern percentage ofunderreporting of hospitalizations for each ofthe 5 weeks for each of the three procedures.Procedure A (control group) shows a pattern ofunderreporting much like that found in thestudy of physician visits. Reporting was pooreras the fieldwork progressed. Procedure B(experimental interviewer) showed a similarpattern with small differences. It may be thatthe effect of the experimental procedure was todiminish or eliminate the effects of time oninterviewer performance. Two factors, theadditional probes and the supplementary state-ments to respondents about the study, mayaccount for t~s effect. Procedure C (theself-administered form) does not show thispattern and would not be expected to since theinterviewer merely handed the hospitalizationform to the respondent, &king that it becompleted and mailed in. Because the designcalled for approximately equal numbers ofinterviews per interviewer, it is not possible tocompare reporting rate by number of interviewsconducted.
Table 34. Percent of recorded hospitalizations not reported in
interviews when procedures A, B, and C were used, by waek
of interview: Survey Research Center
Week of the interviaw
1 .... .... ... .. .. ....2 . . . . . . . . . . . . . . . . . . .
3 . . . . . . . . . . . . . . . . . . .
4 . . . . . . . . . . . . . . . . . . .
5 . . . . . . . . . . . . . . . . . . .
Hospitalization
interviewing procedure
ZEIZ
Percent of hospitali-
zations not reported
-LL13.7 8.3 14.4
11.0 8.6 16.0
16.8 9.2 21.2
22. I 8.7 10.5
23.7 10.0 16.1
Source: reference 18.
There is another bit of evidence in this studywhich supports a motivation hypothesis. Eachinterviewer used two procedures: procedure C,which involved the self-administered report of
hospitalizations left with respondentsplete and mail, and either procedure
to com-A or B,
koth of which obtained a report of hospitzdiza-tions in the interview. The average underreport-ing rate obtained for each interview can becompared with the average underreporting ratebased on the mailed return. The productmoment correlation for the reporting rate byinterviewer for the control procedure and mailedresponse procedure is .65; that between theexperimental procedure and mailed procedure is.56.
These relationships are surprising, particularlybecause one reason for using a self-administeredprocedure was to avoid the interviewer’sinfluence. The relationship is, of course, basedon the performance of only 10 interviewers ineach group. One interviewer who was singularlyunsuccessful in obtaining reports of hospitaliza-tions in either procedure contributed dispropor-tionately to one of the correlations. However,these data indicate, as do previous results, thatinterviewer behavior varies and that his
behavior affects responses. Interviewers whowere more successful in stimulating respondentsto report hospitalizations during the interviewwere also more successful in stimulatingrespondents to better performance in filling outa self-administered form and mailing it to theoffice.
Another interesting behavior pattern wasdiscovered. The questionnaire for the study ofphysician visits contained one main question andthree followup probe questions designed tomake sure that the respondent’s concept ofphysician visits was the same as the interviewer’sand to stimulate recall of easily forgotten events.An overall 7-percentage-point improvement inreporting was achieved through use of thesefollowup probe questions, but the data demon-strate that some interviewers used the probequestions quite differently than did others. Notonly are there large differences in the amount bywhich the probe questions improved reportingfor different interviewers, but meaningfulpatterns are present.
The rates of underreporting for the 10interviewers according to the total number ofinterviews conducted are shown in table 35. Theimprovement in reporting through use of theprobe questions is shown in the last column of
34
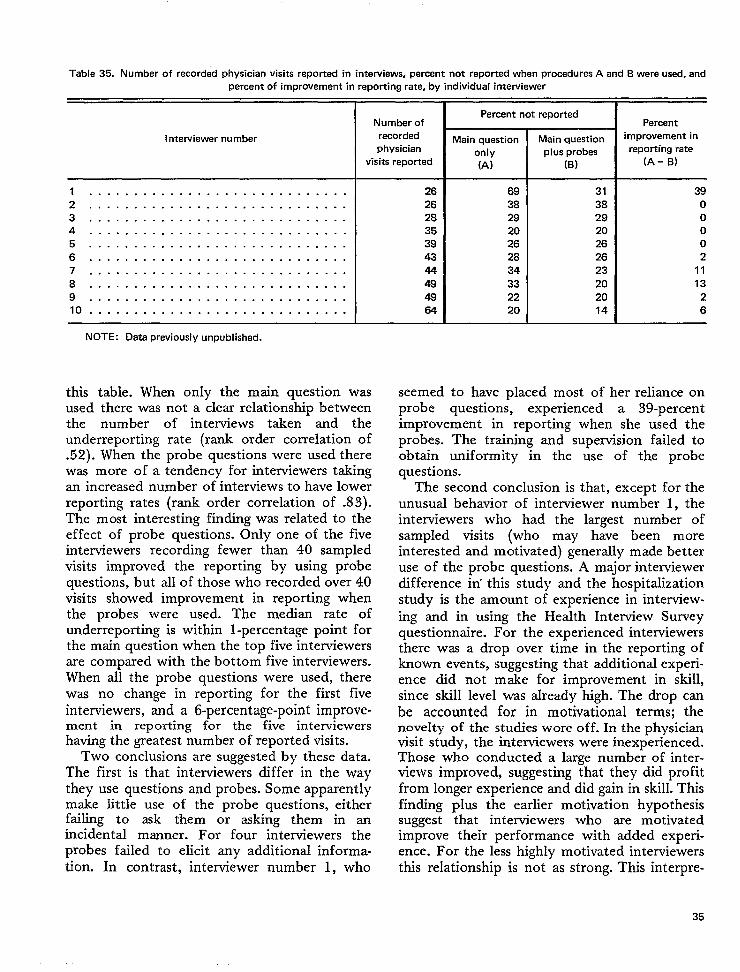
Table 35. Number of recorded physician visits reported in interviews, percent not reported when procedures A and B were used, andpercent of improvement in reporting rate, by individual interviewer
I ntewiewer number
1 .. .. ... .... . ... .. ... . .. .. .. . .2 . . . . . . . . . . . . . . . . . . . . . . . . . . . . .
3 . . . . . . . . . . . . . . . . . . . . . . . . . . . . .
4 . . . . . . . . . . . . . . . . . . . . . . . . . . . . .
5 . . . . . . . . . . . . . . . . . . . . . . . . . . . . .
6 . . . . . . . . . . . . . . . . . . . . . . . . . . . . .
7 . . . . . . . . . . . . . . . . . . . . . . . . . . . . .
8 . . . . . . . . . . . . . . . . . . . . . . . . . . . . .
9 . . . . . . . . . . . . . . . . . . . . . . . . . . . . .
lo . . . . . . . . . . . . . . . . . . . . . . . . . . . . .
NOTE: Data previously unpublished.
Number of
recordedphysician
visits reportedmi+~’
this table. When only the main question wasused there was not a clear relationship betweenthe number of interviews taken and theunderreporting rate (rank order correlation of.52). When the probe questions were used therewas more of a tendency for interviewers takhgan increased number of interviews to have lowerreporting rates (rank order correlation of .83).The most interesting finding was related to theeffect of probe questions. Only one of the fiveinterviewers recording fewer than 40 sampledvisits improved the reporting by using probequestions, but all of those who recorded over 40visits showed improvement in reporting whenthe probes were used. The median rate ofunderreporting is withh l-percentage point forthe main question when the top five interviewersare compared with the bottom five interviewers.When all the probe questions were used, therewas no change in reporting for the first fiveinterviewers, and a 6-percentage-point improve-ment in reporting for the five interviewershaving the greatest number of reported visits.
Two conclusions are suggested by these data.The first is that interviewers differ in the waythey use questions and probes. Some apparentlymake little use of the probe questions, eitherfailing to ask them or asking them in anincidental manner. For four interviewers theprobes failed to elicit any additional informa-tion. In contrast, interviewer number 1, who
26
26
28
35
39
43
44
49
49
64
69
38
29
20
26
28
34
33
22
20
31
38
29
20
26
26
23
20
20
14
39
0
0
0
0
2
11
13
2
6
seemed to have dated most of her reliance onprobe question;, experienced a 39-percentimprovement in reporting when she used theprobes. The training and supervision failed toobtain uniformity in the use of the probequestions.
The second conclusion is that, except for theunusual behavior of interviewer number 1, theinterviewers who had the largest number ofsampIed visits (who may have been moreinterested and motivated) generally made betteruse of the probe questions. A major interviewerdifference in’ this study and the hospitalizationstudy is the amount of experience in interview-ing and in using the Health Interview Surveyquestionnaire. For the experienced interviewersthere was a drop over time in the reporting ofknown events, suggesting that additional experi-ence did not make for improvement in skill,since skill level was already high. The drop canbe accounted for in motivational terms; thenovelty of the studies wore off. In the physicianvisit study, the interviewers were inexperienced.Those who conducted a large number of inter-views improvecl, suggesting that they did profitfrom longer experience and did gain in skill. Thisfinding plus the earlier motivation hypothesissuggest that interviewers who are motivatedimprove their performance with added exper-ience. For the less highly motivated interviewersthis relationship is not as strong. This interpre-
35
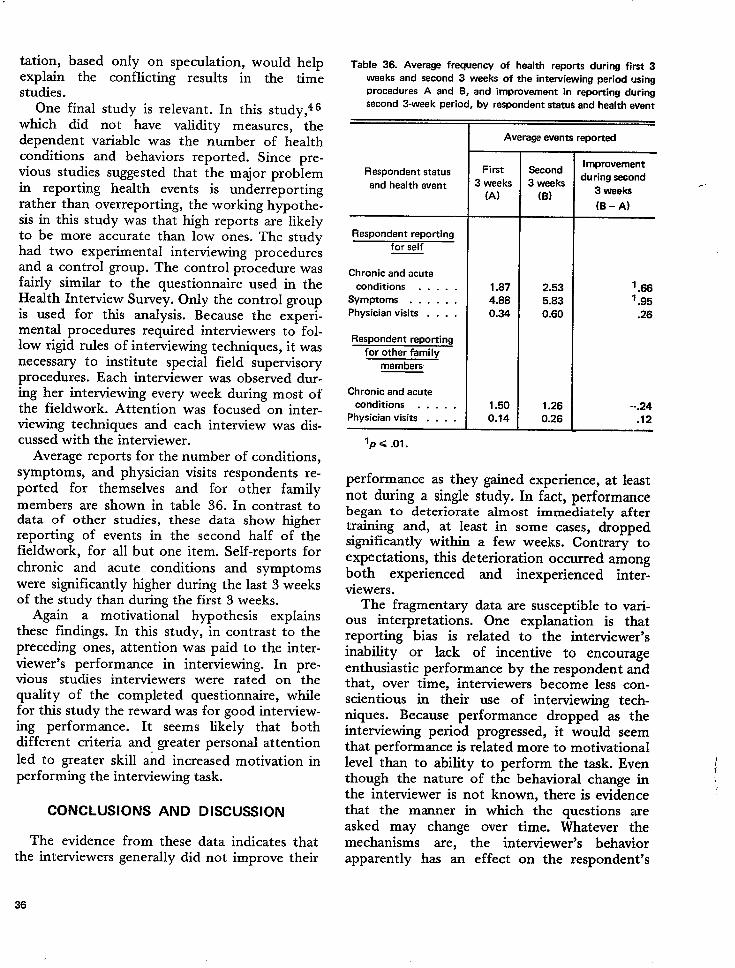
tation, basedexplain thestudies.
only on speculation, would helpconflicting results in the time
One final study is relevant. In this study,q Gwhich did not have validity measures, thedependent variable was the number of healthconditions and behaviors reported. Since pre-vious studies suggested that the m~or problemin reporting health events is underreportingrather than overreporting, the working hypothe-sis in this study was that high reports are likelyto be more accurate than low ones. The studyhad two experimental interviewing proceduresand a control group. The control procedure wasfairly similar to the questionnaire used in theHealth Interview Survey. Only the control groupis used for this analysis. Because the experi-mental procedures required interviewers to fol-low rigid rules of interviewing techniques, it wasnecessary to institute special field supervisoryprocedures. Each interviewer was observed dur-ing her interviewing every week during most ofthe fieldwork. Attention was focused on inter-viewing techniques and each interview was dis-cussed with the interviewer.
Average reports for the number of conditions,symptoms, and physician visits respondents re-ported for themselves and for other familymembers are shown in table 36. In contrast todata of other studies, these data show higherreporting of events in the second half of thefieldwork, for all but one item. Self-reports forchronic and acute conditions and symptomswere significantly higher during the last 3 weeksof the study than during the first 3 weeks.
Again a motivational hypothesis explainsthese findings. In this study, in contrast to thepreceding ones, attention was paid to the inter-viewer’s performance in interviewing. In pre-vious studies interviewers were rated on thequality of the completed questionnaire, whilefor this study the reward was for good interview-ing performance. It seems likely that bothdifferent criteria and ~eater personal attention
led to greater skill and increased motivation inperforming the interviewing task.
CONCLUSIONS AND DISCUSSION
The evidence from these data indicates thatthe interviewers generally did not improve their
Table 36. Average frequency of health reports during first3weeks and second 3 weeks of the intewiewing period using
procedures A and B, and improvement in reporting dlJring
second 3-week period, by respondent status and health event
~Average events reported
1 ,
Respondent status
and health event
First Second
3 weeks 3 weeks
(A) (B)
Improvement
during second
3 weeks
(B -A)
Respondent reporting
for self
Chronic and acute
conditions . . . . .
Symptoms . . . . . .
Physician visits . . . .
Chronic and acute
conditions . . . . .
Physician visits . . . .
1.87
4.88
0.34
1.50
0.14
2.53
5.83
0.60
1.26
0.26
‘ .66‘ .95
.26
--.24
.12I I I .
Ip <.01.
performance as they gained experience, at leastnot during a single study. In fact, performancebegan to deteriorate almost immediately aftertraining and, at least in some cases, droppedsignificantly within a few weeks. Contrary toexpectations, this deterioration occurred amongboth experienced and inexperienced inter-viewers.
The fragmentary data are susceptible to vari-ous interpretations. One explanation is thatreporting bias is related to the interviewer’sinability or lack of incentive to encourageenthusiastic performance by the respondent andthat, over time, interviewers become less con-scientious in their use of interviewing tech-niques. Because performance dropped as theinterviewing period progressed, it would seemthat performance is related more to motivationallevel than to ability to perform the task. Eventhough the nature of the behavioral change inthe interviewer is not known, there is eviden,cethat the manner in which the questions areasked may change over time. Whatever themechanisms are, the interviewer’s behaviorapparently has an effect on the respondent’s
..
36
behavior, both in the reporting during theinterview itself and in the respondent’s subse-quent performance in filling out and mailing aself-administered form.
It is, of course, no surprise that lack ofincentive or interest in performing the interview-ing task results in poor performance, but it issurprising that the interviewer’s performancedropped as rapidly as these findings indicate.
It appears that interviewers were beingreinforced for part of their role performance,and that the reinforcement brought aboutimprovement. However, adequate performancein stimulating respondent reporting behavior andin proper use of interviewing techniques was notreinforced and, accordingly, deteriorated. Per-formance in interviewing was not reinforcedbecause observation of interviewers was notcontinued after training, and good or poorperformance could not be identified by a reviewof the completed questionnaire. (It is instructiveto note that in one of the studies reported herethe interviewer who was among the poorest inobtaining known hospitalizations and whoseunderreporting rate rose sharply over theinterviewing period was selected as the bestinterviewer and was promoted to an officesupervisory job because of her “excellent”work.)
There are two major implications in thesefindings. The first is that research is needed toidentify explicitly those interviewer behaviorsthat relate to adequate reporting. Studies thatconcentrate on interviewer-respondent interac-tion, especially through analysis of recordedinterviews, can provide information for better
understanding of some of these factors. Asecond implication is the need for training andsupervisory methods that will reinforce adequateinterviewer performance in the application ofinterviewing techniques.
Studies frequently show a relationship be-tween the information reported in interviewsand the attitude of, or expectations of, theinterviewer. Interviewer bias studies abound, butall relate characteristics of the interviewer(background characteristics, attitudes, percep-tions, and expectations) to the reporting ofrespondents. The data presented here point tothe importance of the interviewer’s continuedmotivation to do a conscientious job ofinterviewing. The suggestion is that as fieldworkprogresses, interviewers become less careful orconscientious in using the techniques they weretrained to use. Furthermore, there is evidencethat interviewers who performed well in theinterview also inspired their respondents toperform well, as was shown in the adequacy ofrespondent reporting of hospitalizations in aself-administrative procedure. Good interactionimproves not only the technical aspects of theinterview, but also stimulates a high level ofrespondent role performance which extends intime beyond the interaction itself.
Interviewer training needs to include devicesfor building the interviewer’s enthusiasm for thejob as well as procedures for training in theproper use of techniques. Attention to perfor-mance cannot stop when interviewer training iscompleted. Training needs to be evaluated andgood performance reinforced continually duringthe period of production interviewing.
THE USE OF VERBAL REINFORCEMENTIN INTERVIEWS AND ITS DATA ACCURACY
.
The purpose of this section is to describeinterviewer verbal reinforcement as it occurs ininterviews, to conceptualize it in the samemanner as other major interviewer behaviors,and to look at some of the relevant researchstudies that provide information about howverbal reinforcement influences the accuracy ofinterview data.
The major category of interviewer behavior ofconcern here is interviewer feedback. Inter-
viewer feedback consists of evaluation state-ments that the interviewer makes after therespondent says something. The subject of feed-back may be approached through two basicquestions: “How can interviewer feedback beused to improve data?” and “How can it bearranged so as not to introduce unwanted bias?”The following discussion will be limited tointerviewer verbal reinforcing statements whichrepresent only one kind of interviewer feedback.
37
Probes and statements that are intended to buildrapport are not treated directly. While thisrestriction is undesirable, it is necessitated bythe Jact that research conducted at the SurveyResearch Center and elsewhere has dealt mainlywith task-oriented verbal reinforcing statements.
RESEARCH ON INTERVIEWERREINFORCEMENT
Since Pavlov’s famous experiments, there havebeen numerous studies of the effects of rewardand reinforcement on learning and performance.Much of this research has been carried out withanimals and occasionally with children. It hasbeen assumed that the principles of reinforce-ment derived from these laboratory studiescould be projected to adult human beings. Thisassumption has been made explicitly by manywriters, most notably Dollard and Mille# 1 andSkinner.52
Operant Conditioning Studies WithVerbal Reinforcement
Outside the psychology laboratory twoimportant kinds of practices, programed instruc-tion (or teaching machines) and behavior modifi-cation therapy, demonstrate the powerful ef-fects of properly scheduled reinforcement onhuman performance. Some practitioners in thefields of education and psychotherapy have feltthat traditional methods of producing learningor behavior change (e.g., lecture, introspection)are inefficient. They have met some success withnew techniques based on tightly controlledoperant conditioning techniques where re-inforcement is contingent on the respondent’sactual behavior.
These studies point to the importance offeedback on human performance under a varietyof conditions. However, the experimental situa-tions mentioned above (sentence construction,free association, and casual conversation) are notIike a typical survey interview. Several studieshave been conducted in interview settings. Thefirst set of studies shows that interviewer re-inforcement has great effects on the amount ofrespondent behavior. The second group of stud-ies shows that interviewer reinforcement canproduce ‘an interviewer bias effect. Finally, thestudy by Marquis, Cannell, and Laurent53 indi-
cates that, under certain conditions, interviewerfeedback can be used to increase the accuracy ofinformation given by respondents.
Effects of Feedback on Amount Reported
A study by Marquis andCanne1150 shows thatthe presence or absence of interviewer verbalfeedback has a significant effect on the amountof health information reported by a respondentin a household interview about family health. Inthis study a probability sample of moderate-income females between the ages of 17 and 65and living within the city limits of Detroit wasinterviewed. They were asked questions abouttheir own health, about their use of differentkinds of medical services, and about the heaJthof another person in the household. Althoughthree experimental groups were used in thisstudy, two groups of respondents are of interesthere: (a) the group of respondents who werereinforced every time they reported a symptomor heahh condition either for themselves or forthe other person in the househoId for whomthe y were reporting; and (b) the group ofrespondents who were interviewed using thesame questions but who received no reinforce-ment or feedback from the interviewer.i
For the first experimental group the kinds ofreinforcing statements which the interviewerused are outlined here. Words in parenthesescould be used, omitted, or interchanged by theinterviewer:
(Yes.) That’s the kind of information we need.(Um-hmm.) We’re interested in that.
(1 see.) You have (name of condition)
There were some other small differences in theinterviewing procedures for the two groups andthese are described in detail elsewhere.50
*The third group was also interviewed without reinforce-ment. A list of symptoms, which appeared at the beginning ofthe other two kinds of interviews, was inserted near the end ofthe third treatment interview. The purpose of thk procedure wasto test the sensitizing effects of the symptoms lisf on laterreporting. No main effect was found on the amount reportedlater in the interview, although it may be necessary to begin areinforcement interview with a symptoms list which allows allrespondents to report some sort of sickness and to receivereinforcement for their reporting.
38
The main dependent variabIe in the study wasthe number of chronic and acute conditionswhich the respondent reported for herself.Following the logic outlined by Cannell, Fowler,and Marquis46 (appendix II), it was assumedthat the more chronic and acute conditionsreported, the more valid the overall data. Thegroup of respondents receiving reinforcementreported an average of 2.74 conditions perperson. The nonreinforced group reported anaverage of 2.20 conditions. The data indicatethat the reinforced group of respondentsreported about 25 percent more chronic andacute conditions than did the nonreinforcedgroup. The difference is significant at the .02level of confidence. The same magnitude ofeffect was obtained for reporting chronic andacute conditions for the other person in thehousehold. The number of conditions reportedby proxy averaged 1.88 in the experimentalinterview and 1.43 in the control interview. Theexperimental or reinforcement interviewobtained about 24 percent more chronic andacute conditions reported by the proxyrespondent and the difference is significant atthe .01 level of confidence. Other resultsindicated that the reinforcement effect wasgeneral rather than limited to one kind ofcondition. For example, the reinforced respond-ents reported about 25 percent more medicaIlyattended conditions for themselves and about 55percent more of the highly embarrassingsymptoms than did the nonreinforced group.The group that received feedback from theinterviewer did not report more visits tophysicians than did the nonreinforced group.This finding is discussed in more detail in theoriginal report by Marquis and Cannell.s O
Kanfer and McBrearty82 interviewed 32female undergraduates about 4 predeterminedtopics. During the first part of the interview thewomen were handed cards listing each of thetopics and were asked to talk about each one.The experimenter sat in the room but keptcompletely silent. During the second part of thesession the experimenter reinforced the respond-ent whenever she talked about a predeterminedtwo of the four possible topics. Reinforcementconsisted of a “posture of interest” includingsmiles and the phrases “I see,” “Um-hmm ,“ and“yes.,, When the women talked about the
remaining two topics, the experimenter said anddid nothing. The subjects spent more timetalking about the topics that were reinforcedthan about those topics that were notreinforced.
These two studies indicate that interviewerfeedback can have a great effect on how much issaid during the questioning. It should be notedthat both of these studies involved maximumcontrasts in interviewer feedback; that is, in onegroup or at one time interviewers used verbalreinforcement and for another group or atanother time interviewer feedback was com-pletely nonexistent. While these studies showthat interviewer feedback can have importanteffects on the amount reported, they indicatelittle about the nature of the effects or whatkinds of feedback procedures are most effective.
Use of Feedback To Increase Accuracy
The study to be discussed here is one in whichthe data indicate that interviewer feedbackprocedures can have beneficial effects on surveydata accuracy. It should be remembered thatthis is a single study dealing with fact responses,and that the results are tentative and possibly oflimited generalization. This study by Marquis,Cannell, and Laurent52 was carried out undercontract with The National Center for HealthStatistics. In an unpublished study by Marquisand Laurent,54 a number of interviewingvariables were tested but the discussion thatfollows is restricted to the effects of reinforce-ment on initial interviews and reinterviews usingshort (nonredundant) questions. The samplerespondents were white females between theages of 17 and 65, who were residents of thegreater metropolitan Detroit area. The respond-ents were selected on a weighted basis frompersons who had come into a prepaid healthclinic during a 6-month period prior tointerviewing. During the time each patient wasin the clinic a physician filled out a checklistindicating which of 13 chronic conditions thepatient definitely or probably had, and aboutwhich of the checklist conditions the physicianhad no information. The physician obtainedinformation about the chronic condition fromthe patient’s record and from his ownknowledge of the patient’s medical condition.
39
He did not interview the patient directly aboutthe specific conditions listed on the form.
The dependent variable used in the study wasthe accuracy with which respondents, in a seriesof subsequent household interviews, reportedhaving had or not having had each of the 13aforementioned chronic conditions. Two typesof respondent error were (a) underreporting, inwhich case the respondent failed to mention acondition which the doctor said she had; and (b)overreporting, where the respondent mentioneda condition which the doctor said she did nothave.
It was not expected that the respondent andphysician would agree entirely on the state ofthe respondent’s health. However, what wasexpected, for the reporting of these 13 verycommon chronic conditions, was that anexperimental interviewing procedure that ob-tained low average rates of respondent-physiciandisagreement obtained more valid data than aninterview procedure yielding high rates ofdisagreement. The study included a reinforcedgroup of respondents and a nonreinforcedgroup. All respondents received the same kind ofquestionnaire composed of straightforward shortquestions. The verbal reinforcement used in thereinforced group was similar to that described inconnection with the study by Marquis andCannell.E O Half of the respondents werereinterviewed approximately 2 weeks after theinitial interview. Respondents in the experi-mental group received reinforcement for report-ing all kinds of health events, not just symptomsand conditions as in the 1971 study just cited.The results obtained in the analysis of the 1972study data were not those initially antici-pated.53 They indicated that the effects ofdifferent ways of conducting interviews weremediated by the level of education of therespondent. Procedures that increased accuracyand reduced bias in the low education group(had not completed the 12th grade) hadopposite effects in the high education group.The reader should consult the full report of thisstudyj for a more detailed treatment of all dataand all experimental techniques.
jc~pie~ of this ~t~dy ~e avaif~le from the National Center
for Health Statistics, Vital and Health Statsktics, PHS Pub.No. 1000-Senes 2-No. 45.
The discussion of the results of this stucly islimited to four groups of respondents, thosereinforced and those not reinforced in eac:h ofthe two education groups, all of whom wereinterviewed with short questions.~
The underreporting index scores shown intable 37 indicate that, for respondents who hadnot finished high school, the use ofreinforcement in interviews significantly reducedthe underreporting of chronic conditions in theoriginal interview. However, reinforcementsignificantly increased underreporting error for
the more educated group. The drop from .387to .225 in underreporting brought about byreinforcement in the less educated group repre-sents a decrease of about 42 percent; thepercentage increase of underreporting in thehigher education group due to reinforcement(from .443 to .575) was approximately 30percent. Both of these differences are significantat the 5-percent level.
The overreporting errors were generally low(7 to 14 percent) and were less affected byreinforcement. The slight trends in the datasuggest that reinforcement reduced over-reporting in both education groups. One hypoth-esis in this study was that reinforcement by theinterviewer each time the respondent reportedan illness would result in the respondent “invent-ing” sicknesses in order to gain further approvalof the interviewer. Since the reinforcementinterview produced fewer false positiveresponses than the interview that did not includereinforcement, the trend was counter to thatexpected.
The total error index scores shown in table 37represent the unweighed sum of the individualunderreporting and overreporting scores. Sinceunderreporting scores had a higher mean andvariance than overreporting scores, the totalerror score reflects the effects of underreportingdue to reinforcement and education level. IForthe less educated group, reinforcement sigr~ifi-
‘The reinforcement contrast was rdso tested using aquestionnaire which contained a mixture of long and shortquestions. For reasons not ducussed here, the effect ofreinforcement with long questions was ambiguous. It is clear,however, that the combination of reinforcement with IIongquestions does not result in marked improvement in dataaccuracy.
40
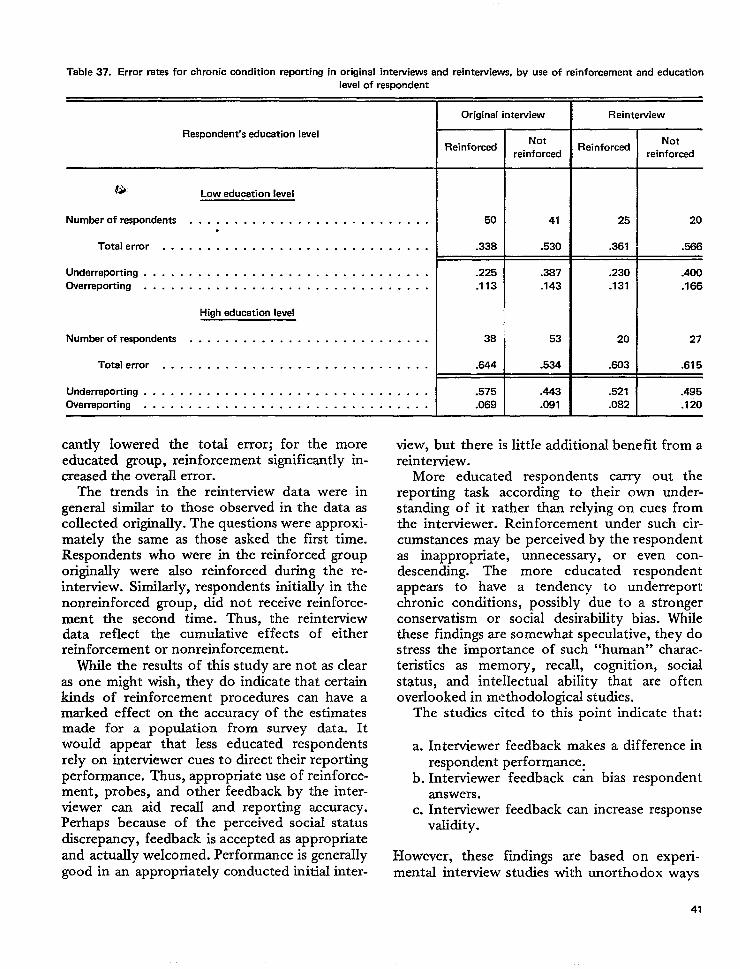
Table 37. Error rates for chronic condition reporting in original interviews and reintemiews, by use of reinforcement and education
level of respondent
Respondent’s education level
G) Low education level
Number of respondents . . . . . . . . . . . . . . . . . . . . . . . . . . ..
Total error . . . . . . . . . . . . . . . . . . . . . . . . . . . . . .
Underreporting . . . . . . . . . . . . . . . . . . . . . . . . . . . . . . . .
Overrepotiing . . . . . . . . . . . . . . . . . . . . . . . . . . . . . . . .
High education level
Numberofrespondents . . . . . . . . . . . . . . . . . . . . . . . . . . .
Totalerror . . . . . . . . . . . . . . . . . . . . . . . . . . . . . .
Underreporting . . . . . . . . . . . . . . . . . . . . . . . . . . . . . . . .
Overreporting . . . . . . . . . . . . . . . . . . . . . . . . . . . . . . . .
Original interview
Reinforced
50
.338
.225
.113
38
.644
.575
.069
Notreinforced
41
.530
.387
.143
53
.534
.443
.081
Reintewiew
Reinforced
25
.361
.230
.131
20
.603
.521
.082
Notreinforced
20
.566
.400
.166
27
.675
.495
.120
cantly lowered the total error; for the moreeducated group, reinforcement significantly in-creased the overallerror.
The trends in the reinterview data were ingeneral similar to those observed inthe dataascollected originally. The questions were approxi-mately the same as those asked the first time.Respondents who were in the reinforced grouporiginally were also reinforced during the re-interview. Similarly, respondents initially in thenonreinforced group, did not receive reinforce-ment the second time. Thus, the reinterviewdata reflect the cumulative effects of eitherreinforcement or nonreinforcement.
While the results of this study are not as clearas one might wish, they do indicate that certainkinds of reinforcement procedures can have amarked effect on the accuracy of the estimatesmade for a population from survey data. Itwould appear that Iess educated respondentsrely on interviewer cues to direct their reportingperformance. Thus, appropriate use of reinforce-ment, probes, and other feedback by the inter-viewer can aid recall and reporting accuracy.Perhaps because of the perceived sociaJ statusdiscrepancy, feedback is accepted as appropriateand actually welcomed. Performance is generaIlygood in an appropriately conducted initial inter-
view, but there is little additional benefit from areinterview.
More educated respondents carry out thereporting task according to their own under-standing of it rather than relying on cues fromthe interviewer. Reinforcement under such cir-cumstances may be perceived by the respondentas inappropriate, unnecessary, or even con-descending. The more educated respondentappears to have a tendency to underreportchronic conditions, possibly due to a strongerconservatism or social desirability bias. Whilethese findings are somewhat speculative, they dostress the importance of such “human” charac-teristics as memory, recall, cognition, socialstatus, and intellectual ability that are oftenoverlooked in methodological studies.
The studies cited to this point indicate that:
a. Interviewer feedback makes a difference inrespondent performance.
b. Interviewer feedback c& bias respondentanswers.
c. Interviewer feedback can increase responsevalidity.
However, these fiidings aremental interview studies with
based on experi-unorthodox ways
41
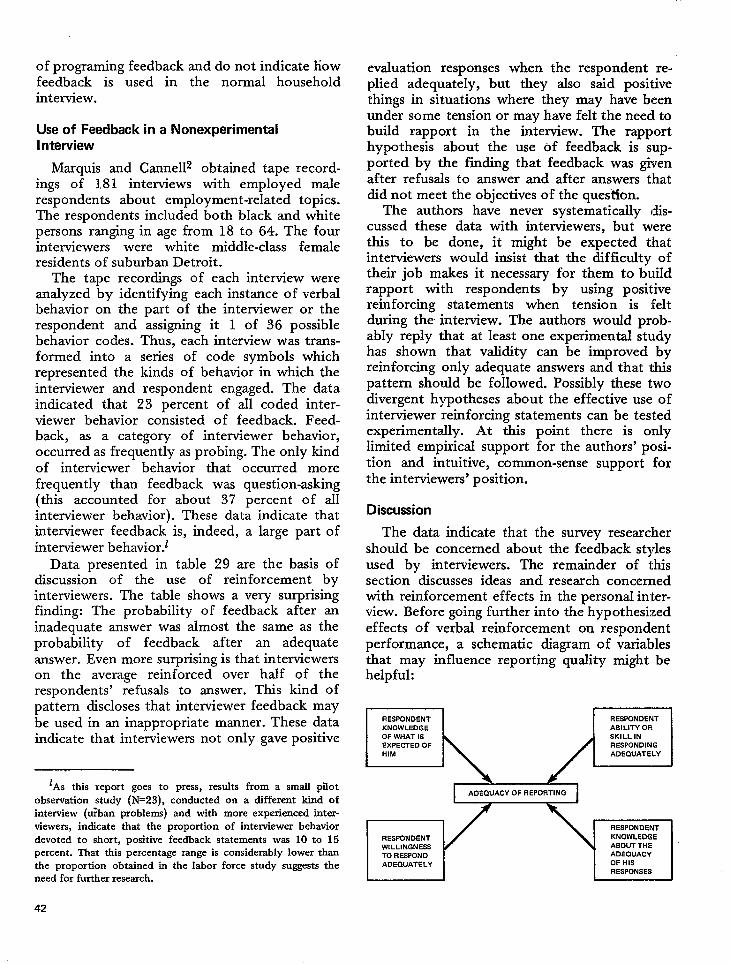
of programing feedback and do not indicate howfeedback is used in the normal househoIdinterview.
Use of Feedback in a NonexperimentalInterview
Marquis and Canne112 obtained tape record-ings of 181 interviews with employed malerespondents about employment-related topics.The respondents included both black and whitepersons ranging in age from 18 to 64. The fourinterviewers were white middle-class femaleresidents of suburban Detroit.
The tape recordings of each interview wereanalyzed by identifying each instance of verbalbehavior on the part of the interviewer or therespondent and assigning it 1 of 36 possiblebehavior codes. Thus, each interview was trans-formed into a series of code symbols whichrepresented the kinds of behavior in which theinterviewer and respondent engaged. The dataindicated that 23 percent of all coded inter-viewer behavior consisted of feedback. Feed-back, as a category of interviewer behavior,occurred as frequently as probing. The only kindof interviewer behavior that occurred morefrequently than feedback was question-asking(this accounted for about 37 percent of allinterviewer behavior). These data indicate thatinterviewer feedback is, indeed, a large part ofinterviewer behavior.t
Data presented in table 29 are the basis ofdiscussion of the use of reinforcement byinterviewers. The table shows a very surprisingfinding: The probability of feedback after aninadequate answer was almost the same as theprobability of feedback after an adequateanswer. Even more surprising is that interviewerson the average reinforced over half of therespondents’ refusals to answer. This kind ofpattern discloses that interviewer feedback maybe used in an inappropriate manner. These dataindicate that interviewers not only gave positive
evaluation responses when the respondent re-plied adequately, but they also said positivethings in situations where they may have beenunder some tension or may have felt the need tobuild rapport in the interview. The rapporthypothesis about the use Of feedback is sup-ported by the finding that feedback was givenafter refusals to answer and after answers thatdid not meet the objectives of the ques’tion.
The authors have never systematically dis-cussed these data with interviewers, but werethis to be done, it might be expected thatinterviewers would insist that the difficulty oftheir job makes it necessary for them to buildrapport with respondents by using positivereinforcing statements when tension is :[eltduring the interview. The authors would prob-ably reply that at least one experimental studyhas shown that validity can be improved byreinforcing only adequate answers and that thispattern should be followed. Possibly these twodivergent hypotheses about the effective use ofinterviewer reinforcing statements can be testedexperimentally. At this point there is onlylimited empirical support for the authors’ posi-tion and intuitive, common-sense support forthe interviewers’ position.
Discussion
The data indicate that the survey researchershould be concerned about the feedback stylesused by interviewers. The remainder of thissection discusses ideas and research concernedwith reinforcement effects in the personal inter-view. Before going further into the hypothesizedeffects of verbal reinforcement on respondentperformance, a schematic diagram of variablesthat may influence reporting quality might behelpful:
m X!!ZI
lAs thk report goes to press, results from a small pilotobservation study (N=23), conducted on a different kind ofinterview (tiban problems) and with more experienced inter-viewers, indicate that the proportion of interviewer behaviordevoted to short, positive feedback statements was 10 to 15percent. That thk percentage range is considerably lower thanthe proportion obtained in the labor force study suggests theneed for further research.
42
I 1 I
The diagram implies that there are four hypo-thetical personal characteristics (other than hav-ing correct answers available in memory) thatwill affect the accuracy and completeness ofreporting. These consist of two knowledge (cog-nitive) variables-knowledge of what is expectedand knowledge of how well one’s responses aremeeting these expectations—a skill variable, anda motivational variable.
This diagram implies that if the respondentknows what is expected of him, has the abilityto do what is expected, can tell how adequatehis responses are vis & vis the task requirements,and wants to do well, then the data he gives willbe accurate and complete. The purpose of thediscussion that follows is to explore how verbalreinforcement procedures and alternative proce-dures affect each of these hypothetical variables.
The tentative conclusion reached is thatpositive verbal reinforcement contingent onadequate answers provides a wide variety ofdesirable effects on these intervening constructs,while other procedures that might be used tendto have more limited effects. The effects ofverbal reinforcement at any particular stage arenot totally clear and derivations from theorysuggest reinforcement may also have somecounterproductive effects in certain situations.
THREE KINDS OF INTERVIEWERVERBAL REINFORCEMENT EFFECTS
The effects of verbal reinforcement onrespondents can be divided into three categories:a cognitive effect, a conditioning effect, and amotivational effect. There can be a great deal ofoverlap among these categories but, for ease ofpresentation, the three kinds of effects will betreated as if they are independent.
Interviewer verbal reinforcement has acognitive effect on respondents because itsupplies information about the expectations ofthe interviewer and how adequately therespondent is meeting these expectations by hisanswering behavior. For example, if theinterviewer asks whether the respondent has everhad a headache, the respondent says “Yes,” andthe interviewer uses a reinforcing statement suchas, “Good, that’s the kind of information weneed.” The interviewer has indirect$~ told therespondent that she expects him to report his
minor illnesses and that the response he just gavewas a good one in terms of meeting theobjectives of the health interview. Thisinformation-giving aspect of verbal reinforcingstatements which changes (or maintains) therespondent’s intellectual understanding of therespondent role requirements and the adequacyof his responses is described as a cognitive effect.
The second effect that interviewer feedbackmay have is referred to here as “instrumentalconditioning.” This effect is important in manystudies of the psychology of learning. In thesimplified model of the interview just described,the interviewer’s evaluation comes immediatelyafter the respondent has given a response. Thissort of pairing of an evaluation with a responsecan have reinforcing properties, that is, it canalter the frequency of the behavior thatimmediately preceded it. Thus, the evaluationprocess has the potential of strengthening orweakening the probability of eliciting thatbehavior or similar behavior on subsequenttrials. AIso, through the process of differentialreinforcement of successive approximations, thereinforcement procedure can establish a newkind of response class or behavior in which therespondent would not normally engage on hisown.
The third possible effect of interviewerfeedback is mo~ivational. In this case feedbackaffects the intensity or psychological effortwhich the respondent aHocates to his reportingtask and to other behavior that may interferewith the adequate performance of hisrespondent task.
Cognitive Effects of Reinforcement
T\vo kinds of knowing or understanding arethought to influence respondent performance:understanding what is expected (e.g., knowledgeof the proper respondent role) and knowingwhen answers meet and do not meet thoseexpectations. Two ideas are hypothesized: (a)such knowledge is sometimes very helpful but isneither necessary nor sufficient for goodperformance in some conditions; and (b)reinforcement plays an important role in helpingthe respondent to acquire both kinds ofknowledge and is a more effective procedurewhen compared to more conventional teachingtechniques.
43
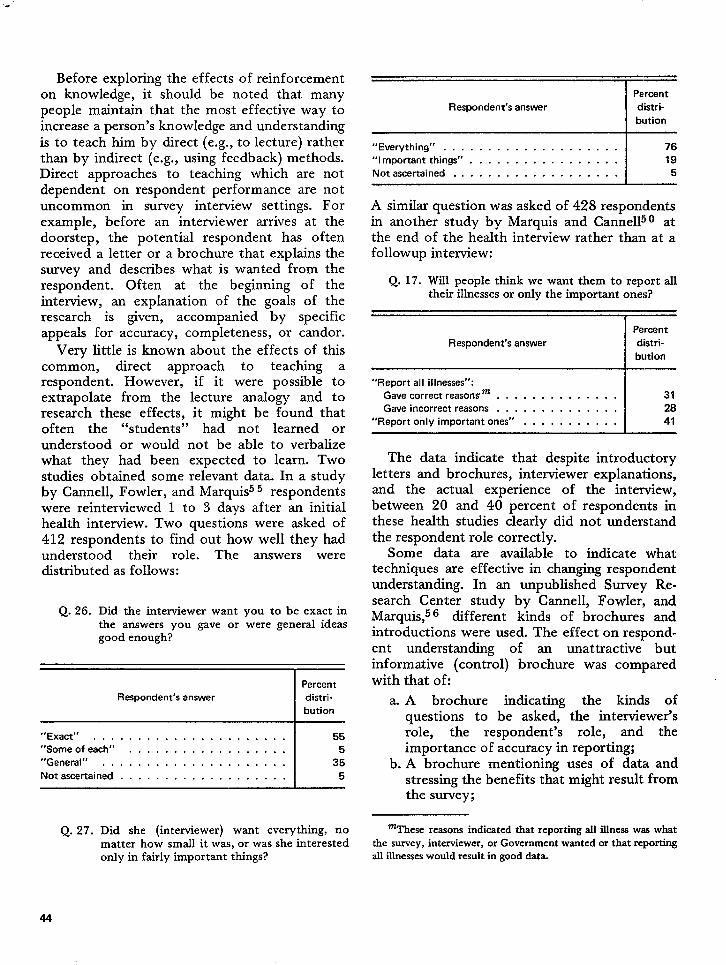
Before exploring the effects of reinforcementon knowledge, it should be noted that manypeople maintain that the most effective way toincrease a person’s knowledge and understandingis to teach him by direct (e.g., to lecture) ratherthan by indirect (e.g., using feedback) methods.Direct approaches to teaching which are notdependent on respondent performance are notuncommon in survey interview settings. Forexample, before an interviewer arrives at thedoorstep, the potential respondent has oftenreceived a letter or a brochure that explains thesurvey and describes what is wanted from therespondent. Often at the beginning of theinterview, an explanation of the goals of theresearch is given, accompanied by specificappeals for accuracy, completeness, or candor.
Very little is known about the effects of thiscommon, direct approach to teaching arespondent. However, if it were possible toextrapolate from the lecture analogy and toresearch these effects, it might be found thatoften the “students” had not learned orunderstood or would not be able to verbalizewhat they had been expected to learn. Twostudies obtained some relevant data. In a studyby Cannell, Fowler, and Marquis55 respondentswere reinterviewed 1 to 3 days after an initialhealth interview. Two questions were asked of412 respondents to find out how well they hadunderstood their role. The answers weredistributed as follows:
Q. 26. Did the interviewer want you to be exact inthe answers you gave or were general ideasgood enough?
Percent
Respondent’s answer distri-
bution
“Exact’’ . . . . . . . . . . . . . . . . . . . . . . 55“Someofe ace’’ . . . . . . . . . . . . . . . . . . 5“General’’ . . . . . . . . . . . . . . . . . . ...’ 35
Not ascertained . . . . . . . . . . . . . . . . . . . 5
Percent
Respondent’s answer distri-
bution
“Everything’’ . . . . . . . . . . . . . . . . . . . . 76
“lmportantthings” . . . . . . . . . . . . . . . . . 19
Not ascertained . . . . . . . . . . . . . . . . . . . 5
A similar question was asked of 428 respondentsin another study by Marquis and Cannellu O atthe end of the health interview rather than at afollowup interview:
Q. 17. Will people think we want them to report alltheir illnesses or only the important ones?
Percent
Respondent’s answer distri-
bution
“Report all illnesses”:
Gavecorrect reason5m . . . . . . . . . . . . . . 31
Gave incorrect reasons . . . . . . . . . . . . . . 28
“Report only important ones” . . . . . . . . . . . 41
The data indicate that despite introductoryletters and brochures, interviewer explanations,and the actual experience of the interview,between 20 and 40 percent of respondents inthese health studies clearly did not understandthe respondent role correctly.
Some data are available to indicate whattechniques are effective in changing respondentunderstanding. In an unpublished Survey Re-search Center study by Cannell, Fowler, andMarquis,56 different kinds of brochures andintroductions were used. The effect on respond-ent understanding of an unattractive butinformative (control) brochure was comparedwith that of:
a. A brochure indicating the kinds ofquestions to be asked, the interviewer’srole, the respondent’s role, and theimportance of accuracy in reporting;
b. A brochure mentioning uses of data andstressing the benefits that might result fromthe survey;
Q. 27. Did she (interviewer) want everything, nomatter how small it was, or was she interestedonly in fairly important things?
‘These reasons indieatcd that reporting all illness was whatthe sorvey, interviewer, or Govemrnent wanted or that reportingall illnesses would result in good data.
44
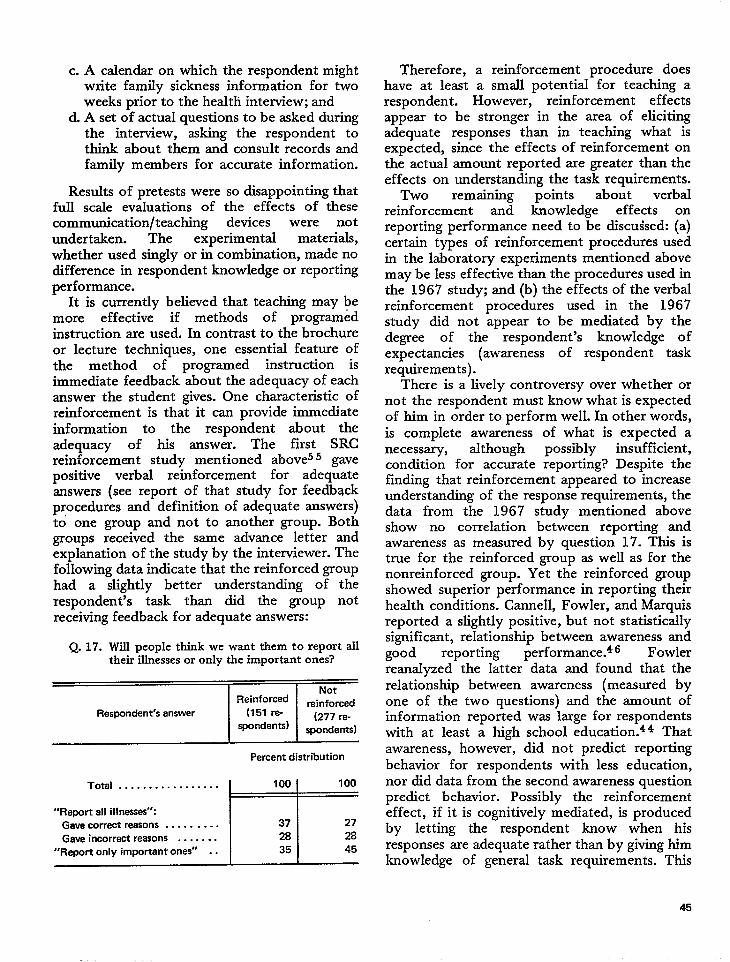
c. A calendar on which the respondent mightwrite family sickness information for twoweeks prior to the health interview; and
d. A set of actual questions to be asked duringthe interview, asking the respondent tothink about them and consult records andfamily members for accurate information.
Results of pretests were so disappointing thatfull scale evaluations of the effects of thesecommunication/teaching devices were not
undertaken. The experimental materials,
whether used singly or in combination, made nodifference in respondent knowledge or reportingperformance.
It is currently believed that teaching may bemore effective if methods of programedinstruction are used. In contrast to the brochureor lecture techniques, one essential feature ofthe method of programed instruction isimmediate feedback about the adequacy of eachanswer the student gives. One characteristic ofreinforcement is that it can provide immediateinformation to the respondent about theadequacy of his answer. The first SRCreinforcement study mentioned aboves 5 gavepositive verbal reinforcement for adequateanswers (see report of that study for feedbackprocedures and definition of adequate answers)to one group and not to another group. Bothgroups received the same advance Ietter andexplanation of the study by the interviewer. Thefollowing data indicate that the reinforced grouphad a slightIy better understanding of therespondent’s task than did the group notreceiving feedback for adequate answers:
Q. 17. Will people think we want them to report alltheir illnesses or only the important ones?
~Percent distribution
Total . . . . . . . . . . . . . . . . . 100 100
“Report all illneses”:Gave correct reasons . . . . . . . . . 37 27
Gave incorrect reasons . . . . . . . 28 28
“Report only important ones” . . 35 45
Therefore, ahave at least a
reinforcement procedure doessmall potential for teaching a
respondent. However,- reinforcement effectsappear to be stronger in the area of elicitingadequate responses than in teaching what isexpected, since the effects of reinforcement onthe actual amount reported are greater than theeffects on understanding the task requirements.
Two remaining points about verbaIreinforcement and knowIedge effects onreporting performance need to be discuised: (a)certain types of reinforcement procedures usedin the laboratory experiments mentioned abovemay be less effective than the procedures used inthe 1967 study; and (b) the effects of the verbalreinforcement procedures used in the 1967study did not appear to be mediated by thedegree of the respondent’s knowledge ofexpectancies (awareness of respondent taskrequirements).
There is a lively controversy over whether ornot the respondent must know what is expectedof him in order to perform well. In other words,is complete awareness of what is expected anecessary, although possibly insufficient,condition for accurate reporting? Despite thefinding that reinforcement appeared to increaseunderstanding of the response requirements, thedata from the 1967 study mentioned aboveshow no correlation between reporting andawareness as measured by question 17. This istrue for the reinforced group as well as for thenonreinforced group. Yet the reinforced groupshowed superior performance in reporting theirhealth conditions. Cannell, Fowler, and Marquisreported a slightly positive, but not statisticallysignificant, relationship between awareness andgood reporting performance.46 Fowlerreanalyzed the latter data and found that therelationship between awareness (measured byone of the two questions) and the amount ofinformation reported was large for respondentswith at least a high school education.44 Thatawareness, however, did not predict reporting
behavior for respondents with less education,nor did data from the second awareness questionpredict behavior. Possibly the reinforcementeffect, if it is cognitively mediated, is producedby Ietting the respondent know when hisresponses are adequate rather than by giving himknowledge of generaI task requirements. This
45
implies that the respondent need not understandexactly what is expected of him to respond well.
Recent experiments in social psychology havetried to explore the relative effects of awarenessof task requirements and reinforcement ofperformance. A detailed treatment of thesefindings is beyond the ,scope of this report, butsome of the main issues and findings arepresented at the end of this section wherefurther experimentation is discussed. It appearsthat awareness can be helpful when therespondent (a) can tell when his single responsesare meeting task requirements, (b) has the skillto perform what is requested, and (c) has thewill (motivation) to perform.
Feedback used in the 1967 studies may haveprovided two types of information, and achievedthe increase in reporting frequencies because ofthis double-barreled effect. In some of thelaboratory experiments mentioned earlier, re-inforcing statements contingent on correctanswers consisted of “Yes,” “Mm-hmm,”“O.K.,” or “Good.” The 1967 studies usedverbal reinforcements which contained more in-formation, statements such as: “Mm-hmm, weneed to know that,” or “I see, that’s the kind ofinformation we need.” Probably the two typesof statement convey different amounts andkinds of information. The simple statementsapparently convey information about responseadequacy, leaving it to the respondent to inferthe interviewer’s goals. The longer statementspossibly make it easier for the respondent toarrive at some knowledge of interviewer expecta-tions. This hypothesis would be relatively easyto test in the laboratory or in field interviews.
These conceptions of how reinforcementteaches the respondent to understand his properrole point to the desirability of using more effi-cient techniques which do not rely so heavily onthe respondent’s ability to figure out what isexpected. Further research seems to be neededin order to test whether the respondent’s under-standing of his role is necessary for good report-ing or whether knowledge of the adequacy of hisresponses is, in itself, sufficient. If knowledge ofexpectations is found to be important, it mightbe effective to develop a method that informsthe respondent of his expected performancequality and at the same time, through reinforce-
ment procedures, gives him immediatetion about the adequacy of his answers.
inform a-
The effects of reinforcement on two kinds ofrespondent knowledge and the role of knowl-edge in producing good survey data have beentouched upon above. Other variables can alsoinfluence data quality. In the following sectionsreinforcement is discussed in the context of twoother variables, skill level and motivation.
Conditioning Effects
of Reinforcement
Experiments cited earlier show that giving re-inforcement immediately after some behavior in-creases the probability that such behavior willrecur. This pattern is defined here as an operantconditioning effect, or more simply a condition-ing effect. In the tradition of B. F. Skinner, thearrangement of reinforcement contingencies toproduce the conditioning effect minimizes con-sideration of the intervening variables that mighthelp explain the obtained results. Thus, the fol-lowing paragraphs omit speculation about howinterviewer reinforcement may affect cognitiionsand motivations to achieve a performance effect.They relate to such probIems as identifying thecorrect behavior to reinforce and the circum-stances under which a conditioning procedureseems appropriate.
When to use a conditioning procedure. –LThefollowing discussion is based on the premise thatconditioning effects of reinforcement should beused (a) when respondents do not have a clearunderstanding of how to perform effectively andcannot be given this understanding by mere ex-planation or appeals for good performance, (b)when the respondent does not possess the abilityor skill for good reporting regardless of whetheror not he understands what is wanted, or (c)when the respondent is performing in a mannerwhich is less than optimzd (for example, hewants to do something besides answer questionsaccurately and completely). The implication isthat if the respondent understands what he issupposed to do, has the ability to do it, knowswhen he is doing it, and wants to do it, there isno reason to introduce a conditioning procedureinto the interview. However, all of these condi-tions are seldom met in any personal interviewsituation.
46
.
The general conditioning pattern suggestedfor personal interviews is the scheduling of re-in f orcing statements only after adequateanswers. In this way the frequency of adequateanswers can be expected to increase. For exam-ple, an adequate answer appears fairly easy toelicit with increasing frequency when th~ follow-ing instruction is given: “When I ask an open-ended question, please tell me all you can thinkof, using specific examples.” This is accom-plished by an interviewer using a reinforcingstatement every time the respondent gives anacceptable idea or example in response to an
open-ended question. The arrangements to pro-duce an increase in valid answers, especizdly toforced-choice questions, are not that easily con-ceptualized. Methods that change the reinforce-ment contingency rules to reward responses thatcome closer and closer to approximating somegoal have been shown to be effective and,theoretically, could be used in the personalinterview setting.
Another use of conditioning procedures is tomaintain an acceptable level of respondent per-formance. Once the respondent has been taughtappropriate response behavior, it is desirable forhim to continue to answer acceptably. Accord-ing to the operant conditioning literature, a pre-viously reinforced response (especially if it hasbeen reinforced every time it has occurred) willbe given less and less frequently if it is no longerreinforced. Thus, another function of a verbalreinforcement procedure is to prevent extinctionof appropriate behavior once it has been estab-lished. A schedule of reinforcement that usespositive statements after at least some of thedesired behavior is probably adequate to servethe response maintenance function. Proceduresthat omit reinforcing statements or use them ina m.ndom way probably cannot maintain anyperformance pattern that has been establishedearlier.
Problems of conditioning procedures forteaching. –A conditioning effect of reinforce-ment involves the respondent learning how toperform or improve his performance on sometask. He may or may not be aware of his result-ing increase in ability. For a feedback techniqueto be effective, the interviewer (or studydesigner) must be aware of what is to be taught
or improved, be able to recognize when arespondent performs the desired behavior, andbe able to give appropriate verbal reinforcementimmediately after the respondent behavioroccurs. These are very stringent conditions, andin the usual interview situation they cannot bemet. One major obstacle is the difficulty ofdetermining immediately whether a particularrespondent behavior is desirable or not. Withoutknowing which responses to reinforce, a properconditioning effect cannot be obtained.
The dangers of trying to teach one conceptbut actually teaching something else can be illus-trated by a recent series of experiments. Cannelland Marquis originally diagnosed the problem oferror in reporting chronic and acute health con-ditions as an underreporting or “failure to re-port” problem. Subsequently, in their 1967study,s 0 they reinforced every instance wherethe respondent reported a symptom or a chronicor acute health condition, and obtained a 25-percent increase in the number of symptoms andconditions reported. A subsequent look at un-published data about chronic condition report-
ing from other sources sugg=sted that over-reporting might be more of a problem thanunderreporting for this kind of health informa-tion. Therefore, the conditioning procedure usedmay have decreased the accuracy of the data inthat study because it led to increased overreport-ing errors. Therefore, Marquis, Cannell, andLaurent53 carried out a second study using inde-pendent records from physicians as indicators ofthe presence or absence of chronic conditionsfor particular respondents. Respondents receivedapproximately the same kind of reinforcementas in the earlier study. The results mentionedearlier in connection with the discussion of table42 did not show the expected biased condition-ing effect. If the conditioning ef feet were theonly effect operating, it would be expected thatoverreporting (reporting of nonexistent chronicconditions) would increase. The data indicatedjust the opposite. The short-question reinforce-ment interview had its major effect in reducingoverall reporting error by reducing the amountof overreporting. Exactly why this happened isuncertain. Possibly no conditioning effectoccurred, and the reduction in error was due toincreased knowledge or motivation effects.
47

Another possibility is that a concept other thana positive or sickness-reporting response set wastaught.n The main point, however, is the diffi-culty in predicting what sort of consequenceswill arise when interviewers use reinforcement ina particular contingency schedule. While theabove example shows that reinforcement proce-dures had a beneficial effect on the validity ofhealth reporting, the effect may not have beenfor the reason originally hypothesized.
Substitute for conditioning procedures whenthe problem is one of low respondent ability. –Probably one of the biggest problems in surveyinterviewing concerns the respondent’s ability torecall factual information accurately. The mostdramatic example of a memory problem isshown by CannelI and Fowlerl in the reportingof visits to a physician during the 2 weeks pre-ceding the interview. Using a standard questiondesigned to find out how many times therespondent had consulted a physician during thistime, 21 percent of the visits known to haveoccurred within the last week were not reportedand 38 percent of the visits known to haveoccurred during the second week prior to theinterview were not mentioned. Inability toremember increased over 80 percent from thefirst to the second week preceding the interview.
It has been hypothesized that a conditioningprocedure might help the respondent learn todistinguish correct from incorrect memory rep-resentations of an event such as a physician visit.In theory, this kind of teaching seems possiblebut it has not yet been demonstrated as feasiblein the interview setting.
A nonreinforcement interviewing approachmight be considered when ability to remember
‘The most likely explanation for the data was how the re-
inforcement variable was originally introduced to respondents.The interviewer began by asking the respondent if he had everhad any of each of 17 very common symptoms. The probabilitythat the respondent had experienced any one of these symptomsat least once in his lifetime was very high. Therefore, a “Yes”answer was most likely a true answer and was reinforced, and a“No” answer was most likely an underreport and was not re-inforced. Thus, the concept initially taught was probably, “Givevalid answers and don’t underreport.” This concept may havebeen maintained by the reinforcement schedule used in the r+mainder of the interview and was possibly still in effect forquestions about chronic conditions.
correctly presents problems for survey dataaccuracy. The recommended approach involves:
a. Making the recall task simpler so that rn,em-ory ability is less important for valiclit y;and
b. Using repeated ‘trials so that an initiallyfaulty recall decision may be corrected.
Evidence for the possible efficacy of this tasksimplification and repeated trials approach ispresented in another section of this report,“Memory and Information Retrieval in theInterview.” It should be remembered, however,that if response error is thought to be due tovariables other than memory failure, e.g., mis-understanding or fear of embarrassment, a re-inforcement procedure might be more appro-priate. -
Motivational Effectsof Reinforcement
The use of feedback statements, regardless ofthe rate or the contingency rule for their use,may have motivational consequences. The moti-vational effects are probably not reflecteddirectly in the awareness or consciousness of therespondent, and hence may be difficult to detectby questioning.
One motivational consequence has been men-tioned previously. In standard interviews it wasobserved that feedback statements were usedoften in situations where there may have beentension or negative feelings. Implicit here is thehypothesis that positive statements by the inter-viewer can reduce the respondent’s tension orhostile feelings about the interview. T’hishypothesis should be tested.
Psychological theory suggests at least threepossible motivational effects of positive feed-back statements. These statements might:
a. Affect the general level of motivation drive;b. Strengthen or weaken levels of specific
motives which facilitate or inhibit reportingperformance; or
c. Affect the degree of approval the respond-ent has for the interviewer. The effect ofapproval on performance is ambiguous and
, is discussed briefly below.
General motivation. –Some theories of motiv-ation include the idea of “general drive” or gen-
4a
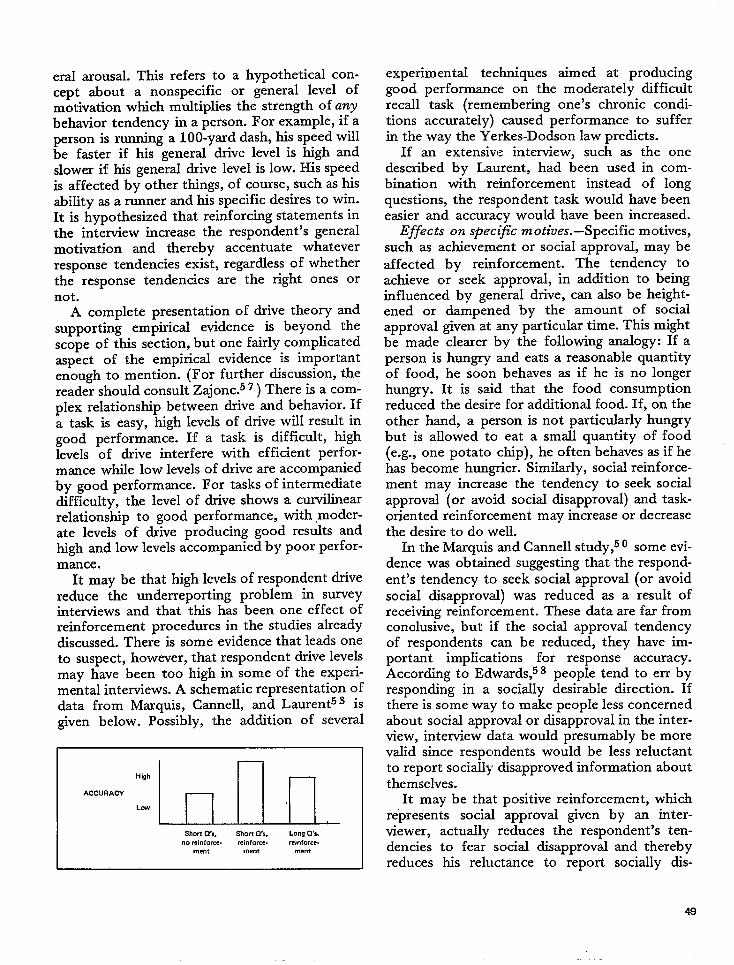
eral arousal. This refers to a hypothetical con-cept about a nonspecific or general level ofmotivation which multiplies the strength of anybehavior tendency in a person. For example, if aperson is running a 100-yard dash, his speed willbe faster if his general drive level is high andslower if his general drive level is low. His speedis affected by other things, of course, such as hisability as a runner and his specific desires to win.It is hypothesized that reinforcing statements inthe interview increase the respondent’s generalmotivation and thereby accentuate whateverresponse tendencies exist, regardless of whetherthe response tendencies are the right ones ornot.
A complete presentation of drive theory andsupporting empirical evidence is beyond thescope of this section, but one fairly complicatedaspect of the empirical evidence is importantenough to mention. (For further discussion, thereader should consult Zajonc.57 ) There is a com-plex relationship between drive and behavior. Ifa task is easy, high levels of drive will result ingood performance. If a task is difficult, highlevels of drive interfere with efficient perfor-mance while low levels of drive are accompaniedby good performance. For tasks of intermediatedifficulty, the level of drive shows a curvilinearrelationship to good performance, with modera-te levels of drive producing good results andhigh and low levels accompanied by poor perfor-mance.
It may be that high levels of respondent drivereduce the underreporting problem in surveyinterviews and that this has been one effect ofreinforcement procedures in the studies alreadydiscussed. There is some evidence that leads oneto suspect, however, that respondent drive IeveIsmay have been too high in some of the experi-mental interviews. A schematic representation ofdata from Marquis, Cannell, and Laurent53 isgiven below. Possibly, the addition of several
‘ccu”Acy~lnnIl__Short Cl’s, Short ~S, Long Q’s
.0 mi”forcs. reinforce. rei”fome.
mem me”t me”t
experimental techniques aimed at producinggood performance on the moderately difficultrecall task (remembering one’s chronic condi-tions accurately) caused performance to sufferin the way the Yerkes-Dodson law predicts.
If an extensive interview, such as the onedescribed by Laurent, had been used in com-bination with reinforcement instead of longquestions, the respondent task would have beeneasier and accuracy would have been increased.
Effects on specific motives. –Specific motives,such as achievement or social approval, may be
affected by reinforcement. The tendency toachieve or seek approval, in addition to beinginfluenced by general drive, can also be height-ened or dampened by the amount of socialapproval given at any particular time. This mightbe made clearer by the following analogy: If aperson is hungry and eats a reasonable quantityof food, he soon behaves as if he is no longerhungry. It is said that the food consumptionreduced the desire for additional food. If, on theother hand, a person is not particularly hungrybut is allowed to eat a smaU quantity of food(e.g., one potato chip), he often behaves as if hehas become hungrier. Similarly, social reinforce-ment may increase the tendency to seek socialapproval (or avoid social disapproval) and task-oriented reinforcement may increase or decreasethe desire to do well.
In the Marquis andCannellstudy,50 some evi-dence was obtained suggesting that the respond-ent’s tendency to seek social approval (or avoidsocial disapproval) was reduced as a result ofreceiving reinforcement. These data are far fromconclusive, but if the social approval tendencyof respondents can be reduced, they have im-portant implications for response accuracy.According to Edwards,58 people tend to err byresponding in a socially desirable direction. Ifthere is some way to make people less concernedabout social approval or disapproval in the inter-view, interview data would presumably be morevalid since respondents would be less reluctantto report socially disapproved information aboutthemselves.
It may be that positive reinforcement, whichrepresents social approval given by an inter-viewer, actually reduces the respondent’s ten-dencies to fear social disapproval and therebyreduces his reluctance to report socially dis-
49
approved information. Marquis and Canne1150also found that reinforced respondents reportabout one and one half times as many highlyembarrassing symptoms for themselves as dononreinforced respondents. This finding is con-sistent with the specific motive reductionhypothesis discussed above.
On the other hand, it may be that an inter-view using only a few reinforcing statementsmay fall victim to the “one-potato-chip effect.”It may be that fear of interviewer disapprovalcould be accentuated by having only a smallnumber of positive feedback statements pro-gramed into the conversation.
Feedback and establishing a relationship.–Itis often stated that the success of an interviewdepends on the degree to which the interviewercan establish rapport with the respondent. Oper-ational definitions of rapport differ and areusually unstated. The concept often seems torefer to a relationship of personal understandingand approval between the interviewer and re-spondent which is thought to facilitate responseaccuracy.
The evidence is reasonably clear that feedbackor other positive statements which do not nec-essarily follow any particular contingency sched-ule result in the respondent approving of theinterviewer. What is not clear, however, iswhether the resulting positive feeling has any-thing to do with obtaining valid data.
The relationship between approval (producedby several types of feedback) and performance isfound to be nonexistent. Marshall, Marquis, and0skamp49 showed that respondents tended tolike interviewers who made positive commentsabout their performance more than they likedinterviewers who made only negative comments.However, interviewer comment style was un-related to accuracy of recall even in these ex-treme conditions.
Bales’ data59 suggest that, for long-term inter-actions, feedback statements indicating solidar-ity, agreement, acceptance, attention, and satis-faction, or promoting the release of tensionserve a “maintenance” function. That is, theyserve to keep a team or group together andworking on a task. Presumably, without thiskind of interaction, task-oriented groups wouldbreak up without finishing the job at hand. It isnot clear, however, that a short-term interview
interaction requires this socioemotional kind ofinteraction to be successful.
Finally, Hyman et al.60 have questioned theassumption that rapport is desirable in the inter-view. They point to the possibility that thesocial relationship implied in a high-rapportinterview may prevent the full disclosure ofsocially unacceptable- information. Canne1161has proposed an experimental test of thishypothesis.
Thus, while positive feedback in the interviewseems to create a good relationship, this relation-ship per se may have either no effect or negativeeffects on reporting accuracy. On the otherhand, it may be that the relationship somehowinteracts with other variables (such as a condi-t i oning procedure) to influence responseaccuracy. Further research is needed in this area.
EXPERIMENTAL STUDY”
The social reinforcement effect for adulthumans is fairly well established. In a review ofthe literature, Krasner62 pointed out that re-inforcement effects have been demonstratedunder numerous settings with a variety of re-inforcing statements, with many kinds ofresponses, and with different types of people.Currently, attention has turned to a considera-tion of other variables which may be importantin producing reinforcement effects on humanperformance.
One of the major concerns in the precedingdiscussion was the separation of the instruc-tional or cognitive effects of reinforcement fromthe more automatic conditioning effects. Thisissue is very important to survey interview plann-ers for several reasons and has some majorimplications for theories of human behavior. Forexample, if the reinforcement techniques men-tioned above achieve their effects merely byinforming the respondent about what the inter-viewer wants him to do, it would seem thatthere are better ways of passing this informationalong to the respondent. Using only reinforcingstatements to convey information about what
‘This section was written in collaboration with Ms. LindaWood, who has undertaken the major responsibilities of designand execution of the experiment deseribed here.
50
the interviewer wants hastage that the respondent
the distinct disadvan-can misinterpret the
message or possib-ly never get it at all. On theother hand, the reinforcement procedures mightbe producing better reporting which could notbe produced by other means. If this is true,reinforcement procedures should be consideredseriously for all personal interviews, as a tech-nique for improving reporting.
This issue of whether the reinforcement effectis purely cognitive or more than that is a majorconcern of experimental psychologists. These re-searchers have given a great deal of attention toa process they call “awareness,” the respond-ent’s knowledge that reinforcement is being usedand that it is used only after he gives certainkinds of answers. A number of researchers 3‘65maintain that the reinforcement effect can beobtained for a human subject only when thesubject is “aware” of the response-reinforcementcontingency or, in terms used here, is aware ofwhat the interviewer expects him to do. Themere fact that a reinforcing statement follows aparticular response is not in itself sufficient toincrease the probability of occurrence of thatresponse. An increase can be obtained onlywhen the respondent understands the relation-ship between hk answers and the reinforcingstatements. The implication of this position isthat one may obtain high levels of respondentperformance right at the start of an interviewmerely by giving clear instructions to therespondent rather than by using reinforcement.Furthermore, since reinforcement takes a longertime to achieve its effects, some respondentsmay never become aware of what is wanted.
Another group of researchers~5S37J66 main-tain that reinforcement can have a direct condi-tioning effect. They do not deny that awarenessor cognitive effects of reinforcement may con-tribute to the reinforcement effect, but say thatthese are not necessary in order for the re-inforcement effect to occur. The major thrust of
the research of the latter group is that reinforce-ment effects can be produced without therespondent becoming aware of the expectationsof the experimenter or interviewer. Thesestudies do not show that reinforcement proce-dures are more efficient than direct instructionprocedures. They do indicate, however, thathuman behavior can be changed without the
necessity of the respondent having to thinkabout the change.
Earlier it has been shown that innovativeinstruction procedures such as brochures, calen-dars, and informing the respondent about keyquestions prior tcl interviewing were not effec-tive in producing better data. Thus, establishing
awareness through these initiaI procedures wasnot sufficient to produce desired performance,as Spielberger and others might imply.
However, in view of the large number ofstudies supporting each point of view, it may bethht both interpretations are correct but thateach is true under different circumstances. Itwould seem that there is some other variablethat helps to determine whether simple knowl-edge of what the interviewer expects is sufficientfor good responding or whether more compli-cated conditioning procedures are necessary. Acomparison of the two sets of studies suggeststhat this variable is “task difficulty.” Thosestudies that suggest that awareness is sufficientin itself usually involve a simple task, for exam-ple, the selectiorl of a first-person pronoun.27Those that suggest that awareness may be un-necessary involve a somewhat more difficulttask, such as giving “self-acceptance” re-sponses. 34 The difference in difficulty betweenthese two types of tasks has been obscured bythe fact that as long as the inten’iewer’s expecta-tions are unstated, both types of task seem diffi-cult.
It must be hypothesized, therefore, that theconditioning effect of reinforcement bringsabout changes in respondent ability level or skillin responding adequately (see “Dependent Vari-ables,” under “Design of an Experimental Inter-viewing Approach,” this report) and that, to theextent that a respondent’s skills are low, theconditioning effects of reinforcement will begreater. That is, the importance of awareness,however obtained, is relevant to knowledge ofexpectations, but only reinforcement can changeskill. When skill needs to be improved, a condi-tioning procedure is necessary. On the otherhand, when the task does not require a high levelof skill, direct instructions should produce maxi-mum performance and a reinforcement proce-dure will not produce any further improvement.
Some of the basic questions that arise in theconsideration of reinforcement effects should be
clarified in order to improve the qu~lity of re-porting. For example,
a. How important is respondent knowledge ofthe interviewer’s expectations?
b. If this knowledge is essential, is it conveyedbetter by interviewer instruction, by re-inforcement, or by some combination ofthe two?
c. Is the recall skill of the respondent im-proved by reinforcement and does theamount of this improvement depend on thedifficulty of the task?
d. Does reinforcement provide information tothe respondent about the adequacy of hisresponses and does the importance of thisinformation vary with the respondent’sskill?
MEMORY AND INFORMATION
RETRIEVAL IN THE INTERVIEW
The purpose of this section is to present somehypotheses about underreporting and to de-scribe an experiment designed to reduce under-reporting in a field survey. One of the principalcauses of underreporting is the failure of recall;information is not reported because it is notretrieved from memory. Work in interviewingmethodology tends to support the assumptionsof McGeoch23 and modern interferencetheory*4 that information does not disappearfrom memory but may become difficult to recallbecause of interfering associations. Only theaccessibility y of information declines, resulting ina “lessening probability of retrieval from thestorehouse.”* 5 Thus, underreporting is essen-
tially a problem of retrieval, and reporting maybe improved by manipulating conditions underwhich retrieval occurs.
THE INADEQUATE
SEARCH HYPOTHESIS
Interviewing methodology indicates that theconditions of recall have a crucial effect uponthe outcome of an interview. Some informationmay be unreported simply because the questionsdo not convey to the respondent an accuratenotion of what information to search for. Forexample, 19 percent of a sample of respondentsinterviewed in the Health Interview Surveydeclared in a followup interview that theythought the interviewer was interested only in“fairly important” things.55 By itself this ob-servation provides an alternative hypothesis to
52
interpret the underreporting of low-impactitems. They may be underreported only becausethe respondent does not consider them to berelevant and therefore does not even search forthem.
Several early experimental studies had sug-gested that the nonreported materiaI had notbeen repressed or deeply suppressed, nor ha(d itvanished from memory, but often was simplynot elicited by the usual questioning procedures.It seemed likely that the use of different sets ofquestions and techniques by interviewers couldsignificantly decrease underreporting. For in-stance, over half the hospitalizations not re-ported in a first interview were reported in asecond interview. 17 An experimental procedurewhich included a few extra questions, moreexplanation of purpose to respondents, and amail followup also resulted in a significantincrease in the reporting of hospitalizations. 18Adding probes to major questions regardingvisits to physicians reduced the underreportingby 7 percentage points, from 30 to 23 percent.1Another study by Balamuth, et al.4 indicatedthat checklists also seemed to reduce the unc!er-reporting of chronic conditions. A laboratorystudy showed that the form of the questions hada great effect on the accuracy of reporting itemsfrom a movie.6 T Finally, an experimental studyby Marquis, Cannell, and Laurent53 demon-strated a substantial effect of mere questionlength upon the validity of the reporting ofchronic conditions.
A major contribution of these studies is thedemonstration that experimental questioning
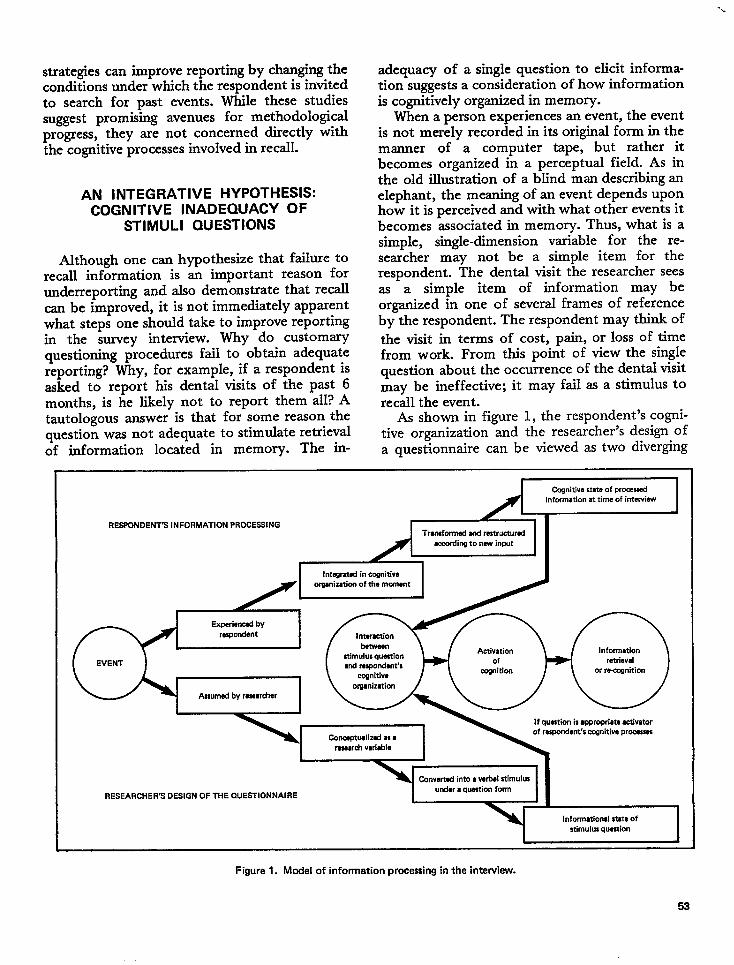
strategies can improve reporting by changing theconditions under which the respondent is invitedto search for past events. While these studiessuggest promising avenues for methodologicalprogress, they are not concerned directly withthe cognitive processes involved in recall.
AN INTEGRATIVE HYPOTHESIS:COGNITIVE INADEQUACY OF
STIMULI QUESTIONS
Although one can hypothesize that failure torecall information is an important reason forunderreporting and also demonstrate that recallcan be improved, it is not immediately apparentwhat steps one should take to improve reportingin the survey interview. Why do customaryquestioning procedures fail to obtain adequatereporting? Why, for example, if a respondent isasked to report his dental visits of the past 6months, is he likely not to report them all? Atautologous answer is that for some reason thequestion was not adequate to stimulate retrievalof information located in memory. The in-
adequacy of a singIe question to elicit informa-tion suggests a consideration of how informationis cognitively organized in memory.
When a person experiences an event, the eventis not merely recorded in its original form in themanner of a computer tape, but rather itbecomes organized in a perceptual field. As inthe old illustration of a blind man describing anelephant, the meaning of an event depends uponhow it is perceived and with what other events itbecomes associated in memory. Thus, what is asimple, single-dimension variable for the re-searcher may not be a simple item for therespondent. The dental visit the researcher seesas a simple item of information may beorganized in one of several frames of referenceby the respondent. The respondent may think of
the visit in terms of cost, pain, or loss of timefrom work. From this point of view the singlequestion about the occurrence of the dental visitmay be ineffective; it may fail as a stimulus torecall the event.
As shown in figure 1, the respondent’s cogni-tive organization and the researcher’s design ofa questionnaire can be viewed as two diverging
Cognitive state of procawdinformation at time of interview
RESPONDENT’S INFORMATION PROCESSING ~~Trmnformd ud mtrwturai
accding to naw input
1 htwratd in mmitiw 1
I orgmizatica of the mwrmnt
Experiarwd by
Assumed by raswrcher
If question is ●ppropriate tiivatorof rewmdent’s cognitive pr—
rewd wiabh
CawOrId into a wbal stimukn
RESEARCHER’S DESIGN OF THE QUESTIONNAIREunder ● qumtion form
Informational state of
m“mulus question
Figure 1. Model of information processing in the interview.
-\
53
paths by which information is processed inde-pendently and quite differently before the inter-view. These two paths lead to two independentinformational states—memory trace and stimulusquestion–whose interaction in the interview isexpected to produce the retrieval of the initialinformation. This model indicates that the prob-ability of proper recall is a function of theability of the stiumli questions to interact
adequately with the respondent’s cognitiveorganization. The appropriateness of the stimuliquestions is a function of the researcher’s abilityto comprehend ‘the nature of the respondent’scognitive path and to utilize this knowledge inthe framing of the questions.
The methodological objective becomes one ofredesigning questionnaires to facilitate recall.One way of doing this is to incorporate into thedesign of questionnaires some of the thingsalready known about how people learn, store,and retrieve information. The experiment~ de-scribed below is an exploratory attempt toascertain the validity as well as the feasibility ofthis cognitive approach for improving reportingin the household interview.
DESIGN OF AN EXPERIMENTALINTERVIEWING APPROACH
The study was designed to increase thereporting rate of acute and chronic illnesses,usually underreported in household interviews.The strategy consisted of an experimental ques-tioning procedure which would provide stimulirelevant to the respondent’s cognitive processingof health information. This procedure was ex-pected to improve retrieval from memory and toincrease the probability of reporting.
To find out abcmt the sicknesses of a personduring the month preceding an interview, onemay ask a standard question such as, “Were yousick at any time last month?” If the person hadhad influenza and had stored this experience inmemory as “being sick,” there is some chancethat it would be reported in response to thisquestion.
PA detailed presentation and discussion of this experiment
aPPe~s in a study W Laurent, Cannell, and Marquis. 69
If, among other illnesses, the researcher isparticularly interested in collecting data aboutinfluenza, he may also want to use a simplequestion such as: “Did you have the flu lastmonth?” This question will be a powerfulstimulus only if the sickness has been experi-enced as the flu or influenza and was concep-tualized as such. There are clear limitations to astraight application of this recognition techniquein the interview. Aside from the old issue ofsuggestibility, an exhaustive list of all potentiallyrelevant items of information would not usuallybe feasible. Furthermore, the recognition tech-nique relies much more than other retrievaltechniques upon the assumption that researcherand respondent share the same concepts. This isclearly shown in a medical interview. A physi-cian contends that his patients usually reportonly mq”or surgery when asked about previousoperations, whereas they tend to report bothmajor and minor surgery in answer to a questionabout stitches. The recognition principle is “basicto the recall process,68 but its application tointerviewing procedures is valuable only ifappropriate stimuli of recognition can be de-signed.
All of this experience indicates that an eventmay be stored in memory under various infor-mational states so distant from the initial infor-mational state that a stimulus merely tracedfrom the original event or from its straightconceptualization might not elicit the storedinformation. Last month’s influenza may havebeen stored in memory in many different waysand not necessarily as being sick or having theflu. There is enough evidence from experiments,as well as from everyday experience, to showthat memory is not a simple recording devicebut rather a complex process in which informat-ion is transformed and organized. Thus, influ-enza may no longer exist in memory as asickness, but may be organized around a numberof other possible traces. For example, theinterference of serious chronic illnesses maycause the respondent to fail to consider theepisode of influenza as a sickness and no longerto store it as such. On the other hand, this minorflu may have prevented the respondent fromgoing to work on a cold day, thus reducing hisincome in a manner significant enough to have
54
impact on his budget. It becomes clear that thisrespondent may be less likely to report the flu inanswer to a single question about sickness thanto a question such as: “Have you lost anyincome because of any sickness during the pastmonth?” If the flu has caused this person to befeverish, a symptom that he very seldom experi-ences, another relevant stimulus might be:“Have you had a fever during the past month?”
Memory can process an illness in such a waythat it gets transformed in storage and becomesorganized around concepts such as pain, incapac-ity, cost , visits to doctors, hospitalizations,medication or treatment, symptoms, or moregenerally around other causal, circumstantial, orconsequential events. The initial perception maybe distorted to an association with anotherperception in order to fit into some structure. Ifone asks a broad question such as, “Tell meabout your illnesses,” the respondent has tomake the effort to review a multitude ofcognitive structures in order to recalI properIy.He has to invent appropriate frames of referenceto guide his search; he has to create his own cuesto reactivate traces of possibly weak salience.Altogether, the task is enormous and complexand the motivation to invest substantial effort init cannot be expected to be spontaneously high,especially in the context of an information-getting household interview that has noimmediate benefit for the respondent. Withinthis framework, underreporting is predictable;the broad question is not an adequate stimtdusto the relevant frame of reference and therespondent is not going to work hard to recallinformation.
This framework, however, provides prospectsfor an experimental methodology. Instead ofasking one standard question essentially tracedfrom a simple conceptualization of the event tobe recalled, several questions may be asked thatare traced from hypothesized states of informa-tion after memory processing. In other words,instead of requesting from the respondent thedifficult task of building up his own cues andframes of reference, the researcher should at-tempt to create these recall aids and to buildthem into the questionnaire. If the researchercan be successful in predicting and designing therelevant cues and frames of reference, then therespondent’s recall process should be signifi-
cantly facilitated and the availability of informa-tion correspondingly increased.
The Extensive Questionnaire
The strategy of an extensive health interviewconsisted of designing a questionnaire containinga large number of questions that would providethe respondent with multiple and overlappingframes of reference and cues (see Laurent,Cannell, and MarquisG 9 ). Medical informationwas asked within classical conceptual frame-works as weIl as in the language of the layman,and through standard questioning as well asthrough multiple behavioral cues or direct recog-nition of items. Transitions between sectionswere also used to bring some relief in thequestioning style and to instill a deliberatelyrelaxed pace in the interviewing.
The questionnaire started with question aboutsymptoms, such as, “Do you have pains in theabdomen? “ “Have you had any pain or sorenessin your joints? “ “Have you had trouble breath-ing?” Every time the respondent gave a “Yes”answer the interviewer used the probe, “Do youhave any idea what causes it?” in an attempt toobtain the report of an underlying health condi-tion. Other frames of reference and cues wereused, such as asking for a medical history bymeans of queries related to childhood, adult-hood, 6 or 12 months previous, last week, or theweek before last. Then specific behavioral impli-cations of illnesses such as diet, food sensitivity,restrictions of activity, medications taken, andvisits to physicians were all used to provideassistance in the retrieval process. Finally, achecklist of chronic conditions implemented adirect items-recognition approach.
Control Questionnaire
A control questionnaire was used in thecollection of information on the same majoritems of health information as the extensiveform, but it consisted of single direct questionsfor each variable. This procedure containedstandard questions comparable to those used inthe Health Interview Survey and the samechronic conditions checklist that was used in theextensive form.
55
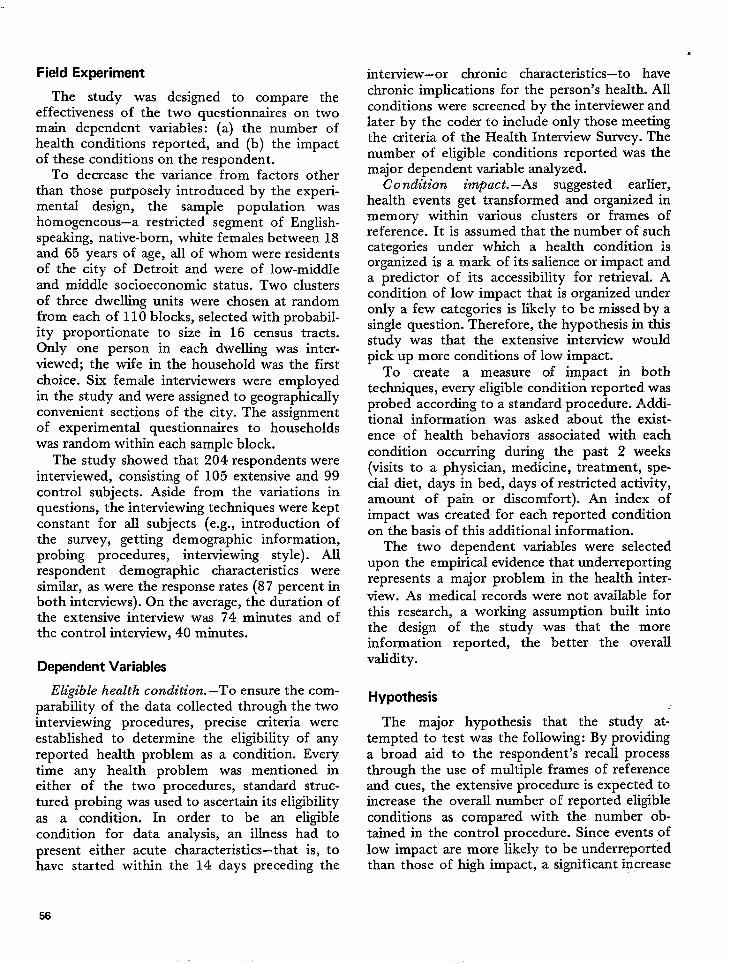
Field Experiment
The study was designed to compare theeffectiveness of the two questionnaires on twomain dependent variables: (a) the number ofhealth conditions reported, and (b) the impactof these conditions on the respondent.
To decrease the variance from factors otherthan those purposely introduced by the experi-mental design, the sample population washomogeneous–a restricted segment of English-speaking, native-born, white females between 18and 65 years of age, all of whom were residentsof the city of Detroit and were of low-middleand middle socioeconomic status. Two clustersof three dwelling units were chosen at randomfrom each of 110 blocks, selected with probabil-ity proportionate to size in 16 census tracts.Only one person in each dwelling was inter-viewed; the wife in the household was the firstchoice. Six female interviewers were employedin the study and were assigned to geographicallyconvenient sections of the city. The assignmentof experimental questionnaires to householdswas random within each sample block.
The study showed that 204 respondents wereinterviewed, consisting of 105 extensive and 99control subjects. Aside from the variations inquestions, the interviewing techniques were keptconstant for all subjects (e.g., introduction ofthe survey, getting demographic information,probing procedures, interviewing style). Allrespondent demographic characteristics weresimilar, as were the response rates (87 percent inboth interviews). On the average, the duration ofthe extensive interview was 74 minutes and ofthe control interview, 40 minutes.
Dependent Variables
Eligible health condition. –To ensure the com-parability of the data collected through the twointerviewing procedures, precise criteria wereestablished to determine the eligibility of anyreported health problem as a condition. Everytime any health problem was mentioned ineither of the two procedures, standard struc-tured probing was used to ascertain its eligibilityas a condition. In order to be an eligiblecondition for data analysis, an illness had topresent either acute characteristics–that is, tohave started within the 14 days preceding the
interview-or chronic characteristics-to
.
havechronic implications for the person’s health,. Allconditions were screened by the interviewer andlater by the coder to include only those meetingthe criteria of the Health Interview Survey. Thenumber of eligible conditions reported was themajor dependent variable analyzed.
Condition impact. —As suggested earlier,health events get transformed and organized inmemory withh various clusters or frames ofreference. It is assumed that the number of suchcategories under which a health conditicm isorganized is a mark of its salience or impact anda predictor of its accessibility for retrieval. Acondition of low impact that is organized underonly a few categories is likely to be missed by asingle question. Therefore, the hypothesis in thisstudy was that the extensive interview wouldpick up more conditions of low impact.
To create a measure of impact in bothtechniques, every eligible condition reported. wasprobed according to a standard procedure. Addi-tional information was asked about the exist-ence of health behaviors associated with eachcondition occurring during the past 2 weeks(visits to a physician, medicine, treatment, spe-cial diet, days in bed, days of restricted activity,amount of pain or discomfort). An index ofimpact was created for each reported conditionon the basis of this additional information.
The two dependent variables were selectedupon the empirical evidence that underreportingrepresents a major problem in the health inter-
view. As medical records were not available forthis research, a working assumption built intothe design of the study was that the moreinformation reported, the better the overallvalidity.
Hypothesis
The major hypothesis that the study at-tempted to test was the following: By providinga broad aid to the respondent’s recall processthrough the use of multiple frames of referenceand cues, the extensive procedure is expected toincrease the overall number of reported eligibleconditions as compared with the number ob-tained in the control procedure. Since events oflow impact are more likely to be underreportedthan those of high impact, a significant increase
!5a
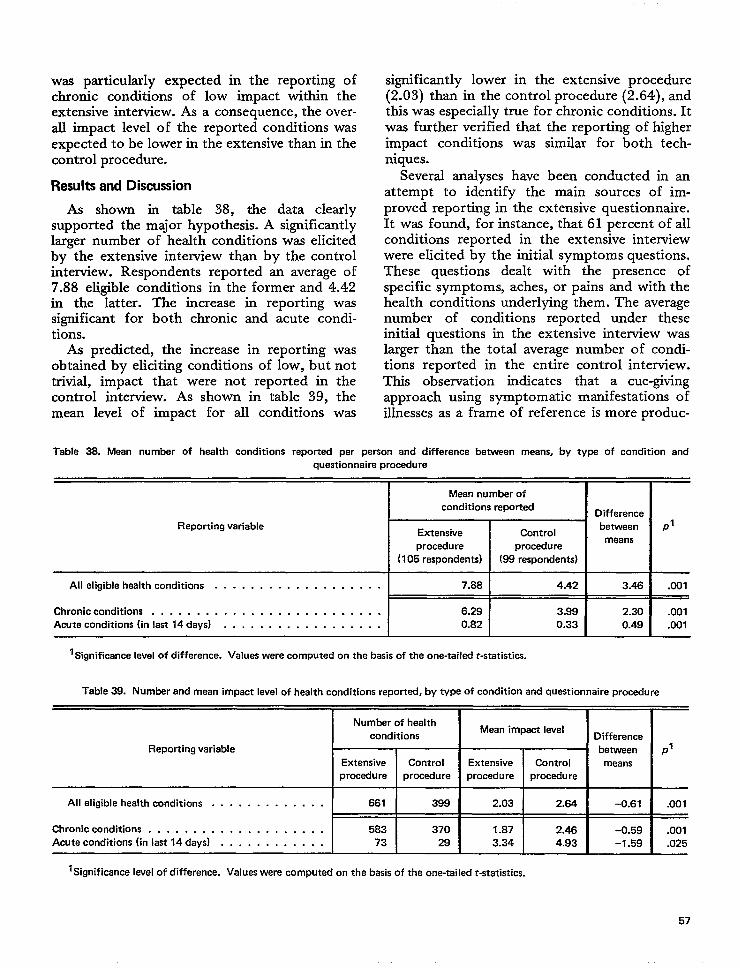
was particularly expected in the reporting ofchronic conditions of low impact within theextensive interview. As a consequence, the over-all impact level of the reported conditions wasexpected to be lower in the extensive than in thecontrol procedure.
Results and Discussion
As shown in table 38, the data clearlysupported the major hypothesis. A significantlylarger number of health conditions was elicitedby the extensive interview than by the controlinterview. Respondents reported an average of7.88 eligible conditions in the former and 4.42in the latter. The increase in reporting wassignificant for both chronic and acute condi-tions.
As predicted, the increase in reporting wasobtained by eliciting conditions of low, but nottrivial, impact that were not reported in thecontrol interview. As shown in table 39, themean level of impact for all conditions was
significantly lower in the extensive procedure(2.03) than in the control procedure (2.64), andthis was especially true for chronic conditions. Itwas further verified that the reporting of higherimpact conditions was similar for both tech-niques.
Several analyses have been conducted in anattempt to identify the main sources of im-proved reporting in the extensive questionnaire.It was found, for instance, that 61 percent of allconditions reported in the extensive interviewwere elicited by the initial symptoms questions.These questions dealt with the presence ofspecific symptoms, aches, or pains and with thehealth conditions underlying them. The averagenumber of conditions reported under theseinitial questions in the extensive interview waslarger than the total average number of condi-tions reported in the entire control interview.This observation indicates that a cue-givingapproach using symptomatic manifestations ofillnesses as a frame of reference is more produc-
Table 38. Mean number of health conditions reported per person and difference betwean means, by type of condition and
questionnaire procedure
Mean number of
conditions reportedDifference
Reporting variableExtensive Control
betwean P’
proceduremeans
procedure
(105 respondents) (88 respondents)
All eligible health conditions . . . . . . . . . . . . . . . . . . . 7.68 4.42 3.46 .001
Chronic conditions . . . . . . . . . . . . . . . . . . . . . . . . . . 6.29 3.99 2.30 .001
Acute conditions (inlast14days) . . . . . . . . . . . . . . . . . . 0.82 0.33 0.49 .001
1~gni~cance level of difference. Values were computed on the basis of the one-tailed t-statisti~-
Table 39. Number and mean impact level of health conditions reported, by type of condition and questionnaire procedure
Number of healthMean impact level
conditions Difference
Reporting variable between P’Extensive Control Extensive Control means
procedure procedure procedure procedure
All eligible health conditions . . . . . . . . . . . . . 661 399 2.03 2.64 -0.61 .001
Chronic conditions . . . . . . . . . . . . . . . . . . . . 583 370 1.87 2.46 -0.59 .001Acute conditions (in last 14 days) . . . . . . . . . . . . 73 29 3.34 4.93 -1.59 .025
l~9nificance level of difference. values were computed on the basis of the one-takxit-statistics.
57
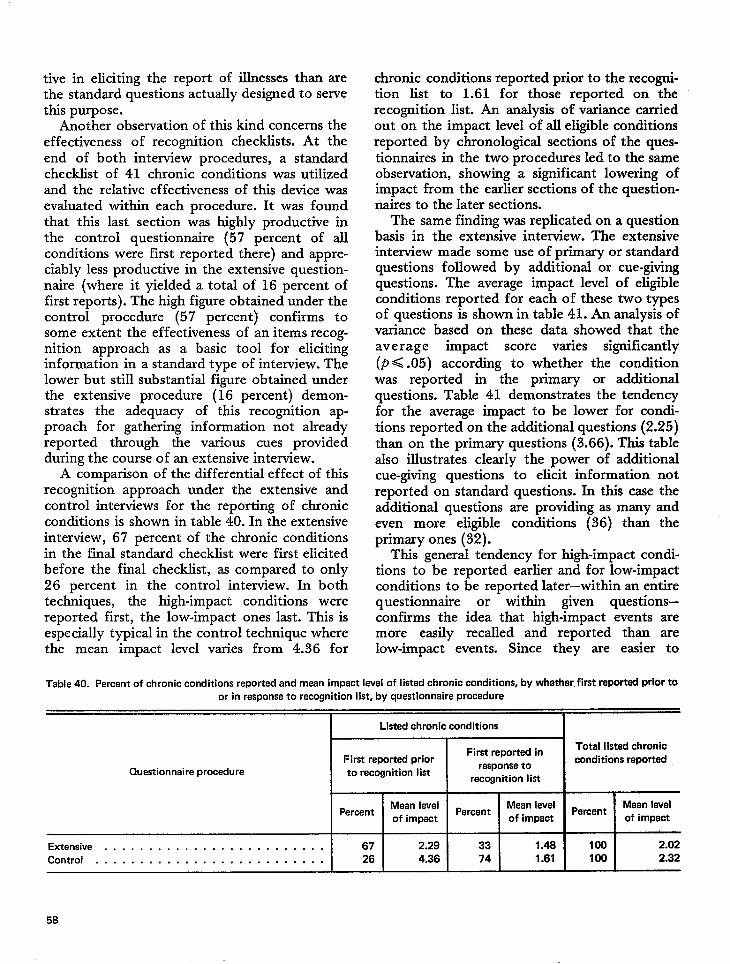
tive in eliciting the report of illnesses than arethe standard questions actually designed to servethis purpose.
Another observation of this kind concerns theeffectiveness of recognition checklists. At theend of both interview procedures, a standardchecklist of 41 chronic conditions was utilizedand the relative effectiveness of this device wasevaluated within each procedure. It was foundthat this last section was highly productive inthe control questionnaire (57 percent of allconditions were first reported there) and appre-ciably less productive in the extensive question-naire (where it yielded a total of 16 percent offirst reports). The high figure obtained under thecontrol procedure (57 percent) confirms tosome extent the effectiveness of an items recog-nition approach as a basic tool for elicitinginformation in a standard type of interview. Thelower but still substantial figure obtained underthe extensive procedure (16 percent) demon-strates the adequacy of this recognition ap-proach for gathering information not alreadyreported through the various cues providedduring the course of an extensive interview.
A comparison of the differential effect of thkrecognition approach under the extensive andcontrol interviews for the reporting of chronicconditions is shown in table 40. In the extensiveinterview, 67 percent of the chronic conditionsin the final standard checklist were first elicitedbefore the final checklist, as compared to only26 percent in the control interview. In bothtechniques, the high-impact conditions werereported first, the low-impact ones last. This isespecially typical in the control technique wherethe mean impact level varies from 4.36 for
chronic conditions reported prior to the recogni-tion list to 1.61 for those reported on, therecognition list. An analysis of variance carriedout on the impact level of all eligible condhionsreported by chronological sections of the ques-tionnaires in the two procedures Ied to the sameobservation, showing a significant lowering ofimpact from the earlier sections of the question-naires to the later sections.
The same finding was replicated on a questionbasis in the extensive interview. The extensiveinterview made some use of primary or standardquestions followed by additional or cue-givingquestions. The average impact level of eligibleconditions reported for each of these two typesof questions is shown in table 41. An analysis ofvariance based on these data showed that theaverage impact score varies significantly(P< .05) according to whether the conditionwas reported in the primary or additionalquestions. Table 41 demonstrates the tendencyfor the average impact to be lower for condi-tions reported on the additional questions (2.25)than on the primary questions (3.66). This tablealso illustrates clearly the power of additionalcue-giving questions to elicit information notreported on standard questions. In thk case theadditional questions are providing as many andeven more eligible conditions (36) than theprimary ones (32).
This general tendency for high-impact condi-tions to be reported earlier and for low-impactconditions to be reported later—within an entirequestionnaire or within given questions—confirms the idea that high-impact events aremore easily recalled and reported than arelow-impact events. Since they are easier to
Table 40. Percent of chronic conditions reported and mean impact level of listed chronic conditions, by whether, first repotiad prior toor in response to recognition Iist, by questionnaire procedure
I Listed chronic conditions I
First reported inTotal listed chronic
First reported prior conditions reportedQuestionnaire procedure to recognition list
response torecognition list
PercentMean level
PercentMean level
PercentMean level
of impact of impact of impact
Extensive . . . . . . . . . . . . . . . . . . . . . . . . . 67 2.29 33 1.48 100 2.02
Control . . . . . . . . . . . . . . . . . . . . . . . . . . 26 4.36 74 1.61 100 2.32
58
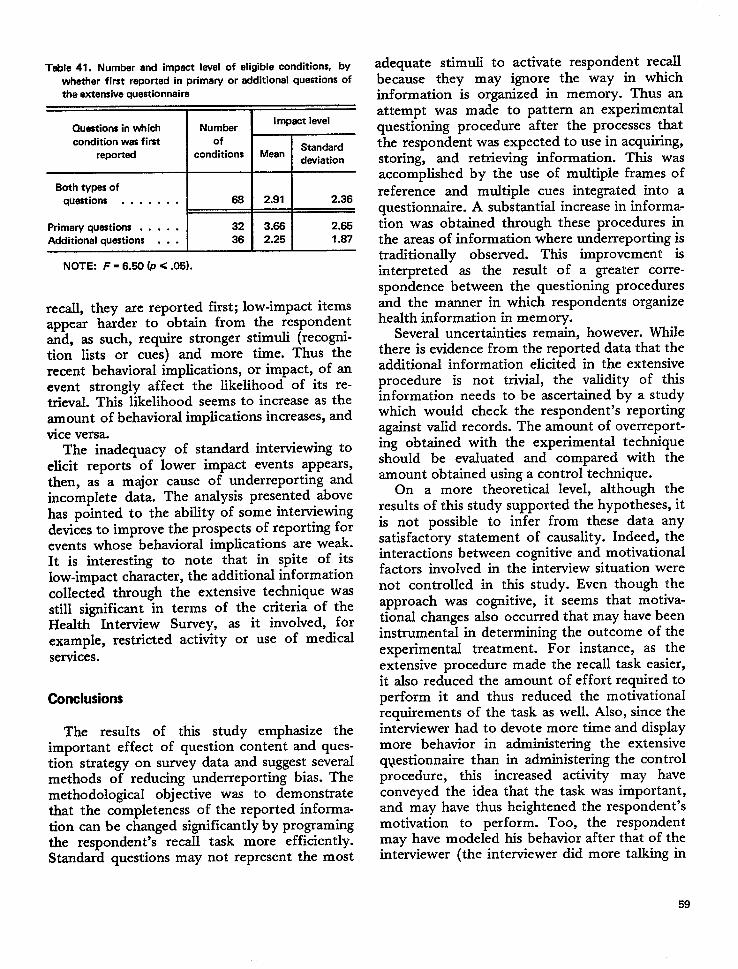
Table 41. Number and impact level of eligible conditions, bywhether first reported in primary or additional questions ofthe extensive questionnaire
Questions in which Number
k
Impact level
condition wes first ofStandard
reported conditions Meandeviation
~
NOTE: F = 6.50 (P < .05).
recall, they are reported first; low-impact itemsappear harder to obtain from the respondentand, as such, require stronger stimuli (recogni-tion lists or cues) and more time. Thus therecent behavioral implications, or impact, of anevent strongly affect the likelihood of its re-trieval. Thk likelihood seems to increase as theamount of behavioral implications increases, andvice versa.
The inadequacy of standard interviewing toelicit reports of lower impact events appears,then, as a major cause of underreporting andincomplete data. The analysis presented abovehas pointed to the ability of some interviewingdevices to improve the prospects of reporting forevents whose behavioral implications are weak.It is interesting to note that in spite of itslow-impact character, the additional informationcollected through the extensive technique wasstill significant in terms of the criteria of theHealth Interview Survey, as it involved, forexample, restricted activity or use of medicalservices.
Conclusions
The results of this study emphasize theimportant effect of question content and ques-tion strategy on survey data and suggest severalmethods of reducing underreporting bias. Themethodological objective was to demonstratethat the completeness of the reported informa-tion can be changed significantly by programingthe respondent’s recall task more efficiently.Standard questions may not represent the most
adequate stimuli tobecause they may
activate respondentignore the way in
recallwhich
information is organized in memory. Thus anattempt was made to pattern an experimentalquestioning procedure after the processes thatthe respondent was expected to use in acquiring,storing, and retrieving information. This wasaccomplished by the use of multiple frames ofreference and multiple cues integrated into aquestionnaire. A substantial increase in informa-tion was obtained through these procedures inthe areas of information where underreporting istraditionally observed. This improvement isinterpreted as the result of a greater corre-spondence between the questioning proceduresand the manner in which respondents organizehealth information in memory.
Several uncertainties remain, however. Whilethere is evidence from the reported data that theadditional information elicited in the extensiveprocedure is not trivial, the validity of thisinformation needs to be ascertained by a studywhich would check the respondent’s reportingagainst valid records. The amount of overreport-ing obtained with the experimental techniqueshould be evaluated and compared with theamount obtained using a control technique.
On a more theoretical level, although theresults of this study supported the hypotheses, itis not possible to infer from these data anysatisfactory statement of causality. Indeed, theinteractions between cognitive and motivationalfactors involved in the interview situation werenot controlled in this study. Even though theapproach was cognitive, it seems that motiva-tional changes also occurred that may have beeninstrumental in determining the outcome of theexperimental treatment. For instance, as theextensive procedure made the recall task easier,it also reduced the amount of effort required toperform it and thus reduced the motivationalrequirements of the task as well. Also, since theinterviewer had to devote more time and displaymore behavior in administering the extensiveq~estionnaire than in administering the controlprocedure, this increased activity may haveconveyed the idea that the task was important,and may have thus heightened the respondent’smotivation to perform. Too, the respondentmay have modeled his behavior after that of theinterviewer (the interviewer did more talking in
59
the extensive interview and the respondent mayhave followed his lead by being more active andreporting more information). It is unclearwhether increases in reporting have been ob-tained through direct cognitive facilitation, re-duction of motivational requirements, indirectmotivational stimulation, or a combination ofthese factors. The major outcome was a prag-matic one; techniques designed in a cognitiveframework to facilitate recall have proved effec-tive in increasing reported information.
Finally, two main implications deserve partic-ular attention. First, it seems that the complex-ity involved in retrieving adequate informationin an interview tends to be underestimated. Evendata that appear relatively simple to obtain mayrequire the design of more elaborate interview-ing techniques. Efforts have been made in past
researc”h to overcome various biases in interviewresponses. However, in most cases they havebeen avoidance strategies rather than construc-tive approaches. Evidence from data such asthose presented above suggests that probablyvery little is known about the asking of appro-priate questions, so that reporting errors mayoften be the result of questioning errors. In viewof the wide utilization of survey methods tocreate new knowledge and to guide policies,there is great need for more basic research onthe interviewing tool itself. A major objectivefor these research efforts is simply improvementin the design of questions. The present researchhas attempted to demonstrate that progress canbe made in this direction by framing questionsin accordance with the respondent’s cognitiveprocessing of the initial information.
A second implication of this research is thatthe experimental survey research interview couldprovide a new approach for investigations in thefield of cognitive psychology. If hypothesesabout the cognitive process can be introducedinto the design of interviewing experiments,
then the interview setting can serve as a labora-tory for the study of human memory and recall.It is interesting to note that most of theknowledge related to the memory process hasbeen developed in classical experiments bymanipulating the input or learning conditionsand evaluating the resulting output or recall.From this experimental design, inferences aremade about cognitive processing and memory.Thus, in the laboratory the focus is most oftenon input or learning conditions. Little attentionis given to recall, which is usually considered asan end result variable or as a test of learning andretention after memory processing. Textbooksare more likely to discuss the psychology oflearning than the psychology of recall. A re-versed strategy was attempted in the presentresearch; the learning conditions or input werekept constant or controlled by experimentalsurvey design and conditions of recall weremanipulated. Recall was no longer consideredonly a test of learning but was viewed as apowerful intervening process itself–one whichmediates the effects of learning and memoryprocessing on survey interview reporting.
“The more questions one asks about a topic,the more information one obtains,” is a state-ment made frequently by survey researchers.“Recognition-list questions will obtain moreinformation than those requiring free recalll,” iscommonly stated by survey practitioners. Thepresent study helps to provide some understand-ing of the phenomena underlying these state-ments. It is not a simple matter of asking morequestions; nor are recognition-list questionsnecessarily better than other kinds of questions.Some basic principles of memory and retrievalcan be used to improve reporting. This studysuggests that further research will yield a betterunderstanding of the way in which informationis stored and will invent more effective methodsof retrieving that information.
QUESTION LENGTH AND REPORTING BEHAVIORIN THE INTERVIEW: PRELIMINARY INVESTIGATIONS
This section reports on two exploratory described in more detail in Vital and Healthstudies of the effects of question length on the Statistics, Series 2-Number 45,53 and the find-amount and validity of information reported in ings of the second one have been discussedhousehold interviews. Both of these studies are previously in this report in relation to the effects
60
of reinforcement on household interviews in thesection, “The Use of Verbal Reinforcement inInterviews and Its Data Accuracy.”
Statements such as the following can befound in questionnaire methodology manuals:“Make the questions as concise as possible . . . .The length alone makes it practically impossibleto carry the question as a whole in mind.”7 O “Itis generally best to keep questions short—preferably not more than 20 words.”71 On thebasis of these statements it was assumed thatlengthy questions were an obstacle to clearcommunication. However, some empirical find-ings showing the presence of a verbal behavioralbalance in the household interview6s along withother findings repeatedly demonstrated a match-ing effect between interviewer and respondentspeech duration.72 From this finding it wasconcluded that long questions might have somevalue not previously anticipated.
Empirical Findings on Behavior Matching Inthe Interview
The Survey Research Center study byCannell, Fowler, and Marquisg showed a clear,positive association between the overall amountof behavioral activity of the respondent and thenumber of items reported. Furthermore, a veryhigh correlation was found between the behavioractivity level of the interviewer and that of therespondent. These findings led to speculationthat interviewer and respondent sought andperceived cues from each other about the degreeof effort to put into their respective roles. If thiscue-search process causes the respondent tomodel his behavior after the behavior of theinterviewer, inferences can be made about ques-tion length. Logically, short questions shouldelicit short answers and long questions shouldyield Iong responses.
This inference is supported by a series ofstudies on interview speech behavior conductedby Matarazzo et al.73 Briefly stated, thesestudies demonstrated that some formal measuresof the interview process unrelated to content—namely, interviewer and respondent speech dura-
q’rhi~ ~t~dy is d~~crib~d in geater deti in an earlier sectionof this report, “Behavior in Interviews.” For a full report of thestudy, see reference 46.
tionand
and silences–are remarkably reliable, valid,consistent. These studies have shown very
explicitly and repeatedly in employment inter-views that an increase in interviewer averagespeech duration resulted in a significant increasein respondent average speech duration. Forinstance, in a 45-minute interview divided intothree 15-minute periods where the interviewersspoke in utterances averaging 5.0, 15.2, and 5.5seconds, the respondents’ utterances averaged30.9, 64.5, and 31.9 seconds, respectively. Inother experiments of this series, the researchersvaried the schedule of the interviewer sequenceof utterances both in range and direction. Theyalso controlled for number and type of ques-tions, for topics discussed, and for interviewerdifferences. In all cases they consistently ob-tained changes of approximately 100 percent inrespondent speech duration. The changes werealways in the direction of the patterns shown bythe interviewers.r
The results of these studies of behaviormatching in the interview demonstrate thatincreases in interviewer verbal activity produceincreases in respondent verbalization. The proba-bility that a long response will contain moreinformation is an interesting hypothesis to betested. The research described here is devoted toan investigation of this problem.
Hypotheses About the Effects of QuestionLength on Reporting Behavior
A major contribution of the work byMatarazzo and his associates was the focus onthe measures of speech behavior in the interviewnot related to content, particularly interviewerand respondent speech duration. Survey re-searchers are interested in the potential ef feet ofthese variables (question length or speech dura-tion) upon the content variables (amount andvalidity of reported information). Ways of in-ducing greater respondent verbalization are ofparticular interest because it might be conduciveto improving reporting accuracy.
‘Replications of this finding have been obtained under otherinterviewing situations, such as the astronaut-ground communi-
73 the Ke~edy news confcrcnces,cater conversations, 74 ~d
;;a:y.ment on interviewer style by Heller, Davis, and
61
One needs to ascertain ifthe speech-matchingeffect is present in survey interviews. Further-more, it is necessary to find out whether theincreases in respondent speech duration reportedin other studies are a direct result of increases ininterviewer speech duration or the result ofgreater information demands made upon therespondent by more elaborate questions. Ifperson A is asked the short question “Tell me alittle bit about your job,” and person B is askedthe long question “Tell me everything you canthink of about your job. I am interested in asmany details as you can provide to describe it,”one expects person B to talk longer than personA simply because of differences in the demandcharacteristics of the question. In order to findout whether changes in respondent speech dura-tion are a function of changes in interviewerspeech duration and independent of changes inthe information demands of the question, oneneeds to modify the length of the question whileholding constant the amount of information itrequests. Such a design was used in the firstexperiment to be described in this section.
A second crucial task is to find out whetherincreases in question length, without changes inthe information demanded, have any effect onthe answer content, independent of variations inrespondent speech duration. A mere increase inquestion length might result in an increase inamount of reported information, with or with-out a corresponding increase in respondentspeech duration. This hypothesis is based uponthe cue-search model of the interview describedabove, in which it is assumed that the respond-ent looks to the interviewer as a source of cues.A long question might provide the respondentwith cognitive and motivational cues conveyingthe idea that a full report is desired. It also givesthe respondent more time to work on recallwhile the long question is being asked. The finalreporting performance might change, althoughthis change might not necessarily be reflected inthe length of the answer.
Finally, it is important to ascertain the effectof question length upon the validity of thereported information. Validity might be im-proved by the use of long cluestions, since theinterviewer cues might transmit a request forcompleteness and accuracy of report. For thisstep of the research, the respondent’s report willbe checked against independent records.
EXPERIMENT 1: EFFECTS OFQUESTION LENGTH ON ANSWER
DURATION AND REPORTINGFREQUENCY
A pilot field experiment was designed tc> testthe effects of interviewer speech duration uponrespondent speech duration and reporting fre-quency.53 In order to increase control over allaspects of interviewer verbal behavior, variationin speech duration was created through the useof questionnaires with short and long questions.Furthermore, the lengthening of short-formquestions was implemented in such a way thatthe information requested in short and longquestions was kept constant. This strategy wasused to rule out the possibility of obtaininglonger answers to longer questions only be~causethese questions explicitly asked for more infor-mation.
Questionnaire Procedures
An interview containing 28 questions wascreated according to customary methodolc~gicalprinciples. An average of 14 words was used ineach question. Information was requested onvarious health events (e.g., acute illnesses, in-juries or accidents, and chronic conditions) andhealth-related behaviors (e.g., medicines takenand doctor visits) which occurred during variousperiods of time (e.g., last 2 weeks, 4 weeks, 6months). The questions were primarily aboutthe respondent herself (24 questions) and, sec-ondarily about another selected member of thehousehold (4 questions). The types and numbersof questions used were as follows:
a. Open-ended type, leading to free response(8);
b. “How many. . .“ type, seeking informationon frequency of specific events (8); and
c. Closed, forced-choice, checklist type, deal-ing with presence or absence of specificchronic conditions (12).
Then, each question was written’ in a longform according to the folIowing procedure. Along question consisted of three sentences:
a. An introductory statement giving a partialdescription of the topic of the questicm,including the same terms as used in theshort question, but in a different grammati-cal structure, possibly using a clicht;
62

b. An intermediary statement conveying in-formation already contained in the shortquestion but not presented in the introduc-tory statement, and usually introduced byanother clich6; or a filler, introducing someextraneous information of obvious andinconsequential nature about the surveybut unlikely to affect the meaning of thequestion; and,
c. The question itself in its short form.
The two following examples provide anillustration of this question-writing procedure:
Q. 4. Short Form: Would you tell me whataccidents or injuries you may have had duringthe last six months? (17 words)
Q. 4. Long Form: We would like to go nextto a question about accidents and injuries. Inthis survey we ask everybody to report theiraccidents and injuries for the last six months.Would you tell me what accidents or injuriesyou may have had during the last six months?(47 words)
Q. 17. Short Form: Have you ever had anytrouble hearing? (7 words)
Q. 17. Long Form: Trouble hearing is the lastitem of this list. We are looking for someinformation about it. Have you ever had anytrouble hearing? (24 words)
Thus, length was added to questions byintroducing redundancy, clich&, and extraneousinformation. It was assumed that this proceduredld not alter the objective or meaning of thequestion. The short form of the question alwaysappeared with identical wording in the last partof the long question. Long questions containedan average of 38 words each. They were 2.7times longer than the average short question.This length ratio was assumed to be large enoughto ensure a substantial variation in interviewerspeech duration, despite expected variations inthe speed of reading.’
Three questionnaire procedures (A, B, and C)were designed from a pool of 28 questions, allwritten in both short and long forms. The 28
‘Ray and Webb’s research on Kennedy news conferences 74
used the number of lines of transcnpted speech as the unit ofspeech duration anslysis. That measure bas been found byMatarazzo72 and others to be highly correlated with standardmethods of time recording (over .90) and highly reliable.
questions were used in the same order in all 3procedures. Questionnaire C (control) consistedof short-form questions only. Questionnaires Aand B consisted of blocks of long-form andblocks of short-form questions, alternated insuch a way that each block of questions asked inthe long form in procedure A was asked in theshort form in procedure B and vice versa. Thisparticular arrangement was used for two reasons.First, it was assumed that a questionnaireemploying only lengthy questions might bedetrimental to useftd respondent performance.tSecond, this particular design allowed for aninvestigation of potential carryover effect oflength from blocks of long questions to blocksof short questions.” Finally, this design allowedfor a comparison of answers to all questions inshort form in treatment C and long form ineither treatment A or B (with a mixture totalingabout one-third short questions and two-thirdslong questions). Thus, the three experimentalprocedures presented the following question-length composition:
A B c
I 4 long I 4 Shon 1 4 short
4 short 4 long 14 short I
I I I I
t——— .— ~––----+-–---–
1 I6 long I 6 short 1 6 ,horz
6 short I 6 long I 6 short
I I
Field Procedures
Two female interviewers on the Survey Re-search Center staff each received about 8 hours
tcument SWq Rese~ch Center work tends to disc~d this
assumption, at least for interviews of moderate total length(about 15 minutes).
‘The carryover effect was not found by Matarazzo, but wassuggested by the Ray and Webb study of Kennedy newsconferences.
63
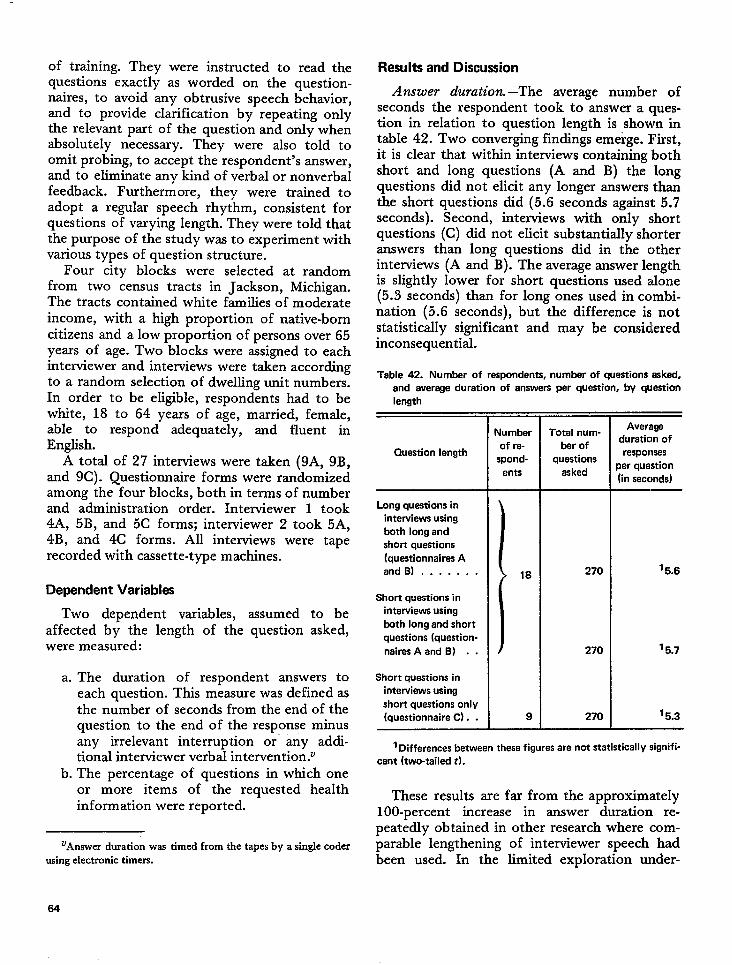
of training. Theyquestions exactly
were instructed toas worded on the
naires, to avoid anv obtrusive s~eech
read thequestion-behavior,
and to provide clarification by- repeating onlythe relevant part of the question and only whenabsolutely necessary. They were also told toomit probing, to accept the respondent’s answer,and to eliminate any kind of verbal or nonverbalfeedback. Furthermore, they were trained toadopt a regular speech rhythm, consistent forquestions of varying length. They were told thatthe purpose of the study was to experiment withvarious types of question structure.
Four city blocks were selected at randomfrom two census tracts in Jackson, Michigan.The tracts contained white families of moderateincome, with a high proportion of native-borncitizens and a low proportion of persons over 65years of age. Two blocks were assigned to eachinterviewer and interviews were taken accordingto a random selection of dwelling unit numbers.In order to be eligible, respondents had to bewhite, 18 to 64 years of age, married, female,able to respond adequately, and fluent inEnglish.
A total of 27 interviews were taken (9A, 9B,and 9C). Questionnaire forms were randomizedamong the four blocks, both in terms of numberand administration order. Interviewer 1 took4A, 5B, and 5C forms; interviewer 2 took 5A,4B, and 4C forms. AU interviews were taperecorded with cassette-type machines.
Dependent Variables
Two dependent variables, assumed to beaffected by the length of the question asked,were measured:
a. The duration of respondent answers toeach question. This measure was defined asthe number of seconds from the end of thequestion to the end of the response minusany irrelevant interruption or- any addi-tional interviewer verbal intervention.V
b. The percentage of questions in which oneor more items of the requested healthinformation were reported.
‘Answer duration was timed from the tapes by a single coderusing electronic timers.
Results and Discussion
Answer duration. –The average number ofseconds the respondent took to answer a ques-tion in relation to question length is shown intabIe 42. Two converging findings emerge. First,it is clear that within interviews containing bothshort and long questions (A and B) the longquestions did not elicit any longer answers thanthe short questions did (5.6 seconds against 5.7seconds). Second, interviews with only shortquestions (C) did not elicit substantially shorteranswers than long questions did in the otherinterviews (A and B). The average answer lengthis slightly lower for short questions used alone(5.3 seconds) than for long ones used in combi-nation (5.6 seconds), but the difference is notstatistically significant and may be consideredinconsequentizd.
Table 42. Number of respondents, number of questions asked,
and average duration of answers per question, by question
length
Question length
Long questions in
interviews using
both long and
short questions
(questionnaires A
and ).......
Short quastions in
interviews using
both long and short
questions (question-
naires A and B) . .
Short questions in
interviews using
short quastions only
(questionnaire C). .
Number
of re-
spond-
ents
18
9
Total num-
ber of
questions
asked
270
270
270
Average
duration of
responses
perquestion
(in saccmds)
‘ 5.6
‘ 5.7
‘ 5.3——
1Differences between these figures are not statistically signifi-
cant (two-tailed t).
These results are far from the approximately100-percent increase in answer duration re-peatedly obtained in other research where com-parable lengthening of interviewer speech hadbeen used. In the limited exploration under-
64
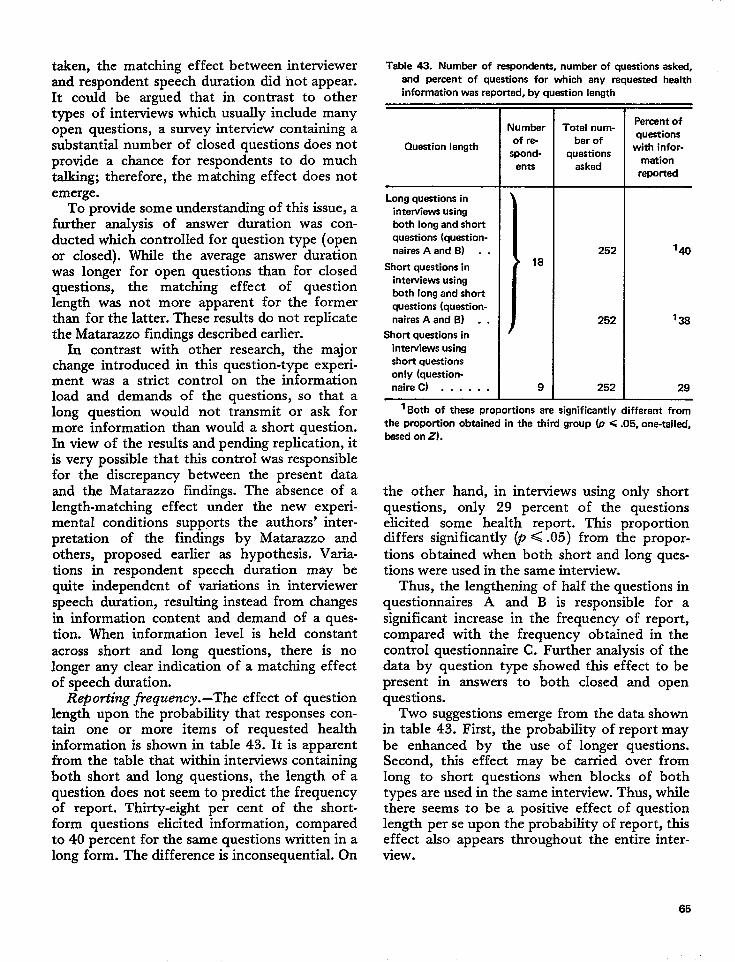
taken, the matching effect between interviewerand respondent speech duration did not appear.It could be argued that in contrast to othertypes of interviews which usually include manyopen questions, a survey interview containing asubstantial number of closed questions does notprovide a chance for respondents to do muchtalking; therefore, the matching effect does notemerge.
To provide some understanding of this issue, afurther analysis of answer duration was con-ducted which controlled for question type (openor closed). While the average answer durationwas longer for open questions than for closedquestions, the matching effect of questionlength was not more apparent for the formerthan for the latter. These results do not replicatethe Matarazzo findings described earlier.
In contrast with other research, the majorchange introduced in this question-type experi-ment was a strict control on the informationload and demands of the questions, so that along question would not transmit or ask formore information than would a short question.In view of the results and pending replication, itis very possible that this control was responsiblefor the discrepancy between the present dataand the Matarazzo findings. The absence of alength-matching effect under the new experi-mental conditions supp,orts the authors’ inter-pretation of the findings by Matarazzo andothers, proposed earlier as hypothesis. Varia-tions in respondent speech duration may bequite independent of variations in interviewerspeech duration, resulting instead from changesin information content and demand of a ques-tion. When information level is held constantacross short and Iong questions, there is nolonger any clear indication of a matching effectof speech duration.
Reporh”ng frequency.-The effect of questionlength upon the probability that responses con-tain one or more items of requested healthinformation is shown in table 43. It is apparentfrom the table that within interviews containingboth short and long questions, the length of aquestion does not seem to predict the frequencyof report. Thirty-eight per cent of the short-form questions elicited information, comparedto 40 percent for the same questions written in along form. The difference is inconsequential. On
Table 43. Number of respondents, number of questions askad,
and percent of questions for which any requested health
information was reported, by question length
Question length
Long questions in
interviews using
both long and short
questions (question-
naires A and B) . .
Short questions in
interviews using
both long and short
questions (question-
naires A and B) . .
Short questions in
interviews using
short questions
only (question-
naire) . . . . . .
Number
of re-
spond-
enta
18
9
Total num-
ber of
questions
asked
252
252
252
Parcent of
questions
with infor-
mation
reported
1*
‘ 38
29
1Bothof the~ propohionsare significantly different from
the proportion obtained in the third group (p <.05, one-tailed,
based on Z).
the other hand, in intemiews using only shortquestions, only 29 percent of the questionselicited some health report. This proportiondiffers significantly @ < .05) from the propor-tions obtained when both short and long ques-tions were used in the same interview.
Thus, the lengthening of half the questions inquestiomaires A and B is responsible for asignificant increase in the frequency of report,compared with the frequency obtained in thecontrol questionnaire C. Further analysis of thedata by question type showed this effect to bepresent in answers to both closed and openquestions.
Two suggestions emerge from the data shownin table 43. First, the probability of report maybe enhanced by the use of longer questions.Second, this effect may be carried over fromlong to short questions when blocks of bothtypes are used in the same interview. Thus, whilethere seems to be a positive effect of questionlength per se upon the probability of report, thiseffect also appears throughout the entire inter-view.
65
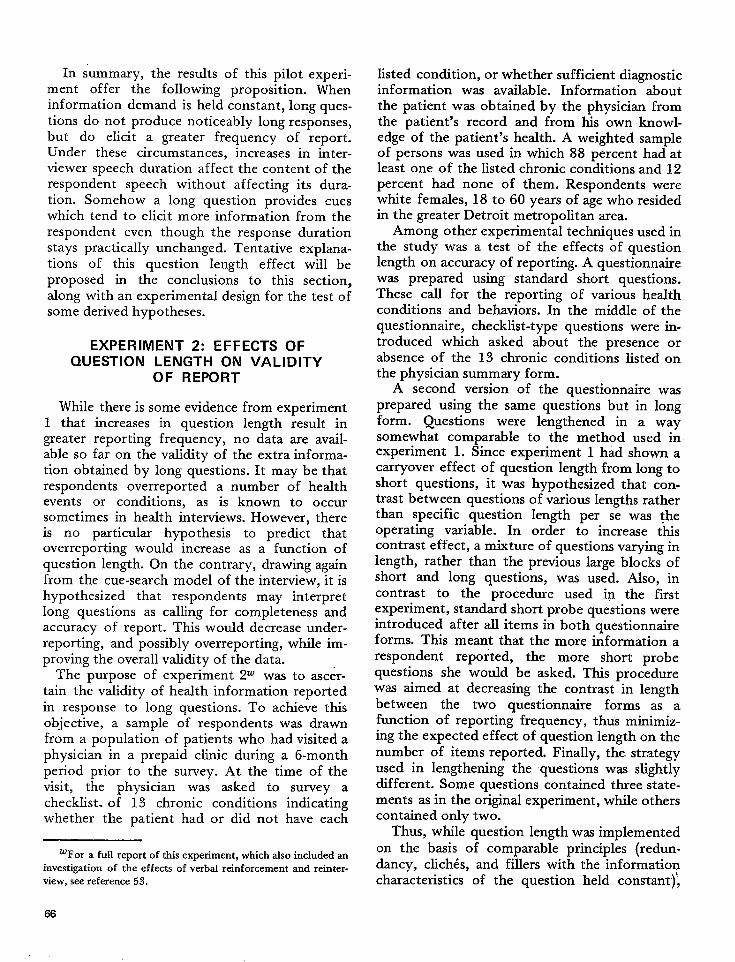
In summary, the results of this pilot experi-ment offer the following proposition. Wheninformation demand is held constant, long ques-tions do not produce noticeably long responses,but do elicit a greater frequency of report.Under these circumstances, increases in inter-viewer speech duration affect the content of therespondent speech without affecting its dura-tion. Somehow a long question provides cueswhich tend to elicit more information from therespondent even though the response durationstays practically unchanged. Tentative explana-tions of this question length effect will beproposed in the conclusions to this section,along with an experimental design for the test ofsome derived hypotheses.
EXPERIMENT 2: EFFECTS OFQUESTION LENGTH ON VALIDITY
OF REPORT
While there is some evidence from experiment1 that increases in question length result ingreater reporting frequency, no data are avail-able so far on the validity of the extra informa-tion obtained by long questions. It may be thatrespondents overreported a number of healthevents or conditions, as is known to occursometimes in health interviews. However, thereis no particular hypothesis to predict thatoverreporting would increase as a function ofquestion length. On the contrary, drawing againfrom the cue-search model of the interview, it ishypothesized that respondents may interpretlong questions as calling for completeness andaccuracy of report. This would decrease under-reporting, and possibly overreporting, while im-proving the overall validity of the data.
The purpose of experiment 2W was to ascer-tain the validity of health information reportedin response to long questions. To achieve thisobjective, a sample of respondents was drawnfrom a population of patients who had visited aphysician in a prepaid clinic during a 6-monthperiod prior to the survey. At the time of thevisit, the physician was asked to survey achecklist. of 13 chronic conditions indicatingwhether the patient had or did not have each
‘For a fulf report of this experiment, which also included aninvestigation of the effects of verbal reinforcement and reinter-view, see reference 53.
listed condition, or whether sufficient diagnosticinformation was available. Information aboutthe patient was obtained by the physician fromthe patient’s record and from his own knowl-edge of the patient’s health. A weighted sampleof persons was used in which 88 percent had atleast one of the listed chronic conditions and 12percent had none of them. Respondents werewhite females, 18 to 60 years of age who residedin the greater Detroit metropolitan area.
Among other experimental techniques used inthe study was a test of the effects of questionlength on accuracy of reporting. A questionnairewas prepared using standard short questions.These call for the reporting of various healthconditions and behaviors. In the middle of thequestionnaire, checklist-type questions were in-troduced which asked about the presence orabsence of the 13 chronic conditions listed onthe physician summary form.
A second version of the questionnaire wasprepared using the same questions but in longform. Questions were lengthened in a waysomewhat comparable to the method used inexperiment 1. Since experiment 1 had shown acarryover effect of question length from long toshort questions, it was hypothesized that con-trast between questions of various lengths ratherthan specific question length per se was Jheoperating variable. In order to increase thiscontrast effect, a mixture of questions varying inlength, rather than the previous large blocks ofshort and long questions, was used. AIso, in
contrast to the procedure used in the firstexperiment, standard short probe questions wereintroduced after all items in both questionnaireforms. This meant that the more information arespondent reported, the more short probequestions she would be asked. This procedurewas aimed at decreasing the contrast in lengthbetween the two questionnaire forms as afunction of reporting frequency, thu’s minimiz-ing the expected effect of question length on thenumber of items reported. Finally, the. strategyused in lengthening the questions was slightlydifferent. Some questions contained three state-ments as in the original experiment, while otherscontained only two.
Thus, while question length was implementedon the basis of comparable principles (redun-dancy, clich6s, and fillers with the information?characteristics of the question held constant),
66
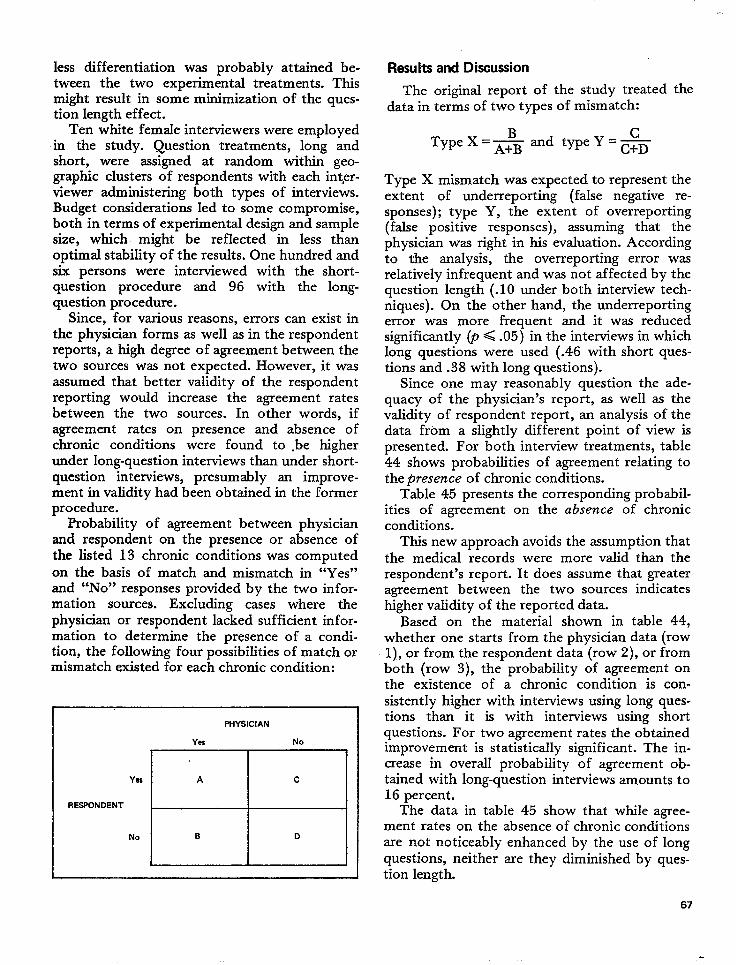
less differentiation was probably attained be-tween the two experimental treatments. Thismight result in some mtilmization of the ques-tion length effect.
Ten white female interviewers were employedin the study. Question treatments, long andshort, were assigned at random within geo-graphic clusters of respondents with each interv-iewer administering both types of interviews.Budget considerations led to some compromise,both in terms of experimental design and samplesize, which might be reflected in less thanoptimal stabiIity of the results. One hundred andsix persons were interviewed with the short-question procedure and 96 with the long-question procedure.
Since, for various reasons, errors can exist inthe physician forms as well as in the respondentreports, a high degree of agreement between thetwo sources was not expected. However, it wasassumed that better validity of the respondentreporting would increase the agreement ratesbetween the two sources. In other words, ifagreement rates on presence and absence ofchronic conditions were found to .be higherunder long-question interviews than under short-question interviews, presumably an improve-ment in validity had been obtained in the formerprocedure.
Probability of agreement between physicianand respondent on the presence or absence ofthe listed 13 chronic conditions was computedon the basis of match and mismatch in “Yes”and “No” responses provided by the two infor-mation sources. Excluding cases where thephysician or respondent lacked sufficient infor-mation to determine the presence of a condi-tion, the followimz four Rossibifities of match or
s
mismatch existed for each chronic condition:
Yes
RESPONDENT
No
PHYSICIAN
Yes No
A c
B D
Results and Discussion
The original report of the study treated thedata in terms of two types of mismatch:
cType X=-&and type Y=~
Type X mismatch was expected to represent theextent of underreporting (false negative re-sponses); type Y, the extent of overreporting(false positive responses), assuming that thephysician was right in his evaluation. Accordingto the analysis, the overreporting error wasrelatively infrequent and was not affected by thequestion length (.10 under both interview tech-niques). On the other hand, the underreportingerror was more frequent and it was reducedsignificantly (p < .05) in the interviews in whichlong questions were used (.46 with short ques-tions and .38 with long questions).
Since one may reasonably question the ade-quacy of the physician’s report, as well as thevalidity of respondent report, an analysis of thedata from a slightly different point of view ispresented. For both interview treatments, table44 shows probabilities of agreement relating tothe presence of chronic conditions.
Table 45 presents the corresponding probabil-ities of agreement on the absence of chronicconditions.
This new approach avoids the assumption thatthe medical records were more valid than therespondent’s report. It does assume that greateragreement between the two sources indicateshigher vaI.idity of the reported data.
Based on the material shown in table 44,whether one starts from the physician data (row1),, or from the respondent data (row 2), or fromboth (row 3), the probability of agreement onthe existence of a chronic condition is con-sistently higher with interviews using long ques-tions than it is with interviews using shortquestions. For two agreement rates the obtainedimprovement is statistically significant. The in-crease in overall probability of agreement ob-tained with long-question interviews amounts to16 percent.
The data in table 45 show that while agree-ment rates on the absence of chronic conditionsare not noticeably enhanced by the use of longquestions, neither are they diminished by ques-tion length.
67
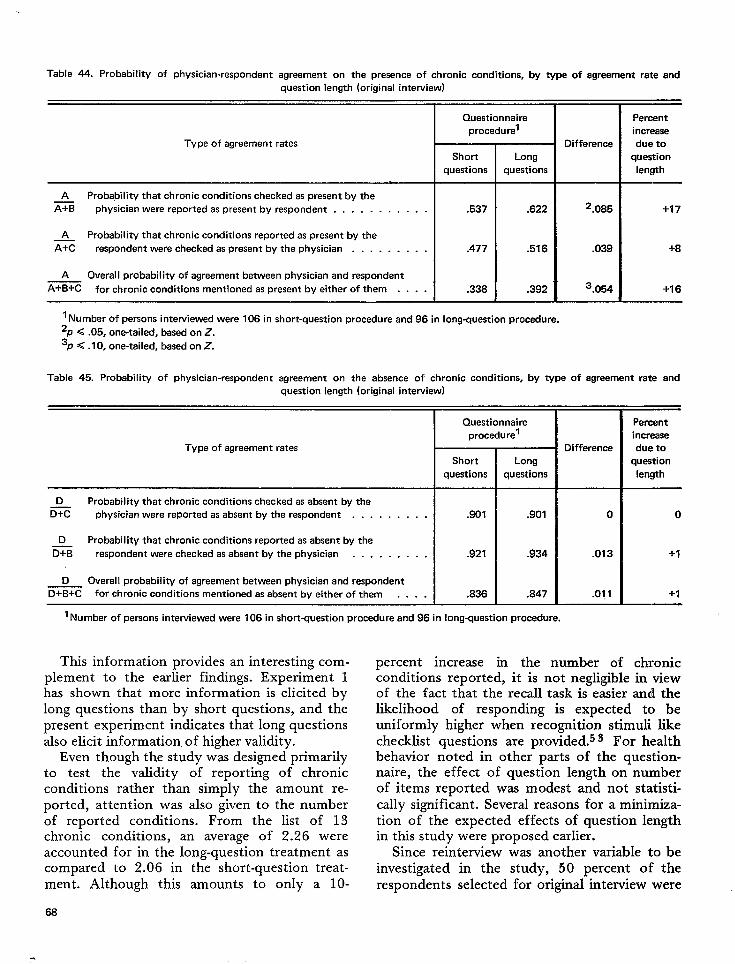
Table 44. Probability of physician-respondent agreement on the presence of chronic conditions, by type of agreement rate and
question length (original interview)
Questionnaire Percent
procedu rel increase
Type of agreement rates Difference due to
Short Long question
questions questions length
A Probability that chronic conditions checked as present by thez physician were reported aspresent by respondent . . . . . . . . . . . .537 .622 2.085 +17
A Probability that chronic conditions reported as present by the
E respondent were checked aspresent by the physician . . . . . . . . . .477 .516 .039 +8
A Overal I probability of agreement between physician and respondent
A+B+C forchronic conditions mentioned aspresent byeither of them . . . . .338 .392 3.054 +16
I Number of persons intewiewed were 106 in short-question procedure and 96 in lon9_WJestion Procedure.
‘p <.05, one-tailed, based on Z.
3P <.10, one-tailed, based on Z.
Table 45. Probability of physician-respondent agreement on the absence of chronic conditions, by type of agreement rate and
question length (original interview)
Type of agreement rates
D Probability that chronic conditions checked as absent by the
G physician were reported asabsent by the respondent . . . . . . . . .
D Probability that chronic conditions reported as absent by the
m respondent were checked asabsent by the physician . . . . . . . . .
D Overal I probabi Iity of agreement between physician and respondent
D+B+C forchronic conditions mentioned asabsent byeither of them . . . .
Questionnaire
procedure’
Short
questions
.901
.921
.836
Long
questions
.901
.934
.847
1Number of ~emon~ inte~ie~ed ware 106 in short-question procedure and 96 in lon9-question Procedure.
This information provides an interesting com-plement to the earlier findings. Experiment 1has shown that more information is elicited bylong questions than by short questions, and thepresent experiment indicates that long questionsalso elicit information. of higher validity.
Even though the study was designed primarilyto test the validity of reporting of chronicconditions rather than simply the amount re-ported, attention was also given to the numberof reported conditions. From the list of 13chronic conditions, an average of 2.26 wereaccounted for in the long-question treatment ascompared to 2.06 in the short-question treat-ment. Although this amounts to only a 10-
68
Difference
0
.013
.011
————Parcent
increase
due to
question
length
o
+1
+1.—
percent increase in the number of chronicconditions reported, it is not negligible in viewof the fact that the recall task is easier and thelikelihood of responding is expected to beuniformly higher when recognition stimuli likechecklist questions are provided.s 3 For healthbehavior noted in other parts of the question-naire, the effect of question length on numberof items reported was modest and not statisti-cally significant. Several reasons for a minimiza-tion of the expected effects of question lengthin this study were proposed earlier.
Since reinterview was another variable to beinvestigated in the study, 50 percent of therespondents selected for original interview were
.
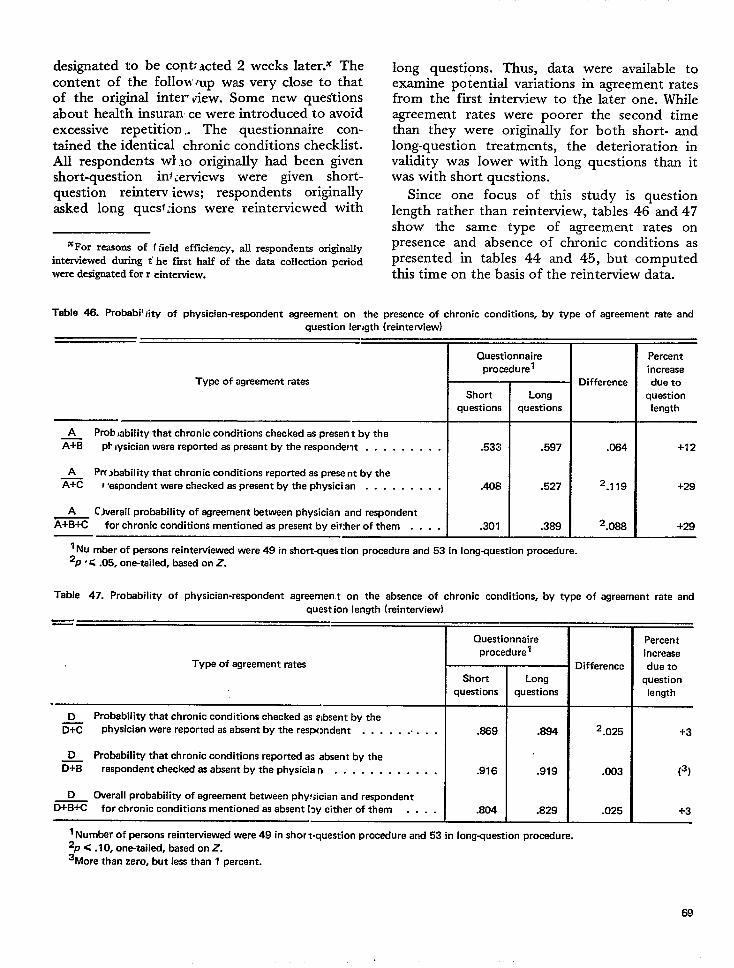
designated to be cent: acted 2content of the follow mp was
weeks later.% Thevery close to that
of the original inter vie-w. Some ‘new questionsabout health insuran ce were introduced to avoidexcessive repetition.. The questionnaire con-tained the identical chronic conditions checklist.All respondents WI lo originally had been givenshort-question inf iervit2WS were given short-
question reinterv iews; respondents originallyasked long ques~:ions were reinterviewed with
‘For reasons of f field efficiency, all respondents originallyinterviewed during t’ he first half of the data collection periodwere designated for r einterview.
long questions. Thus, dataexamine t30tential variations
were available toin agreement rates
from the’ first interview to the later one. Whileagreement rates were poorer the second timethan they were originally for both short- andlong-question treatments, the deterioration invalidity was lower with long questions than itwas with short questions.
Since one focus of this study is questionlength rather than reintewiew, tables 46 and 47show the same type of agreement rates onpresence and absence of chronic conditions aspresented in tables 44 and 45, but computedthis time on the basis of the reinterview data.
Table 46. Probabil Iity of physician-respondent egreement on the presence of chronic conditions, by type of agreement rate and
question Iervgth (reinterview)
Type of agreament rates
A Prob ,ability that chronic conditions checked as present by the
x% pb iysician were reportad as present by the respondent . . . . . . . . .
A Prc jbability that chronic conditions reportad as present by theE I :espondent ware chacked as present by tha physician . . . . . . . . .
A C)varall probability of agreement between physician and respondant
x%% for chronic conditions mentioned as present bv eii:her of them . . . .
Questionnaire
procadurel
Short
questions
.533
.408
.301
Long
questions
.597
.527
.389
Difference
.064
2.119
2.088
Percent
increase
due to
question
length
+12
+29
+29
I NU mber of persons reintewiewad were 49 in shortquastion procedure and 53 in lon9-uestion procedure.
2P’ <.05, one-tailed, based on Z.
Table 47. Probability of physician-respondent agreemen t on the absence of chronic conditions, by type of egraement rate and
quest ion length (reintewiew)
=
Questionnaire
procedure’
Type of agreement rates
r
Short
questions
D Probability that chronic conditions checked as absent by the
K physician were reportad as absent by the res~mdent . . . . . . . . . .
D Probability that chronic conditions reported as absent by the
= respondent checked as absent by the physician . . . . . . . . . . . .
D overall probability of agreement between phy!;ician and respondent
D+B+C for chronic conditions mentioned as absent [~y aither of them . . . .
.869
.916
.804
Long
questions
.884
.919
.829
Difference
2.025
.003
.025
Percent
increasa
due to
question
length
-!-3
(3)
i-3
1 Number of ~rsons raintewiewerf were 49 in short-question procadura and 53 in km9WueStion Pro*ure.
2P < .I O, one-tailed, based on z.3“More th-an zero, bunt lass than 1 percent.
69
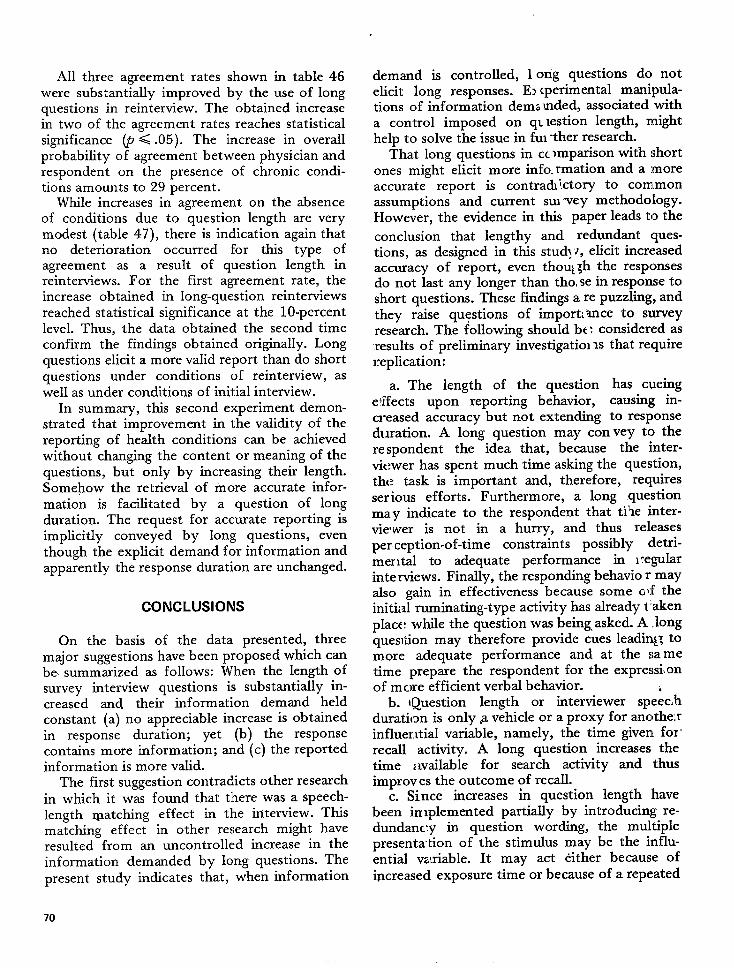
All three agreement rates shown in table 46were substantially improved by the use of longquestions in reinterview. The obtained increasein two of the agreement rates reaches statisticalsignificance (p < .05). The increase in overallprobability of agreement between physician andrespondent on the presence of chronic condi-tions amounts to 29 percent.
While increases in agreement on the absenceof conditions due to question length are verymodest (table 47), there is indication again thatno deterioration occurred for this type ofagreement as a result of question length inreinterviews. For the first agreement rate, theincrease obtained in long-question reinterviewsreached statistical significance at the 10-percentlevel. Thus, the data obtained the second timeconfirm the findings obtained originally. Longquestions elicit a more valid report than do shortquestions under conditions of reinterview, aswell as under conditions of initial interview.
In summary, this second experiment demon-strated that improvement in the validity of thereporting of health conditions can be achievedwithout changing the content or meaning of thequestions, but only by increasing their length.Somehow the retrieval of more accurate infor-mation is facilitated by a question of longduration. The request for accurate reporting isimplicitly conveyed by long questions, eventhough the explicit demand for information andapparently the response duration are unchanged.
CONCLUSIONS
On the basis of the data presented, threemajor suggestions have been proposed which canbe- summarized as follows: When the length ofsurvey interview questions is substantially in-creased and their information demand heldconstant (a) no appreciable increase is obtainedin response duration; yet (b) the responsecontains more information; and (c) the reportedinformation is more valid.
The first suggestion contradicts other researchin which it was found that there was a speech-Iength matching effect in the interview. Thismatching effect in other research might haveresulted from an uncontrolled increase in theinformation demanded by long questions. Thepresent study indicates that, when information
demand is controlled, 1 ong questions do notelicit long responses. E> cperimental manipula-tions of information dema mded, associated witha control imposed on q~ Iestion length,might
help to solve the issue in fm -ther research.That long questions in cc >mparison with short
ones might elicit more info. rmation and a moreaccurate report is contrach ‘.ctory to commonassumptions and current SLUwey methodology.However, the evidence in this paper leads to the
conclusion that lengthy and redundant ques-tions, as designed in this stud] J, elicit increasedaccuracy of report, even thou~ :h the responsesdo not last any longer than the, se in response toshort questions. These findings a re puzzling, andthey raise questions of importi mce to surveyresearch. The following should be: considered as:results of preliminary investigation M that requirereplication:
a. The length of the question has cueing
effects upon reporting behavior, causing in-creased accuracy but not extending to resplonseduration. A long question may convey to therespondent the idea that, because the inter-viewer has spent much time asking the question,the task is important and, therefore, requires
serious efforts. Furthermore, a long questionmay indicate to the respondent that tiie inter-~e,wer is not in a hurry, and thus releases
perception-of-time constraints possibly detri-mer]tal to adequate performance in ]!egularinterviews. Finally, the responding behavio r mayalso gain in effectiveness because some af theinitiid ruminating-type activity has already takenplace: while the question was being asked. A .Iongquesltion may therefore provide cues leadin~~ tomore adequate performance and at the sametime prepare the respondent for the expressii onof mcwe efficient verbal behavior.
b. {Question length or interviewer spe~cihduration is only R vehicle or a proxy for ancltherinfher.ttial variable, namely, the time given for’recall activity. A long question increases thetime :wailable for search activity and thusimproves the outcome of recall.
c. Since increases in question length havebeen irrlplemented partially by introducing re-dundancy in question wording, the multiplepresentation of the stimulus may be the influ-ential variable. It may act either because ofincreased exposure time or because of a repeated
70
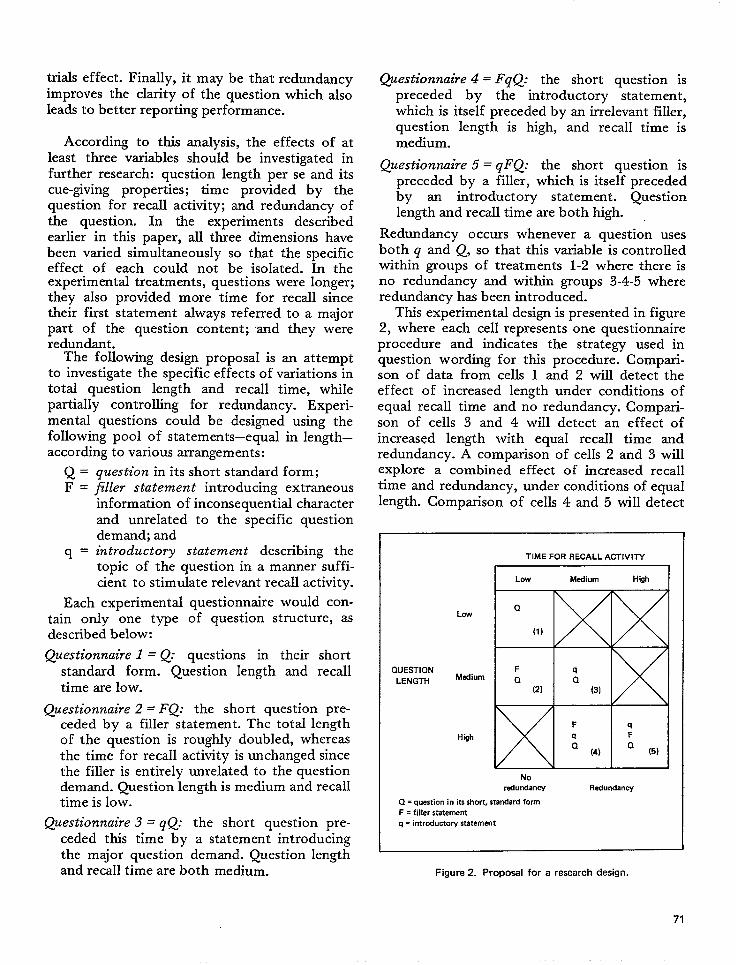
trials effect. Finally, it may be that redundancyimproves the clarity of the question which alsoleads to better reporting performance.
According to this analysis, the effects of atleast three variables should be investigated infurther research: question length per se and itscue-giving properties; time provided by thequestion for recall activity; and redundancy ofthe question. In the experiments describedearlier in this paper, all three dimensions havebeen varied simultaneously so that the specificeffect of each could not be isolated. In theexperimental treatments, questions were longer;they also provided more time for recall sincetheir first statement always referred to a majorpart of the question content; and they wereredundant.
The following design proposal is an attemptto investigate the specific effects of variations intotal question length and recall time, whilepartially controlling for redundancy. Experi-mental questions could be designed using thefollowing pool of statements–equal in length–according to various arrangements:
question in its short standard form;filler statement introducing extraneousinformation of inconsequential characterand unrelated to the specific questiondemand; andintroductory statement describing thetopic of the question in a manner suffi-cient to stimulate relevant recall activity.
Each experimental questionnaire would con-tain only one type of question structure, asdescribed below:
Questionnaire 1 = Q: questions in their short
standard form. Question length and recalltime are low.
Questionnaire 2 = FQ: the short question pre-ceded by a filler statement. The total lengthof the question is rough$r doubled, whereasthe time for recall activity is unchanged sincethe filler is entirely unrelated to the questiondemand. Question length is medium and recalltime is low.
Questionnaire 3 = gQ: the short question pre-ceded this time by a statement introducingthe major question demand. Question lengthand recall time are both medium.
@estionnaire 4 = FqQ: the short question ispreceded by the introductory statement..khich is itseif preceded by an irrelevant filler,question length is high, and recall time ismedium.
Questionnaire 5 = qFQ: the short question ispreceded by a filler, which is itself precededby an introductory statement. Questionlength and recall time are both high.
Redundancy occurs whenever a question usesboth q and Q, so that this variable is controlledwithin groups of treatments 1-2 where there isno redundancy and within groups 3-4-5 whereredundancy has been introduced.
This experimental design is presented in figure2, where each cell represents one questionnaireprocedure and indicates the strategy used inquestion wording for this procedure. Compari-son of data from cells 1 and 2 will detect theef feet of increased length under conditions ofequal recall time and no redundancy. Compari-son of cells 3 and 4 will detect an effect ofincreased length with equal recall time andredundancy. A comparison of cells 2 and 3 willexplore a combined effect of increased recalltime and redundancy, under conditions of equallength. Comparison of ceils 4 and 5 will detect
QUESTION
LENGTH
Low
Medium
Hgh
TIME FOR RECALL ACTIVITY
I I
I Low Medium High I
Noredurdaw Redundancy
Q = question in its short, standard form
F = filler ststement
q = introductory statement
Figure 2. Proposal for a reseerch design.
71
the effect of increased recall times with equal a. A replication of the earlier findings;
length and equal redundancy. Diagonal compari- b. An identification of the most efficientsons of cells will provide a means of examiningthe effects of various combinations of the three
strategy or question anatomy; and
variables. The application of this design may c. Some identification of the variables causinggenerate three types of outcomes: improvement in reporting.
REFERENCES
1Cannell, C. F., and Fowler, F. J.: A Study of theReporting of Virits to Doctors in the National HealthSurvey. Arm Arbor, Mich. Survey Research Center. TheUniversity of Michigan, Oct. 1963. Mimeographed.
2Marquis, K. H., and Cannell, C. F.: A Study ofInterviewer-Respondent Interaction in the Urban Em-ployment Survey. Ann Arbor, Mich. Survey ResearchCenter. The University of Michigan, Aug. 1969.
3National Center for Health Statistics: Interview dataon chronic conditions compared with information de-rived from medical records. Vital and Health Statistics.PHS Pub. No. 1000-Series 2-No. 23. Public HealthService. Washington. U.S. Government Printing Office,May 1967.
4National Center for Health Statistics: Health inter-view responses compared with medical records. Vital andHealth Statistics. PHS Pub. No. 1000-Series 2-No. 7.Public Health Service. Washington. U.S. GovernmentPrinting Office, July 1965.
5Rice, S. A.: Contagious bias in the interview. Am. J.Sociol. XXXV: 420-423, 1929.
6Stanton, F., and Baker, K. H.: Interview bias andthe recall of incompletely learned materials. Sociometry5:123-124, 1942.
7Katz, D.: Do interviewers bias poll results? PublicOpin. Q. 6:248-268, 1942.
8 Robinson, D., and Rohde, S.: Two experiments withan anti-Semitism poll. J. Abnorm. Sot. Psychol. Q.41:136-144, 1946.
9 Myers, R. J.: Errors and bias in the reporting of agesin census data. Trans. Actuarial Sot. Am, 41:359-415,1940.
10Neely, T.: A Study of Error in the Interview.Privately printed, 1937.
11 Perry, H., and Crossley, H.: Validity of responsesto survey questions. Public Opin. Q. 14, 1950.
12 Lansing, J. B., Ginsberg, G. P., and Braaten, K.: AnInvestigation of Response Error. Urbana, Ill. Bureau ofEconomic and Business Research, University of Illinois,1961.
13 Ferber, R.: Collecting Financial Data by ConsumerPanel Techniques. Urbana, 111.Bureau of Economic andBusiness Research, University of Ilinois, 1959.
14Lansing, J. B., and Blood, D. M.: The ChangingTravel Market. Ann Arbor, Mich. Survey ResearchCenter, The University of Michigan. Monograph No. 38,1964.
15 Goddard, K. E., Broder, G., and Wenar, C.:Reliability of pediatric histories, a preliminary study.Pediatrics 281011-1018, 1961.
16Weiss, D. J., et rd.: Validity of work historiesobtained by interview. Minn. Stud. Vocat, Rehabil.12(41): 1961.
17National Center for Health Statistics: Reporting ofhospitalization in the Health Interview Survey. Vital andHealth Statistics. PHS Pub. No. 1000-Series 2-No. 6.Public Health Service. Washington. U.S. GovernmentPrinting Office, July 1965.
18National Center for Health Statistics: Comparisonof hospitalization reporting in three survey procedures.Vital and Health Statistics. PHS Pub. No. 1000-Series 2-No. 8. Public Health Service. Washington. U.S.Government Printing Office, July 1965.
19Thomdike, E. L.: Educational Psychology. NewYork. Teachers College Press, Columbia University,1913.
20 Ebbinghaus, H.: Memoy. Translated by H. A.Ruger and C. E. Bussenius. New York. Teachers College,1913. (Reissued as paperback, New York: Dover, 1964.)
21 Koffka, K.: Principles of Gestalt Psychology. NewYork. Harcourt Brace, 1935.
22 Kohler, W.: Gestalt Psychology. New York.Liveright, 1947.
23McGeoch, J. A.: Forgetting and the law of disuse.Psychol, Rev. 39: 352-3~0, 1932.
24 Postman, L.: The present status of interferencetheory, in C. N. Cofer, cd., Verbal Learning and VerbalBehavior. New York. McGraw-Hill, 1961. pp. 152-179.
25Hflg=d, E. R., ~d Bower, G. H.: Theories ‘f
Learning, 3rd ed. New York. Appleton, 1966.
26 Cobb, S., and Cannell, C. F.: Some thoughts aboutinterview data. Int. Epidemiol, Assoc. Bull. 13:43-54,1966.
27T~fel, C.: Anxiety and the conditioning Of verbal
behavior. J. Abnorm. Sot. Psychol. 51:496-501, 1955.
72
28 Greenspoon, J.: The reinforcing effect of twospoken sounds on the frequency of two responses. Am.J. Psychol. 68:409416,1955.
29 Verplanck, W. S.: The contiol of the content ofconversation: Reinforcement of statements of opinion.J. Abnorm. Sot. Psychol. 51:668-676,1955.
30 Azarin, N. H., et al.: The control of conversationthrough reinforcement. J. Exp. Anal. Behav. 4:25-30,1961.
31 Centers, R.: A laboratory adaptation of the conver-sational procedure for the conditioning of verbal oper-ants. J. Abnorm. Sot. Psychoi. 67:334-339, 1964.
32 Kanfer, F. H., and McBrearty, J. F.: Minimal socialreinforcement and interview content. J. Clin. Psychol.18:210-215, Apr. 1962.
33 Hildrum, D. C., and Brown, R. W.: Verbal re-inforcement and interviewer bias. J. A bnorm. Sot.Psychol. 53:108-111,1956.
“Nuthman, A. M.: Conditioning of a response classon a personality test. J. Abnorm. Sot. Psychoi. 54:19-23, 1957.
35 Staats, A. W., et al.: Operant conditioning of factoranalytic personality traits. J. Gen. Psychol. 66: 101-114,Jan. 1962.
36Singer, R. D.: Verbal conditioning and generaliza-tion of prodemocratic responses. J. Abnorm. Sot.Psychol. 63:43-46, Jdy 1961.
371nsko, C. A.: Verbal reinforcement and attitude. J.pers. SOC. Psychol. 2:621-623, oct. 1965.
38 Kahn, R. L., and Cannell, C. F.: The Dynamics ofInterviewing. New York. John Wiley & Sons, Inc., 1957.
39 Carmen, C. F., and Kahn, R. L.: Interviewing, in G.L. Lindzey and E. Aronson, eds., The Handbook ofSocial Psychology. Reading, Mass. Addison Wesley,1968.
40 National Center for Health Statistics: Internationalcomparisons of medical care utilization: A feasibilitystudy. Vital a~d Health Statistics. PHS Pub. No. 1000-Series 2-No. 33. Public Health Service. Washington. U.S.Government Printing Office, June 1969.
41 Mooney, H. W.: Methodology in Two CaliforniaHealth Surveys. Public Health Monograph No. 70. PHSPub. No. 942. Public Health Service. Washington. U.S.Government Printing Office, 1,962.
42 National Center for Health Statistics: Optimumrecall period for reporting persons injured in motorvehicle accidents. Vital and Health Statistics. Series2-No. 50. DHEW Pub. No. (HSM) 72-1050. HealthServices and Mental Health Administration. Washington.U.S. Government Printing Office, Apr. 1972.
43 World Health Organization: Manual of the Inter-national Statistical Classification of Dskeases, Injuries,and Causes of Death, Based on the Recommendations ofthe Seventh Revision Conference, 1955. Geneva. WorldHealth Organization, 1957.
44 Fowler, F. J., Jr.: Education, Interaction, and
Interview Performance. Doctoral dissertation, The Uni-versity of Michigan, 1965.
45 Weiss, C. H.: Validity of Interview Responses ofWelfare Mothers. New York. Bureau of Applied SocialResearch, Columbia University, Feb. 1968.
46 Nationrd Center for Health Statistics: The influ-ence of interviewer and respondent psychological andbehavioral variables on the reporting in householdinterviews. Vital and Health Statistics. PHS Pub.No. 1000-Series 2-No. 26. Public Health Service.Washington. U.S. Government Printing Office, March1968.
47 Mueller, J. H., Schuessler, K. F., and Costner, H.L.: Statistical Reasoning in Sociology. Boston.Houghton-Mifflin, 1970. pp. 279-291.
48deKoning, T. L.: Interviewer and Respondent Inter-action in the Household Interview. Doctoral dissertation,The University of Michigan, 1969.
49 Marshall, J., Marquis, K. H., and Oskamp, S.:Effects of kind of question and atmosphere of interroga-tion on accuracy and completeness of testimony. Ham.Law Rev. 84(7): 1620-1643, May 1971.
5 ‘National Center for Health Statistics: Effect ofsome experimental interviewing techniques on reportingin the HeaIth Interview Survey. Vital and HealthStatzktics. PHS Pub. No. 1000-Series 2-No. 41. PublicHealth Service. Washington, U.S. Government PrintingOffice, May 1971.
51 Dollard, J., and Miller, N. E.: Personality andPsychotherapy. New l“ork. McGraw-Hill, 1950.
52Skinner, B. F.: Verbal Behavior. New York. Apple-ton Century Crofts, 1957.
53 National Center for Health Statistics: Reporting ofhealth events in household interviews: Effects of re-inforcement, question length, and reintetiews. Vital andHealth Statish”cs. Series 2-No. 45. DHEW Pub. No.(HSM) 72-1028. Health Services and Mental HealthAdministration. Washington. U.S. Government PrintingOffice, Mar. 1972.
54 Marquis, K. H., and Laurent, A.: Accuracy ofHealth Reporting in Household Interviews as a Functionof Reinforcement, Question Length, and Reinterviews.Unpublished manuscript, 1969.
55 Cannell, C. F., Fowler, F. J., and Marquis, K. H.:Respondents Talk About the National Health SurveyInterview. Ann Arbor, Mich. Survey Research Center.The University of Michigan, Mar. 1965. Mimeographed.
56 Cannell, C. F., Fowler, F. J., and Marquis, K. H.:Report on Development of Brochures for H.I.S. Re-spondents. Ann Arbor, Mich. Survey Research Center.The University of Michigan, Mar. 1965. Unpublishedmanuscript.
5 ‘Zajonc, R. B.: Social Psychology, An Expert-mentalApproach. Belmont, CaIif. Wadsworth, 1966. (BasicConcepts in Psychology series.)
58Edwards, A. L. The Social Desirability Vartible in
73
Personality Assessment and Research. New York,Dryden Press, 1957.
59 Bales, R. F.: Interactz”on Process Analysis. Cam-bridge, Mass. Wesley Press, 1950.
60 Hyman, H. H., et al.: Interviewing in Social
Research. Chicago. University of Chicago Press, 1954.
61 Cannell, C. F.: Private communication: Proposal.1969.
62 Krasner, L.: Studies of the conditioning of verbalbehavior. Psychol. Bull. 55:3, 1958.
63 Spielberger, C. D.: The role of awareness in verbalconditioning, in C. W. Erikson, ed. Behaviorism andAwareness. Durham, N.C. Duke University Press, 1962,pp. 73-101.
64 Spielberger, C. D., and DeNike, L. D.: Descriptivebehaviorism vs. cognitive theory in verbal operantconditioning. Psych. Rev. 73(2): 306-326, 1966.
65 Dukmy, D. E.: Hypotheses and habits in verbal“operant conditioning.” J. Abnorm. Sot. Psychol. 63:
251,263, 1961.
660akes, W. F.: Verbal operant conditioning, inter-tial activity, awareness and the extended interview. j.Pem. Sot. Psychol. 6:198-202, 1967.
67 Marquis, K. H.: Report of Legal Study. Ann Arbor,Mich. Survey Research Center, The University of Michi-gan, 1967. Unpublished manuscript.
68 Asch, S. E.: A reformulation of the problem ofb associations. Am. Psychol. 24:92-102, 1969.
69 National Center for Health Statistics: Reportinghealth events in household interviews: Effects of anextensive questionnaire and a diary procedure. Vital andHealth Statistics. Series 2-No. 49. DHEW Pub. No.(HSM) 72-1049. Health Services and Mental HealthAdministration. Washington. U.S. Government F’rintingOffice, Apr. 1972.
7OParten, M.: Surveys, Polls, and Sam@es: Practical
Procedures. New York. Harper & Bros., 1950.
7 10ppenheim, A. N.: Questz”onnaire Design and
Attitude Measurement. New York. Basic Books,, 1966.
72Matarazzo, J. D., Saslow, G., and Wiens, A. N.:Studies in interview speech behavior, in L. Kramer andL. P. Unman, eds., Research k Behavior Modification.
New York. HoIt, Rinehart and Winston, 1965. pp.179-210.
73Matarazzo, J. D., Wiens, A. N., %slow, G.,Dunham, R. H., and Voas, R. B.: Speech durations ofastronaut and ground communicator. Science 143:148-150, 1964.
74Ray, M. L., and Webb, E. J.: Speech duration
effects in the Kennedy news conferences. Science 153: “899-901, 1966.
75 Heller, K., Davis, J. D., and Myers, R. A..: Theeffects of interviewer style in a standardized interview. J.Consult. Psychol. 30(6): 501-508, 1966.
74
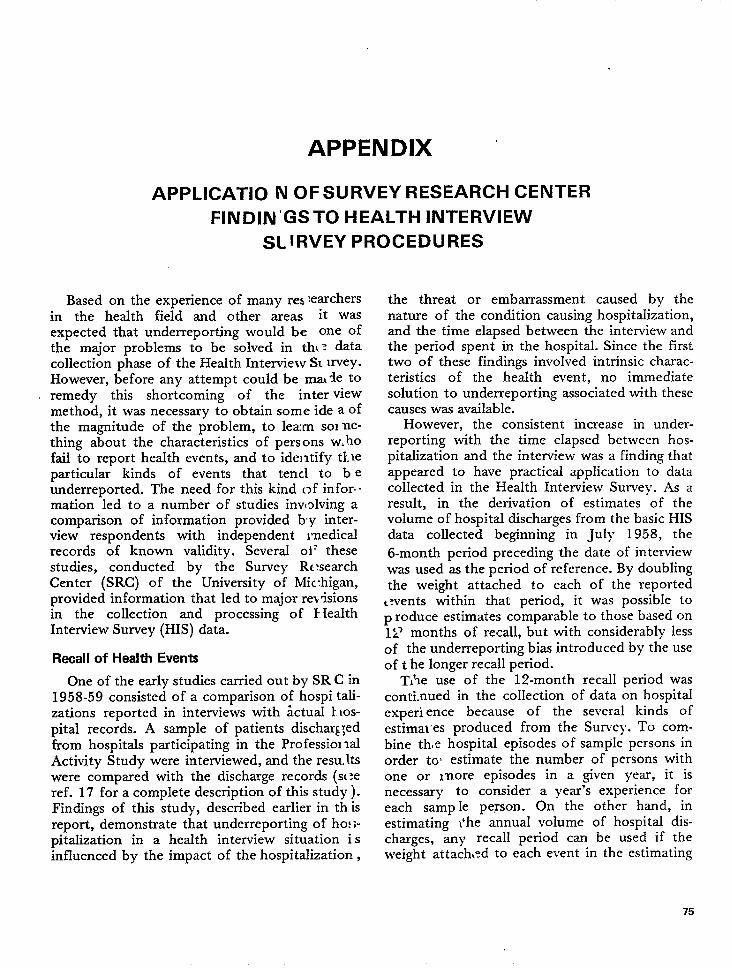
APPENDIX “
APPLICATION N OF SURVEY RESEARCH CENTER
FIN DIN’GSTO HEALTH INTERVIEWSLIRVEYPROCEDURES
Based on the experience of many res :e~chersin the health field and other areas it wasexpected that underreporting would be one ofthe major problems to be solved in th{ ? datacollection phase of the Health Interview S~ lmey.However, before any attempt could be ma~de toremedy this shortcoming of the inter viewmethod, it was necessary to obtain some ide a ofthe magnitude of the problem, to learn sol ne-thing about the characteristics of persons w.hofail to report health events, and to identify tl.~eparticular kinds of events that tencl to b eunderreported. The need for this kind t>f infer. -mation led to a number of studies inwdving acomparison of information provided by inter-view respondents with independent lmedicalrecords of known validity. Several oi’ thesestudies, conducted by the Survey Rc?searchCenter (SRC) of the University of Mic:higan,provided information that led to major re~tisionsin the collection and processing of EIealthInterview Survey (HIS) data.
Recall of Health Events
One of the early studies carried out by SR C in1958-59 consisted of a comparison of hospi tali-zations reported in interviews with ~ctual 1.Los-pital records. A sample of patients dischaq;edfrom hospitals participating in the Profession dActivity Study were interviewed, and the resu,ltswere compared with the discharge records (s( :eref. 17 for a complete description of this study).Findings of this study, described earlier in th isreport, demonstrate that underreporting of ho:;-pitalization in a health interview situation isinfluenced by the impact of the hospitalization,
the threat or embarrassment caused by thenature of the condition causing hospitalization,and the time elapsed between the interview andthe period spent in the hospitaI. Since the firsttwo of these findings involved intrinsic charac-teristics of the health event, no immediatesolution to underreporting associated with thesecauses was available.
However, the consistent increase in under-reporting with the time elapsed between hos-pitalization and the interview was a finding thatappeared to have practical application to datacollected in the HeaIth Interview Survey. As aresult, in the derivation of estimates of thevolume of hospital discharges from the basic HISdata collected beginning in July 1958, the
6-month period preceding the date of interviewwas used as the period of reference. By doublingthe weight attached to each of the reported
twents within that period, it was possible top reduce estimates comparable to those based on12’months of recall, but with considerably lessof the underreporting bias introduced by the useof t he longer recall period.
Tihe use of the 12-month recall period wascontinued in the collection of data on hospit~experience because of the several kinds ofestima~”es produced from the Survey. To com-bine the hospital episodes of sample persons inorder to’ estimate the number of persons withone or lnore episodes in a given y=, it isnecessary to consider a year’s experience foreach samp le person. On the other hand, inestimating i’he annual volume of hospital dis-charges, any recall period can be used if theweight attach,:d to each event in the estimating
75
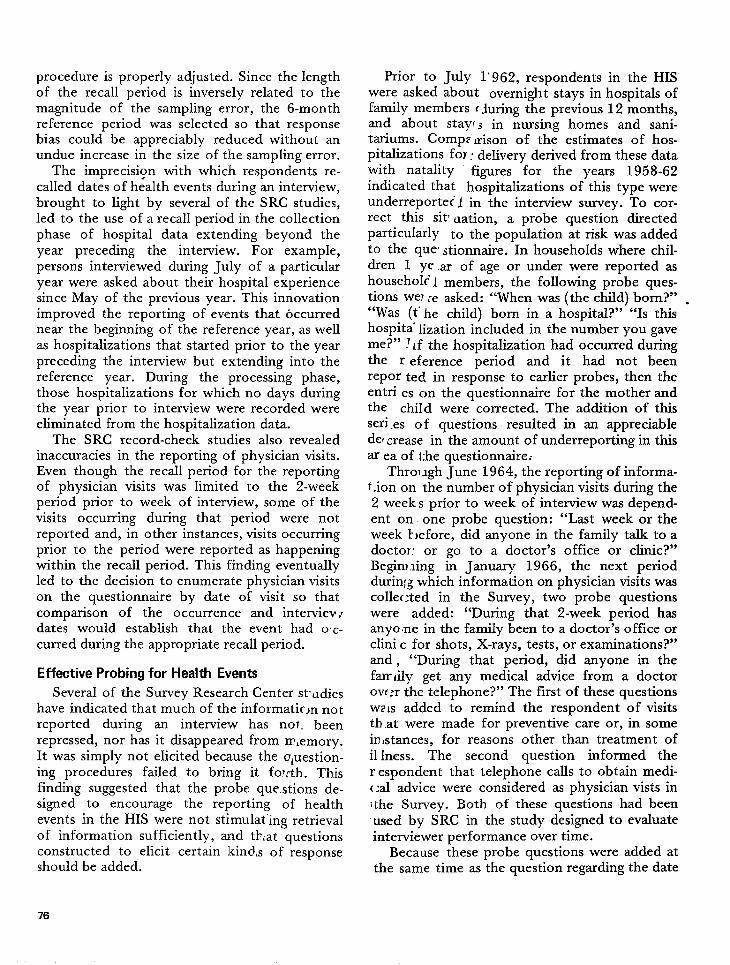
procedure is properly adjusted. Since the lengthof the recall period is inversely related to themagnitude of the sampling error, the 6-monthreference period was selected so that responsebias could be appreciably reduced without anundue increase in the size of the sampling error.
The imprecisi~n with which respondents re-called dates of health events during an interview,brought to light by several of the SRC studies,led to the use of a recall period in the collectionphase of hospital data extending beyond theyear preceding the interview. For example,persons interviewed during July of a particularyear were asked about their hospital experiencesince May of the previous year. This innovationimproved the reporting of events that occurrednear the beginning of the reference year, as wellas hospitalizations that started prior to the yearpreceding the interview but extending into thereference year. During the processing phase,those hospitalizations for which no days duringthe year prior to interview were recorded wereeliminated from the hospitalization data.
The SRC record-check studies also revealedinaccuracies in the reporting of physician visits.Even though the recall period for the reportingof physician visits was limited to the 2-weekperiod prior to week of interview, some of thevisits occurring during that period were notreported and, in other instances, visits occurringprior to the period were reported as happeningwithin the recall period. This finding eventuallyled to the decision to enumerate physician visitson the questionnaire by date of visit so thatcomparison of the occurrence and interviev rdates would establish that the event had o C-
curred during the appropriate recall period.
Effective Probing for Health Events
Several of the Survey Research Center st’udieshave indicated that much of the informaticjn notreported during an interview has not. beenrepressed, nor has it disappeared from m,emory.It was simply not elicited because the uluestion-ing procedures failed to bring it fo~cth. Thisfinding suggested that the probe questions de-signed to encourage the reporting of healthevents in the HIS were not stimulating retrievalof information sufficiently, and tblat questionsconstructed to elicit certain kind,s of responseshould be added.
Prior to July 1’962, respondents in the HISwere asked about overnight stays in hospitals offamily members t ~uring the previous 12 months,and about stay:s in nursing homes and sani-tariums. Compz wisen of the estimates of hos-pitalizations fol: delivery derived from these datawith natality figures for the years 19518-62indicated that hospitalizations of this type wereunderreported 1 in the interview survey. To cor-rect this siti Uation, a probe question directedparticularly to the population at risk was addedto the que’ stionnaire. In households where chil-dren 1 ye ,m of age or under were reported ashousehol? ~ members, the following probe ques-tions we? fe asked: “When was (the child) bin-n?”“Was (t” he child) born in a hospital?” “Is thishospita” li,zation included in the number you gaveme?” ?~f the hospitalization had occurred duringthe r eference period and it had not beenrepor ted, in response to earlier probes, then theentri es C)n the questionnaire for the mother andthe child were corrected. The addition of thisseri .es of questions resulted in an appreciablede{ crease in the amount of underreporting in thisar ea of t;he questionnaire..
Throl~gh June 1964, the reporting of informa-t-ion on the number of physician visits during the2 weeks prior to week of interview was depend-ent on one probe question: “Last week o:r theweek l-~efore, did anyone in the family talk to adoctor: or go to a doctor’s office or clinic?”Begim.ling in January 1966, the next perioddurir-qg which information on physician visits wascolle~;ted in the Survey, two probe questionswere added: “During that 2-week period, hasanyone in the family been to a doctor’s office orclini c for shots, X-rays, tests, or examinations?”and , “During that period, did anyone in thefar Lily get any medical advice from a doctorow :r the telephone?” The first of these questionswz N added to remind the respondent of visitsth ,at were made for preventive care or, in somein ,stances, for reasons other than treatment ofil Iness. The second question informed ther espondent that telephone calls to obtain rnedi-{ :al advice were considered as physician vists in1the Survey. Both of these questions had beenused by SRC in the study designed to evaluateinterviewer performance over time.
Because these probe questions were added atthe same time as the question regarding the date
76
of the visit, their effect on the data was not asobvious as it otherwise would have been. Theprocedure of relating the date of the occurrenceof a visit to the date of interview to determine ifit actually occurred during the proper recallperiod effectively excluded all overreporting ofvisits that had actually occurred prior to therecalI period or during the interview week.Previously such visits would have compensatedfor some of the underreporting. Their removalfrom the data made it difficult to evaluate theeffectiveness of the added probe questions interms of additional visits reported, but there isevidence that the yield from these questions wassubstantial.
Interviewer-Respondent Communication
Many of the studies conducted by SRC haveemphasized the importance of the influence theinterviewer exerts on the respondent and, inturn, on the completeness and accuracy of thereported data. The interviewer’s attitude, herexpectations, the kind of feedback she provides,and her behavior during the interview are only afew of the factors that determine the kind andamount of information obtained during aninterview. However, to take advantage of thisphenomenon in order to improve the quality ofreported information, controls must be initiatedto avoid the introduction of interviewer biases.One of the best methods of exercising control ofinterviewer behavior is to include devices, ques-tions, and statements in the questionnaire whichwill improve communication between theparticipants in the interview but will not directthe responses.
Some of the innovations in the HIS question-naire that have resulted from this type ofresearch include the following:
a. A simpl~ introductory statement has beenprepared in which the interviewer identifiesherself at the door of the household andexplains very briefly the purpose of hervisit. In case the respondent (or anotherfamily member) wants to know more aboutthe purpose of the survey or the uses of thecollected data, a more detailed statement isavailable to the interviewer.
b. Within the questionnaire, introductorystatements are used to explain the subject
c.
d.
matter about which questions are to beasked and to serve as transition devicesfrom one health topic to another. Forexample, a section on X-ray visits wasintroduced by the statement, “Exposure toall kinds of X-rays is a matter of particularinterest to the Public Health Service, and Ihave some questions about X-rays andfluoroscopes.”A smzdl calendar card, with the appropriate2-week recall period outlined in red ishanded to the respondent early in theinterview so that she is constantly aware ofthe specific 2-week period referred tothroughout the interview.Nondirective probe questions have beenincluded on the questionnaires in areaswhere nonspecific or ambiguous informa-tion is likely to be reported. For example,if the respondent reports that she visitedthe doctor at a clinic, the interviewer isinstructed to ask: “Was it a hospital out-patient clinic, a company clinic, or someother kind of clinic?”
In the SRC study on interviewer performanceover time, it was found that interviewers be-came less careful or conscientious in using thetechniques they w“ere trained to use. There wasalso evidence that interviewers who performedwell inspired their respondents to perform well,as measured by the reporting of hospitalizations.This study also brought to light the need forinterviewer training to include devices for stimu-lating the interviewer’s enthusiasm for her job inaddition to retraining in the use of interviewingtechniques. These findings have been reinforcedby records of interviewer performance main-tained by the Bureau of the Census, and havebeen taken into account in the preparation ofmaterial for the periodic training and retrainingsessions conducted for interviewers in the HealthInterview Survey.
Other Considerations
As in any series of researchthe experimental measures inwhen tested as methods for
studies, some ofthe SRC series,reducing under-
reporting in interviews, dld not contribute anysignificant findings. In other instances, encourag-ing results from studies were either inconclusive
77
or needed further testing in a nonlaboratorysituation. In this latter category is the findingthat long questions are more effective than shortones in bringing forth complete and accurateresponses. More research is needed to determineif long questions are productive because theyhave cuing effects on reporting behavior, allowmore time for recall activity, or merely becausethey introduce redundancy of stimuli. Until thespecific variables causing improved reporting areidentified, the introduction of longer questionson the HIS questionnaire, which would lead tolonger interviews and increased costs, could notbe justified.
Verbal reinforcement by the interviewer hasbeen shown to have cognitive and motivational
effects on the respondent by instilling awareness.of respondent task requirements and enccmrag-ing adequate responses to subsequent queitions.However, it will be necessary to develop ways inwhich the interviewer can effectively use re-inforcement without introducing an undueamount of bias in the collected data before thisdevice can be seriously considered.
All of the studies in which the SRC hasattempted to measure the amounts and types ofunderreporting in interviews indicate that somebasic principles of memory and retrieval cm beused to improve reporting. Further research isneeded on the ways in which information isstored and on effective methods of retrievingthat information.
.000
* U.S. GOVERNMENT PRINTING OFFICE 1977 —241-131xI
78
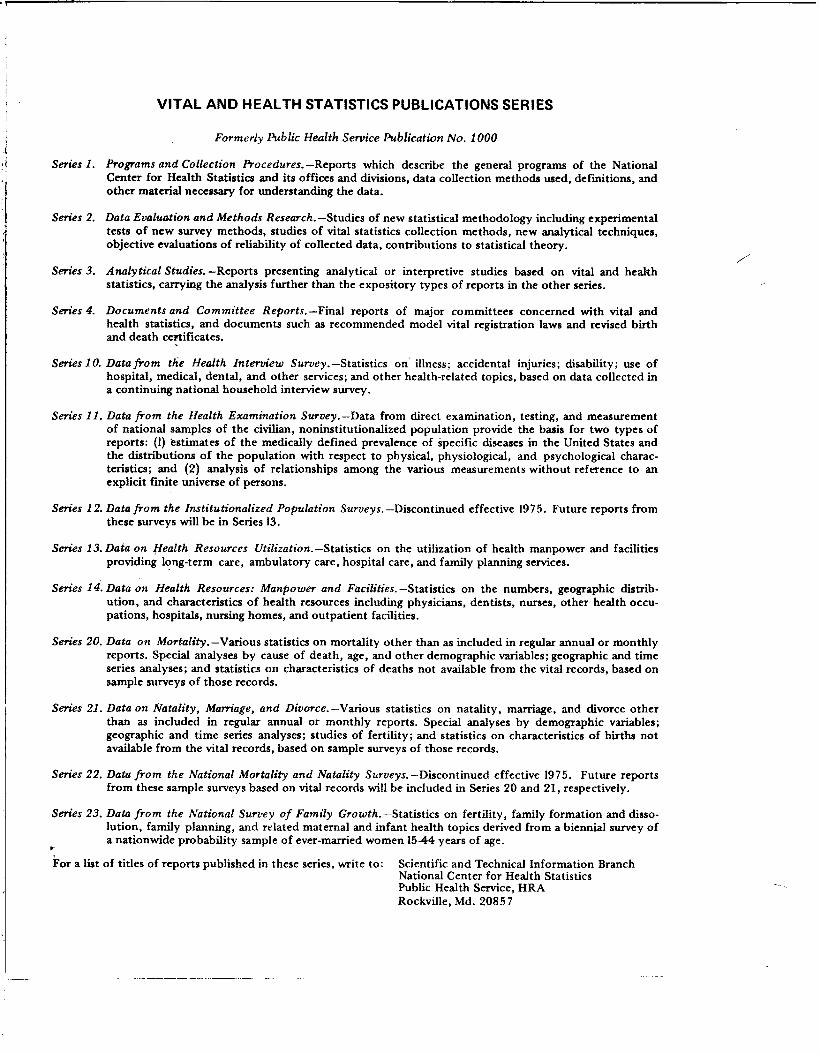
Series 1.
Seri”es 2.
Series 3.
Series 4.
VITAL AND HEALTH STATISTICS PUBLICATIONS SERIES
Formerly fiblic Health Service Publication No. 1000
Programs and Collection Procedures. –Reports which describe the general programs of the National
Center for Health Statistics and its offices and divisions, data coUection methods used, definitions, andother material necessary for understanding the data.
Data Evaluation and Methods Research. –Studies of new statistical methodology including experimental
tests of new survey methods, studies of vital statistics collection methods, new analytical techniques,objective evaluations of reliability of collected data, contributions to statistical theory.
Analytical Studies. –Reports presenting analytical or interpretive studies based on vital and healthstatistics, carrying the analysis further than the expository types of reports in the other series.
Documents and Committee Reports. –Final reports of major committees concerned with vital andhealth statistics, and documents such as recommended model vital registration laws and revised birthand death cetiifkates.
.
Series 10. Data j%om the Health Intervs”ew Survey. –Statistics on” illness; accidental injuries; disability; use ofhospital, medical, dental, and other services; and other health-related topics, based on data collected ina continuing national household interview survey.
Series 11. Data from the Health Examination Survey. –Data from direct examination, testing, and measurementof national samples of the civilian, noninstitutionfllzed population provide the basis for two types ofreports: (1) kstimat es of the medically defined prevalence of specific diseases in the United States andthe distributions of the population with respect to physical, physiological, and psychological charac-teristics; and (2) analysis of relationships among the various measurements without reference to anexplicit finite universe of persons.
Series 12. Data from the Institutionalized Population Surveys. –Discontinued effective 1975. Future reports fromthese surveys will be in Series 13.
Sert”es 13. Data on flealth Resources Utilization. –Statistics on the utilization of health manpower and facilitiesproviding long-term care, ambulatory care, hospital care, and family planning services.
Series 14. Data on Health Resources: Manpower and Facilities.–Statistics on the numbers, geographic distrib-ution, and characteristics of health resources including physicians, dentists, nurses, other health occu-pations, hospitals, nursing homes, and outpatient facilities.
Series 20. Data on Mortality .-Various statistics on mortality other than as included in regular annual or monthlyreports. Special anal yses by cause of death, age, and other demographic variables; geographic and timeseries analyses; and statistics on characteristics of deaths not available from the vital records, based onsample surveys of those records.
Sm”es 21. Data on Natality, Marriage, and Divorce. –Various statistics cm natality, marriage, and divorce otherthan as included in regular annual or monthly reports. Special analyses by demographic variables;geographic and time series analyses; studies of fertility; and statistics on characteristics of births notavailable from the vital records, based on sample surveys of those records.
Series 22. Data from the National Mortality and Natality Surveys. –Discontinued effective 1975. Future reportsfrom these sample surveys based on vital records will be included in Series 20 and 21, respectively.
Series 23. Data from the National Survey of Family Growth. –Statistics on fertility, family formation and disso-lution, family planning, and related maternal and infant health topics derived from a biennial survey ofa nationwide probability sample of ever-married women 1544 years of age.
w
For a list of titles of reports published in these series, write to: Scientific and Technical Information BranchNational Center for Health StatisticsPublic Health Service, HRA
Rockville, Md. 20857
/