a study on financial performance of selected indian...
TRANSCRIPT
International Journal of Research in Management, Science & Technology (E-ISSN: 2321-3264)
Vol. 2, No. 3, December 2014 Available at www.ijrmst.org
2321-3264/Copyright©2014, IJRMST, December 2014
81
A Study on Financial Performance of Selected Indian
Banks Dr.Manvinder Tandon
#1, Dr. Bimal Anjum
*2, Julee
#3
Abstract-The Indian banking sector plays an important role in the
economic development of the country and is the most dominant
segment of the financial sector. The banking sector has shown a
remarkable responsiveness to the needs of the planned economy. It
has brought about a considerable progress in its efforts at deposit
mobilization and has taken a number of measures in the recent
past for accelerating the rate of growth of deposits. Banks play a
positive role in economic development of a country as repositories
of community’s savings and as purveyors of credit. It also helps
channel savings to investments and encourage. This study analyses
that PNB has the highest return on Net Worth (mean) which is a
sign that management of Punjab national bank is at using leverage
to increase profits and profit margins. It is also indicating a sign of
good management.SBI and PNB has the highest return on capital
employed (mean) which indicates that SBI and PNB are realizing
highest return from its capital employed. State bank of India has
highest Dividend Payout Ratio (Mean) which is a sign that the SBI
has highest percentage of profit distribute as dividend to equity
shareholders. Bank of Baroda has the Return on Assets (mean)
which is a sign that management of Bank is using Assets fund more
efficiently to increase earning capacity. It is also suggested that
Bank of India has lowest Divided per share & Earning per share so
bank has improved its profit accordingly increase in its DPS EPS.
Keywords: deposit mobilization, Shareholders Fund, Capital
Employed, EPS etc.
I. INTRODUCTION
In today‟s scenario banking plays a vital role in the growth and
development of developing countries like India.Banks lubricate
the entire monetary and financial system and ensure smooth
operations. With the imitation of the process of liberalization
and globalization of the economy.The financial sector,
particularly the commercial banks, not only in urban areas, but
also in rural areas where the first to experience the winds of
change. However, these changes were experienced more in
urban areas than in rural areas. The economic reforms in India
started in early nineties, but their outcomes visible now major
changes took place in the functioning of banks in India only
after liberalization, globalization and privatization.
The banking sector has shown a remarkable responsiveness to
the needs of the planned economy. It has brought about a
considerable progress in its efforts at deposit mobilization and
has taken a number of measures in the recent past for
accelerating the rate of growth of deposits.The activities of
commercial banking have growth in multi-directional ways as
well as multi-dimensional manner.. In a way, commercial banks
have emerged as key financial agencies for rapid economic
development. By pooling the savings together, banks can make
available funds to specialized institutions which finance
different sectors of the economy, needing capital for various
purposes, risks and durations. By contributing to government
securities, bonds and debentures of term-lending institutions in
the fields of agriculture, industries and now housing, banks are
also providing these institutions with an access to the common
pool of savings mobilized by them, to that extent relieving them
of the responsibility of directly approaching the saver. This
intermediation role of banks is particularly important in the
early stages of economic development and financial
specification. A country like India, with different regions at
different stages of development, presents an interesting
spectrum of the evolving role of banks, in theMatter of inter-
International Journal of Research in Management, Science & Technology (E-ISSN: 2321-3264)
Vol. 2, No. 3, December 2014 Available at www.ijrmst.org
2321-3264/Copyright©2014, IJRMST, December 2014
82
mediation and beyond. The present paper throws the light on the
financial performance the top five banks of India chosen on the
basis of market capitalization.
II. REVIEW OF LITERATURE
Mohan (2005) focused on the efficiency and productivity
changes in the Indian banking concluded that the patterns of
efficiency and technological changes witnessed in Indian
banking can be viewed as consistent with in response to the
forces of deregulationMaji and dey, (2006) analyzed how
strongly the process of globalization and liberalization has
influenced the Indian banking sector. The ongoing reforms in
the banking sector, with their thrust on transparency, efficiency
and profitability, have forced the Indian banking sector to adopt
suitable strategies with focus on productivity, profitability,
competitiveness and sustainability. SubashC.Ray (2000),
India‟s public sector banks (PSBs) are compared unfavorably
with their private sector counterparts, domestic and foreign of
PSBs. Ved Pal and Malik (2007) examined that the difference
in financial characteristics of public, private and foreign sector
banks based on factors such as profitability, liquidity, risk and
efficiency. Aggarwal, A.K., Singh, D. and Chaturvedi, N.
(2007-08) analyzed the performance of the banking sector and
considered as a proxy for the economy as a whole, due to banks
wide spectrum of exposures.
III. OBJECTIVES OF THE STUDY
The main objectives of study are as follow:
1 .To knows about selected Indian banks and their profitability
position.
2. To examine the financial position of selected banks.
IV. RESEARCH METHODOLOGY
A. Research design
The present study adopts an analytical and descriptive
research design. The data of the sample banks (for a period
of Five years from 2009-2013) has been collected by using
a software Prowess software. The sample size of selected
Indian banks has been selected for the purpose of the study
on the basis of market capitalization. They are:
1. State Bank of India (SBI)
2. Bank of Baroda
3. Punjab National Bank
4. Bank of India
5. Canara Bank
B. Sample design
1) Sampling Technique: The study is done with special
reference to top 5 Indian banks.
2) Sample Size: Top five Indian Banks are chosen as
sample size for the study on the Basis of market
capitalization.
C. Sources of data
The relevant secondary data has been collected from“Prowess
Software”&Bank‟s financial reports & Websites.
D. Time period of study
The study has been conducted during March 2009 to
March.2014.
E. Tools used for analysis
1) Ratio analysis:Profitability Ratios have been calculated
for the past five years for the purpose of analysis.
Ratios being designed are named as:
Return on Total Shareholder‟s Fund(RONW)
Return on Capital Employed
Return on Assets
Earnings Per Share (EPS)
Dividend Per Share (DPS)
Capital adequacy Ratio
International Journal of Research in Management, Science & Technology (E-ISSN: 2321-3264)
Vol. 2, No. 3, December 2014 Available at www.ijrmst.org
2321-3264/Copyright©2014, IJRMST, December 2014
83
Dividend Payout Ratio
2) Mean
3) Standard deviation
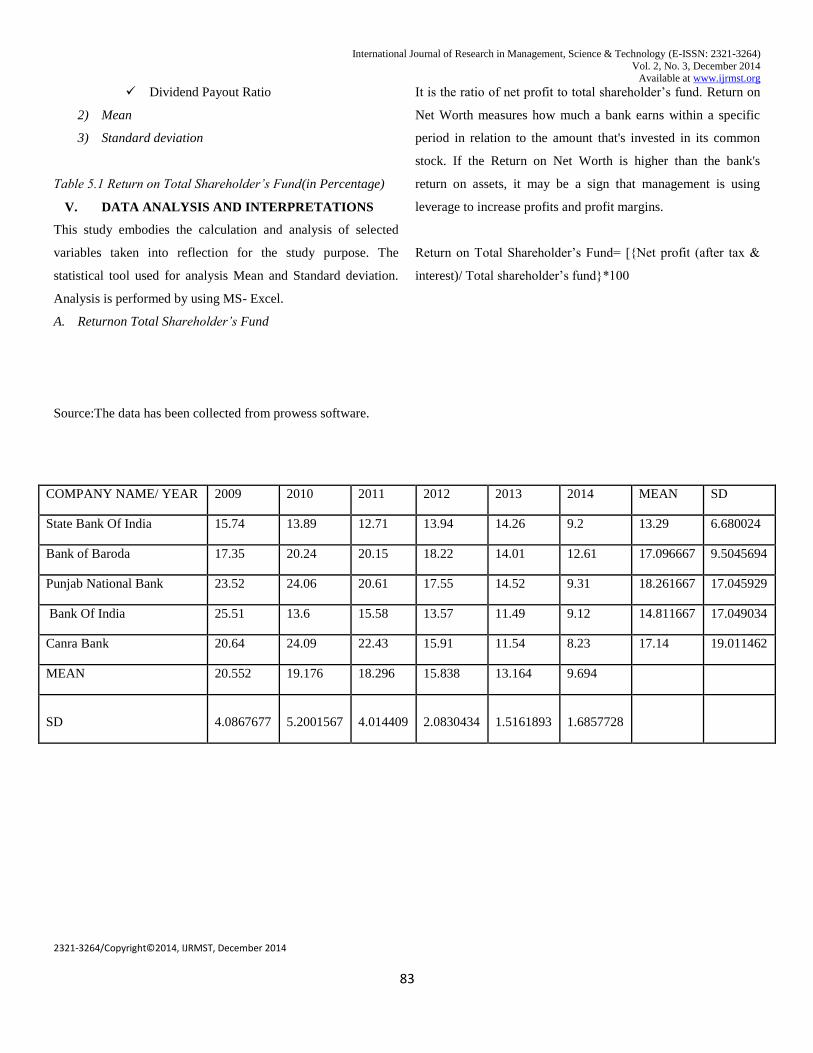
Table 5.1 Return on Total Shareholder’s Fund(in Percentage)
V. DATA ANALYSIS AND INTERPRETATIONS
This study embodies the calculation and analysis of selected
variables taken into reflection for the study purpose. The
statistical tool used for analysis Mean and Standard deviation.
Analysis is performed by using MS- Excel.
A. Returnon Total Shareholder’s Fund
It is the ratio of net profit to total shareholder‟s fund. Return on
Net Worth measures how much a bank earns within a specific
period in relation to the amount that's invested in its common
stock. If the Return on Net Worth is higher than the bank's
return on assets, it may be a sign that management is using
leverage to increase profits and profit margins.
Return on Total Shareholder‟s Fund= [{Net profit (after tax &
interest)/ Total shareholder‟s fund}*100
Source:The data has been collected from prowess software.
COMPANY NAME/ YEAR 2009 2010 2011 2012 2013 2014 MEAN SD
State Bank Of India 15.74 13.89 12.71 13.94 14.26 9.2 13.29 6.680024
Bank of Baroda 17.35 20.24 20.15 18.22 14.01 12.61 17.096667 9.5045694
Punjab National Bank 23.52 24.06 20.61 17.55 14.52 9.31 18.261667 17.045929
Bank Of India 25.51 13.6 15.58 13.57 11.49 9.12 14.811667 17.049034
Canra Bank 20.64 24.09 22.43 15.91 11.54 8.23 17.14 19.011462
MEAN 20.552 19.176 18.296 15.838 13.164 9.694
SD 4.0867677 5.2001567 4.014409 2.0830434 1.5161893 1.6857728
International Journal of Research in Management, Science & Technology (E-ISSN: 2321-3264)
Vol. 2, No. 3, December 2014 Available at www.ijrmst.org
2321-3264/Copyright©2014, IJRMST, December 2014
84
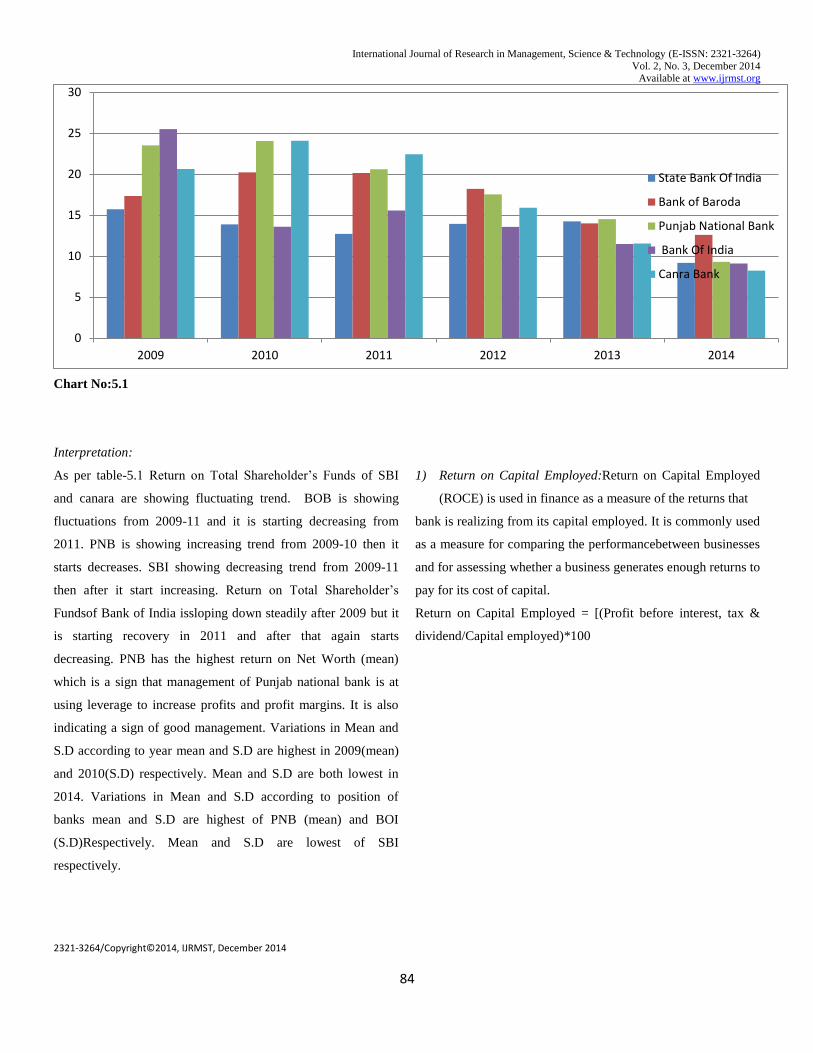
Chart No:5.1
Interpretation:
As per table-5.1 Return on Total Shareholder‟s Funds of SBI
and canara are showing fluctuating trend. BOB is showing
fluctuations from 2009-11 and it is starting decreasing from
2011. PNB is showing increasing trend from 2009-10 then it
starts decreases. SBI showing decreasing trend from 2009-11
then after it start increasing. Return on Total Shareholder‟s
Fundsof Bank of India issloping down steadily after 2009 but it
is starting recovery in 2011 and after that again starts
decreasing. PNB has the highest return on Net Worth (mean)
which is a sign that management of Punjab national bank is at
using leverage to increase profits and profit margins. It is also
indicating a sign of good management. Variations in Mean and
S.D according to year mean and S.D are highest in 2009(mean)
and 2010(S.D) respectively. Mean and S.D are both lowest in
2014. Variations in Mean and S.D according to position of
banks mean and S.D are highest of PNB (mean) and BOI
(S.D)Respectively. Mean and S.D are lowest of SBI
respectively.
1) Return on Capital Employed:Return on Capital Employed
(ROCE) is used in finance as a measure of the returns that
bank is realizing from its capital employed. It is commonly used
as a measure for comparing the performancebetween businesses
and for assessing whether a business generates enough returns to
pay for its cost of capital.
Return on Capital Employed = [(Profit before interest, tax &
dividend/Capital employed)*100
0
5
10
15
20
25
30
2009 2010 2011 2012 2013 2014
State Bank Of India
Bank of Baroda
Punjab National Bank
Bank Of India
Canra Bank
International Journal of Research in Management, Science & Technology (E-ISSN: 2321-3264)
Vol. 2, No. 3, December 2014 Available at www.ijrmst.org
2321-3264/Copyright©2014, IJRMST, December 2014
85
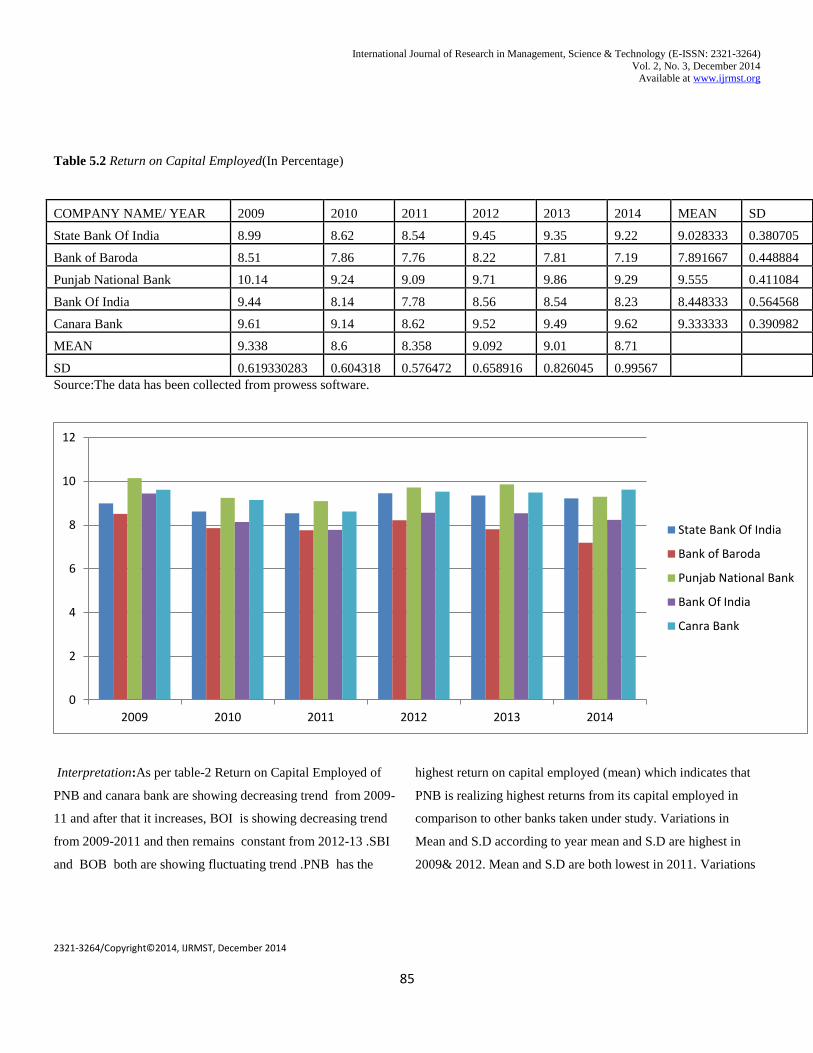
Table 5.2 Return on Capital Employed(In Percentage)
COMPANY NAME/ YEAR 2009 2010 2011 2012 2013 2014 MEAN SD
State Bank Of India 8.99 8.62 8.54 9.45 9.35 9.22 9.028333 0.380705
Bank of Baroda 8.51 7.86 7.76 8.22 7.81 7.19 7.891667 0.448884
Punjab National Bank 10.14 9.24 9.09 9.71 9.86 9.29 9.555 0.411084
Bank Of India 9.44 8.14 7.78 8.56 8.54 8.23 8.448333 0.564568
Canara Bank 9.61 9.14 8.62 9.52 9.49 9.62 9.333333 0.390982
MEAN 9.338 8.6 8.358 9.092 9.01 8.71
SD 0.619330283 0.604318 0.576472 0.658916 0.826045 0.99567
Source:The data has been collected from prowess software.
Interpretation:As per table-2 Return on Capital Employed of
PNB and canara bank are showing decreasing trend from 2009-
11 and after that it increases, BOI is showing decreasing trend
from 2009-2011 and then remains constant from 2012-13 .SBI
and BOB both are showing fluctuating trend .PNB has the
highest return on capital employed (mean) which indicates that
PNB is realizing highest returns from its capital employed in
comparison to other banks taken under study. Variations in
Mean and S.D according to year mean and S.D are highest in
2009& 2012. Mean and S.D are both lowest in 2011. Variations
0
2
4
6
8
10
12
2009 2010 2011 2012 2013 2014
State Bank Of India
Bank of Baroda
Punjab National Bank
Bank Of India
Canra Bank
International Journal of Research in Management, Science & Technology (E-ISSN: 2321-3264)
Vol. 2, No. 3, December 2014 Available at www.ijrmst.org
2321-3264/Copyright©2014, IJRMST, December 2014
86
in Mean and S.D according to position of banks mean and S.D
are highest of PNB (mean) & BOI (S.D) respectively. Mean and
S.D are both lowest of BOB.
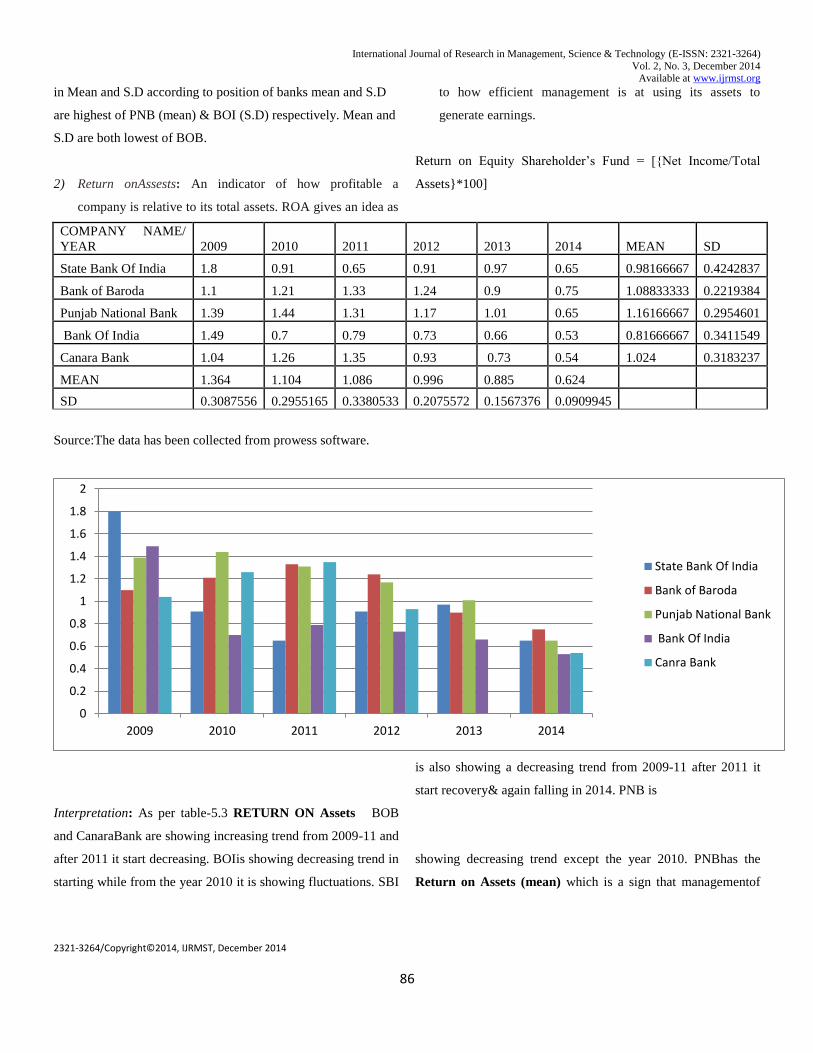
2) Return onAssests: An indicator of how profitable a
company is relative to its total assets. ROA gives an idea as
to how efficient management is at using its assets to
generate earnings.
Return on Equity Shareholder‟s Fund = [{Net Income/Total
Assets}*100]
COMPANY NAME/
YEAR 2009 2010 2011 2012 2013 2014 MEAN SD
State Bank Of India 1.8 0.91 0.65 0.91 0.97 0.65 0.98166667 0.4242837
Bank of Baroda 1.1 1.21 1.33 1.24 0.9 0.75 1.08833333 0.2219384
Punjab National Bank 1.39 1.44 1.31 1.17 1.01 0.65 1.16166667 0.2954601
Bank Of India 1.49 0.7 0.79 0.73 0.66 0.53 0.81666667 0.3411549
Canara Bank 1.04 1.26 1.35 0.93 0.73 0.54 1.024 0.3183237
MEAN 1.364 1.104 1.086 0.996 0.885 0.624
SD 0.3087556 0.2955165 0.3380533 0.2075572 0.1567376 0.0909945
Source:The data has been collected from prowess software.
Interpretation: As per table-5.3 RETURN ON Assets BOB
and CanaraBank are showing increasing trend from 2009-11 and
after 2011 it start decreasing. BOIis showing decreasing trend in
starting while from the year 2010 it is showing fluctuations. SBI
is also showing a decreasing trend from 2009-11 after 2011 it
start recovery& again falling in 2014. PNB is
showing decreasing trend except the year 2010. PNBhas the
Return on Assets (mean) which is a sign that managementof
0
0.2
0.4
0.6
0.8
1
1.2
1.4
1.6
1.8
2
2009 2010 2011 2012 2013 2014
State Bank Of India
Bank of Baroda
Punjab National Bank
Bank Of India
Canra Bank
International Journal of Research in Management, Science & Technology (E-ISSN: 2321-3264)
Vol. 2, No. 3, December 2014 Available at www.ijrmst.org
2321-3264/Copyright©2014, IJRMST, December 2014
87
PNB is using Assets fund more efficiently to increase earning
capacity in comparison to other banks. Variations in Mean and
S.D according to year mean and S.D are highest in 2009 and
2011 respectively. Mean and S.D are lowest in 2014
respectively. Variations in Mean and S.D according to position
ofbanks mean and S.D are highest of PNBand SBI respectively.
Mean and S.D are lowest of Bank of India and BOB
respectively.
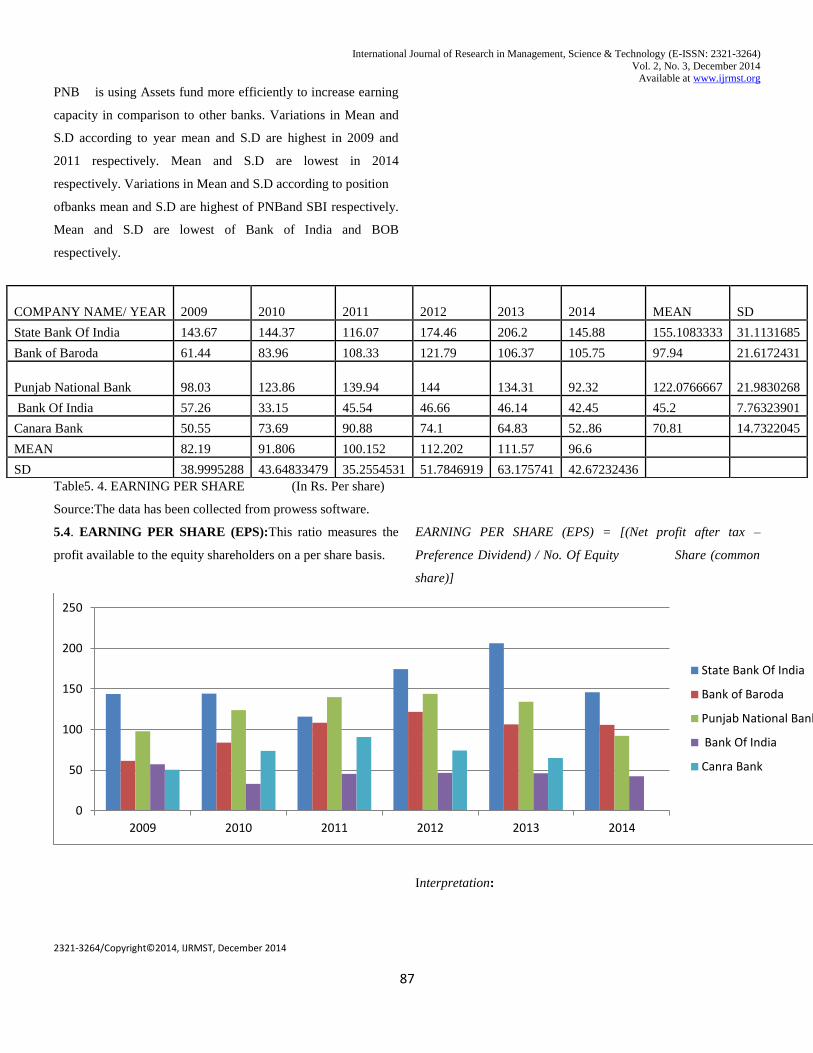
Table5. 4. EARNING PER SHARE (In Rs. Per share)
Source:The data has been collected from prowess software.
5.4. EARNING PER SHARE (EPS):This ratio measures the
profit available to the equity shareholders on a per share basis.
EARNING PER SHARE (EPS) = [(Net profit after tax –
Preference Dividend) / No. Of Equity Share (common
share)]
Interpretation:
0
50
100
150
200
250
2009 2010 2011 2012 2013 2014
State Bank Of India
Bank of Baroda
Punjab National Bank
Bank Of India
Canra Bank
COMPANY NAME/ YEAR 2009 2010 2011 2012 2013 2014 MEAN SD
State Bank Of India 143.67 144.37 116.07 174.46 206.2 145.88 155.1083333 31.1131685
Bank of Baroda 61.44 83.96 108.33 121.79 106.37 105.75 97.94 21.6172431
Punjab National Bank 98.03 123.86 139.94 144 134.31 92.32 122.0766667 21.9830268
Bank Of India 57.26 33.15 45.54 46.66 46.14 42.45 45.2 7.76323901
Canara Bank 50.55 73.69 90.88 74.1 64.83 52..86 70.81 14.7322045
MEAN 82.19 91.806 100.152 112.202 111.57 96.6
SD 38.9995288 43.64833479 35.2554531 51.7846919 63.175741 42.67232436
International Journal of Research in Management, Science & Technology (E-ISSN: 2321-3264)
Vol. 2, No. 3, December 2014 Available at www.ijrmst.org
2321-3264/Copyright©2014, IJRMST, December 2014
88
As per table-5.4 Earning Per Shareof BOB and PNB is showing
increasing trend from 2009 but suddenly decrease in 2013. SBI
is showing increasing trend of Earning per share in all years
expect the financial year 2011& 2014. BOI is showing
decreasing trend of Earning per share in the year 2010 after that
it is showing the flat trend or almost same the year 2010 to
2014. SBI has the highest Earning per share (mean) which
means that SBI has the highest EPS which means that it has
highest profits available to equity shareholders on per share
basis in comparison to other banks. Variations in Mean and S.D
according to year mean and S.D are highest in 2012 and
2014respectively. Mean and S.D are lowest in 2009 and 2011
respectively. Variations in Mean and S.D according to position
of banks mean and S.D are highest of SBI and PNB respectively
but BOB has the highest S.D after that state bank of India.
Mean and S.D are lowest of Bank of India respectively.
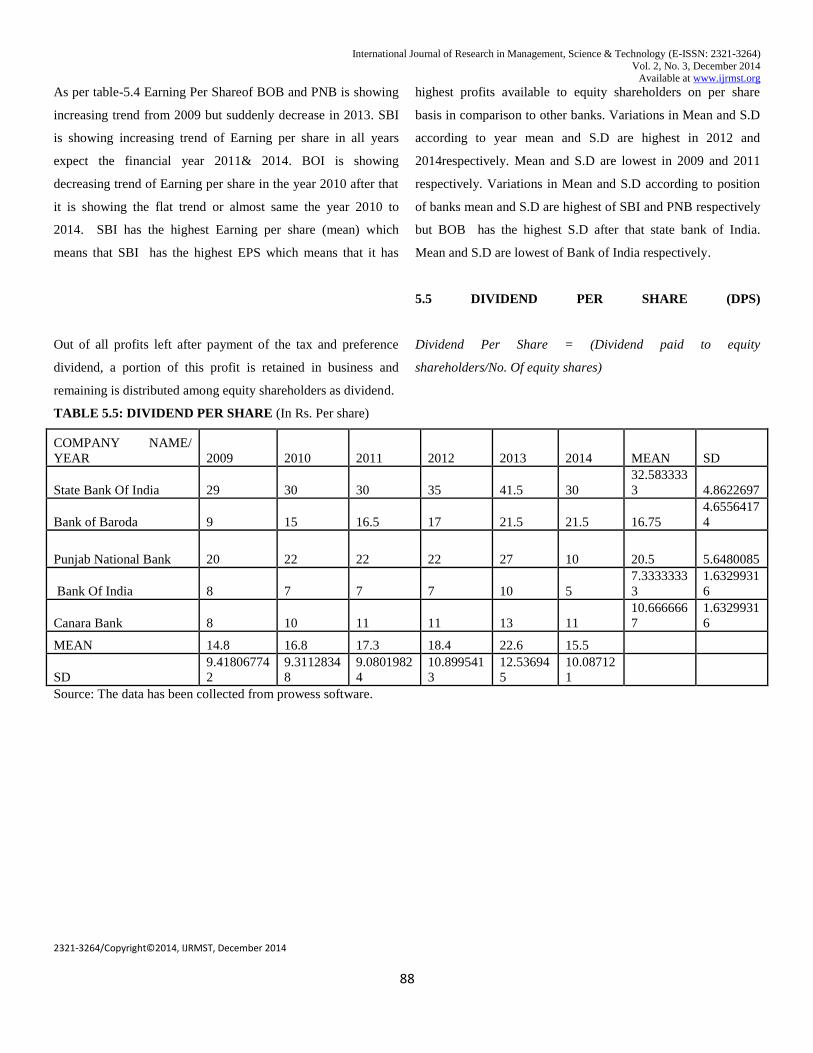
5.5 DIVIDEND PER SHARE (DPS)
Out of all profits left after payment of the tax and preference
dividend, a portion of this profit is retained in business and
remaining is distributed among equity shareholders as dividend.
Dividend Per Share = (Dividend paid to equity
shareholders/No. Of equity shares)
TABLE 5.5: DIVIDEND PER SHARE (In Rs. Per share)
COMPANY NAME/
YEAR 2009 2010 2011 2012 2013 2014 MEAN SD
State Bank Of India 29 30 30 35 41.5 30
32.583333
3 4.8622697
Bank of Baroda 9 15 16.5 17 21.5 21.5 16.75
4.6556417
4
Punjab National Bank 20 22 22 22 27 10 20.5 5.6480085
Bank Of India 8 7 7 7 10 5
7.3333333
3
1.6329931
6
Canara Bank 8 10 11 11 13 11
10.666666
7
1.6329931
6
MEAN 14.8 16.8 17.3 18.4 22.6 15.5
SD
9.41806774
2
9.3112834
8
9.0801982
4
10.899541
3
12.53694
5
10.08712
1
Source: The data has been collected from prowess software.
International Journal of Research in Management, Science & Technology (E-ISSN: 2321-3264)
Vol. 2, No. 3, December 2014 Available at www.ijrmst.org
2321-3264/Copyright©2014, IJRMST, December 2014
89
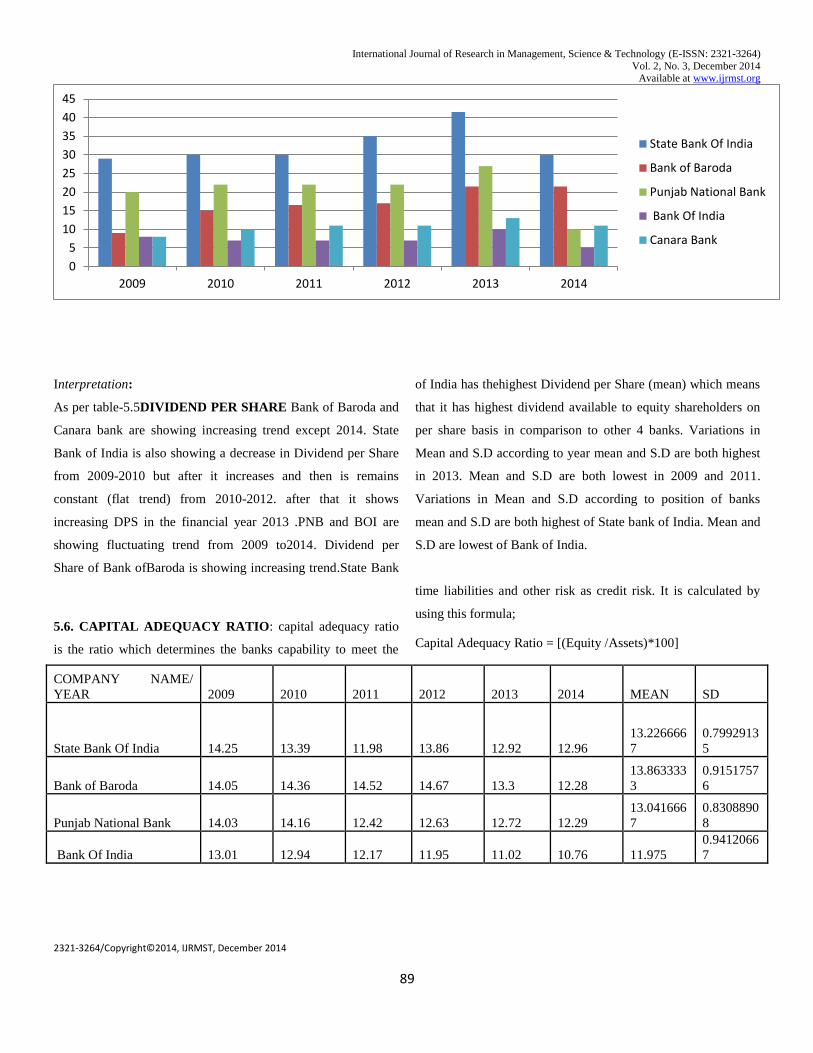
Interpretation:
As per table-5.5DIVIDEND PER SHARE Bank of Baroda and
Canara bank are showing increasing trend except 2014. State
Bank of India is also showing a decrease in Dividend per Share
from 2009-2010 but after it increases and then is remains
constant (flat trend) from 2010-2012. after that it shows
increasing DPS in the financial year 2013 .PNB and BOI are
showing fluctuating trend from 2009 to2014. Dividend per
Share of Bank ofBaroda is showing increasing trend.State Bank
of India has thehighest Dividend per Share (mean) which means
that it has highest dividend available to equity shareholders on
per share basis in comparison to other 4 banks. Variations in
Mean and S.D according to year mean and S.D are both highest
in 2013. Mean and S.D are both lowest in 2009 and 2011.
Variations in Mean and S.D according to position of banks
mean and S.D are both highest of State bank of India. Mean and
S.D are lowest of Bank of India.
5.6. CAPITAL ADEQUACY RATIO: capital adequacy ratio
is the ratio which determines the banks capability to meet the
time liabilities and other risk as credit risk. It is calculated by
using this formula;
Capital Adequacy Ratio = [(Equity /Assets)*100]
COMPANY NAME/
YEAR 2009 2010 2011 2012 2013 2014 MEAN SD
State Bank Of India 14.25 13.39 11.98 13.86 12.92 12.96
13.226666
7
0.7992913
5
Bank of Baroda 14.05 14.36 14.52 14.67 13.3 12.28
13.863333
3
0.9151757
6
Punjab National Bank 14.03 14.16 12.42 12.63 12.72 12.29
13.041666
7
0.8308890
8
Bank Of India 13.01 12.94 12.17 11.95 11.02 10.76 11.975
0.9412066
7
0
5
10
15
20
25
30
35
40
45
2009 2010 2011 2012 2013 2014
State Bank Of India
Bank of Baroda
Punjab National Bank
Bank Of India
Canara Bank
International Journal of Research in Management, Science & Technology (E-ISSN: 2321-3264)
Vol. 2, No. 3, December 2014 Available at www.ijrmst.org
2321-3264/Copyright©2014, IJRMST, December 2014
90
Canara Bank 14.1 13.43 15.38 13.76 12.4 11.14
13.368333
3
1.4589368
3
MEAN 13.888 13.656 13.294 13.374 12.472 11.886
SD
0.4983171
7
0.5882431
5
1.549864
5
1.0777430
1
0.874825
7
0.9077885
2
Source:The data has been collected from prowess software.
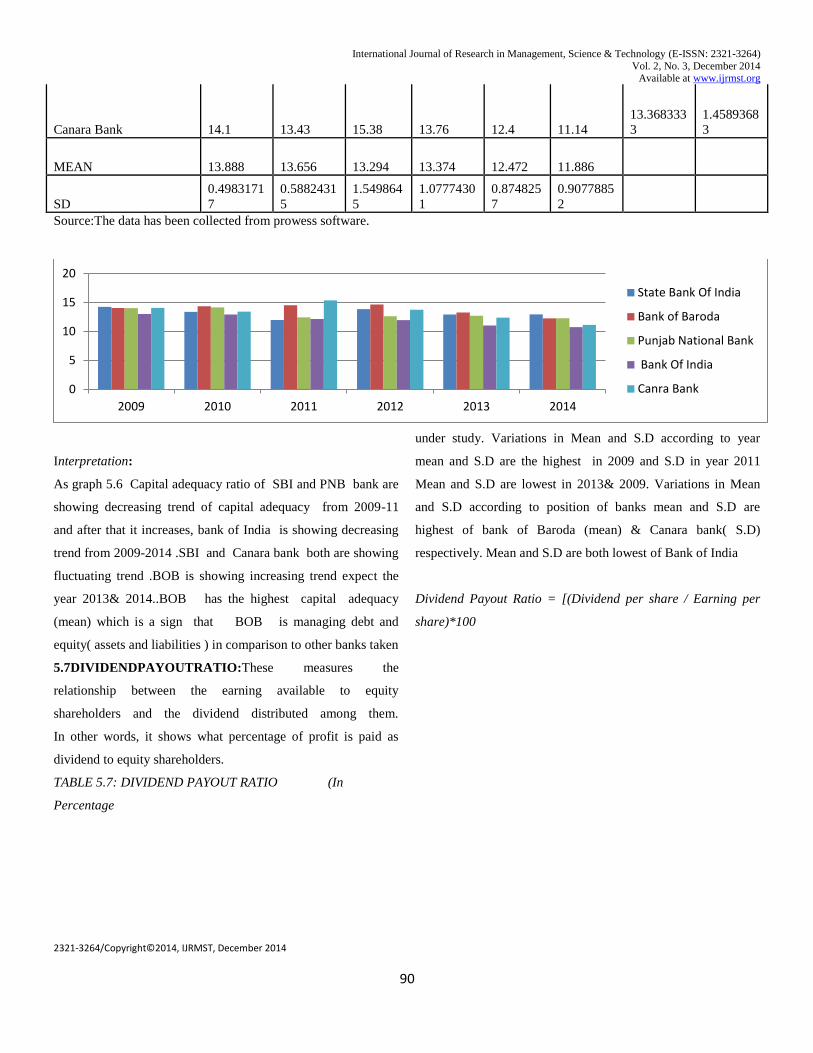
Interpretation:
As graph 5.6 Capital adequacy ratio of SBI and PNB bank are
showing decreasing trend of capital adequacy from 2009-11
and after that it increases, bank of India is showing decreasing
trend from 2009-2014 .SBI and Canara bank both are showing
fluctuating trend .BOB is showing increasing trend expect the
year 2013& 2014..BOB has the highest capital adequacy
(mean) which is a sign that BOB is managing debt and
equity( assets and liabilities ) in comparison to other banks taken
under study. Variations in Mean and S.D according to year
mean and S.D are the highest in 2009 and S.D in year 2011
Mean and S.D are lowest in 2013& 2009. Variations in Mean
and S.D according to position of banks mean and S.D are
highest of bank of Baroda (mean) & Canara bank( S.D)
respectively. Mean and S.D are both lowest of Bank of India
Dividend Payout Ratio = [(Dividend per share / Earning per
share)*100
5.7DIVIDENDPAYOUTRATIO:These measures the
relationship between the earning available to equity
shareholders and the dividend distributed among them.
In other words, it shows what percentage of profit is paid as
dividend to equity shareholders.
TABLE 5.7: DIVIDEND PAYOUT RATIO (In
Percentage
0
5
10
15
20
2009 2010 2011 2012 2013 2014
State Bank Of India
Bank of Baroda
Punjab National Bank
Bank Of India
Canra Bank
International Journal of Research in Management, Science & Technology (E-ISSN: 2321-3264)
Vol. 2, No. 3, December 2014 Available at www.ijrmst.org
2321-3264/Copyright©2014, IJRMST, December 2014
91
Source: The data has been collected from prowess software.
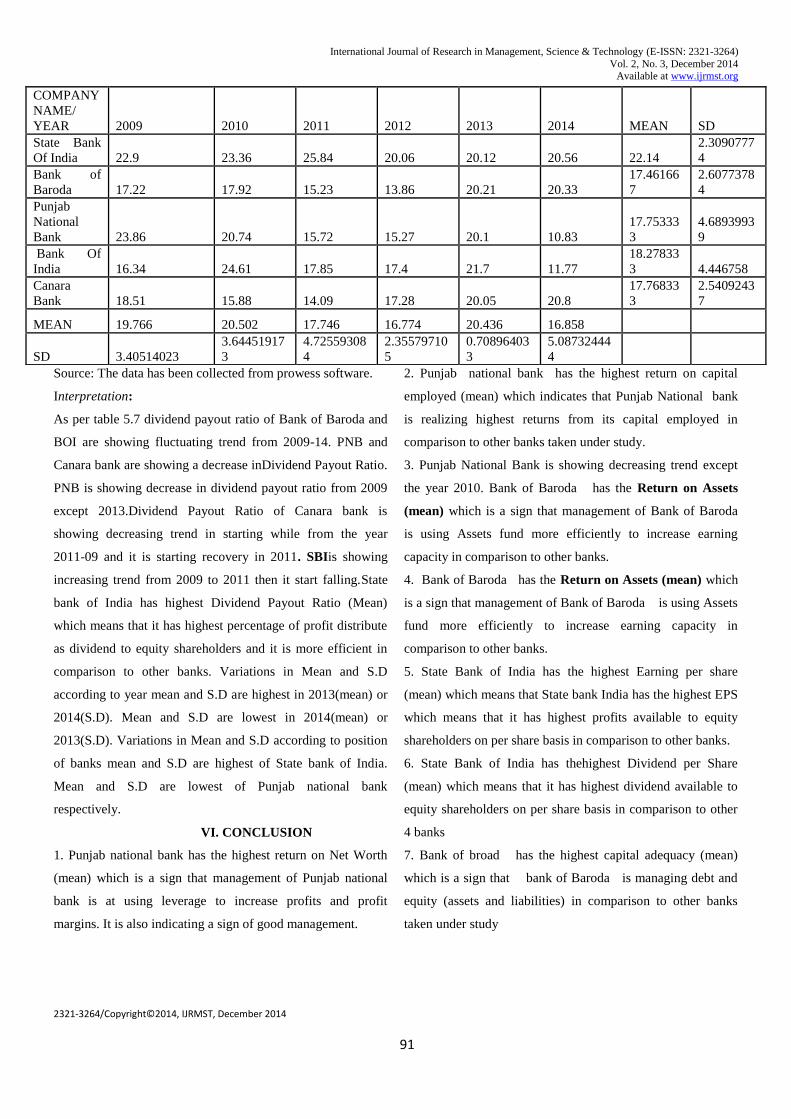
Interpretation:
As per table 5.7 dividend payout ratio of Bank of Baroda and
BOI are showing fluctuating trend from 2009-14. PNB and
Canara bank are showing a decrease inDividend Payout Ratio.
PNB is showing decrease in dividend payout ratio from 2009
except 2013.Dividend Payout Ratio of Canara bank is
showing decreasing trend in starting while from the year
2011-09 and it is starting recovery in 2011. SBIis showing
increasing trend from 2009 to 2011 then it start falling.State
bank of India has highest Dividend Payout Ratio (Mean)
which means that it has highest percentage of profit distribute
as dividend to equity shareholders and it is more efficient in
comparison to other banks. Variations in Mean and S.D
according to year mean and S.D are highest in 2013(mean) or
2014(S.D). Mean and S.D are lowest in 2014(mean) or
2013(S.D). Variations in Mean and S.D according to position
of banks mean and S.D are highest of State bank of India.
Mean and S.D are lowest of Punjab national bank
respectively.
VI. CONCLUSION
1. Punjab national bank has the highest return on Net Worth
(mean) which is a sign that management of Punjab national
bank is at using leverage to increase profits and profit
margins. It is also indicating a sign of good management.
2. Punjab national bank has the highest return on capital
employed (mean) which indicates that Punjab National bank
is realizing highest returns from its capital employed in
comparison to other banks taken under study.
3. Punjab National Bank is showing decreasing trend except
the year 2010. Bank of Baroda has the Return on Assets
(mean) which is a sign that management of Bank of Baroda
is using Assets fund more efficiently to increase earning
capacity in comparison to other banks.
4. Bank of Baroda has the Return on Assets (mean) which
is a sign that management of Bank of Baroda is using Assets
fund more efficiently to increase earning capacity in
comparison to other banks.
5. State Bank of India has the highest Earning per share
(mean) which means that State bank India has the highest EPS
which means that it has highest profits available to equity
shareholders on per share basis in comparison to other banks.
6. State Bank of India has thehighest Dividend per Share
(mean) which means that it has highest dividend available to
equity shareholders on per share basis in comparison to other
4 banks
7. Bank of broad has the highest capital adequacy (mean)
which is a sign that bank of Baroda is managing debt and
equity (assets and liabilities) in comparison to other banks
taken under study
COMPANY
NAME/
YEAR 2009 2010 2011 2012 2013 2014 MEAN SD
State Bank
Of India 22.9 23.36 25.84 20.06 20.12 20.56 22.14
2.3090777
4
Bank of
Baroda 17.22 17.92 15.23 13.86 20.21 20.33
17.46166
7
2.6077378
4
Punjab
National
Bank 23.86 20.74 15.72 15.27 20.1 10.83
17.75333
3
4.6893993
9
Bank Of
India 16.34 24.61 17.85 17.4 21.7 11.77
18.27833
3 4.446758
Canara
Bank 18.51 15.88 14.09 17.28 20.05 20.8
17.76833
3
2.5409243
7
MEAN 19.766 20.502 17.746 16.774 20.436 16.858
SD 3.40514023
3.64451917
3
4.72559308
4
2.35579710
5
0.70896403
3
5.08732444
4
International Journal of Research in Management, Science & Technology (E-ISSN: 2321-3264)
Vol. 2, No. 3, December 2014 Available at www.ijrmst.org
2321-3264/Copyright©2014, IJRMST, December 2014
92
8. State bank of India has highest Dividend Payout Ratio
(Mean) which means that it has highest percentage of profit
distribute as dividend to equity shareholders and it is more
efficient in comparison to other banks.
REFERENCES
1. A.K. Aggarwal, Singh, D. and N. Chaturvedi, “India‟s
Banking Sector –Consolidation and Convergence: Balancing
on the Brink?‟ Punjab Journal of Business Studies, 3(2), Oct.-
March, 39-46, 2007-2008
2. T.K Chakrabarthy, „Profitability of Banks: An empirical
attempt for identification of variable of income and
expenditure of scheduled commercial banks for Profit
Planning,' Proceedings of the Bank Economists Conference
3.17-3.61, 1986.
3. Amandeep. 1991, Profit and Profitability of Indian
Nationalized Banks, Ph.D. Thesis, Punjab University,
Chandigarh.
3. John A. Goddard and John O.S Wilson, “The Profitability
of European Banks: A Cross-Sectional and Dynamic Panel
Analysis” 32(3) 363-381, 2004
4. Kumar and Sreeramulu, Employees productivity and cost-
A Comparative Study of Banks in India During 1997 to 2008.
5. Pal Ved& N.S. Malik .A Multivariate Analysis of the
financial characteristics of Commercial Banks in India. The
Icfai Journal of Bank Management .VI (3).2007
6. Ram PratapSinha, "Business Efficiency of Public Sector
Commercial Banks: A Data Envelopment Approach," The
IUP Journal of Applied Economics, 0(1), 7-27, 2008
7. S.J. Sampath, “Monitoring the Variables Determining the
Profitability of Banks,” Bankingfor better Profitability, 3(2)
691-699, 1990
8. R.K. Uppal, “Indian Banking – Prime Determinants of
Profitability, Emerging Issues and Future Outlook,” GITAM
Journal of Management, 7(2) 78-106, 2000.