a study on exchange rate volatility and its macro economic determinants in india
TRANSCRIPT

79
A Study on Exchange Rate Volatility and its Macro Economic Determinants in India
Swati Thakur and Rakesh Kumar Srivastava1
Economics, Planning & Development, Gautam Buddha University, Greater Noida, UP1 School of Management, Gautam Buddha University,
Greater Noida, UPE-mail: [email protected],
AbstractPurpose: The present paper aims to identify macro-economic determinants that affect the exchange rate of INR-US $ and linearity in their correlation during 2005-2015. The study also examined the factors causing fluctuations of INR against the US$ in the same time period.
Design / Methodology / Approach: The nature of research is empirical & analytical that tests hypothesis by analyzing a data-set and used linear correlation Analysis between the exchange rate INR/USD and the chosen macro-economic determinants. The study undertakes mainly five independent determinants that influence the exchange rate in India: Inflation (CPI), Lending interest rate, External debt (in current US$), GDP (in current US$) and FDI (in current US$).
Findings: It is observed that exchange rate is highly correlated with the selected independent variables taken up for this study, except with the Inflation (r = –0.003). There is huge positive correlation between the Exchange rate of INR/USD and external debt (r = 0.904). A negative correlation exists between exchange rate and lending interest rate (r = –0.432). The
ISSN 2348-2869 Print
© 2016 Symbiosis Centre for Management Studies, NoIDa
Journal of General Management Research, Vol. 3, Issue 2, July 2016, pp. 79–96
Journal of General ManaGeMent research

80 Journal of General Management Research
correlation between the exchange rate and GDP is also high at (r = 0.809). And, a mild positive correlation exists between exchange rate and FDI (r = 0.293).
Research Implications: A strong correlation between the dependent variable exchange rate & independent macroeconomic variables suggests improving Export to GDP ratio along with promoting foreign capital especially FDI to improve the INR/US $ exchange rate.
Originality/Value: Volatility in exchange rates causing the instability in international trade & business, and analyzing those macroeconomic factors that affect volatility in exchange rate have both theoretical & practical significance.
Keywords: US$/INR Exchange Rate, INR & US$, Macro-economic Factors.
INTRODUCTION
Over the years, the forex market has emerged as the largest market in the
world and tremendously increasing because of growing cross border economic activities, trade and investments. Emerging market currencies are of volatile nature due to the small share in global trade and relatively weaker macroeconomic conditions like high inflation, current account deficit and low growth rate. Exchange rate volatility is a serious cause of concern for all financial market participants and makes the central bankers’ job difficult to formulate effective monetary policies, as forex volatility is always an issue. India, being the fastest growing economy in the world, it is pertinent to understand volatility in INR–US$ and influencing factors. The INR is considered by most traders, investment bankers, news agencies and financial market reporters to be highly volatile vis-à-vis the US$. This study
examines whether this observation is true and what are the macroeconomic determinants that exert influence on the volatility of Indian exchange rate against US$.
1.1 Research Problem Statement
Globalization has caused the development of global financial market and inter-linkages of financial services worldwide, and so the dynamics of exchange rates between currencies has changed. Volatility is an important aspect of risks in the present economic scenario, as volatile exchange rates are the main cause of the instability in the international economy. To identify, volatility in INR-US$ and analyzing the major macroeconomic variables that effect exchange rate volatility and finding the correlation that exists among the variables and exchange rate is an important theoretical task, that have great practical significance.
Research Questions
(i) Has the nominal exchange rate of INR against US $ been highly volatile?
(ii) Has INR depreciated or appreciated against US $ from 2005 to 2015?
(iii) Is there any linear correlation between the nominal exchange rate and the respective macroeconomic factors?
Rationale and Scope of the Study
There have been various probable reasons associated with the fluctuating INR over the years. In this study, an attempt has been made to understand exchange rate volatility of INR per US$ and to analyze the macroeconomic factors that affect exchange rate volatility of INR against US $. The reason behind taking US $ as the currency of foreign exchange, because US$ is the international currency and the ability to retain its value makes it attractive to investors. India’s forex reserve

81 A Study on Exchange Rate Volatility and its Macro Economic Determinants in India
hold majorly US$ because it is perceived as the strongest and most reliable currency in world trade. The study seeks to assess the correlation between exchange rate of INR-US $ and inflation, lending rate, GDP, FDI and external debt for a period of 2005-2015.
The price of one currency in terms of another currency (exchange rate) is a very important variable for an open economy in the global market, because it affects the overall economic performance and growth of the economy. So, the correlation between exchange rate and the macro-economic factors causing variability in the value of the former carries a high degree of significance for any open economy.
Objectives of the Study
The study aims to achieve the following objectives:
• ToexplorethevolatilenatureofINRandits exchange rate volatility against US $ from 2005 to 2015.
• To analyze the correlation betweennominal exchange rate of INR-US $ and various macroeconomic indicators like inflation, lending rate, external debt, GDP, FDI.
• TostudythechallengesfacedbyRBIandthe Government due to volatility in forex and propose fruitful suggestions for the same.
REVIEW OF LITERATUREEngel. M, Charles (1986) in the study ‘On the Correlation of Exchange Rates and Interest Rates’, Journal of International Money and Finance (1986), 5, 125-128 observed that a negative correlation between the price of foreign currency and nominal interest rates is not necessarily an indication of movements in the real rate of interest. Such a correlation
could be consistent with a monetarist model in which the real rate is constant. He presented a simple monetarist model based on Mussa, 1976, in which the exchange rate and nominal interest rates are negatively correlated. The monetarist models presented in the note are wholly consistent with the observation that a strong negative correlation between the exchange rate and interest rates began to emerge late in 1979, after the Fed began targeting money.
Mirchandani Anita (2013) in her study ‘Analysis of Macroeconomic determinants of exchange rate volatility in India’ published in the Journal of Economics and Finance Issues (Vol. 3, No. 1, 2013) investigated various macroeconomics variables leading to acute variations in exchange rate of a currency, reviewed the probable reason for depreciation of INR against US$ using statistical tool, i.e. correlation analysis and concluded that INR has shown high volatility over the years, mainly due to uncertainty in domestic economy causing capital outflows resulted in depreciation.
Kaur & Sirohi (2013) studied the after-effects of rupee depreciation, i.e. change in pattern of spending and savings of people who are getting affected by rupee depreciation; like people having to pay more for their foreign education, costlier imports and slow consumption, upturn in unemployment rate because of reduction in earnings of companies, costlier foreign travel, high inflation because of currency depreciation, etc.
Satyananda Sahoo, RBI (2012) in his research work, ‘Volatility Transmission in the Exchange Rate of the Indian Rupee’, analyzed that volatility spillovers from the exchange ratesoftheBrazilianReal,theRussianRuble,the South Korean Won, the Singapore Dollar,

82 Journal of General Management Research
theJapaneseYen,theSwissFranc,theBritishPound Sterling and the Euro to the exchange rate of the Indian Rupee during 2005-11. The findings supported the view that volatilities observed in the exchange rate of the leading currencies, inter alia, cause volatility in the daily exchange rate of the Indian Rupee.
Prof. Chanan Pal Chawla (2011), ‘Understanding the Impact of Exchange Rate Fluctuation on the Competitiveness of Business’, described that with the increasedlevel of globalization of economies of all the countries, the markets for all the goods and services have become hyper competitive. The relationship between the values of local currencies in terms of foreign currencies and export competitiveness of any country has become very complex.
Kim and Singal (2000) in an empirical study ‘The Fear of Globalizing Capital Markets’, Emerging Markets Review, found no evidence of an increase in inflation or an appreciation of exchange rates. They found no evidence of increase in stock market, inflation and exchange rate volatility after liberalization of capital flows.
Gordon and Gupta (2003) in his study ‘Portfolio Flows into India: Do Domestic Fundamentals Matter?’ indicated that portfolio flows in India are determined by both external and domestic factors. Among externalfactors,LIBORandemergingmarketstock returns are important, while the primary domestic determinants are the lagged stock return and changes in credit ratings.
Dua and Sen (2005) study found that the real effective exchange rate is co-integrated with the level of capital flows, volatility of the flows, high-powered money, current account surplus and government expenditure.
RESEARCH METHODOLOGYNature and type of Data: The study is based on the secondary data. The nature of research is Exploratory, Descriptive & Analytical both that generates a hypothesis by analyzing a data-set and looking for correlation between the exchange rate and independent variables, using monthly and annual time series data for the period from 2005 to 2015. The data has been collected from World development indicators, Handbook of Statistics on Indian Economypublishedby theReserveBankofIndia(RBI),DatafromthewebsiteofOECDcountries.
Period of the Study: The study period is of eleven years, starting from the year 2005 to 2015. This time period witnessed many crisis like subprime mortgage crisis, global financial crisis, European sovereign debt crisis that shook the global economy. That is why the study covers a period of eleven years from 2005 to 2015, as it covers the major financial crisis and gives a more clear view of the volatility of exchange rate.
Tools and Techniques of Analysis: The analysis of the data forms the core part of the study. In order to analyze the data and draw conclusions on this study, Excel has been used as the major tool of analysis and the various statistical techniques like linear correlation analysis and descriptive statistics have been used through EXCEL.
Five independent macro-economic variables have been identified for the purpose of the study:• InflationRate(CPI)• InterestRate(LendingRate)• ExternalDebt(incurrentUS$)• GrossDomesticProduct(incurrentUS$)• Foreign Direct Investment (in current
US$)
83 A Study on Exchange Rate Volatility and its Macro Economic Determinants in India
The study aims to find the correlation between the exchange rate of INR (against USD) and each independent variable respectively.
The following tools and techniques of analysis have been used in the study:
• Microsoft Excel – To do data analysisfrom 2005 to 2015
• Correlation Analysis – To find outthe Correlation between the FXR & independent variables.
• Descriptive statistics – To measure theexchange rate volatility in India.
• Graphs, scatter plots – To study thecorrelation.
Hypotheses: Five hypotheses have been created in the study for the third objective i.e. to analyze the correlation between Nominal exchange rate (INR/USD) and independent macroeconomic indicators inflation, lending interest rate, external debt, nominal GDP and FDI from 2005 to 2015 have been considered in study. The null hypotheses are as follows:
• H0:Inflation(CPI)andexchangerateofINR against USD are not correlated.
• H0: Lending interest rate and exchangerate of INR against USD are not correlated.
• H0:ExternalDebtandexchangerateofINR against USD are not correlated.
• H0:NominalGDPandexchangerateofINR against USD are not correlated.
• H0: FDI and exchange rate of INRagainst USD are not correlated.
MACROECONOMIC FACTORS INFLUENCING NOMINAL FOREx RATEThere is no consensus, so far, in the literature on the factors affecting exchange rates and their volatility. Usually they are divided into two
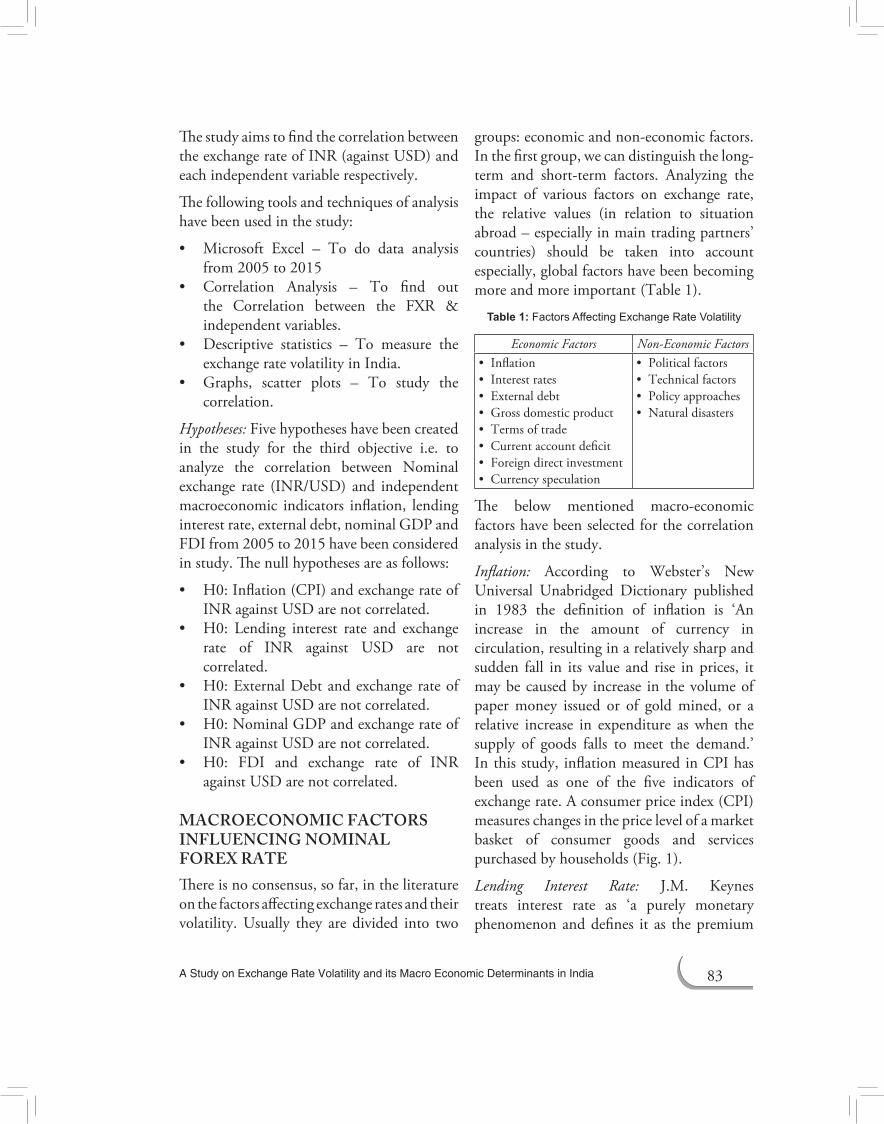
groups: economic and non-economic factors. In the first group, we can distinguish the long-term and short-term factors. Analyzing the impact of various factors on exchange rate, the relative values (in relation to situation abroad – especially in main trading partners’ countries) should be taken into account especially, global factors have been becoming more and more important (Table 1).
table 1: Factors Affecting Exchange Rate Volatility
Economic Factors Non-Economic Factors• Inflation• Interestrates• Externaldebt• Grossdomesticproduct• Termsoftrade• Currentaccountdeficit• Foreigndirectinvestment• Currencyspeculation
• Politicalfactors• Technicalfactors• Policyapproaches• Naturaldisasters
The below mentioned macro-economic factors have been selected for the correlation analysis in the study.
Inflation: According to Webster’s New Universal Unabridged Dictionary published in 1983 the definition of inflation is ‘An increase in the amount of currency in circulation, resulting in a relatively sharp and sudden fall in its value and rise in prices, it may be caused by increase in the volume of paper money issued or of gold mined, or a relative increase in expenditure as when the supply of goods falls to meet the demand.’ In this study, inflation measured in CPI has been used as one of the five indicators of exchange rate. A consumer price index (CPI) measures changes in the price level of a market basket of consumer goods and services purchased by households (Fig. 1).
Lending Interest Rate: J.M. Keynes treats interest rate as ‘a purely monetary phenomenon and defines it as the premium

84 Journal of General Management Research
which has to be offered to induce people to hold their wealth in some forms other than hoarded money.’ Lending rate is the bank rate that usually meets the short- and medium-term financing needs of the private sector. This rate is normally differentiated according to creditworthiness of borrowers and objectives of financing. It is the rate at which financial institutes lend money. It constitutes the base from which banks then lend money to the final customer (Fig. 2).
External Debt: According to the International Monetary Fund, ‘Gross external debt is the amount, at any given time, of disbursed and outstanding contractual liabilities of residents of a country to nonresidents to repay principal, with or without interest, or to pay interest, with or without principal.’ In India external debt is classified into seven heads: Multilateral, Bilateral, IMF loans,Trade credit, Commercial borrowings, Non-resident Indian and person of Indian
figure 2: Lending Interest Rates in India from 2005 to 2015
figure 1: Inflation rates (CPI) in India from 2005 to 2015

85 A Study on Exchange Rate Volatility and its Macro Economic Determinants in India
origin deposits, Rupee debt, and NPR debt (Fig. 3).
Nominal Gross Domestic Product: US International Trade Commission defines GDP (Current US$) as GDP at purchaser’s prices is the sum of gross value added by all resident producers in the economy plus any product taxes and minus any subsidies not included in the value of the products. Nominal GDP is GDP evaluated at current market prices. It’s estimates are commonly
used to determine the economic performance of a whole country or region, and to make international comparisons (Fig. 4).
Foreign Direct Investment: Foreign investment was introduced in India in 1991 under Foreign Exchange Management Act (FEMA). ‘India has emerged as the most favored destination for foreign direct investment (FDI) in 2015 so far, outpacing China and the US’, London-based business daily Financial Times (FT) said in a report (Fig. 5).
figure 3: External Debt (in current US$) in India from 2005 to 2015
figure 4: GDP (in current US$) in India from 2005 to 2015

86 Journal of General Management Research
figure 5: FDI (in current US$) in India from 2005 to 2015
DATA COLLECTION AND INTERPRETATIONTo examine the correlation between nominal exchange rate of rupee with respect to dollar and various macroeconomic indicators like inflation, lending rate, external debt, nominal GDP& FDI, the following Data collection and interpretation has been done below using MS EXCEL (Table 2).• Correlation analysis between macro-
economic variables on exchange rate examined using scatter plots: The results of Correlation analysis studied with the
table 2: Various Macroeconomic Indicators in India (2005-2015)
Year Exchange Rate (against $)
Inflation (CPI)
Interest Rate (Lending rate)
External Debt (Current US$)
GDP (Current US$) FDI (Current US$)
2005 44.1 4.2 10.8 121,195,474,464 834,214,699,568 7,269,407,2262006 45.307 6.1 11.2 159,525,527,066 949,116,769,619 20,029,119,2672007 41.349 6.4 13 204,057,541,701 1,238,699,170,078 25,227,740,8872008 43.505 8.4 13.3 227,111,755,131 1,224,097,069,460 43,406,277,0762009 48.405 10.9 12.2 256,312,241,495 1,365,371,474,049 35,581,372,9302010 45.726 12 8.3 291,650,543,781 1,708,458,876,830 27,396,885,0342011 46.67 8.9 10.2 336,845,285,775 1,835,814,449,585 36,498,654,5982012 53.437 9.3 10.6 395,071,134,091 1,831,781,515,472 23,995,685,0142013 58.598 10.9 10.3 429,742,425,139 1,861,801,615,478 28,153,031,2702014 61.03 6.4 10.3 463,230,464,350 2,048,517,438,874 33,871,408,4682015 64.152 5.88 10 483,200,000,000 2,185,200,000,000 37,430,000,000
Source:WorldBankIndicators,OECD&IMFwebsite,RBIBulletin.
help of Correlation analysis using EXCEL have been examined below using the scatterplots.
Table 3 shows the Correlation results of the Data analysis of various macroeconomic indicators with nominal exchange rate. Here, the dependent variable, i.e. variable Y is the nominal exchange rate and the independent or explanatory variables ‘X’ are Inflation rate, lending rate, external debt, nominal GDP, FDI. So, the correlation analysis shows the linear correlation between the dependent variable Y and independent variable X.
87 A Study on Exchange Rate Volatility and its Macro Economic Determinants in India
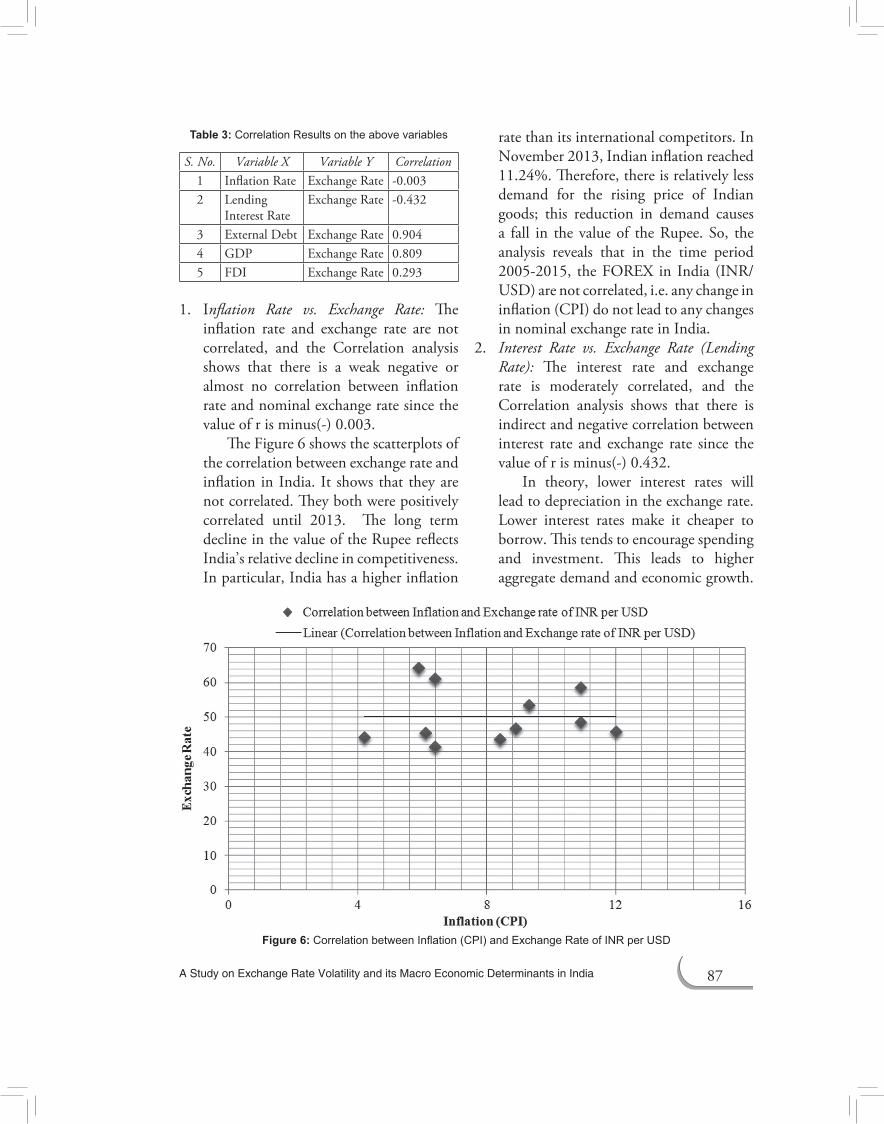
1. Inflation Rate vs. Exchange Rate: The inflation rate and exchange rate are not correlated, and the Correlation analysis shows that there is a weak negative or almost no correlation between inflation rate and nominal exchange rate since the value of r is minus(-) 0.003.
The Figure 6 shows the scatterplots of the correlation between exchange rate and inflation in India. It shows that they are not correlated. They both were positively correlated until 2013. The long term decline in the value of the Rupee reflects India’s relative decline in competitiveness. In particular, India has a higher inflation
rate than its international competitors. In November 2013, Indian inflation reached 11.24%. Therefore, there is relatively less demand for the rising price of Indian goods; this reduction in demand causes a fall in the value of the Rupee. So, the analysis reveals that in the time period 2005-2015, the FOREX in India (INR/USD) are not correlated, i.e. any change in inflation (CPI) do not lead to any changes in nominal exchange rate in India.
2. Interest Rate vs. Exchange Rate (Lending Rate): The interest rate and exchange rate is moderately correlated, and the Correlation analysis shows that there is indirect and negative correlation between interest rate and exchange rate since the value of r is minus(-) 0.432.
In theory, lower interest rates will lead to depreciation in the exchange rate. Lower interest rates make it cheaper to borrow. This tends to encourage spending and investment. This leads to higher aggregate demand and economic growth.
table 3: Correlation Results on the above variables
S. No. Variable X Variable Y Correlation1 Inflation Rate Exchange Rate -0.0032 Lending
Interest RateExchange Rate -0.432
3 External Debt Exchange Rate 0.9044 GDP Exchange Rate 0.8095 FDI Exchange Rate 0.293
figure 6: Correlation between Inflation (CPI) and Exchange Rate of INR per USD

88 Journal of General Management Research
This increase in AD may also cause inflationary pressures. In theory, lower interest rates will lead to depreciation in the exchange rate. If India reduces interest rates, it makes it relatively less attractive to save money in India. Therefore, there will be less demand for the Indian Rupee causing a fall in its value.
3. External Debt vs. Exchange Rate: The external debt and exchange rate is strongly
correlated, and the Correlation analysis shows that there is direct and positive correlation between external debt and exchange rate since the value of r is 0.904.
In India, external debt is classified into seven heads:Multilateral, Bilateral,IMF loans, Trade credit, Commercial borrowings, Non-resident Indian and person of Indian origin deposits, Rupee debt, and NPR debt. Mostly borrowings
figure 7: Correlation between Lending rate and exchange rate of INR per USD
figure 8: Correlation between External Debt and Exchange Rate of INR per USD

89 A Study on Exchange Rate Volatility and its Macro Economic Determinants in India
come with interest attached, which results in debt servicing. Serving external debt involves demand for foreign currency which tends to affect the exchange rate of the country. A large debt encourages more inflation, and higher inflation translates into lower currency value. Serving external debt may involve demand for foreign currency, i.e. USD which tends to affect the exchange rate of the country. Hence, the correlation analysis reveals that the external debt and exchange rate are highly correlated. As the external debt rises, the value of INR falls and the exchange rate against USD rises. So, external debt strongly explains the exchange rate fluctuation in India within the period of observation.
4. GDP vs. Exchange Rate: The nominal GDP and exchange rate is strongly correlated, and the Correlation analysis shows that there is direct and positive correlation between GDP and Exchange rate since the value of r is 0.809.
The gross domestic product (GDP) is the most important economic indicator.
It represents a broad measure of economic activity and signals the direction of overall aggregate economic activity. When the nominal gross domestic product increases, it decreases the home currency depreciation. So, the gross domestic product is influencing the exchange rate fluctuation. Larger than expected GDP will tend to appreciate the exchange rate as it is expected to lead to higher interest rates. The reasons which cause an increase or decrease in GDP many demand side factors, supply side factors, weather, political instability and commodity prices also influences the growth or contraction of the economy.
5. FDI vs. Exchange Rate: The FDI and exchange rate is weakly correlated, and the Correlation analysis shows that there is direct and mild positive correlation between FDI and Exchange rate since the value of r is 0.293.
The higher value of a currency is beneficial for domestic inflation as foreign products require less currency, and are, therefore, cheaper when paid for
figure 9: Correlation between GDP and Exchange Rate of INR per USD

90 Journal of General Management Research
in domestic currency. An increase in FDI will increase the demand for the currency of the receiving country, and thus RBIpumps Rupee into the market. This situation leads to excess in liquidity and hence Inflation. In addition, an increase in a country’s currency will lead to an improvement in its terms of trade, which is the ratio of export to import prices.
INTERPRETATION1. There is weak negative correlation
between inflation and exchange rate INR/USD. It means that the change in exchange rate and the change in inflation are weakly inversely correlated particularly in the period of study, i.e. 2005-2015. Generally, when the inflation in an economy rises, less of its goods are demanded as they become expensive due to high price, it leads to less demand of domestic currency i.e. INR. According to demand and supply theory, when price rises, demand falls. Similarly, as inflation rises, the demand for INR falls and INR depreciates against USD. But, in Indiafrom 2005 to 2015, the reality does
not comply with the general correlation between the two.
2. There is a moderate negative correlation between lending rate and exchange rate INR/USD. It means that the changes in lending rate and exchange rate are moderately inversely related to each other from 2005 to 2015. Generally, when the lending rate in a country rises, less is borrowed as borrowing becomes expensive, the supply of currency, i.e. INR falls in the market. According to the demand and supply theory, as the supply falls, price also falls. So, when the supply of INR falls, the exchange rate also falls and hence, INR appreciates against USD. The reality in India from 2005 to 2015 complies with the general correlation between the two.
3. There is a very strong positive correlation between external debt and exchange rate. It means that they both move in same direction, i.e. as X variable increases, the Y variable also increases. In the short run, when external debt rises through commercial borrowings, the inflow of debt will be in the form of foreign currency i.e.
figure 10: Correlation between FDI and Exchange Rate of INR per USD

91 A Study on Exchange Rate Volatility and its Macro Economic Determinants in India
USD which will lead to rise in supply of USD. This should decrease the exchange rate however, the results calculated is in contrast of this existing theory. The exchange rate is still increasing; it can be attributed to various other factors which are not present in this study or the impact of one variable out ways the impact of external debt. The reality in India from 2005 to 2015 does not comply with the general relationship.
4. There is a strong positive correlation between GDP in current USD and exchange rate INR/USD. It means that they both move in same direction, i.e. as X variable increases, the Y variable also increases.Butingeneral,astheGDPofacountry rises, its currency also appreciates becauseofrise ineconomicgrowth.Butin the study of India from 2005 to 2015, the reality do not comply with the existing theory of exchange in current scenarios as people are still investing in U.S Dollar instead of Rupee which is opposite of the existing theories this indicates that the dollar is still high in demand and can be attributed to various other factors not included in study or the impact of other factors outweigh the impact of GDP.
5. There is a mild positive correlation between FDI in current USD and exchange rate INR/USD. It means that they both move in same direction, i.e. as X variable increases, the Y variable also increases. But in general, as theFDIof a countryrises, its currency also appreciates because ofexcesssupplyofUSDollars.Butinthestudy of India from 2005 to 2015, the reality do not comply with the existing theory of exchange in current scenarios as people are still investing in U.S Dollar instead of Rupee which is opposite of the
existing theories. This indicates that the dollar is still high in demand and can be attributed to various other factors not included in study or the impact of other factors outweighs the impact of FDI.
6. Hence, the interpretations show that from 2005 to 2015, the tremendously increasing US Dollar value is also one of the reasons behind the falling value of INR.
To find out the exchange rate volatility of INR per USD, the following Data collection and analysis has been done using descriptive statistics and based on the analysis the results have been mentioned below.
This section talks about the rupee exchange rate volatility by calculating coefficient of variance and standard deviation and plotting graphs against that data and looks into the reasons behind that volatility. Volatility measures the extent by which exchange rates move over a period of time. It is annualized standard deviation of the current market
table 4: Volatility in the Exchange Rate of INR (against USD)
Year Average Value of INR against US$
Standard Deviation
Coefficient of
VariationRange
2005 44.1002 0.09604 0.00218 2.2382006 45.307 0.92552 0.02043 2.2082007 41.3485 1.72611 0.04175 4.8972008 43.5053 1.54554 0.03553 9.6292009 48.4053 1.10857 0.0229 4.662010 45.726 0.75466 0.0165 2.4242011 46.6707 0.41063 0.0088 8.32012 53.4374 2.67734 0.0501 6.8662013 58.5979 3.43198 0.05857 9.9782014 61.0296 1.05947 0.01736 3.4482015 64.152 1.03819 0.01618 4.558
Note: Compiled by first author in Microsoft Excel 2010.

92 Journal of General Management Research
figure 11: Average Value of INR against the USD
figure 12: Volatility in the Exchange Rate of INR against USD based on SD
figure 13: Volatility in the Exchange Rate of INR against USD based on CV

93 A Study on Exchange Rate Volatility and its Macro Economic Determinants in India
price. The standard deviation of the past volatility is done on the assumption that the immediate future will replicate the past. To track the two way movement of the Indian rupee, the monthly averages of the Indian rupee against the US Dollar have been used since the year 2005 till 2015.
Volatility in exchange rate measured by Coefficient of Variation and Standard Variation explained with graphs: Basedon monthly average exchange rates, standard deviation, coefficient of Variation and range have been calculated and compiled in the Table 4. Figures 11-13 shows the discrepancies in the rupee-dollar through the standard deviation and coefficient of variation from 2005 to 2015. The variable with the smaller CV is less dispersed than the variable with the larger CV.
Exchange rate has been defined in its book ‘exchange rate risk measurement and management’ as exchange risk relates to the effect of unexpected exchange rate changes on the value of the firm. It is clear from the graph that the value of INR per USD (exchange rate) has been varying and dispersing since 2005. The year 2007 witnessed an appreciating INR against the dollar. The main reason for the rupee’s appreciation since late 2006 has been a flood of foreign-exchange inflows, especially US dollars.
The graph shows that the Rupee-Dollar exchange rate deviates from the mean or average, i.e. monthly average exchange rate.
Coefficient of variation is also called variation coefficient, unitized risk or relative standard deviation (% RSD). Because its value isnormalized and it is a dimensionless number, it is very helpful in analyzing and comparing volatility of different stocks. It is seen that rupee-dollar velocity was more or less stable
in 2005 and 2006. After 2006 it has started fluctuating widely, reason could be that the India adopted the US$ as a currency of intervention in 1992 and thereafter the rise in trade activities, increase in software exports, and mainly capital flows resulted in to these fluctuations. The above trends show that the Indian Rupee exchange rate against U.S Dollar witnessed tremendous volatility in 2007 and 2013. The Indian rupee plunged to a record low versus the dollar, slumping to an intra-day value of 68.85 on August 28, 2013, based on a combination of factors before gradually recovering to 61.7710 by year-end. Foreign investors sold almost $1 billion of Indian shares in the eight sessions to August 27—a worrisome prospect, given that stocks had been India’s one sturdy source of capital inflows in the first half of 2013 in the face of policy paralysis with regard to foreign direct investment in several sectors.
SUMMARY AND FINDINGS The Correlation analysis of the five macroeconomic variables with exchange rate (INR/USD) shows that:
• H0: Null hypothesis is not rejected asit has been found that there is almost no correlation between inflation and exchange rate.
• H0:Null hypothesis is rejected as thereis moderate negative correlation between lending rate and exchange rate.
• H0:Null hypothesis is rejected as thereis strong and positive correlation between external debt and exchange rate.
• H0:Null hypothesis is rejected as thereis positive correlation between GDP and exchange rate.
• H0:Null hypothesis is rejected as thereis although mild but positive correlation between FDI and exchange rate.

94 Journal of General Management Research
On the basis of above analysis and interpretation, it can be concluded that Indian Rupee has shown high volatility over the years. The exchange rate of INR per USD was highly volatile in 2013 according to coefficient of variation. There are various probable reasons associated with it. India was receiving capital inflows even amidst continued global uncertainty in 2009-11 as its domestic outlook was positive. With domestic outlook also turning negative, Rupee depreciation was a natural outcome. India is facing high exchange rate volatility and the most volatile year was 2013. Depreciation leads to imports becoming costlier which is a worry for India as it meets most of its oil demand via imports. Apart from oil, prices of other imported commodities like metals, gold, etc., will also rise pushing overall inflation higher. Even if prices of global oil and commodities decline, the Indian consumers might not benefit as depreciation will negate the impact.
After analyzing each of the variables such as Exchange rate, Inflation (CPI), Interest rate (lending rate), external debt (current US$), GDP (current US$), FDI (current US$), it has been found that there are comparatively high variations in the variables. By this analysis itcan be concluded that all variables are directly correlated with exchange rate except Inflation and Interest rate. The exchange rate is highly positively correlated to the external debt and there is almost no correlation between exchange rate and inflation for the time period 2005 to 2015. Indian rupee has become excessive volatile leading to sudden and sharp depreciation of Indian Rupee against US Dollar.
CHALLENGES IN FRONT OF RBI AND INDIAN GOVERNMENT1. Bank rate: Due to these fluctuation bank
rate raised from 8.25% to 10.25% and
Limit of lending overnight borrowing fromRBI fixed to Rs75000cr.Thiswasdone to tame inflationary expectations. So, further raising interest rates would lead to lower growth levels.
2. FOREX Reserves: RBI can sell FOREXreserves and buy Indian Rupees leading todemandforrupee.ButusingFOREXreserves poses risk also, as using them up in large quantities to prevent depreciation may result in a deterioration of confidence in the economy’s ability to meet even its short-term external obligations. So, it is a majorchallengeinfrontofRBI.
3. To Make Investments Attractive:ByeasingCapitalControls, RBI can take steps toincrease the supply of foreign currency by expanding market participation to support Rupee.
SUGGESTIONS There are no quick fixes to country’s imbalanced external sector and the Indian economy remains vulnerable to external shocks and global liquidity conditions. This unpredictable environment of the foreign exchange market is on growing due to increase in capital flows, the rising cross-border trade, and integration of the international financial market. It was observed that particularly after globalization the market has become extremely volatile thereby affecting the revenue and expenditure of the corporate. Even bankers have to ensure that they may not incur any losses in the foreign exchange dealings. Although RBI has mademanymeasures tocontrol the exchange rate volatility, but still a major scope remains that needs to be done. Some suggestions that may be fruitful if acted upon are as under:
1. To impose more curbs on imports of non-essential items with the help of

95 A Study on Exchange Rate Volatility and its Macro Economic Determinants in India
higher custom duties, strict quantitative restrictions on the import of gold, silver and non-essential items.
2. To work out for trading of goods in local currencieswithBRICpartnersandAsiancountries. Russia, Malaysia and some other countries have expressed interest in trading in local currencies with India.
3. To enter into currency swap agreements with key trading partners.
4. To focus on boosting exports and looking for more stable longer term foreign inflows to reduce current account deficit.
5. To stop devaluation of Rupee against major foreign currencies.
6. To protect foreign trade and borrowings transactions against currency risk, thus protecting profit margin and remaining competitive in international business.
REFERENCES [1] Chien-Hsiu Lin (2011). ‘Exchange rate exposure
in the Asian emerging markets’, Journal of Multinational Financial Management, 224-238.
[2] Chellasamy, P. (2013). ‘Depreciation of Indian currency and its impact on Indian economy’, Vidyaniketan Journal of Management and Research, 1(2), 13-22.
[3] BofingerPeter. ‘Volatile exchange rates are themain cause of the instability in the international economy’, Chapter: I Volatile Nature of the Indian Rupee, pp. 20-43.
[4] Bhandari, R. (2014). ‘An analytical study on depreciation of rupee against dollar & fundamen- tal analysis on impact of macroeconomic factors on exchange rate of rupee’, International Research Journal of Business and Management, 2(2), 36-43.
[5] Dua Pami & Sen Partha (2006). ‘Capital Flow volatility and Exchange Rates: The Case in India’, Centre of Development Economics, Working Paper No. 144.
[6] Edwards, S. (2001). ‘Exchange Rate Regimes, Capital Inflows and Crisis Prevention’, NBER and University of California, Working Paper.
[7] Engel M. Charles (1986). ‘On the Correlation of Exchange Rates and Interest Rates’, Journal of International Money and Finance (1986), 5, 125-128.
[8] Hoffman, M.E.S. (2005), ‘The Exchange Rate and the Trade Deficit: What’s the Relationship?’, June 2005. Available at http://people.duke.edu/~meh13/exchangerate-tradedeficit.pdf
[9] Husain, A.M., Mody, A. & Rogoff, K.S. (2004). ‘Exchange Rate Regime Durability and Performance in Developing Versus Advanced Economies’, Journal of Monetary Economics, 52(1), 35-64.
[10] IMF Data Retrieved from http://www.imf.org/external/data.htm#exchange. Accessed on March 20, 2016.
[11] Jeevanandam, C. (2012). ‘Foreign Exchange and Risk Management’, Sultan Chand & Sons, fifteenth edition.
[12] Kaur, N. & Sirohi, R. (2013). ‘Effect of rupee depreciation on common Man’, International Journal of Scientific and Research Publications, 3(10).
[13] Khera, Kanika & Singh, Inderpal (2015). ‘Effect of macro-economic factors on Rupee Value’, Delhi Business Review, Vol. 16, No. 1 (January-June 2015).
[14] Kotai, V. (2013), ‘An empirical study on currency volatility in foreign exchange market’, Global Journal of Management and Business Studies, 3(8), 897-904.
[15] Krishnamurthy, K. & Pandit. V (1997), ‘Exchange Rate, Tariffs and Trade flows: Alternative policy scenarios of India’, Journal of Asian Economics, 8(3), 425-454.
[16] Mirchandani, Anita (2013). ‘Analysis of Macroeconomic determinants of exchange rate volatility in India’, International Journal of Economics and Finance Issues, Vol. 3, No. 1.
[17]Mirza Allim Baig, V. Narasimhan & M.Ramachandran (2003), ‘Exchange market pressure and the Reserve Bank of India’sintervention activity’, Journal of Policy Modeling.
[18] Olusola Oke Emmanuel (2009). ‘Determinants of foreign exchange rate in Nigeria’, International Institute of Social Studies.

96 Journal of General Management Research
[19] Riehl Heinz & Rodriguez M. Rita (1977). ‘Foreign Exchange Markets’, McGraw-Hill BookCompany.
[20] RBI Data. Retrieved from http://www.rbi.org.in/Scripts/Statistics.aspx. Accessed on March 20, 2016.
[21] S. Edwards & L. Ahamed (eds.). ‘Economic Adjustment Exchange Rates in Developing Countries’, University of Chicago Press, 10, 308-321.
[22] Sideris, A. Dimitrios (2008). ‘Foreign exchange intervention and equilibrium real exchange rates’, International Market and Financial Institutions and Money, p. 344.
[23] Taylor, L. (2001). ‘Argentina: A Poster Child
for Failure of Liberalized Policies?’, Challenge/November–December, 44, 6, 28–44.
[24]World BankData. Retrieved from http://data.worldbank.org/country/india. Accessed on March 20, 2016.
[25] Zakaree S. Saheed et al. (2014). ‘Impact of Public External Debt on Exchange Rate in Nigeria’, International Finance and Banking, ISSN 2374-2089 2015, Vol. 2, No. 1.
[26] Gordon, J. & Gupta, P. (2003). ‘Portfolio Flows into India: Do Domestic Fundamentals Matter?’, Working Paper No. 03/20, January.
[27] Kim, E. & Singal, V. (2000), ‘The Fear of Globalizing Capital Markets’, Emerging Markets Review, November, 1(3): 183-98.