a study of the three-level hierarchy of information
TRANSCRIPT

Louisiana State UniversityLSU Digital Commons
LSU Historical Dissertations and Theses Graduate School
1982
A Study of the Three-Level Hierarchy ofInformation Processing in ReadingComprehension With Respect to CognitiveDemand.Lane Roy GauthierLouisiana State University and Agricultural & Mechanical College
Follow this and additional works at: https://digitalcommons.lsu.edu/gradschool_disstheses
This Dissertation is brought to you for free and open access by the Graduate School at LSU Digital Commons. It has been accepted for inclusion inLSU Historical Dissertations and Theses by an authorized administrator of LSU Digital Commons. For more information, please [email protected].
Recommended CitationGauthier, Lane Roy, "A Study of the Three-Level Hierarchy of Information Processing in Reading Comprehension With Respect toCognitive Demand." (1982). LSU Historical Dissertations and Theses. 3756.https://digitalcommons.lsu.edu/gradschool_disstheses/3756

INFORMATION TO USERS
This reproduction was made from a copy of a document sent to us for microfilming. While the most advanced technology has been used to photograph and reproduce this document, the quality of the reproduction is heavily dependent upon the quality of the material submitted.
The following explanation of techniques is provided to help clarify markings or notations which may appear on this reproduction.
1. The sign or “target” for pages apparently lacking from the document photographed is “Missing Page(s)”. I f it was possible to obtain the missing page(s) or section, they are spliced into the film along with adjacent pages. This may have necessitated cutting through an image and duplicating adjacent pages to assure complete continuity.
2. When an image on the film is obliterated with a round black mark, it is an indication of either blurred copy because of movement during exposure, duplicate copy, or copyrighted materials that should not have been filmed. For blurred pages, a good image of the page can be found in the adjacent frame. If copyrighted materials were deleted, a target note will appear listing the pages in the adjacent frame.
3. When a map, drawing or chart, etc., is part of the material being photographed, a definite method of “sectioning” the material has been followed. It is customary to begin filming at the upper left hand comer of a large sheet and to continue from left to right in equal sections with small overlaps. I f necessary, sectioning is continued again—beginning below the first row and continuing on until complete.
4. For illustrations that cannot be satisfactorily reproduced by xerographic means, photographic prints can be purchased at additional cost and inserted into your xerographic copy. These prints are available upon request from the Dissertations Customer Services Department.
5. Some pages in any document may have indistinct print. In all cases the best available copy has been filmed.
International
Reproduced with permission of the copyright owner. Further reproduction prohibited without permission.

Reproduced with permission of the copyright owner. Further reproduction prohibited without permission.

Gauthier, Lane Roy
A STUDY OF THE THREE-LEVEL HIERARCHY OF INFORMATION PROCESSING IN READING COMPREHENSION WITH RESPECT TO COGNITIVE DEMAND
The Louisiana State University and Agricultural and Mechanical Col Ph.D. 1982
University Microfilms
internstionei 300N.ZeebRoad.AimAtboI,M14SK16
Copyright 1983
by Gauthier, Lane Roy
Aii Rights Reserved
Reproduced with permission of the copyright owner. Further reproduction prohibited without permission.

Reproduced with permission of the copyright owner. Further reproduction prohibited without permission.

A STUDY OF THE THREE-LEVEL HIERARCHY OF INFORMATION PROCESSING IN READING COMPREHENSION WITH
RESPECT TO COGNITIVE DEMAND
A Dissertation
Submitted to the Graduate Faculty of the Louisiana State University and
Agricultural and Mechanical College in partial fulfillment of the requirements for the degree of
Doctor of Philosophy
The Interdepartmental Program in Education
byLane Roy Gauthier R.S., Louisiana State University, 1975
%.Ed., Louisiana State University, 1977 August, 1982
Reproduced with permission of the copyright owner. Further reproduction prohibited without permission.

ACKNOWLEDGMENTSThis dissertation is dedicated to my mother,
Catherine, and to my late father, Blûmes. Thank you.
I would like to express my sincere gratitude to all who made the completion of this project possible. Special thanks goes out to the members of my committee:Dr. Earl H. Cheek, Jr. (Major Professor), Dr. Sam Adams (Alumni Professor), Dr. Martha Cheek, Dr. Robert Mathews (Minor Professor), and Dr. Eric Thurston. I shall always remember you for the interest, patience, and wisdom which you offered me.
Appreciation is also extended to Mr. Dewey Guillot, Mrs. Jan Guillory, and Mrs. Edith Hilton of the Louisiana State University Laboratory School.
A final note of gratitude is extended to my lovely wife, Susanne.
Reproduced with permission of the copyright owner. Further reproduction prohibited without permission.

TABLE OF CONTENTSPage
ACKNOWLEDGEMENTS ........................................ üLIST OF TABLES............................................ viLIST OF F I G U R E S ......................................... viiABSTRACT................................................ viiiChapter
1. INTRODUCTION .................................... 1Significance of the Study ..................... 7Statement of the Problem ..................... 7Definition of T e r m s ..................... . . . 8Delimitations .................................. 12Hypotheses...................................... 12Organization of S t u d y ............................14
2. REVIEW OF THE L I T E R A T U R E.......................... 15Concepts and Research in Subskill Models . . . 16Concepts and Research in Meaning-Emphasis
and Interactive-Compensatory Models ........ 28Summary.......................................... 37
3. MATERIALS AND PROCEDURE............................ 39The S a m p l e ...................................... 39The Instrument.................................. 39The M e t h o d ...................................... 40The Procedure.................................... 43Statistical Treatment ......................... 45
4. STATISTICAL FINDINGS AND DISCUSSIONS ........... 46Introduction .................................. 46Hypothesis 1 .................................... 48Hypothesis 2 .................................... 50
iii
Reproduced with permission of the copyright owner. Further reproduction prohibited without permission.

Chapter Page
Hypothesis 3 ................................... 52Hypothesis 4 ................................... 54Hypothesis 5 ................................... 56Hypothesis 6 ................................... 58Hypothesis 7 ................................... 60Hypothesis 8 ................................... 62Hypothesis 9 ................................... 64Hypothesis 1 0 ................................... 66Hypothesis 1 1 ................................... 68Hypothesis 1 2 ................................... 70Hypothesis 1 3 ................................... 72Hypothesis 1 4 ................................... 74Hypothesis 1 5 ................................... 76Hypothesis 1 6 ................................... 78Hypothesis 1 7 ................................... 80Hypothesis 1 8 ................................... 82Hypothesis 1 9 ........................ 84Hypothesis 2 0 ................................... 86Hypothesis 2 1 ................................... 88General Discussion of the Hypotheses ......... 90
5. SUMMARY, CONCLUSIONS, AND RECOMMENDATIONS . . . . 93Introduction ................................. 93Summary..........................................93Conclusions......................................95Resolution of the Problem Statement.............98Recommendations for Practitioners ............ 99Recommendations for Researchers ............. 100
BIBLIOGRAPHY ............................................ 102APPENDICES............................................... 108V I T A ..................................................... 162
Reproduced with permission of the copyright owner. Further reproduction prohibited without permission.

LIST OF TABLESPage
Differences Between Correct Responses to CAT Form C Questions at Each Level of the Three- Level Hierarchy for Whole Group D a t a ........... 48
Differences Between Correct Responses to CAT Form C Questions at Each Level of the Three- Level Hierarchy for 5th Grade Data . . . . . 50
Differences Between Correct Responses to CAT Form C Questions at Each Level of the Three- Level Hierarchy for 5th Grade Male Data . . . 52
Differences Between Correct Responses to CAT Form C Questions at Each Level of the Three- Level Hierarchy for 5th Grade Female Data . . 54
Differences Between Correct Responses to CAT Form C Questions at Each Level of the Three- Level Hierarchy for 6th Grade D a t a ............. 56
Differences Between Correct Responses to CAT Form C Questions at Each Level of the Three- Level Hierarchy for 6th Grade Male Data . . . 58
Differences Between Correct Responses to CAT Form C Questions at Each Level of the Three- Level Hierarchy for 6th Grade Female Data . . 60
Differences Between Correct X-Task Responses Performed While Answering Questions at Each Level of the Three-Level Hierarchy for Whole Group D a t a ...................................... 62
Differences Between Correct X-Task Responses Performed While Answering Questions at Each Level of the Three-Level Hierarchy for 5th Grade D a t a ...................................... 64
Differences Between Correct X-Task Responses Performed While Answering Questions at Each Level of the Three-Level Hierarchy for 5th Grade Male D a t a .................................. 66
Reproduced with permission of the copyright owner. Further reproduction prohibited without permission.

PageDifferences Between Correct X-Task Responses
Performed While Answering Questions at Each Level of the Three-Level Hierarchy for 5th Grade Female D a t a ................................68
Differences Between Correct X-Task Responses Performed While Answering Questions at Each Level of the Three-Level Hierarchy for 6th Grade D a t a ...................................... 70
Differences Between Correct X-Task Responses Performed While Answering Questions at Each Level of the Three-Level Hierarchy for 6th Grade Male D a t a .................................. 72
Differences Between Correct X-Task Responses Performed While Answering Questions at Each Level of the Three-Level Hierarchy for 6th Grade Female D a t a ................................74
Differences Between Correct Responses to CAT Form D Questions at Each Level of the Three- Level Hierarchy for Whole Group D a t a ........... 76
Differences Between Correct Responses to CAT Form D Questions at Each Level of the Three- Level Hierarchy for 5th Grade Data...............78
Differences Between Correct Responses to CAT Form D Questions at Each Level of the Three- Level Hierarchy for 5th Grade Male Data . . . . 80
Differences Between Correct Responses to CAT Form D Questions at Each Level of the Three- Level Hierarchy for 5th Grade Female Data . . . 82
Differences Between Correct Responses to CAT Form D Questions at Each Level of the Three- Level Hierarchy for 6th Grade Data............... 84
Differences Between Correct Responses to CAT Form D Questions at Each Level of the Three- Level Hierarchy for 6th Grade Male Data . . . . 86
Differences Between Correct Responses to CAT Form D Questios at Each Level of the Three-Level Hierarchy for 6th Grade Female Data . . . 88
Reproduced with permission of the copyright owner. Further reproduction prohibited without permission.

LIST OF FIGURES
PageFIGURE 1.1
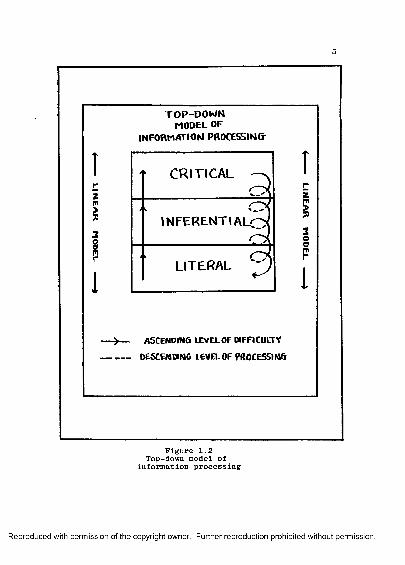
Bottom-Up Model of Information Processing . . . . 4FIGURE 1.2
Top-Down Model of Information Processing.............5FIGURE 1.3
Interactive-Compensatory Model of InformationProcessing ..................................... 6
FIGURE 3.1Solso's Interpretation of Kahneman's Attention
M o d e l ............................................. 42
Reproduced with permission of the copyright owner. Further reproduction prohibited without permission.

ABSTRACT
This study was designed to study the three-level hierarchy of information processing with respect to cognitive demand. The study addressed the problem of differences between the most commonly used levels of comprehension, literal, inferential, and critical.
The main types of information processing models, bottom-up, top-down, and interactive-compensatory, all accept the premise that literal processing is less cognitively demanding than inferential processing, and that inferential processing is less cognitively demanding than critical processing.
In order to test whether statistically significant differences actually existed in these three levels of comprehension, fifty students were chosen and individually tested. Twenty-five fifth graders, and twenty-five sixth graders, with an equal division of males and females, composed the sample of fifty. The instrument used was the California Achievement Test. The method used was the dual task method, where the students performed the primary task above, as well as a secondary task. The secondary task employed an audiometer, and required the
viii
Reproduced with permission of the copyright owner. Further reproduction prohibited without permission.
students to mark a grid according to sounds in the left or right ears.
There were twenty-one hypotheses, all of the null variety, and all allowing for the combinations of all three comprehension levels. Results from an analysis of the data showed that for the primary task, only four of the possible forty-two areas showed differences. For the secondary task (X-task) none of the possible forty- two areas showed differences. The data provided strong evidence to deny the existence of statistically significant differences among the three levels of comprehension with respect to cognitive demand.
Recommendations were made to practitioners based upon the findings. One suggestion was for classroom teachers to use a variety and mixture of questions at all levels.
Recommendations were also made to researchers interested in this same direction of study. The major suggestion in this category dealt with the need to find a better measure of difficulty for comprehension questions.
Reproduced with permission of the copyright owner. Further reproduction prohibited without permission.

INTRODUCTION
The study of reading comprehension has received a great deal of attention in the last decade (Guthrie, 1981). Comprehension research, although diverse and perplexing, has been a central theme in graduate classes, professional conventions, and practically any setting which lends to dynamic debate. These forums for discussion give rise to even more ideas on the subject, which in turn leads to further research.
Since educational methods and materials are built upon paradigms of human cognition, exploration into the process of comprehension is germane to the development of classroom practices. Therefore, a large percentage of reading comprehension research has centered on the production of reading models (Stanovich, 1980). The ultimate goal, of course, is to provide instruction which is suited to the needs of each learner.
Kline (1979'' has divided the study of comprehension models into four major areas: information processing,hypothesis testing, developmental, and schema models.The information processing model dealt with the flow of information with regard to direction and difficulty. The
Reproduced with permission of the copyright owner. Further reproduction prohibited without permission.

hypothesis testing model c e n t e r e d upon decision-making with respect to the stimuli presented. The developmental model had the development of human cognition and learning as its central idea. The fourth model, the schema design, approached comprehension from the standpoint of concept development.This researcher has chosen to investigate the information processing model.
By far, the information processing model has had the largest effect upon reading materials and methods. This is exemplified by several written works which followed the precepts of this model. Moss (1978) has created an instru- men"^ called the "focus unit". This "focus unit" was to expand the information processing model as defined above. Miller (1978) provided a review of various instructional activities which were predicated on the information processing model. Keast (1979), in a study that outlined types of reading experiences which should be given to children, presented ideas having the information processing model as the theoretical framework.
Although there was a wealth of research which centered upon the directionality of information processing, there was little to provide information concerning the cognitive demand contained in each of the three types of comprehension, literal, inferential, and critical. The term cognitive demand, as used here, is defined as the degree in which mental processes are engaged in terms of number and quality.
Reproduced with permission of the copyright owner. Further reproduction prohibited without permission.

The main types of information processing models, bottom-up (Figure 1.1), top-down (Figure 1.2), and interactive-compensatory (Figure 1.3), all accepted the premise that literal processing was less cognitively demanding than inferential processing, and that inferential processing less cognitively demanding than critical processing. Likewise, the three information processing models were also based upon linear functioning which is confined to one dimension.The figures representing the three types of information processing models were based primarily on the work of Stanovich (1980), and represented this researcher's interpretation of the information processing concept,
Estes (1978) suggested that linear models were not adequate to represent the complicated process of comprehension. Nonetheless, the models continue to dominate the construction of reading materials and to dictate the development of instructional methods in reading.
In terms of actual cognitive demand, there was very little available research to even suggest that more work was needed to verify the difficulty levels of literal, inferential, and critical stages of reading comprehension.In Handler and Johnson (1977), Thorndyke (1977), Farnhan- Diggory (1978), Harste (1978), and Kline (1979), there appeared to be ample opportunity to investigate the validity of the three-level hierarchy of information processing. In
Reproduced with permission of the copyright owner. Further reproduction prohibited without permission.

B O T T O M -U P MODEL OF
in fo rm a tio n PR0CESS1N6
CRITICAL
INFERENTIAI
LITERAL
ASCEMDIN6 LEVEL OF DIFFICULTY
ASCENDIN6 LEVEL OF PROCESSING
Figure 1.1 Bottom-up model of
information processing
Reproduced with permission of the copyright owner. Further reproduction prohibited without permission.
TO P -D O W N MODEL OF
INFORMATION PROCESSING
CRITICAL
INFERENTIAL
LITERAL
ASCENDIN6 LEVEL Of DIFFICULTY
DESCENDING LEVEL OF PROCESSING
Figure 1.2 Top-down model of
information processing
Reproduced with permission of the copyright owner. Further reproduction prohibited without permission.

I MTER/lCTIVE-COrlPENSATORY MODEL OF
INFORMATION PROCESSING
CRITICAL
INFERENTIAL
LITERAL
Î
i
/ISCEMDIN6 LEVEL OF DIFFICULTY
INTERACTIVE- COMPENSATORY LEVEL OF PROCESSING
Figure 1.3 Interactive-compensatory model
of information processing
Reproduced with permission of the copyright owner. Further reproduction prohibited without permission.

every case, however, these researchers accepted the traditional definitions of the literal, inferential, and critical areas, and focused their studies on ideas which had these definitions as axioms.
This researcher feels that more information is needed in regard to the three-level hierarchy (literal, inferential, critical) with respect to cognitive demand. The following study is an effort to contribute additional information in this area.
Significance of the StudyResearch in the area of the three-level hierarchy for
comprehension as related to the cognitive domain has been sparse. This is not logical, since the area of comprehension questioning is an integral part of the educational system. The area of cognitive demand as it relates to comprehension is particularly in need of further study.
Statement of the ProblemIs there a difference, in terms of cognitive demand,
among the three levels of comprehension in the information processing models?
1. In terms of responses to comprehension questions, is there a difference among the levels?2. In terms of a secondary task, is there a difference among the levels while the secondary task is being performed?
Reproduced with permission of the copyright owner. Further reproduction prohibited without permission.

8
Definitions of Te:\. j1. Ascending Level of Difficulty - This refers to the
comprehension hierarchy. Comprehension becomes more difficult when progressing from the literal level to the critical level. Traditionally, diagrams of comprehension hierarchies have pictured the literal level at the bottom.
2. Ascending Level of Processing - The upward flow of information from the bottom of the hierarchy to the top.
3. Bottom-up Concept - One of the three information processing submodels. The information enters the comprehension mechanism at the literal level and progresses to the inferential and critical stages. This concept is also referred to as the "skill-based concept".
4. Cognitive Demand - This refers to the degree in which the mental processes are engaged in terms of number and quality. For instance, memorizing one’s phone number is an example of performing an activity which requires some type of cognitive demand. Memorizing one's phone number and then dialing it, however, certainly requires an activity of a higher cognitive demand.
5. Concept - A general idea or understanding, especially one derived from specific instances or occurrences. For instance, a person’s experiences with balloons, from the first one in early childhood to the most recent in adulthood, would all contribute to that person's understanding
Reproduced with permission of the copyright owner. Further reproduction prohibited without permission.

9
of everything about a balloon. This general idea or understanding is known as a concept.
6. Convergent Production - Arriving at a conclusion by gathering information from different sources and/or in different ways.
7. Critical Comprehension - Careful and exact evaluation and judgment which is deduced from information which is not explicitly stated, or inferred, in the text.
8. Descending Level of Processing - The downward flow of information from the top of the hierarchy to the bottom. For instance, information which enters the hierarchy atthe critical level and descends to either of the two lower levels, is thought of as being in this category.
9. Divergent Production - Arriving at a conclusion by starting with a generalization, and then finding a group of specific examples to support that generalization.
10. Holistic Comprehension - Understanding which takes place by comprehending material as a whole, and not necessarily by specific pieces.
11. Inferential Comprehension - Understanding which takes place by the reader's ability to supply information which is not explicitly stated in the text.
12. Information Processing Model - A graphic representation of how information input progresses, or is handled, when entering the brain.
Reproduced with permission of the copyright owner. Further reproduction prohibited without permission.
10
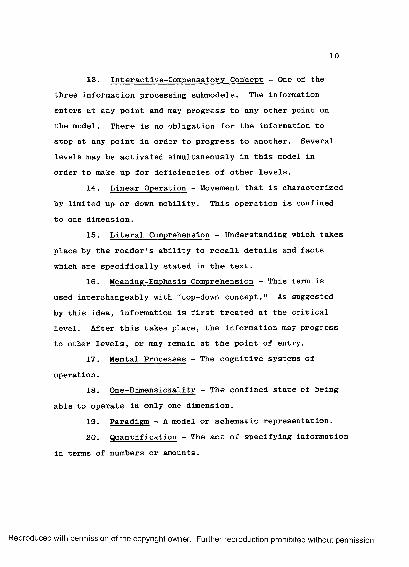
13. Interactive-Compensatory Concept - One of the three information processing submodels. The information enters at any point and may progress to any other point on the model. There is no obligation for the information to stop at any point in order to progress to another. Several levels may be activated simultaneously in this model in order to make up for deficiencies of other levels.
14. Linear Operation - Movement that is characterized by limited up or down mobility. This operation is confined to one dimension.
15. Literal Comprehension - Understanding which takes place by the reader's ability to recall details and facts which are specifically stated in the text.
16. Meaning-Emphasis Comprehension - This term is used interchangeably with "top-down concept." As suggested by this idea, information is first treated at the critical level. After this takes place, the information may progress to other levels, or may remain at the point of entry.
17. Mental Processes - The cognitive systems of operation.
18. One-Dimensional it y - The confined state of being able to operate in only one dimension.
19. Paradigm - A model or schematic representation.20. Quantification - The act of specifying information
in terms of numbers or amounts.
Reproduced with permission of the copyright owner. Further reproduction prohibited without permission.

21. Reading Comprehension - Internalization and utilization of what one reads.
22. Subskill Comprehension - This term is used interchangeably with "bottom-up concept." Here, information is first treated by the literal level and then proceeds to the other levels. The input may also remain at the literal level if the literal process is the operation which the input requires.
23. Thought Units - Concepts which guide thought.24. Three-Level Comprehension Hierarchy - The design
which is generally used to portray information processing models. The three levels most used are literal, inferential, and critical.
25. Top-Down Concept - One of the three information processing submodels. The information enters the comprehension mechanisms at the critical level and then progresses to the inferential and literal stages. This concept is also referred to as the "meaning-based concept."
26. Verbal Units - Language parts which comprise meaningful speech.
27. Word Recognition - This takes place when the reader possesses "cognitive duplicates" for the word being read. The reader must have had some form of previous contact with the word for recognition to take place.
Reproduced with permission of the copyright owner. Further reproduction prohibited without permission.

12Delimitations
This study was limited to approximately 50 fifth and sixth grade students attending school during the 1981-82 school year. These students were administered the California Achievement Test (levels 5 and 6; forms C and D).The University Laboratory School provided the subjects for the study. This school is located in East Baton Rouge Parish in the State of Louisiana.Hypotheses
1. In the whole group data (CAT form C), there is no significant difference among levels.
2. In the 5th grade data (CAT form C), there is no significant difference among levels.
3. In the 5th grade male data (CAT form C), there is no significant difference among levels.
4. In the 5th grade female data (CAT form C), there is no significant difference among levels.
5. In the 6th grade data (CAT form C), there is no significant difference among levels.
6. In the 6th grade male data (CAT form C), there is no significant difference among levels.
7. In the 6th grade female data (CAT form C), thereis no significant difference among levels.
8. In the whole group data for the X-task, there is nosignificant difference among categories of correct responses which are performed while the literal, inferential, and critical comprehension questions are being answered.
Reproduced with permission of the copyright owner. Further reproduction prohibited without permission.

13
9. In the 5th grade data for the X-task, thereis no significant difference among categories of correctresponses which are performed while the literal, inferential, and critical comprehension questions are being answered.
10. In the 5th grade male data for the X-task, there is no significant difference among categories of correct responses which are performed while the literal, inferential, and critical comprehension questions are being answered.
11. In the 5th grade female data for the X-task, thereis no significant difference among categories of correctresponses which are performed while the literal, inferential, and critical comprehension questions are being answered.
12. In the 6th grade data for the X-task, there is no significant difference among categories of correct responses which are performed while the literal, inferential, and critical comprehension questions are being answered.
13. In the 6th grade male data for the X-task, there is no significant difference among categories of correct responses which are performed while the literal, inferential, and critical comprehension questions are being answered.
14. In the 6th grade female data for the X-task, there is no significant difference among categories of correct responses which are performed while the literal, inferential, and critical comprehension questions are being answered.
Reproduced with permission of the copyright owner. Further reproduction prohibited without permission.

14
15. In the whole group data (CAT form D) , there is no significant difference among levels.
16. In the 5th grade data (CAT form D), there is no significant difference among levels.
17. In the 5th grade male data (CAT form D), there is no significant difference among levels.
18. In the 5th grade female data (CAT form D), there is no significant difference among levels.
19. In the 6th grade data (CAT form D), there is no significant difference among levels.
20. In the 6th grade male data (CAT form D), there is no significant difference among levels.
21. In the 6th grade female data (CAT form D), there is no significant difference among levels.
Organization of the StudyChapter 1 presents an introduction to the problem,
a discussion of the significance of the study, a statement of the problem, the definitions of terms, the delimitations, the hypotheses, and the organization of the study. Chapter 2 summarizes the related literature and research. Chapter 3 describes the materials and procedures to be used in the study. Chapter 4 presents and discusses the statis
tical findings. Chapter 5 presents the summary, conclusions, and recommendations.
Reproduced with permission of the copyright owner. Further reproduction prohibited without permission.

REVIEW OF RELATED LITERATURE
The early 1900's was a time in which reading experienced a predominance of scientific investigation. Edward L. Thorndike was one of the first researchers to take part in these investigations by delving into the commonalities of reading and mental processes (1917). Thorndike served to bring about the "quantification" of a field which had previously lacked a sound scientific base. Before this trend, the reading area had depended heavily upon data which was not quantitative. Researchers followed the practice of close observation of students, but mere observation is not reliable as a predictive tool. Therefore, the results of most of the early research in the field of reading were not useful for generalization purposes.
Edward Burke Huey was one of the pioneers of the scientific movement in reading, and made a significant contribution to the literature with The Psychology and Pedagogy of Reading, which was published in 1908. In this publication, Huey reported on an experiment, the subject of which became an open forum for debate in the ensuing years. The study investigated oral versus silent reading, with the
15
Reproduced with permission of the copyright owner. Further reproduction prohibited without permission.

16
measurement device being the speed with which the students
In the ten years which followed Huey's experiment, several studies were completed which related silent reading to comprehension. Starch (1915) developed a silent reading test with comprehension as one of its major parts, and Courtis and Heller (1921) devised a test which yielded standard scores in several areas. These studies used Huey's basic ideas regarding silent reading.
These studies which followed Huey's ideas were representative of a significant shift from the investigations which had centered on the speed of reading, and had not devoted as much attention to the process of understanding what was read. At this point, the comprehension area became a topic which would receive considerably more attention than it had been given previously.
CONCEPTS AND RESEARCH IN SUBSKILL MODELSNila Banton Smith (1934) stated, "...that the aim of
getting thought from the printed page is beginning to occupy an important place." The ideas of several researchers who made significant contributions to the theory of reading comprehension in the subskill area are discussed below.
Gates (1927) spoke of comprehension as the third and most critical element involved in reading proficiency. The
Reproduced with permission of the copyright owner. Further reproduction prohibited without permission.

17
first two factors, In order of difficulty and importance, w e r e word recognition and phrase and sentence reading. In word recognition. Gates related that students should be able to read words which were contained in the primary vocabulary for that particular student's grade level. For phrase and sentence reading, the student must be able to read verbal units which became increasingly complex as the passage progresses.
In his description of comprehension as the third level in this reading mc iel. Gates said that the student must show the ability to read "thought units," and be able to demonstrate an exact understanding of what had been read. The emphasis is on the whole passage as a unit, rather than on isolated words or pieces of sentences. A holistic approach to comprehension, not a segmented hierarchy, was the view which Gates espoused in his research. He also developed several primary grade diagnostic tests based upon these precepts. This holistic concept of comprehension was not far removed from Ihe meaning-emphasis school of thought (Chall, 1967), as exemplified by Gates' contention that "thought units" are the basis of comprehension.
Strang (1940) presented comprehension as a three- level hierarchy. The first level entailed the ability to identify details directly from the text. Interpreting obscure metaphor and shifts in meaning was the second level.
Reproduced with permission of the copyright owner. Further reproduction prohibited without permission.

18
and creative and active thinking served as the third level.
Strang reported these levels in comprehension to be of increasing cognitive demand. In other words, the first level was less difficult than the second, and the second level was not as demanding as the third. Therefore, according to Strang, the third level (creative and active thinking) was the highest order of comprehension. In addition, the two highest levels could not be tested by factual questions alone. There must be the opportunity for the student to perform extrapolations and/or evaluations in order to decide whether or not these higher comprehension skills had been achieved.
Dewey (1935) provided experimental evidence which seemed to lend credence to the belief that factual questions could not be used to test higher order comprehension. After designing tests which required that students perform all three levels of comprehension skills, Dewey found that there was a correlation range of only .38 to .65 between level one and the two higher comprehension levels. Lyman (1923) also cautioned that educators should not limit themselves to factual questions when assessing comprehension.
Gray (1959) provided a similar model for comprehension. This model differed from Strang's model mainly on the basis of terminology. Gray's levels of comprehension
Reproduced with permission of the copyright owner. Further reproduction prohibited without permission.

19
include literal sense meaning, drawing inferences, and identifying problems and interpreting data. Although the names were different, these levels parralleled the ones in Strang's model.
Betts (1946) presented a fused view of the holistic and the three-level versions of comprehension theory. In the classic holistic vein, Betts' contention was that comprehension was a result of the student being able to reconstruct and organize facts from orthographic structures. In this sense, the student related reading material to his/ her own background experiences or stored concepts. As the child progressed in school, experiences become more numerous, and the child was able to broaden the base of concepts upon which comprehension depends. Rumelhart and Ortony(1977) supported this belief by research which stated that there are cognitive templates against which incoming data could be matched. This matching process-was what led to comprehension.
When speaking of comprehension assessment, Betts reflected the position of the hierarchy theorists by differentiating questions in terms of cognitive demand. Although acknowledging that factual questions did provide an adequate means of assessing comprehension, he stated that they did not serve to appraised its quality and depth. This was done only through the use of inferential type
Reproduced with permission of the copyright owner. Further reproduction prohibited without permission.

questions, which allowed students to conclude things which were not explicitly stated In the text. The ability of a student to recognize the relationships of the facts In a passage, was thought to be of great consequence In evaluating the higher levels of comprehension.
Spache (1963) was one of the first reading researchers to determine that comprehension was arranged In a hierarchy with respect to cognitive demand. Hunnlcut (1958) reported experimental evidence to support this contention by saying that the same factors were not operating when one reads for facts and when one reads for Inference.However, Hunnlcut refrained from making judgments on these findings with regard to cognitive demand.
Spache stated. In very direct terms, that an ascending level of difficulty was apparent In the make-up of comprehension. He cited Letton's (1958) list as a reliable model to follow when distinguishing between the levels of difficulty. In order of least cognitively demanding to most cognitively demanding, there were five categories: factual, reorganization. Inferential, Interpretive, and evaluative. These five descriptors could be paralleled to the terminology of the three-level models which were discussed previously. For example. In relation to Strang,Letton's factual level corresponds to Identifying details; the reorganization. Inferential, and Interpretive levels
Reproduced with permission of the copyright owner. Further reproduction prohibited without permission.

21
corresponded to interpreting obscure metaphors and shifts; and lastly, the evaluative level corresponded to Creative and active thinking.
Spache asserted that these hierarchy levels mentioned above contain a built-in program for instruction. He suggested that lessons be planned in order to progress from the lower, or literal level, to the higher, or evaluative level. In this way, the student attained a solid foundation in the simple comprehension tasks before attempting to gain more proficiency in the more difficult areas. Spache stated what some earlier research had only implied; that the mental process of comprehension is organized in a hierarchical manner with respect to ascending difficulty, and that adeptness in the higher areas is attained only through mastery of the lower levels in an orderly and progressive manner. In short, success at the factual level
prerequisite to success at the next level, and so on.The idea of the hierarchical comprehension model be
came the functional paradigm of the reading field. Bloom (1956), along with several other researchers, attempted to produce a taxonomy dealing with a wide range of educational objectives, including comprehension. The categories of comprehension advanced by Bloom are knowledge (literal), application, analysis, and synthesis (inferential), and evaluation (critical). This work was extended by Krathwohl,
Reproduced with permission of the copyright owner. Further reproduction prohibited without permission.

22
Bloom, and Masia (1964), and became a widely used reference book in the field of education. This book, Taxonomy of Educational Objectives : The C1assification of Educational Goals. (Handbook I I : Affective Domain), alsoused the hierarchical comprehension model as its base. The terminology, however, in the Krathwohl, Bloom, and Masia book differed somewhat from the nomenclature in the Bloom taxonomy. In the former, the terms consisted of comprehension (translation, interpretation, extrapolation), application, analysis (analysis of elements, analysis of relationships, analysis of organizational principles), synthesis, and evaluation. This hierarchy was forwarded in terms of ascending difficulty.
Pearson and Johnson (1978) served to remind researchers that there was a large body of recent evidence to support the credibility of the traditional hierarchy model. In particular, Pearson and Johnson made specific statements in regard to each of the levels of comprehension. When referring to details (the literal level), these researchers stated that this comprehension aspect was only important when considering how much it aided the individual in supporting broader generalizations. This statement gave support to the bottom-up model of information processing.
Austin and Morrison (1963) added to the list of those who subscribed to thehierarchy model. These two authors
Reproduced with permission of the copyright owner. Further reproduction prohibited without permission.

23
advanced several skills which were important for the development of comprehension. Included on this list were three skills which paralleled the comprehension levels in the models which have been discussed: identifying the sequences ofideas and events, reaching a conclusion or generalization, and evaluating ideas for relevancy and authenticity.
In regard to cognitive demand, it was apparent that Austin and Morrison considered inferential or evaluative thinking to be the highest level of comprehension. They reported that teachers spent too much time in instructing children with lower level, or literal material, and too little time cultivating the inferential and critical thinking skills. They believed that teachers should plan more instructional activities in which children would have the opportunity to operate beyond the literal level of comprehension.
Guszak (1969) explored the questioning strategies of elementary teachers in relation to comprehension. This study was done in order to ascertain the level of comprehension on which teachers' questions tended to concentrate H€ gathered information for terminology to be used in the experiment, and decided upon these categories: recognition(literal comprehension skills required), recall (literal comprehension skills required), translation (literal comprehension Skills required) , conjecture (inferential comprehension
Reproduced with permission of the copyright owner. Further reproduction prohibited without permission.

24
skills required), explanation (inferential comprehension skills required), evaluation (critical comprehension skills required). These categories chosen by Guszak parallel the widely accepted three-level hierarchy comprehension model (literal level, inferential level, critical level).
Guszak found that teachers focus their questions primarily at the literal level, with most falling in the first three categories outlined in the previous paragraph.He said that although research could authoritatively point out many things about teacher questioning, it was quite another matter to pass judgment upon these practices. Therefore, he offered no discernment about whether preoccupation with literal questioning was good, bad, or neutral. This position was different from most of the authors which have already been mentioned. In these previous studies, too much attention to the literal area was thought of as neglect of the higher comprehension levels.
Another important aspect of Guszak’s study was that he refrained from identifying his hierarchy with respect to cognitive demand. Rather than label the literal area as the lowest comprehension level, the inferential area as the next level, and the critical area as the most cognitively demanding, he allowed them to be identified only in terms of what type of thinking each one required: literal(dealing with facts), inferential (dealing with interpretations and deductions not explicitly stated in the text), and
Reproduced with permission of the copyright owner. Further reproduction prohibited without permission.

critical (dealing with matters of evaluation, worth, acceptability, or probability). This concept was what eventually led researchers to probe the area of interactive-compensatory comprehension. Specific discussion of this domain would be done later in the review.
A wide range of textbooks written for courses in higher education have included the ascending hierarchy in their efforts to prepare prospective teachers. Ekwall (1976) and Barrett (1967) suggested that the cognitive dimension is organized into four categories: literal meaning, inference,evaluation (critical), and appreciation (critical). Ekwall states, however, that even though these categories were functional in regard to classroom instruction, they could not be defended in terms of factoral analysis studies.
Spache and Spache (1977) p r o v i d e d an in-depth look at comprehension as a thinking process. Using Guilford's (1960) model of reading comprehension as a guide, Spache and Spache looked at the intellect from the standpoint of several different functions. These functions included cognition^ memory, divergent production, convergent production, and evaluation. Upon close examination, these processes were seen to be related to the same foundation as most of the aforementioned ideas. Cognition and memory wererelated to the literal cognition level, divergent production and convergent production could be likened to inferential
Reproduced with permission of the copyright owner. Further reproduction prohibited without permission.
26
comprehension, and evaluation was paralleled with the skill of critical comprehension.
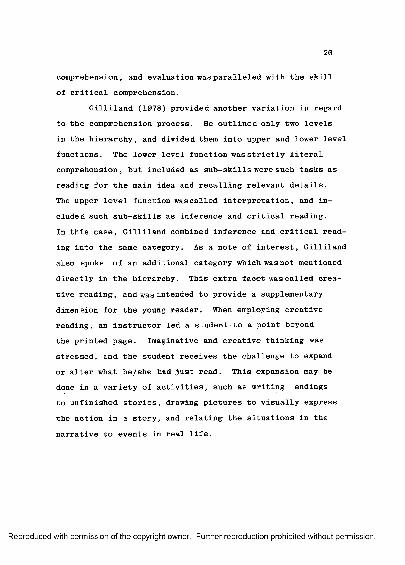
Gilliland (1978) provided another variation in regard to the comprehension process. He outlined only two levels in the hierarchy, and divided them into upper and lower level functions. The lower level function was strictly literal comprehension, but included as sub-skills were such tasks as reading for the main idea and recalling relevant details.The upper level function was called interpretation, and included such sub-skills as inference and critical reading.In this case, Gilliland combined inference and critical reading into the same category. As a note of interest, Gilliland also spoke of an additional category which was not mentioned directly in the hierarchy. This extra facet was called creative reading, and was intended to provide a supplementary dimension for the young reader. When employing creative reading, an instructor led a student to a point beyond the printed page. Imaginative and creative thinking was stressed, and the student receives the challenge to expand or alter what he/she had just read. This expansion may be done in a variety of activities, such as writing endings to unfinished stories, drawing pictures to visually express the action in a story, and relating the situations in the narrative to events in real life.
Reproduced with permission of the copyright owner. Further reproduction prohibited without permission.

27
Cheek and Cheek (1980) presented a taxonomy of comprehension skills which served as a representation of the ones which have already been discussed. Using the individual taxonomies of Bloom (1956), Sanders (1966), and Barrett (1976), these authors took diverse descriptions set forth by these different hierarchies, and classify each specific descriptor into either literal, inferential, or critical skills.
In the discussion of these three levels of comprehension, Cheek and Cheek mentioned the importance of developing the "low-level" comprehension skills. This reference was made regarding literal skills, and was followed by references to inferential and critical skills being of a more demanding level of cognition. Here, these authors made a statement about the cognitive demand of the respective comprehension skills. This statement was similar to the traditional definition of the hierarchy in that the literal, inferential, and critical areas were considered to be arranged in an ascending order of difficulty.
Up to this point, the ideas presented could be said to have several important characteristics in common: comprehension skills were divided into a hierarchy; the hierarchy was generally made up of three levels of skills, literal, inferential, and critical; these skills were arranged in an ascending order of cognitive demand, meaning that the literal domain was less cognitively demanding than the inferential.
Reproduced with permission of the copyright owner. Further reproduction prohibited without permission.

28
and the inferential was less cognitively demanding than the critical; and, the hierarchy operates in a linear manner.The processing was such that the literal areas must be proficient before the inferential areas could become operative, and that the inferential areas must become proficient before the critical areas can become operative. The work of F.B. Davis (1944; 1968) contributed to this concept significantly. Davis discussed factors of comprehension, and expanded the traditional references to the three levels by including the factor of vocabulary proficiency. Davis used this aspect and related it to comprehension in general. For example, Davis factor analyzed nine comprehension tests and found that word knowledge was tied strongly to performance in the comprehension areas.
CONCEPTS AND RESEARCH IN MEANING-EMPHASIS AND INTERACTIVE-COMPENSATORY MODELS
Stanovich (1980) related that a long-existing trend had been to represent the cognitive (information processing) mechanism as having a set of discrete stages, with each stage having its particular function, and then transferring the information to the next level. Sperling (1967) performed experiments in which three different models of the memory were used. In the third model that Sperling used, there were three separate components. In each one of these components, information was processed and then passed
Reproduced with permission of the copyright owner. Further reproduction prohibited without permission.

29
on to subsequent stages. However, Sperling did state that in studies of this kind, the experimenter could only know an individual's consciousness level by the behavior which he/ she exemplifies. In many instances, this behavior was not indicative of what was actually taking place in the cognitive mechanism. Therefore, it was necessary to pursue a path which would lead to a model which was more representative of the actual cognitive functions, rather than one whose main convenience was the way it appears on paper in a two-dimensional form. Research into meaning-emphasis and interactive-compensatory models was being pursued as a means to find this more representative paradigm.
Auerbach and Sperling (1961) presented some of the first evidence which expanded on the idea of the traditional three-level model of ascending difficulty. They stated that the idea of visual storage affected the interaction of one stage with the next stage. Therefore, a lack of visual skill could seriously impede the flow of information from one level to the next. Logically, the subskill models could not serve as a model for individuals who have visual difficulties. Theios (1973) did a study of models with discrete stages which were arranged in the manner of the traditional subskill models. This study stated that there were serious weaknesses in the subskill models. The main weakness was that these models function in a linear manner,
Reproduced with permission of the copyright owner. Further reproduction prohibited without permission.

30
Although the bottom-up (same as subskill) model presently dominates practices in most classrooms, and even many higher education settings, there are other approaches which differ from this paradigm. These alternate designs are "top-down" and "interactive-compensatory" models.
The top-down are similar to the bottom-up design in that they are both linear, and both show a directional flow of information. The bottom-up model contends that information flows in an ascending manner, or from the lower processes. The top-down model processes information from the higher structures, or in a descending manner, and relays it to the lower levels.
Goodman (1976) sets forth one model of the top-down structure. He stated that while an individual reads, the brain carried on a meaning search at the critical level, and only descended into the inferential and literal levels to process the stimulus, or gather the necessary information to process the stimulus, or gather the information to prove or disprove the original premise of the brain.As with the bottom-up models, this process was linear, where information must pass through one stage to reach another. Levin and Kaplan (1970) advocate the top-down model in the same manner as Goodman does. Eisenstadt and Kareeve (1975)
Reproduced with permission of the copyright owner. Further reproduction prohibited without permission.

31
also endorsed the top-down model by stating that top-down analyses began at the hypotheses level and then prove or disprove these hypotheses by processing the stimulus.
Although the top-down school of though represented entirely different concept in terms of directionality, it share a feature with the bottom-up model. In terms of cognitive demand, both models agreed in regard to the literal, inferential, and critical levels: the literal levelis of the least cognitive demand, the inferential level is more cognitively demanding than the literal level, and the critical level is of the greatest cognitive demand. Therefore, there is no disparity between these models when speaking in terms of the relative difficulty of the three levels of comprehension. The difference inherent in these two concepts is in terms of the direction in which the information flows.
Chomsky (1971) stated that information affecting reading comprehension was partly processed by the structure of the written language itself. This structure of the language was highly irregular, and therefore presented many possibilities to the processing mechanism. Solberg (1975) conducted research which indicated that comprehension was arranged in a top-down hierarchy which include both syntactic and semantic functions. Solberg also found that memory had an effect on the flow of information.
Reproduced with permission of the copyright owner. Further reproduction prohibited without permission.
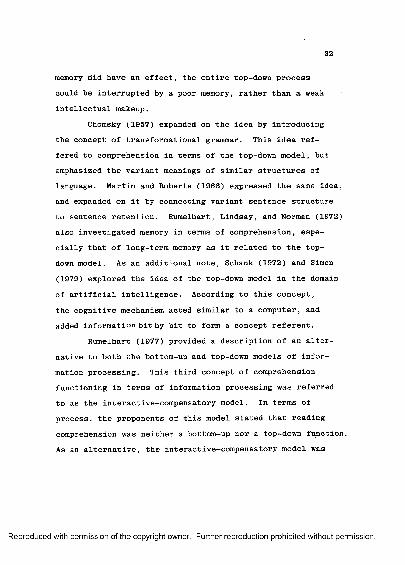
32
memory did have an effect, the entire top-down process could be interrupted by a poor memory, rather than a weak intellectual makeup.
Chomsky (1957) expanded on the idea by introducing the concept of transformational grammar. This idea ref- fered to comprehension in terms of the top-down model, but emphasized the variant meanings of similar structures of language. Martin and Roberts (1966) expressed the same idea, and expanded on it by connecting variant sentence structure to sentence retention. Rumelhart, Lindsay, and Norman (1972) also investigated memory in terms of comprehension, especially that of long-term memory as it related to the top- down model. As an additional note, Schank (1972) and Simon (1979) explored the idea of the top-down model in the domain of artificial intelligence. According to this concept, the cognitive mechanism acted similar to a computer, and added information bit by bit to form a concept referent.
Rumelhart (1977) provided a description of an alternative to both the bottom-up and top-down models of information processing. This third concept of comprehension functioning in terms of information processing was referred to as the interactive-compensatory model. In terms of process, the proponents of this model stated that reading comprehension was neither a bottom-up nor a top-down function. As an alternative, the interactive-compensatory model was
Reproduced with permission of the copyright owner. Further reproduction prohibited without permission.

33
based on the premise that information could be processed and synthesized at any point in the comprehension hierarchy. Whereas in bottom-up and top-down models information was required to begin either at the lower or higher levels of cognition, this model allowed simultaneous input to enter the hierarchy at any point.
The interactive-compensatory model functioned independently at each level. Input was free to engage all three levels of comprehension, literal, inferential, and critical. After a certain level was activated, the information was able to transfer to any other level without stopping to interact with its bordering stage. For example, if the critical thinking level of comprehension was activated according to the needs of the reader, the literal level might be activated next if the comprehension process needed this to take place. The important idea was that the flow of data need not take place in a direct manner, where the information would first have to stop and interact with the inferential stage before being allowed to enter the literal domain. The process entailed a direct flow of information from the critical to the literal areas, with the inferential domain being used as a directional link. Likewise, a direct transfer from the literal area to the critical area would also be feasible according to this model. A great deal of support for this concept was found in the work of Mosenthal, Walmsley,
Reproduced with permission of the copyright owner. Further reproduction prohibited without permission.

34
and Allington (1978). These researchers stated that interactive models differed from bottom-up and top-down models mainly from the standpoint of the relative independence of processes at different levels.
With interactive-compensatory models, a key element was that any level would place constraints upon any other level. If input stimuli initially engaged the critical level, but then required literal information to facilitate comprehension, the literal mechanism will be pressed into service by the critical level. In short, each stage might compensate for any other stage. Contrary to the bottom- up models, the activation of the higher level processes was not contingent upon employment of all the lower level processes as a prerequisite.
While many differences existed in the function of bottom-up, top-down, and interactive-compensatory models of information processing, there were two similarities which should be discussed. First, is that all three of these paradigms accepted the idea of comprehension processes which ranged from literal to critical. In terms of cognitive demand, all three also accepted the premise that the literal level was of the least cognitive demand, and the critical level required the highest cognitive functioning. Thus, the true dissimilarity among the three models existed in the idea of how the levels of comprehension interacted
Reproduced with permission of the copyright owner. Further reproduction prohibited without permission.

35
with one another, not in the definitions of the stages of comprehension therein.
The second major comparison among these three models was one of linear one-dimensionality. Although the bottom- up and top-down models were based upon a single direction and direct connections from one stage to the next, and the interactive-compensatory model was founded upon direct connection, all three operated in a linear manner confined to one dimension. Also, the bottom-up model processed information in an ascending manner, the top-down model processed in a descending manner, and the interactive-compensatory model processed in an interactive manner. The flow of information for all three models, however, was confined to one dimension and to one view of the three levels of comprehension.
Very little research had even suggested investigating the efficacy of this three-level hierarchy of cognitive demand. Handler and Johnson (1977) investigated story structure and attempted an analysis of the underlying structure of simple stories. However, these researchers did not carry the project far enough to scrutinize the validity of the three-level hierarchy. Thorndyke (1977) did research in the area of the effects of story structure and content variables on memory and comprehension of prose passages. Although Thorndyke could have suggested things
Reproduced with permission of the copyright owner. Further reproduction prohibited without permission.

36
about the three-level hierarchy, he chose to focus on varying the amount and kind of structure in passages. Farnham- Diggory (1978) investigated a related problem by looking at the cognitive integration ability of children. Harste(1978) attempted to document the personal reality of models of reading, while Kline (1979) studied the interrelationships of theories of composing and interpreting.
Further research on the interrelationships of various models and the structure of comprehension was available.Kamil (1977) discussed alternate models in reading and even suggested that any model which claims to possess a hierarchy should have evidence demonstrating the justification for such an assumption. Angus (1978) discussed several theoretical models of the reading process and stated that no model has yet proven its superiority. Mosenthal (1978) studied the multi-context models for word recognition, but did not extend the concept to include hierarchical comprehension. Juel (1978) discussed the existence of a model of cognitive operations, and suggested the cognitive mechanism extends beyond a hierarchy. Just and Carpenter (1977) approached the comprehension area from a language point of view. These researchers specifically developed the concept of internal representation of the text.
Reproduced with permission of the copyright owner. Further reproduction prohibited without permission.
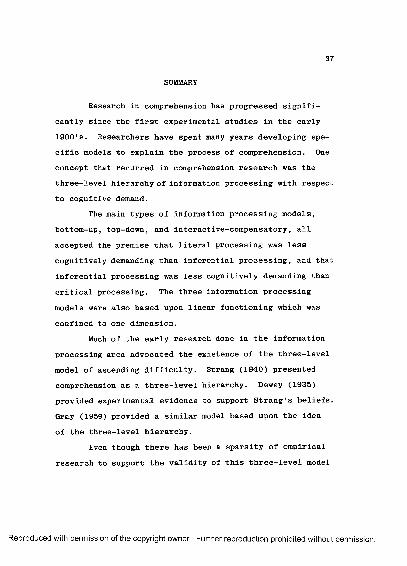
SUMMARY
Research in comprehension has progressed significantly since the first experimental studies in the early 1900's. Researchers have spent many years developing specific models to explain the process of comprehension. One concept that recurred in comprehension research was the three-level hierarchy of information processing with respect to cognitive demand.
The main types of information processing models, bottom-up, top-down, and interactive-compensatory, all accepted the premise that literal processing was less cognitively demanding than inferential processing, and that inferential processing was less cognitively demanding than critical processing. The three information processing models were also based upon linear functioning which was confined to one dimension.
Much of the early research done in the information processing area advocated the existence of the three-level model of ascending difficulty. Strang (1940) presented comprehension as a three-level hierarchy. Dewey (1935) provided experimental evidence to support Strang's beliefs. Gray (1959) provided a similar model based upon the idea of the three-level hierarchy.
Even though there has been a sparsity of empirical research to support the validity of this three-level model
Reproduced with permission of the copyright owner. Further reproduction prohibited without permission.

38
of ascending difficulty, many reading programs are still dependent upon the accuracy of the concept. There have been several questions raised about the adequacy of the model. Estes (1978) has suggested that linear models are not sufficient to represent the complicated process of comprehension. Kamil (1977) suggested that any model which claims to possess a hierarchy should have evidence demonstrating the justification of this belief.
Several research efforts have come near, to testing the validity of the three-level hierarchy of ascending difficulty, but have not differentiated the experimental results in such a way that could confirm or disconfirm the idea. Mosenthal (1978) studied the multi-context models for word recognition, but did not extend the concept to include hierarchical comprehension. Juel (1978) discussed the existence of a model of cognitive operations, but suggested that the cognitive mechanism extends beyond a hierarchy.
Reproduced with permission of the copyright owner. Further reproduction prohibited without permission.

CHAPTER 3
MATERIALS AND PROCEDURE
The SamplePermission to conduct this research was obtained
from the appropriate officials in the University Laboratory School. The sample consisted of 25 fifth graders and 25 sixth graders. Of the fifth graders, 13 were male and 12 were female. Of the sixth graders, 13 were female and 12 were male. A small sample was chosen in order to allow the examiner to test all of the children individually.
The InstrumentMaterials for this study were the Beltone Audio
meter and the California Achievement Test (levels 5 and 6; Forms C and D). The Beltone Audiometer is an instrument designed for measuring hearing acuity in decibels for pure tones and also for speech. The audiometer had a set of earphones which were placed upon the student’s head and the operator was then able to alternate sounds from one of the student's ears to the other. Of course, the sound may also occur in both ears at the same time.
39
Reproduced with permission of the copyright owner. Further reproduction prohibited without permission.

40
The California Achievement Tests (CAT) are a series of test batteries which represent different facets of language. Included in the CAT batteries are tests of pre- reading, reading, spelling, language, and mathematics.The reason the CAT was chosen for this study is because of its classification verification of the reading comprehension categories. Aaron (1981) has stated that the comprehension categories outlined in the CAT are literal, interpretive (inferential), and critical comprehension. These classifications are what is required to complete this study, and include six literal, twenty-two inferential, and twelve critical questions on each of the forms.
None of the students used were non-readers. This determination was made by the respective homeroom teachers who have been working with the students for the entire school year. Also, all of the students used were judged as able to read the material which was presented during the course of this study. This judgment was made by an inspection of each child's work folder and previous test results.
The MethodThe method used was the dual task method, where
students performed a primary task and an X-task. In this project, answering the comprehension questions was
Reproduced with permission of the copyright owner. Further reproduction prohibited without permission.

41
the primary task, and making marks according to sounds given off by the Beltone Audiometer was the X-task.
The X-task was predicated upon the theory of Kahneman (1973). This researcher has proposed a theory which involves man's limitations in the processing of information. Instead of adhering to the belief that structural bottlenecks exist in the processing of information, Kahneman assumes that there is a limit on a person's capacity to perform mental work (Figure 3.1).
Kahneman (1970) stated in an earlier work that there is evidence to indicate that an X-task is more likely to capture processing capacity when the primary task is less difficult. On the other hand, as the primary task becomes more difficult, the X-task will become less inclined to capture processing capacity, and will not be performed as proficiently. When applied to this project, Kahneman's assertion would be that the Beltone Audiometer marking task (X-task) will lose processing capacity as the comprehension questions (primary task) become more difficult.
Kahneman's assertions in regard to processing capacity were shared by some earlier researchers. Poulton (1958) performed work on primary tasks as related to secondary tasks. In some of the trials, one task was considered primary, and only spare capacity could be
Reproduced with permission of the copyright owner. Further reproduction prohibited without permission.

m is c e l l a n e o u s ^A N lfE S TA TIO N S
OF AROUSAL
AVAILABLE: CAPACITY AND ar o u sa l in c r e a s e TOMeet DEMANDSfor PR0CES5- i*^Gr CApqcirrallo c a tio n \
POLICY J
EVALUATION OF DEMANDS
ONCAPACITYPOSSIBLE
a c t iv it ie s
FIGURE 3.1 Solso’s Interpretation of Kahneman's Attention Model
Reproduced with permission of the copyright owner. Further reproduction prohibited without permission.

devoted to the secondary task. As the primary task became easier, more gravitation toward the secondary task was apparent. Tune (1964) also reported an impairment of the primary task in projects which were conducted in a similar fashion.
The ProcedureTo achieve the dual task effect in this project,
each child was tested individually. The only people present in the room were the child and the examiner.
Each subject was given a copy of the specially designed test booklet. The booklet consisted of section 16C of the CAT (comprehension section for 5th and 6th grades). This material was arranged to have the passage first, followed by a sheet with the literal questions, followed by a separate sheet with the inferential questions, followed by a separate sheet with the critical questions.On each sheet containing the various types of questions, a grid was present in the lower right part of the page.The grid was designed in such a way as to allow the students to make the appropriate marks when an X-task was required. The test booklet is contained in the appendices.
The subject was given the directions regarding how to proceed. There was no time limit when the subject was reading the passages. After each passage, the
Reproduced with permission of the copyright owner. Further reproduction prohibited without permission.

subject moved on to answer the questions. While the questions were being answered, the examiner sent random signals from the Beltone Audiometer into either the left or right earphones of the subject. The subject had to make the appropriate mark on the grid in the lower right part of the paper in order to indicate whether the sound came through the left or right ear. The Beltone Audiometer was set on 30 DB at 2000 HZ in order to allow any person with a normal range of hearing acuity to be able to perform the task. Arrangements were made with the homeroom teachers to exclude those students with known hearing losses. Also, when answering the comprehension questions, the students were not allowed to look back on the text sheet to find the answer. The answers to the comprehension questions were indicated by circling the desired response from the selection of multiple choice items.
Data was collected in the form of correct and incorrect responses from the primary as well as the X-task. Percentages of correct responses for the primary task were compared in each category of literal, inferential, and critical questions. Percentages of correct responses were also used to compare the categories of the X-task that were being marked while the respective literal, inferential and critical questions were being answered as
Reproduced with permission of the copyright owner. Further reproduction prohibited without permission.

the primary task. In addition to whole-group data, the results were also analyzed by grade and by sex.
A form D of the CAT was also given. However, the X-task was not employed when administering this form D.
Statistical TreatmentHypotheses 1-21 were tested by employing the
null hypothesis. The criterion of rejection for the rejection of the null hypothesis was significance at the .01 level of significance. The specific statistical instrument for hypotheses 1-21 was the formula to deduce the significance of the difference between two percents. The three key elements in this formula are P (percent correct), Q (1-p), and N (size of sample). The formula uses the critical ratio as the final number to reject or accept the null hypothesis, and is shown as follows (Garrett,,1966).
SE% = / a p = ^ CD% =
( P , - P , ) - 0
Each category of literal, inferential, and critical questions was tested against each other within each hypothesis. The corresponding categories for the X-task were also tested against each other within the individual hypotheses.
Reproduced with permission of the copyright owner. Further reproduction prohibited without permission.

STATISTICAL FINDINGS AND DISCUSSION
IntroductionThe frequencies of the correctly answered literal,
inferential, and critical questions were measured by the California Achievement Test (levels 5 and 6; forms C and D). The frequencies of correctly answered responses to the X-task were measured by the Beltone Audiometer. This instrument was set on 30DB at 2000 HZ.
Each hypothesis was divided into 3 different categories. These categories, respectively, compared correct literal to correct inferential responses, correct literal to correct critical responses, and correct inferential to correct critical responses. For the X-task hypotheses, the literal, inferential and critical areas represent the number of correct X-task responses which took place while those types of questions were being asked.
The statistical instrument used for the analysis of each hypothesis was the significance of the difference between two percents. Each segment of each hypothesis was
46
Reproduced with permission of the copyright owner. Further reproduction prohibited without permission.

47
tested at the ,01 level of significance, and was reported as a one-tailed test.
The format of this chapter is outlined as follows. Each hypothesis is stated in the original order of presentation. The hypothesis is followed by a table which presents the quantitative data, and by a discussion of the statistical findings. The chapter is concluded by a summary and general discussion of the findings as they are related to each other.
Reproduced with permission of the copyright owner. Further reproduction prohibited without permission.

Hypothesis 1In the whole group data (CAT form 0), there is no
significant difference among levels.
TABLE 1Differences Between Correct Responses to CAT Form C Questions at Each Level of the Three-Level Hier
archy for Whole Group Data
No. of Percentages Levels Compared Students Correct D Sî^ CR
Lit. to Infer. 50 L (70.7)1(74.5)3.8 4.46 .85Lit. to Crit. 50 L (70.7) I (63.0) 7.7 4.71 1.63Infer, to Crit. 50 1 (74.5)Ç (63.0)11.5 4.64 *2.61
p £ .01 level is significance ♦Significant difference found in this area.
Statistical Findings and DiscussionThe data for the literal to inferential area showed
that the respective percentages (70.7) (74.5) translated into a standard error of 4.46. This represented a critical ratio of .85. The literal to critical area had percentages of (70.7) (63.0), a standard error of 4.71, and a critical ratio of 1.63. The inferential to critical area showed percentages of (74.5) (63.0), a standard error
Reproduced with permission of the copyright owner. Further reproduction prohibited without permission.
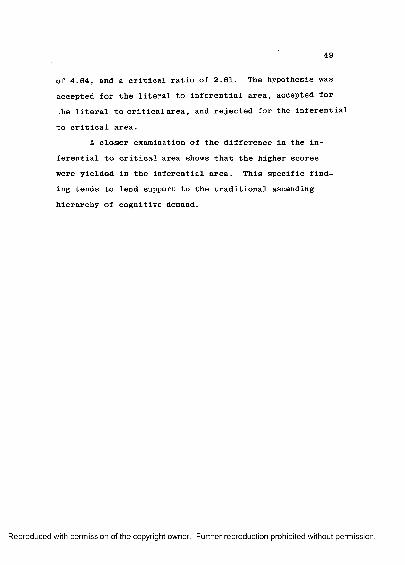
49
of 4.64, and a critical ratio of 2.61. The hypothesis was accepted for the literal to inferential area, accepted for the literal to critical area, and rejected for the inferential to critical area.
A closer examination of the difference in the inferential to critical area shows that the higher scores were yielded in the inferential area. This specific finding tends to lend support to the traditional ascending hierarchy of cognitive demand.
Reproduced with permission of the copyright owner. Further reproduction prohibited without permission.

Hypothesis 2In the 5th grade data (CAT form C), there is no
significant difference among levels.
TABLE 2Differences between Correct Responses to CAT
Form C Questions at Each Level of the Three-Level Hierarchy for 5th Grade
Data
No. of Percentage Levels Compared Students Correct D 8Eg CR
Lit. to Infer. 25 L(66.0) 1(69.6) 3.6 6.61 .54Lit. to Crit. 25 L(66.0) £(54.3)11.7 6.92 1.69Infer, to Crit. 25 1(69.6) £(54.3)15.3 6.87 2.23
p .01 level of significance.
Statistical Findings and DiscussionThe data for the literal to inferential area showed
that the respective percentages (66.0) (69.6) translated into a standard error of 6.61. This represented a critical ratio of .54. The literal to critical area had percentages of (66.0) (54.3), a standard error of 6.92, and a critical ratio of 1.69. The inferential to critical area showed percentages of (69.6) (54.3), a standard error of 6.87, and a critical ratio of 2.23. The hypothesis was accepted
Reproduced with permission of the copyright owner. Further reproduction prohibited without permission.

51
for the literal to inferential area, accepted for theliteral to critical area, and accepted for the inferentialto critical area.
Reproduced with permission of the copyright owner. Further reproduction prohibited without permission.

Hypothesis 3In the 5th grade male data (CAT form C), there is
no significant difference among levels.
TABLE 3Differences Between Correct Responses to CAT
Form C Questions at Each Level of the Three-level Hierarchy for 5th Grade
Male Data
Levels No. of PercentagesCompared Students Correct D SEjj CR
Lit. to Infer. 13 L(?1.8) 1.(76.2) 4.4 8.60 .51Lit. to Crit. 13 L(71.8) C(58.3)13.5 9.35 1.44Infer, to Crit. 13 1(76.2) C(58.3)17.9 9.20 1.95
p £ .01 level of significance.
Statistical Findings and DiscussionThe data for the literal to inferential area showed
that the respective percentages (71.8) (76.2) translated into a standard error of 8.60. This represented a critical ratio of .51. The literal to critical area had percentages of (71.8) (58.3), a standard error of 9.35, and a critical ratio of 1.44. The inferential to critical area showed percentages of (76.2) (58.3), a standard error of 9.20, and a critical ratio of 1.95. The hypothesis was
Reproduced with permission of the copyright owner. Further reproduction prohibited without permission.

53
accepted for the literal to inferential area, accepted forthe literal to critical area, and accepted for theinferential to critical area.
Reproduced with permission of the copyright owner. Further reproduction prohibited without permission.

Hypothesis 4In the 5th grade female data (CAT form C), there
is no significant difference among levels.
TABLE 4Differences Between Correct Responses to CAT Form C
Questions at Each Level of the Three-Level Hierarchy for 5th Grade Female Data
Levels No. of PercentagesCompared Students Correct D SE^ CR
Lit. to Infer. 12 L(59.7) (62.5) 2.8 9.95 .28Lit. to Crit. 12 L(59.7) Ç(50.0) 9.710.16 .95Infer, to Crit. 12 L (62.5) ç (50.0) 12.5io.12 1.24
p _< .01 level of significance.
Statistical Findings and DiscussionThe data for the literal to inferential area showed
that the respective percentages (59.7) (62.5) translated into a standard error of 9.95. This represented a critical ratio of .28. The literal to critical area had percentages of (59.7) (50.0), a standard error of 10.16, and a critical ratio of .95. The inferential to critical area showed percentages of (62.5) (50.0), a standard error of 10.12, and a critical ratio of 1.24. The hypothesis was accepted for the literal to inferential area, accepted
Reproduced with permission of the copyright owner. Further reproduction prohibited without permission.

for the literal to critical area, and accepted for theinferential to critical area.
Reproduced with permission of the copyright owner. Further reproduction prohibited without permission.
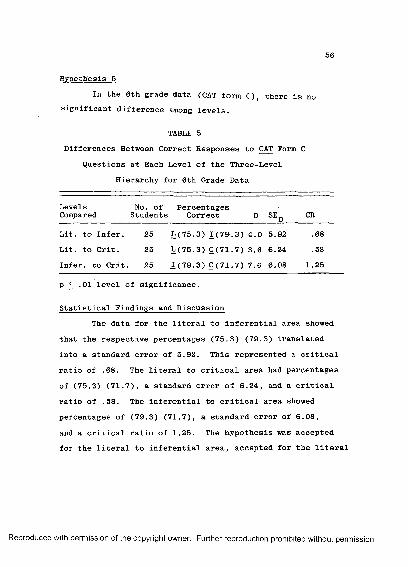
Hypothesis 5In the 6th grade data (CAT form C), there is no
significant difference among levels.
TABLE 5Differences Between Correct Responses to CAT Form C
Questions at Each Level of the Three-Level Hierarchy for 6th Grade Data
Levels No. of PercentagesCompared Students Correct D 8E^ CR
Lit. to Infer. 25 L(75.3) I (79.3) 4.0 5.92 .68Lit. to Crit. 25 L(75.3) C(71.7) 3.6 6.24 .58Infer, to Crit. 25 I (79.3)Ç (71.7) 7.6 6.08 1.25
p ^ .01 level of significance.
Statistical Findings and DiscussionThe data for the literal to inferential area showed
that the respective percentages (75.3) (79.3) translated into a standard error of 5.92. This represented a critical ratio of .68. The literal to critical area had percentages of (75.3) (71.7), a standard error of 6.24, and a critical ratio of .58. The inferential to critical area showed percentages of (79.3) (71.7), a standard error of 6.08, and a critical ratio of 1.25. The hypothesis was accepted for the literal to inferential area, accepted for the literal
Reproduced with permission of the copyright owner. Further reproduction prohibited without permission.

to critical area, and accepted for the inferential to critical area.
Reproduced with permission of the copyright owner. Further reproduction prohibited without permission.

Hypothesis 6In the 6th grade male data (CAT form C), there is
no significant difference among levels.
TABLE 6Differences Between Correct Responses to CAT Form C
Questions at Each Level of the Three-Level Hierarchy for 6th Grade Male Data
Levels No. of PercentagesCompared Students Correct
Lit. to Infer. 12 L(76.4) 1(83.3) 6.9 8.19 .84Lit. to Crit. 12 L(76.4) C(71.5) 4.9 s.96 .55Infer, to Crit. 12 1(83.3) C(7 1 .5)11-8 8.54 1.38
p ^ .01 level of significance.
Statistical Findings and DiscussionThe data for the literal to inferential area showed
that the respective percentages (76.4) (83.3) translated into a standard error of 8.19. This represented a critical ratio of .84. The literal to critical area had percentages of (76.4) (71.5), a standard error of 8.96, and a critical ratio of .55. The inferential to critical area showed percentages of (83.3) (71.5), a standard error of 8.54, and a critical ratio of 1.38. The hypothesis was accepted for the literal to inferential area, accepted for
Reproduced with permission of the copyright owner. Further reproduction prohibited without permission.

the literal to critical area, and accepted for theinferential to critical area.
Reproduced with permission of the copyright owner. Further reproduction prohibited without permission.

60
Hypothesis 7In the 6th grade female data (CAT form C), there is
no significant difference among levels.
TABLE 7Differences Between Correct Responses to CAT Form C
Questions at Each Level of the Three-Level Hierarchy for 6th Grade Female Data
Levels No. of PercentagesCompared . Students Correct D SE^ CR
Lit. to Infer. 13 L(74.4) 1(75.5) 1.18.50 .13Lit. to Crit. 13 L(74.4) C(71.8> 2.6 8.70 .30Infer, to Crit. 13 1(75.5) C(71.8) 3.7 8.64 .43
p ^ .01 level of significance.
Statistical Findings and DiscussionThe data for the literal to inferential area showed
that the respective percentages (74.4) (75.5) translated into a standard error of 8.50. This represented a critical ratio of .13. The literal to critical area had percentages of (74.4) (71.8), a standard error of 8.70, and a critical ratio of .30. The inferential to critical area showed percentages of (75.5) (71.8), a standard error of 8.64, and a critical ratio of .43. The hypothesis was accepted for the literal to inferential area, accepted for the
Reproduced with permission of the copyright owner. Further reproduction prohibited without permission.
literal to critical area, and accepted for the inferentialto critical area.
Reproduced with permission of the copyright owner. Further reproduction prohibited without permission.

62
Hypothesis 8In the whole group data for the X-task, there
is no significant difference among categories of correct responses which are performed while the literal, inferential, and critical comprehension questions are being answered.
TABLE 8Differences Between Correct X-Task Responses Performed While Answering Questions at Each Level of the Three-Level Hierarchy for
Whole Group Data
ComparedNo . of Students
PercentagesCorrect D SEp CR
Lit. to Infer. 50 l (87.2 ) i (80.0 ) 7 . 2 3.70 1.95Lit. to Crit. 50 L (87.2) ç(83.4) 3,8 3.54 1.07Infer, to Crit. 50 ^(80.0) ç(83.4) 3.4 3.87 .88
p ^ .01 level of significance.
Statistical Findings and DiscussionThe data for the literal to inferential area showed
that the respective percentages (87.2) (80.0) translated into a standard error of 3.70. This represented a critical ratio of 1.95. The literal to critical area had percentages of (87.2) (83.4), a standard error of 3.54, and a critical ratio of 1.07. The inferential to critical area showed
Reproduced with permission of the copyright owner. Further reproduction prohibited without permission.

63
percentages of (80.0) (83.4), a standard error of 3.87, and a critical ratio of .88. The hypothesis was accepted for the literal to inferential area, accepted for the literal to critical area, and accepted for the inferential to critical area.
Reproduced with permission of the copyright owner. Further reproduction prohibited without permission.

64
Hypothesis 9In the 5th grade data for the X-task, there is
no significant difference among categories of correct responses which are performed while the literal, inferential, and critical comprehension questions are being answered.
TABLE 9Differences Between Correct X-task Responses Performed
While Answering Questions at Each Level of the Three-Level Hierarchy for 5th Grade Data
Levels No. of PercentagesCompared Students Correct D SEp CR
Lit. to Infer. 25 L(84.7) I (78.6) 6.1 5.47 1.12Lit. to Crit. 25 L(84.7) C(78.8) 5.9 5.46 1.08Infer, to Crit 25 1(78.6) C(78.8) .2 5.79 .03
p ^ .01 level of significance.
Statistical Findings and DiscussionThe data for the literal to inferential area showed
that the respective percentages (84.7) (78.6) translated into a standard error of 5.47. This represented a critical ratio of 1.12. The literal to critical area had percentages of (84.7) (78.8), a standard error of 5.46, and a critical ratio of 1.08. The inferential to critical area showed
Reproduced with permission of the copyright owner. Further reproduction prohibited without permission.

65
percentages of (78.6) (78.8), a standard error of 5.79, and a critical ratio of .03. The hypothesis was accepted for the literal to inferential area, accepted for the literal to critical area, and accepted for the inferential to critical area.
Reproduced with permission of the copyright owner. Further reproduction prohibited without permission.

Hypothesis 10In the 5th grade male data for the X-task, there
is no significant difference among categories of correct responses which are performed while the literal, inferential, and critical comprehension questions are' being answered.
TABLE 10Differences Between Correct X-task Responses Performed
While Answering Questions at Each Level of the Three-Level Hierarchy for 5th Grade Male Data
LevelsCompared
No. of Students
PercentagesCorrect D SEj) CR
Lit. to Infer. 13 L(81.4)X78.0) 3.4 7.89 .43Lit. to Crit. 13 L(81.4)0(82.9) 1.5 7,51 .20Infer, to Crit, 13 I(78.0)C(82.9) 4.9 7.78 .62
p £ .01 level of significance.
Statistical Findings and DiscussionThe data for the literal to inferential area showed
that the respective percentages (81.4) (78.0) translated into a standard error of 7.89. This represented a critical ratio of .43. The literal to critical area had percentages of (81.4) (82.9), a standard error of 7.51, and a critical ratio of .20. The inferential to critical area showed
Reproduced with permission of the copyright owner. Further reproduction prohibited without permission.

67
percentages of (78.0) (82.9), a standard error of 7.78, and a critical ratio of .62. The hypothesis was accepted for the literal to inferential area, accepted for the literal to critical area, and accepted for the inferential to critical area.
Reproduced with permission of the copyright owner. Further reproduction prohibited without permission.

68
Hypothesis 11In the 5th grade female data for the X-task, there
is no significant difference among categories of correct responses which are performed while the literal, inferential, and critical comprehension questions are being answered.
TABLE 11Differences Between Correct X-task Responses Performed While Answering Questions at Each Level of the Three-
Level Hierarchy for 5th Grade Female Data
N o . of PercentagesCompared Students Correct D SEd CR
Lit. to Infer. 12 L (88.2) I (79.3) 8.9 7.53 1.18Lit. to Crit. 12 L (88.2) Ç (74.3)13.9 7.97 1.74Infer, to Crit 12 I (79.3) C(74.3) 5.9 8.62 .58
p £ .01 level of significance.
Statistical Findings and DiscussionThe data for the literal to inferential area showed
that the respective percentages (88.2) (79.3) translated into a standard error of 7.53. This represented a critical ratio of 1.18. The literal to critical area had percentages of (88.2) (74.3), a standard error of 7.97, and a critical ratio of 1.74. The inferential to critical
Reproduced with permission of the copyright owner. Further reproduction prohibited without permission.

69
area showed percentages of (79.3) (74.3), a standard error of 8.62, and a critical ratio of .58. The hypothesis was accepted for the literal to inferential area, accepted for the literal to critical area, and accepted for the inferential to critical area.
Reproduced with permission of the copyright owner. Further reproduction prohibited without permission.

Hypothesis 12In the 6th grade data for the X-task, there Is
no significant difference among categories of correct responses which are performed while the literal, inferential, and critical comprehension questions are being answered.
TABLE 12Differences Between Correct X-task Responses Performed
While Answering Questions at Each Level of the Three-Level Hierarchy for 6th Grade Data
Levels No. of PercentagesCompared Students Correct D SEp CR
Lit. to Infer. 25 l(89.7) l(81.4) 8.3 4.98 1.67
Lit. to Crit. 25 l(89.7) ç(88.0) 1 . 7 4.45 .38
Infer, to Crit. 25 j[(81.4) c(88.0) 6 . 6 5.09 1.30
p ^ .01 level of significance.
Statistical Findings and DiscussionThe data for the literal to inferential area showed
that the respective percentages (89.7) (81.4) translated into a standard error of 4.98. This represented a critical ratio of 1.67. The literal to critical area had percentages of (89.7) (88.0), a standard error of 4.45, and a critical ratio of .38. The inferential to critical area showed percentages of (81.4) (88.0), a standard error of
Reproduced with permission of the copyright owner. Further reproduction prohibited without permission.

5.09, and a critical ratio of 1.30. The hypothesis was accepted for the literal to inferential area, accepted for the literal to critical area, and accepted for the inferential to critical area.
Reproduced with permission of the copyright owner. Further reproduction prohibited without permission.

Hypothesis 13In the 6th grade male data for the X-task, there
is no significant difference among categories of correct responses which are performed while the literal, inferential, and critical comprehension questions are being answered.
TABLE 13Differences Between Correct X-task Responses Performed
While Answering Questions at Each Level of the Three-Level Hierarchy for 6th Grade Male Data
ComparedNo. of Students
PercentagesCorrect D SEd CR
Lit. to Infer. 12 L(94.1) I (85.4) 8.7 6.19 1.41Lit. to Crit. 12 L(94.1) C(88.9) 5.2 5.69 .91Infer, to Crit. 12 1^(85.4) C(88.9) 3.5 6.83 .51
p £ .01 level of significance.
Statistical Findings and DiscussionThe data for the literal to inferential area showed
that the respective percentages (94.1) (85.4) translated into a standard error of 6.19. This represented a critical ratio of 1.41. The literal to critical area had percentages of (94.1) (88.9), a standard error of 5.69, and a critical ratio of .91. The inferential to critical area
Reproduced with permission of the copyright owner. Further reproduction prohibited without permission.

73
showed percentages of (85.4) (88.9), a standard error of 6.83, and a critical ratio of .51. The hypothesis was accepted for the literal to inferential area, accepted for the literal to critical area, and accepted for the inferential to critical area.
Reproduced with permission of the copyright owner. Further reproduction prohibited without permission.

74
Hypothesis 14In the 6th grade female data for the X-task, there
is no significant difference among categories of correct responses which are performed while the literal, inferential, and critical comprehension questions are being answered.
TABLE 14Differences Between Correct X-task Responses Performed
While Answering Questions at Each Level of the Three-Level Hierarchy for 6th Grade Female Data
Levels N o . of PercentagesCompared Students Correct D SEp CR
Lit. to Infer. 13 L(85.6) 1(77.6) g.O 7.90 1.01Lit. to Crit. 13 L(85.6) C(87.2) i.e 6.72 .24Infer, to Crit, 13 1(77.6) C(87.2) 9.6 7.47 1.29
p ^ .01 level of significance.
Statistical Findings and DiscussionThe data for the literal to inferential area showed
that the respective percentages (86.6) (77.6) translated into a standard error of 7.90. This represented a critical ratio of 1.01. The literal to critical area had percentages of (85.6) (87.2), a standard error of 6.72, and a critical ratio of .24. The inferential to critical area
Reproduced with permission of the copyright owner. Further reproduction prohibited without permission.

75
showed percentages of (77.6) (87.2), a standard error of 7.47, and a critical ratio of 1.29. The hypothesis was accepted for the literal to inferential area, accepted for the literal to critical area, and accepted for the inferential to critical area.
Reproduced with permission of the copyright owner. Further reproduction prohibited without permission.

Hypothesis 15In the whole group data (CAT form D), there is
no significant difference among levels.
TABLE 15Differences Between Correct Responses to CAT Form D
Questions at Each Level of the Three-Level Hierarchy for Whole Group Data
Levels No. of PercentagesCompared Students Correct D SE^ CR
Lit. to Infer. 50 L(80.0) i(72.5) 7.5 4.26 1.76Lit. to Crit. 50 L(80.0) ç(67.5)12.5 4.40 *2.84Infer, to Crit. 50 1(72.5) ç(67.5) 5,0 4.58 1.09
p ^ .01 level of significance.♦Significant difference found in this area.
Statistical Findings and DiscussionThe data for the literal to inferential area showed
that the respective percentages (80.0) (72.5) translated into a standard error of 4.26. This represented a critical ratio of 1.76. The literal to critical area had percentages of (80.0) (67.5), a standard error of 4.40, and a critical ratio of 2.84. The inferential to critical area showed percentages of (72.5) (67.5), a standard error of 4.58, and a critical ratio of 1.09. The hypothesis was
Reproduced with permission of the copyright owner. Further reproduction prohibited without permission.

77
accepted for the literal to inferential area, rejectedfor the literal to critical area, and accepted for theinferential to critical area.
A closer examination of the difference in the literal to critical area shows that the higher scores were yielded in the literal area. This specific finding gives support to the traditional hierarchy model.
Reproduced with permission of the copyright owner. Further reproduction prohibited without permission.

Hypothesis 16In the 5th grade data (CAT form D), there is
significant difference among levels.
TABLE 16Differences Between Correct Responses to CAT Form D
Questions at Each Level of the Three-Level Hierarchy for 5th Grade Data
Levels No. of PercentagesCompared Students Correct D SEj CR
Lit. to Infer. 25 L(78.7) j[(68.2)10.5 6.25 1.68Lit. to Crit. 25 L(78.7) ç(60.0)18.7 6.52 *2.87Infer, to Crit. 25 1(68.2) ç(60.0) 8.2 6.78 1.21
p 1 .01 level of significance.♦Significant difference found in this area.
Statistical Findings and DiscussionThe data for the literal to inferential area showed
that the respective percentages (78.7) (68.2) translated into a standard error of 6.25. This represented a critical ratio of 1.68. The literal to critical area had percentages of (78.7) (60.0), a standard error of 6.52, and a critical ratio of 2.87. The inferential to critical area showed percentages of (68.2) (60.0), a standard error of 6.78, and a critical ratio of 1.21. The hypothesis was
Reproduced with permission of the copyright owner. Further reproduction prohibited without permission.

79
accepted for the literal to inferential area, rejected forthe literal to critical area, and accepted for theinferential to critical area.
A closer examination of the difference in the literal to critical area shows that the higher scores were yielded in the literal area. This specific finding gives support to the traditional model.
Reproduced with permission of the copyright owner. Further reproduction prohibited without permission.
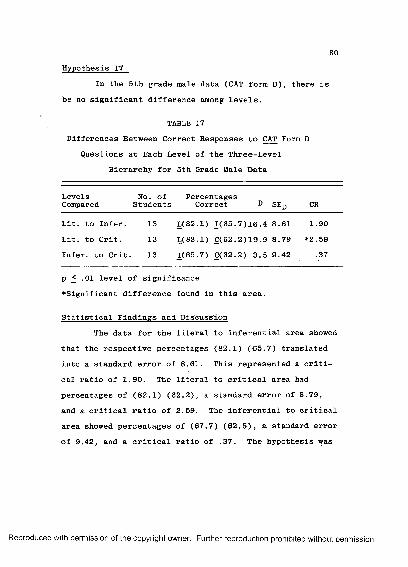
80Hypothesis 17
In the 5th grade male data (CAT form D), there isbe no significant difference among levels.
TABLE 17Differences Between Correct Responses to CAT Form D
Questions at Each Level of the Three-Level Hierarchy for 5th Grade Male Data
Levels No. of PercentagesCompared Students Correct D SEg CR
Lit. to Infer. 13 L(82.1) j[(65.7)16.4 8.61 1.90Lit. to Crit. 13 L(82.1) C(62.2) 19.9 8.79 *2.59Infer, to Crit. 13 J[(65.7) C(62.2) 3.5 9.42 .37
p ^ .01 level of significance ♦Significant difference found in this area.
Statistical Findings and DiscussionThe data for the literal to inferential area showed
that the respective percentages (82.1) (65.7) translated into a standard error of 8.61. This represented a critical ratio of 1.90. The literal to critical area had percentages of (82.1) (62.2), a standard error of 8.79, and a critical ratio of 2.59. The inferential to critical area showed percentages of (67.7) (62.5), a standard error of 9.42, and a critical ratio of .37. The hypothesis was
Reproduced with permission of the copyright owner. Further reproduction prohibited without permission.

81
accepted for the literal to inferential area, rejected for the literal to critical area, and accepted for the inferential to critical area.
A closer examination of the difference in the literal to critical area shows that the higher scores were yielded in the literal area. This specific finding is in support of the traditional model.
Reproduced with permission of the copyright owner. Further reproduction prohibited without permission.

Hypothesis 18In the 5th grade female data (CAT form D), there
is no significant difference among levels.
TABLE 18Differences Between Correct Responses to CAT Form D
Questions at Each Level of the Three-Level Hierarchy for 5th Grade Female Data
Levels No. of PercentagesCompared Students Correct D SEg CR
Lit. to Infer. 12 l(75.0) (70.8) 4.2 9.07 .46Lit. to Crit. 12 g75.0) £(57.6)17.4 9.65 1.80Infer, to Crit. 12 ^(70.8) 0(57.6)13.2 9.79 1.35
p .01 level of significance.
Statistical Findings and DiscussionThe data for the literal to inferential area showed
that the respective percentages (75.0) (70.8) translated into a standard error of 9.07. This represented a critical ratio of .46. The literal to critical area had percentages of (75.0) (57.6), a standard error of 9.56, and a critical ratio of 1.80. The inferential to critical area showed percentages of (70.0) (57.6), a standard error of 9.79, and a critical ratio of 1.35 The hypothesis was accepted for the literal to inferential area, accepted for
Reproduced with permission of the copyright owner. Further reproduction prohibited without permission.

the literal to critical area, and accepted for theinferential to critical area.
Reproduced with permission of the copyright owner. Further reproduction prohibited without permission.

Hypothesis 19In the 6th grade data (CAT form D), there is
no significant difference among levels.
TABLE 19Differences Between Correct Responses to CAT Form D
Questions at Each Level of the Three-Level Hierarchy for 6th Grade Data
Levels No. of PercentagesCompared_______ Students_____ Correct______ D SE^_____ CR_____
Lit. to Infer. 25 L(81.3) 1(76.7) 4. 6 5.75 .80Lit. to Crit. 25 L(81.3) C(75.0) 6.3 5.84 1.08Infer, to Crit. 25 1(76.7) C(75. 0) 1.7 6.05 .28
p .01 level of significance.
Statistical Findings and DiscussionThe data for the literal to inferential area showed
that the respective percentages (81.3) (76.7) translated into a standard error of 5.76. This represented a critical ratio of .80. The literal to critical area had percentages of (81.3) (75.0), a standard error of 5.84, and a critical ratio of 1.08. The inferential to critical area showed percentages of (76.7) (75.0), a standard error of 6.05, and a critical ratio of .28. The hypothesis was accepted for the literal to inferential area, accepted for
Reproduced with permission of the copyright owner. Further reproduction prohibited without permission.

the literal to critical area, and accepted for theinferential to critical area.
Reproduced with permission of the copyright owner. Further reproduction prohibited without permission.
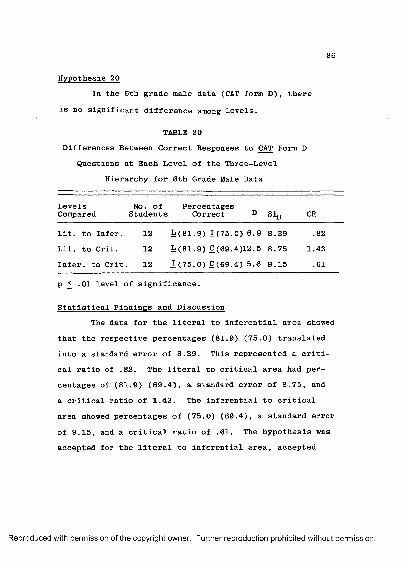
Hypothesis 20In the 6th grade male data (CAT form D), there
is no significant difference among levels.
TABLE 20Differences Between Correct Responses to CAT Form D
Questions at Each Level of the Three-Level Hierarchy for 6th Grade Male Data
Levels No. of PercentagesCompared Students Correct D CR
Lit. to Infer. 12 L(81.9) 1(75.0) 6.9 8.39 .82Lit. to Crit. 12 L (81. 9) Ç (69.4)12. 5 8.75 1.43Infer, to Crit. 12 1(75.0) C(69.4) 5.6 9.15 .61
p £ .01 level of significance.
Statistical Findings and DiscussionThe data for the literal to inferential area showed
that the respective percentages (81.9) (75.0) translated into a standard error of 8.39. This represented a critical ratio of .82. The literal to critical area had percentages of (81.9) (69.4), a standard error of 8.75, and a critical ratio of 1.43. The inferential to critical area showed percentages of (75.0) (69.4), a standard error of 9.15, and a critical ratio of .61. The hypothesis was accepted for the literal to inferential area, accepted
Reproduced with permission of the copyright owner. Further reproduction prohibited without permission.

for the literal to critical area, and accepted for theinferential to critical area.
Reproduced with permission of the copyright owner. Further reproduction prohibited without permission.

Hypothesis 21In the 6th grade female data (CAT form D), there
is no significant difference among levels.
TABLE 21Differences Between Correct Responses to CAT Form D
Questions at Each Level of the Three-Level Hierarchy for 6th Grade Female Data
Levels No. of PercentagesCompared Students Correct D SE]) OR
Lit. to Infer. 13 L(80.8) (78.3) 2.5 7.91 .32Lit. to Crit. 13 L(80.8) £(80.1) .7 7.78 .09Infer, to Crit. 13 2(78.3) £(80.1) 1.8 7.96 .23
p 2 .ol level of significance.
Statistical Findings and DiscussionThe data for the literal to inferential area showed
that the respective percentages (80.8) (78.3) translated into a standard error of 7.91. This represented a critical ratio of .32. The literal to critical area had percentages of (80.8) (80.1), a standard error of 7.78, and a critical ratio of .09. The inferential to critical area showed percentages of (78.3) (80.1), a standard error of 7.96, and a critical ratio of .23. The hypothesis was accepted for the literal to inferential area, accepted
Reproduced with permission of the copyright owner. Further reproduction prohibited without permission.

for the literal to critical area, and accepted for theinferential to critical area.
Reproduced with permission of the copyright owner. Further reproduction prohibited without permission.

90
General Discussion of the HypothesesHypothesis 1 showed a significant difference in the
inferential to critical area. A closer examination of this difference reveals that the higher scores were yielded in the inferential area. This finding tends to lend support to the traditional ascending hierarchy of cognitive demand.
The first hypothesis also indicated no differences in the literal to inferential and the literal to critical areas. Contrary to what the inferential to critical area portrayed, this finding is in opposition to the traditional ascending hierarchy of cognitive demand.
Hypotheses 2-14 revealed no differences in any of the three comparison levels. Again, like two areas of the first hypothesis, this is a pattern which is contrary to tradition.
Hypothesis 15 showed a significant difference in the literal to critical area. A closer examination of this difference reveals that the higher scores were registered in the literal area. This finding gives support to the traditional hierarchy model.
The fifteenth hypothesis also indicated no differences in the literal to inferential and the inferential to critical areas. This is in opposition, once again, to the traditional model.
Reproduced with permission of the copyright owner. Further reproduction prohibited without permission.

91
Hypothesis 16 showed a significant difference in the literal to critical area. A closer examination of this difference reveals that the higher scores were yielded in the literal area. The traditional model is supported by this finding.
The sixteenth hypothesis also indicated no differences in the literal to inferential and the inferential to critical areas. This contradicts the traditional hierarchy.
Hypothesis 17 showed a significant difference in the literal to critical area. A closer examination of this difference reveals that the higher scores were registered in the literal area. As with the previous differences registered, this finding is in support of the traditional hierarchy.
The seventeenth hypothesis also indicated no differences in the literal to inferential and the inferential to critical areas. The traditional hierarchy is again refuted in these two categories.
Hypotheses 18-21 revealed no differences in any of the three comparison levels. This pattern is also a contradiction of the traditional hierarchy of cognitive demand.
The concurrent X-task for hypothesis 1 shows no significant differences in the X-task levels. However,
Reproduced with permission of the copyright owner. Further reproduction prohibited without permission.

92
the inferential to critical area shows that the latter captured more processing capacity than the former. When this is compared to the inferential to critical difference registered in hypothesis 1, an interesting observation can be made. Even though no significant difference was registered in the X-tasks, the raw data reflects no consistent pattern of difficulty with the primary tasks. The same is true for the other hypotheses where differences were registered. These other hypotheses are numbers 15, 16, and 17.
According to Kahneman's (1973) processing theory, the particular X-task being performed at the same time as the most difficult primary task should capture the least processing capacity. Since the X-tasks did not show a consistent pattern in relation to the primary tasks, it is logical to assume that the primary tasks showed an irregular pattern as well. In addition, the raw data showed that each of the three categories, literal, inferential, and critical, each totalled the most processing capacity at one time or another during the course of the experiment. This appears to be a denial of any steadfast hierarchy of cognitive demand.
Reproduced with permission of the copyright owner. Further reproduction prohibited without permission.

SUMMARY, CONCLUSIONS, AND RECOMMENDATIONS
IntroductionThis final section will discuss five things; give
a brief summary of the study, state the conclusions of the study in direct relation to the experimental hypotheses, address the original statement of the problem with respect to the conclusions, make recommendations for practioners, and make recommendations for researchers.
SummaryThe objective of this research has been to study
the three-level hierarchy of information processing with respect to cognitive demand. The study addressed the problem of differences between the most commonly used levels of comprehension, literal, inferential, and critical.
The main types of information processing models, bottom-up, top-down, and interactive-compensatory, all accept the premise that literal processing is less cognitively demanding than inferential processing, and that inferential processing is less cognitively demanding than critical processing. Estes (1978), and others, have
93
Reproduced with permission of the copyright owner. Further reproduction prohibited without permission.

94
suggested that this model is not adequate to represent the complicated process of comprehension.
In order to test whether differences existed in ' these three level of comprehension, fifty students were chosen and individually tested. The instrument used was the California Achievement Test. This test gathered data in terms of comprehension questions. The method used was the dual task method, where students performed the primary task above, as well as a secondary task. The secondary task employed an audiometer, and required students to mark a grid according to sounds in the left or right ears.
Results from an analysis of the data showed that for the primary task, only four of a possible forty-two areas showed differences. For the secondary task (X-task), none of the possible twenty-one areas showed differences. The data provided strong evidence to deny the existence of statistically significant differences among the three levels of comprehension with respect to cognitive demand.
Recommendations made to practitioners include a suggestion to classroom teachers to use a variety and mixture of questions at all levels. Another practical suggestion was made to publishers of educational materials and recommended the curtailment of materials which assign absolute cognitive demand values.
Recommendations for researchers included a suggestion for a larger sample, as well as a call for a
Reproduced with permission of the copyright owner. Further reproduction prohibited without permission.

95
more difficult secondary task. The major suggestion in this category dealt with the need to find a better measure of difficulty for comprehension questions, such as internal measures rather than external measures.
ConclusionsThe conclusions of the study are as follows.1. For 5th and 6th grades as a group (CAT form C),
there were no significant differences between the literal to inferential and the literal to critical levels. A significant difference did exist for the inferential to critical levels.
2. For 5th grade (CAT form C), there were no significant differences among levels.
3. For 5th grade males (CAT form C), there were no significant differences among levels.
4. For 5th grade females (CAT form C), there wereno significant differences among levels.
5. For 6th grade (CAT form C), there were no significant differences among levels.
6. For 6th grade males (CAT form C), there were no significant differences among levels.
7. For 6th grade females (CAT form C), there wereno significant differences among levels.
8. For 5th and 6th grades performing an X-task, there were no significant differences among categories of
Reproduced with permission of the copyright owner. Further reproduction prohibited without permission.

correct responses which were performed while literal, inferential, and critical comprehension questions were being answered.
9. For 5th grade performing an X-task, there were no significant differences among categories of correct responses which were performed while literal, inferential, and critical comprehension questions are being answered.
10. For 5th grade males performaing an X-task, there were no significant differences among categories of correct responses which were performed while literal, inferential, and critical comprehension questions were being answered.
11. For 5th grade females performing an X-task, there were no significant differences among categories of correct responses which were performed while literal, inferential and critical comprehension questions were being answered.
12. For 6th grade performing an X-task, there were no significant differences among categories of correct responses which were performed while literal, inferential, and critical comprehension questions were being answered.
13. For 6th grade males performing an X-task, therewere no significant differences among categories of correct responses whichwere performed while literal
Reproduced with permission of the copyright owner. Further reproduction prohibited without permission.

97
inferential, and critical comprehension questions were being answered.
14. For 6th grade females performing an X-task, there were no significant differences among categories of correct responses which were performed while literal, inferential, and critical comprehension questions were being answered.
15. For 5th and 6th grades as a group (CAT form D), there were no significant differences between the literal to inferential and the inferential to critical levels.A significant difference did exist for the literal to critical levels.
16. For 5th grade (CAT form D) , there were no significant differences between the literal to inferential and the inferential to critical levels. A significant difference did exist for the literal to critical levels.
17. For 5th grade males (CAT form D), thereno significant differences between the literal to inferential and the inferential to critical levels. A significant difference did exist for the literal to critical levels.
18. For 5th grade females (CAT form D), there were no significant differences among levels.
19. For 6th grade (CAT form D), there were no significant differences among levels.
20. For 6th grade males (CAT form D), there were no significant differences among levels.
Reproduced with permission of the copyright owner. Further reproduction prohibited without permission.

21. For 6th grade females (CAT form D), there wereno significant differences among levels.
Resolution of the Problem StatementThe original statement of the problem is as follows.Is there a difference, in terms of cognitive demand,
among the three levels of comprehension in the information processing models?
1. In terms of responses to comprehension questions, is there a difference among levels?
2. In terms of a secondary task, is there a difference among the levels while the secondary task is being performed?
In response to number one, there were only four differences found among the levels. Fifth and 6th graders, as a large group, manifested differences when comparing the inferential to the critical comprehension responses.This was true with or without the performance of a secondary task.
In addition, 5th graders showed a difference only when comparing the literal to the critical comprehension responses which were given in the absence of a secondary task. This also held true for 5th grade males as a separate group.
With the exception of the four categories shown above, the data overwhelmingly indicated that there were
Reproduced with permission of the copyright owner. Further reproduction prohibited without permission.

no significant differences among the three levels of comprehension with respect to cognitive demand. Of the forty- two possible areas, thirty-eight showed no significant difference.
In response to number two, the secondary tasks indicated that there were no significant differences among the secondary task areas which corresponded to each comprehension area. Even though the raw data, in some instances, showed directional differences, none of these were statistically significant. Of the twenty-one possible areas, twenty-one showed no significant difference. As with number one, the data provided strong evidence to deny differences among the three levels of comprehension with respect to cognitive demand.
Recommendations for PractitionersThe recommendations for practitioners are as
follows.1. Classroom teachers should use a variety and
mixture of levels when questioning students. Most educational materials, and many basal manuals, are designed with clusters of questions in the literal, inferential, and critical areas. For example, the first three questions dealing with a passage may be all literal, the next four all inferential, and so on. There does not seem to be any rational justification for this, since some literal
Reproduced with permission of the copyright owner. Further reproduction prohibited without permission.

100
questions may even require more cognitive demand than some inferential questions. In many cases, teachers may make instructions more efficient by formulating the questions themselves.
2. Publishers of educational materials should curtail the development of materials which assign absolute cognitive demand values to the three major comprehension
Recommendations for ResearchersThe recommendations for researchers are as follows.1. Test approximately one hundred to one hundred
twenty-five children on an individual basis. Although the individual testing of the fifty children in this study rendered a very good range of data for analysis, this researcher feels that more differences may have occurred by using a larger sample.
2. Make the secondary task more difficult. A distinct possibility of more differences would exist by altering the secondary task. For example, the audiometer could have been set lower, or two marks in the grid could have been required instead of one.
3. Develop a better measure of comprehension difficulty. Although right or wrong answers provide us with the most salient means to measure the difficulty of comprehension questions, it is not yet clear if they actually
Reproduced with permission of the copyright owner. Further reproduction prohibited without permission.

101
represent an individual's cognitive functioning. A more logicial path would be to develop an internal rather than an external way to measure difficulty. Also,measures which do not test previous knowledge would also be desirable. Neuropsychology may well be able to make a monumental contribution in these areas.
Reproduced with permission of the copyright owner. Further reproduction prohibited without permission.

BIBLIOGRAPHY
Aaron, Ira E. Personal communication by letter concerning comprehension sections of a number of tests, Annual Yearbook of Reading, 1981.
Angus, Elizabeth. ’'What is Reading? A Comparison ofThree Models of the Reading Process," paper prepared at York University. Ontario, Canada, 1978.
Austin, Mary C . , and Coleman Morrison. The Pirst R:The Harvard Report on Reading in Elementary Schools. New York, New York: The Macmillan Co. , 1963.
Averbach, E., and G. Sperling. Information Theory.London, England: Butterworth Publishing, 1961.
Barrett, Thomas C., (Ed.). The Evaluation of Children’sReading Achievement. Perspectives in Reading No. 8. Newark, Delaware: International Reading Association,1967.
Barrett, Thomas C. , and R. Smith. Teaching Reading in the Middle Grades. Reading, Massachusetts: Addition-Wesley, 1976.
Betts, Emmett A. Foundations of Reading Instruction.New York, New York : American Book Co., 1946.
Bloom, Benjamin S., (Ed.). Taxonomy of Educational Objectives : The Classification of Educational Goals(Handbook Cognitive Domain). New York, New York: Longmans, Green and Co., Inc., 1956.
Chall, Jeanne. Learning to Read: The Great Debate.New York, New York: McGraw-Hill, 1967.
Cheek, Martha C. , and Earl H. Cheek, Jr. Diagnostic- Prescriptive Reading Instruction : A Guide forClassroom Teachers. Dubuque, Iowa: William C.Brown,1980.
Chomsky, N. Syntactic Structures. The Hague : Moutonand Co., 1957.
Reproduced with permission of the copyright owner. Further reproduction prohibited without permission.

Chomsky, N. "Deep Structure, Surface Structure, andSemantic Interpretation," In Semantics, edited by D. Steinberg and L. Jakebovits. London, England: Cambridge University Press, 1971.
Courtis, Stuart A. , and Regina R. Heller. "ExercisesDeveloped at Detroit for Making Reading Function," The Twentieth Yearbook of the National Society for the Study of Education, Part II. Bloomington, Illinois: Public School Publishing Co., 1921.
Davis, F.B. "Fundamental Factors of Comprehension in Reading," Psychometrika, 9 (1955) 185-197.
Dewey, Joseph C. "The Acquisition of Facts as a Measureof Reading Comprehension," Elementary School Journal, 35 (January, 1935) 346-48.
Eisenstadt, M . , and Y. Kareev. "Aspects of Human Problem Solving: The Use of Internal Representations." InExplorations in Cognition, edited by D.A. Norman and D.E. Rumelhart. San Francisco, California: W.H.Freeman, 1975.
Ekwall, Eldon E. Diagnosis and Remediation of the Disabled Reader. Boston, Massachusetts: Allyn andBacon, Inc., 1976.
Estes, Thomas H. "Congruence in Philosophy and Pedagogy of Reading," paper presented at the annual meeting of the International Reading Association. Houston, Texas, 1978.
Farnham-Diggory, S. "On the Logic and Pitfalls of Logo- graph Research," Journal of Experimental Child Psychology, 25 (April, 1978) 366-70.
Fry, Edward. "Fry's Readability Graph: Clarifications,Validity, and Extension to Level 17," Journal of Reading, 21 (December 1977) 242-52.
Garrett, Henry E. Statistics in Psychology and Education. New York, New York: David McKay Co., Inc., 1966.
Gates, Arthur I. The Improvement of Reading. New York,New York : The Macmillan Co., 1927.
Reproduced with permission of the copyright owner. Further reproduction prohibited without permission.

Gilliland, Hap. A Practical Guide to Remedial Reading.Columbus, Ohio: Charles E. Merrill Publishing Co.,1978.
Goodman, K.S. ’’Reading: A Psycholinguistic GuessingGame.” In Theoretical Models and Processes of Reading, edited by H. Singer and R. Ruddell.Newark, Delaware: International ReadingAssociation, 1976.
Gray, Lillian. Teaching Children to Read. New York,New York: The Ronald Press Co., 1957.
Guilford, J.P. ’’Frontiers in Thinking that Teachers Should Know About,” The Reading Teacher, 13 (February, 1960) 176-82.
Guszak, Frank J. ’’Questioning Strategies of Elementary Teachers in Relation to Comprehension.” In Elementary Reading Instruction: Selected MaterialsII, edited by Althea Beery, Thomas C. Barrett, and William R. Powell. Boston, Massachusetts: Allynand Bacon, Inc., 1974.
Guthrie, John T. Comprehension and Teaching. Newark,Delaware: International Reading Association, 1981.
Harste, Jerome C. , and Carolyn L. Burke. ’’Toward aPsycholinguistic Model of Reading Comprehension,” Viewpoints in Teaching and Learning, 54 (July, 1978) 9-34.
Horowitz, Leonard M. Elements of Statistics for Psychology and Education. New York, New York : McGraw-Hill,Inc., 1974.
Huey, Edmund Burke. The Psychology and Pedagogy ofReading. New York, New YOrk: The Macmillan Co.,1908.
Hunnicut, C.W., and William J. Iverson, (Eds.). Research in the R ’s . New York, New York: Harper andBrothers, 1958.
Juel, Connie. ”A Cognitive Model of Reading for Elementary School Students,” paper presented at the annual meeting of the American Educational Research Association. Toronto, Canada, 1978.
Reproduced with permission of the copyright owner. Further reproduction prohibited without permission.

Just, Marcel A., and Patricia A. Carpenter. CognitiveProcesses in Comprehension. Somerset, New Jersey:John A. Wiley and Sons, 1977.
Kahneman, Daniel. "Remarks on Attention Control,"Acta Psychologica. 33 (1970) 118-32.
Kamil, Michael. "Alternative Models in Reading Comprehension," paper presented at the annual meeting of the International Reading Association. Miami, Florida, 1977.
Keast, David. "Reading: Eight to Thirteen," Education,7 (1979) 48-53.
Kline, Charles R., Jr., "An Hermeneutical Conceptualization of Reading," paper presented at the annual meeting of the conference on College Composition and Communication. Minneapolis, Minnesota, 1979.
Krathwohl, David R., Bloom, Benjamin S., and Bertram B. Masia. Taxonomy of Educational Objectives:The Classification of Educational Goals (Handbook II : Affective Domain). New York, New York:David McKay Co., Inc., 1964.
Letton, Mildred C. "Evaluating the Effectiveness of Teaching Reading." In Evaluation of Reading, (Supplementary Education Monographs, No. 88). Chicago, Illinois: University of Chicago Press,1958.
Levin, H . , and E.L. Kaplan. "Grammatical Structureand Reading." In Basic Studies in Reading, edited by H. Levin and J. Williams. New York, New York: Basic Books, 1970.
Lombard, John W. "Review of California AchievementTests." In The Eighth Mental Measurements Yearbook, edited by Oscar Kristen Buros. Highland Park,New Jersey: The Gryphon Press, 1978.
Lyman, R.L. "An Investigation of Technique in Reading," School Review, 31 (January, 1923) 11.
Handler, Jean M., and Nancy S. Johnson. "Remembranceof Things Parsed: Story, Structure and Recall,"Cognitive Psychology, 9 (January, 1977) 111-51.
Reproduced with permission of the copyright owner. Further reproduction prohibited without permission.

Martin, E., and K.H. Roberts. "Grammatical Factors in Sentence Retention," Journal of Verbal Learning and Verbal Behavior, 5 (1966) 211-18.
Miller, Janet A. "Strategies for Diagnosing and Developing Comprehension Skills," Viewpoints in Teaching and Learning, 54 (July, 1978) 97-106.
Mosenthal, P., Walmsley, S., and R. Allington. "WordRecognition Reconsidered: Toward a Multi-ContextModel," Visible Language. 12 (1978) 448-68.
Moss, Joy F. "Using the 'Focus Unit' to Enhance Children's Responses to Literature," Language Arts, 55 (April, 1978) 482-88.
Pearson, P. David, and Dale D. Johnson. Teaching Reading Comprehension. New York, New York: Holt,Rinehart and Winston, 1978.
Poulton, E.C. "Primary Tasks and Spare Capacity," Ergonomics, 1 (1958) 234-39.
Rumelhart, D. "Toward an Interactive Model of Reading,"In Attention and Performance VI, edited by S. Dornic. Hillsdale, New Jersey: Erlbaum Associates, 1977.
Rumelhart, D. , Lindsay, P., and D. Norman. "A ProcessModel for Long-Term Memory." In Organization and Memory, edited by E. Tulving and W. Donaldson.New York, New York : Academic Press, Inc., 1972.
Rumelhart, D . , and A. Ortony. "Representation of Knowledge." In Schooling and the Acquisition of Knowledge. edited by R.C. Anderson, R.J. Spiro, and W.E. Montague. Hillsdale, New Jersey:Lawrence Erlbaum Associates, 1977.
Sanders, Norris M. Classroom Questions--------- What Kinds?New York, New York : Harper and Row, 1966.
Schank, R. "Conceptual Dependency: A Theory of NaturalLanguage Understanding," Cognitive Psychology, 3 (1972) 552-631.
Simon, Herbert A. Models of Thought. New Haven, Connecticut: Yale University Press, 1979.
Smith, Nila B. American Reading Instruction. New York,New York: Silver, Burdett and Co., 1934.
Reproduced with permission of the copyright owner. Further reproduction prohibited without permission.

Solberg, Kenneth B. "Linguistic Theory and InformationProcessing." In Understanding Language, edited by Dominic W. Massaro. New York, New York: AcademicPress, Inc., 1975.
Solso, Robert L. Cognitive Psychology. New York, New York: Harcourt Brace Jovanovich, Inc., 1979.
Spache, George D. Toward Better Reading. Champaign, Illinois: Garrard Publishing Co., 1963.
Spache, George, and Evelyn B. Spache. Reading in theElementary School. Boston, Massachusetts: Allynand Bacon, Inc., 1977.
Sperling, G. "Successive Approximations to a Model for Short-Term Memory," Acta Psychologica, 27 (1967) 285-292.
Stanovich, Keith E. "Toward an Interactive-Compensatory Model of Individual Differences in the Development of Reading Fluency," Reading Research Quarterly.16 (1980) 32-71.
Starch, Daniel. Journal of Educational Psychology.Baltimore, Maryland: Warwick and York, 1915.
Strang, Ruth. Problems in the Improvement of Reading in High School and College. Lancaster, Pennsylvania: The Science Press Printing Company, 1940.
Theios, J. "Reacting Time Measurements in the Study of Memory Processes: Theory and Data." In ThePsychology of Learning and Motivation: Advancesin Research and Theory, edited by G. Bower. New York, New York: Academic Press, 1973.
Thorndike, E.L. "Reading as Reasoning: A Study ofMistakes in Paragraph Reading," Journal of Educational Psychology, 8 (1917) 323-332.
Thorndyke, Perry W. "Cognitive Structures in Comprehension and Memory of Narrative Discourse," Cognitive Psychology, 9 (January, 1977) 77-110.
Tune, G.S. "The Introduction of Secondary Tasks,"British Journal of Psychology, 55 (1964) 415-419.
Reproduced with permission of the copyright owner. Further reproduction prohibited without permission.

APPENDICES
Reproduced with permission of the copyright owner. Further reproduction prohibited without permission.

CALIFORNIA ACHIEVEMENT TEST Form 16C
Copyright 1978 by McGraw-Hill, Inc.
Reproduced with permission of the copyright owner. Further reproduction prohibited without permission.

110
The vacant lot on Third Avenue has been just a rock pile until two students, Margo and Bert, turned it into a garden. The flowers they planted bloomed all summer long. But one morning in September, a construction worker broke some upsetting news to Margo and Bert. The garden was to be bulldozed for a parking lot.
"But our street doesn't need a parking lot!" protested Margo. The construction worker just shrugged his shoulders and walked away.
"There must be something we can do," said Margo dispairingly. Bert shook his head. "It’s no use. Nobody cares about our garden."
"Let's take a survey to find out what our neighbors really think," Margo suggested. Bert agreed.
The following Saturday they interviewed the people who lived in the neighborhood. Bert met Ms. Lewis, who was rushing down the street. "Ms. Lewis, what do you think of the plans to turn our garden into a parking lot?"
"I think it's about time they did. There's no place to park around here!" she answered sharply, and hurried away.
Meanwhile, Margo knocked on Mr. Quigley's door. He greeted her with a friendly smile and listened to her story. "That's terrible," he sympathized. "That garden in the only cheerful patch of color around."
Reproduced with permission of the copyright owner. Further reproduction prohibited without permission.

Ill
The students spent the rest of the day knocking on doors. They found only nineteen people who wanted the parking lot. Forty-one people were against it and wanted to save the garden. Yet Margo and Bert had not solved the problem.
Then Bert asked, "Isn't there a committee in charge of city improvements? Maybe they would help us get permission to make our garden into a park for everyone to enjoy."
"Maybe," replied Margo, "but it won't be easy. Do you think they'll listen to us?"
"Well, we won't know until we try!" answered Bert.
Reproduced with permission of the copyright owner. Further reproduction prohibited without permission.

At the beginning of the story, why were the students upset?a) Ms. Lewis answered them sharply.b) Their garden was going to be bulldozed.c) Mr. Quigley wouldn't listen to them.d) Nineteen people wanted a parking lot.
Reproduced with permission of the copyright owner. Further reproduction prohibited without permission.

Why did the students think the survey might help?a) It would delay the bulldozers.b) It would persuade people to work in the garden.c) It would change the construction worker's mind.d) It would show the city that most people wanted the
garden.
When Bert talked to Ms. Lewis, she seemed to be:a) scornful.b) regretful.c) astonished.d) frightened.
How did Bert feel just after hearing the construction worker's news?a) amazed.b) relieved.c) ashamed.d) discouraged.
Reproduced with permission of the copyright owner. Further reproduction prohibited without permission.

114
What will the students probably do with the results of the survey?a) Show them to Ms. Lewis.b) Present them to a committee.c) Use them for a school report.d) Given them to the construction worker.
In the story, Mr. Quigley was different from Ms. Lewis because he :a) knew the students.b) wanted to keep the garden.c) lived in the neighborhood. ^d) answered the survey questions.
Which of the following words best describes Margo?a) lazy.b) silly.c) practical.d) unpleasant.
Reproduced with permission of the copyright owner. Further reproduction prohibited without permission.
lis
stepping into Pie Alley is as surprpsing as opening a door and finding yourself in a far-off jungle. Pie Alley seems remote from the city. Even though the sun shines brightly on the broad downtown streets, Pie Alley remains cool, dark, and forgotten. It seems tucked away in the back pocket of the city.
The swinging doors of Anatol's Cafe slap open, releasing a surprising murmur of talk and laughter, the plinking of an old piano, and the smell of fried food sizzling on a back-kitchen grill. A laughing group of people stroll out of the café and into the alley. The rat-a-tat-tat of a stick beating on trash cans mixes with the laughter and the tinkling of the piano. The air is alive with the sounds of the Pie Alley symphony.
Reproduced with permission of the copyright owner. Further reproduction prohibited without permission.

Why is stepping into Pie Alley like "opening a door and finding yourself in a far-off jungle"?a) Pie Alley is an unusual place.b) Pie Alley is very far from the city.c) Pie Alley is as dark and damp as a jungle.d) Pie Alley is entered through swinging doors.
Which of the following phrases describes the alley as though it relates to a person?a) "of an old piano"b) "in a far-off jungle" Lc) "in the back pocket of the city"d) "on the broad downtown streets"
The phrase "rat-a-tat-tat describes the sound of the:a) stick beating.b) food sizzling.c) doors swinging.d) people laughing.
Reproduced with permission of the copyright owner. Further reproduction prohibited without permission.

The author says "the air is alive" because it:a) is moving.b) can be seen.c) is very warm.d) is filled with noises.
Reproduced with permission of the copyright owner. Further reproduction prohibited without permission.

118
The following is a speech given by a candidate for class president.
My fellow classmates, my name is Jerry Collins. I'm standing here beneath our school safety patrol award, asking you to join the large number of intelligent people backing me for class president. I have letters from Lynn Tokubo, this year's science award winner, and Pete Anders, winner of the sports medal, saying they will vote for me.
I am good at organizing things. I will work hard.I am unselfish. I am loyal. Don't be fooled into a vote you will be sorry for. We need a better student government. Vote for the best person for the job. Vote for Jerry Collins for class president.
Reproduced with permission of the copyright owner. Further reproduction prohibited without permission.
Which of the following does the candidate do throughout the speech?a) Make obviously true statements.b) Make only favorable comments about himself.c) Provide enough facts to back up his statements.d) Tell specific faults of the present student government.
Why does the candidate describe himself as "unselfish" and "loyal"?a) The students described him that way.b) All candidates have those characteristics. ^ ^c) He thinks people consider those to be
desirable qualities.d) He wants to seem different from the
sports medal winner.
What is this speech trying to get the listeners to do?a) Vote for a candidate.b) Earn a science awared.c) Promote school safety.d) Run for class president.
Reproduced with permission of the copyright owner. Further reproduction prohibited without permission.
On a hot day in 1843, a thin black woman wearing a gray dress, white turban, and sunbonnet left New York City. She left with a bag of clothes, twenty-five cents, and a new name. Born a slave named Isabella Baumfree, she had been freed in 1827 by New York State's Emancipation Act.As a slave, she had worked long, hard days in the fields. After being freed, she had been a house servant. She had helped slaves who escaped to the North find homes and jobs. Now she had changed her name to Sojourner Truth and was setting out to preach and sing about God, the evils of slavery, and the joy of being free.
Even though she could not read or write. Sojourner Truth was a powerful speaker. She was over six feet tall and had a booming voice and expressive, appealing eyes.Her simple words and songs attracted huge crowds. She influenced many people to join the fight against slavery.
When the Civil War began in 1861, Sojourner Truth raised money to buy gifts for Union soldiers by giving lectures and singing. She went into the camps and distributed the gifts herself. While traveling from one Union camp to another, she often gathered information about the Confederate troops, which she passed along to the next Union camp.
Reproduced with permission of the copyright owner. Further reproduction prohibited without permission.

After the Civil War, Sojourner Truth continued her public speaking. Now, however, she spoke about women's rights, a cause she had worked for since she had attended the first Women's Rights Convention in Worcester, Massachusetts, in 1850. She inspired women to work for the vote, equal pay, and equal rights under the law. At eighty years of age, ill health forced Sojourner Truth to give up her lecture tours. However, her message continued to inspire people everywhere.
Reproduced with permission of the copyright owner. Further reproduction prohibited without permission.

What did Sojourner Truth find for escaped slaves?a) new names.b) lecture halls.c) clothes and food.d) places to live and work.
After the Civil War, Sojourner Truth worked asa) spy.b) farm worker.c) house servant.d) public speaker.
Reproduced with permission of the copyright owner. Further reproduction prohibited without permission.

Why did Sojourner Truth leave New York City?a) To change her name.b) To tell about slavery.c) To escape from slavery.d) To see more of the country.
Sojourner Truth lectured for money so that she could:a) help slaves to escape.b) obtain gifts for soldiers.c) retire from public life.d) attend a Women's Rights Convention. ,
This passage shows that Sojourner Truth probably thought that women:a) were not ready to vote.b) should be house servants.c) were protected by the courts.d) should have the same rights as men.
Reproduced with permission of the copyright owner. Further reproduction prohibited without permission.
This story gives the impression that Sojourner Truth was :a) dull.b) frail.c) quiet.d) energetic.
This passage is mainly about Sojourner Truth's:a) efforts to gain rights for others.b) life and work in the fields.c) escape to the North.d) gifts to the soldiers.
Reproduced with permission of the copyright owner. Further reproduction prohibited without permission.

Concrete Pipe
To me, this old concrete pipeis the secret brain center of the world, the biggest spaceship, the deepest cave, the longest tunnel, a haunted house, a submarine, the home of the queen.
Like a lizard that changes colors,I can live in different worlds.
Like treasures in a pirate chest, my secrets are hidden in this old concrete pipe.
Reproduced with permission of the copyright owner. Further reproduction prohibited without permission.

Why does the author say the pipe is a haunted house?a) It is very long.b) It is full of treasures.c) It is mysterious inside.d) It can change color frequently.
What do the author and a lizard have in common?a) They both like haunted houses.b) They both have hidden treasures.c) They both live in caves and tunnels.d) They both can change themselves in some way.
What are the author's secrets compared to?
a) colors.b) worlds.c) treasures.d) submarines.
Reproduced with permission of the copyright owner. Further reproduction prohibited without permission.

The following is the text of a radio commercial.
Wake up, Americans! Taste bright, bubbling Bub-L, America's most popular new soft drink. Don't waste your time with inferior substitutes. Bub-L has been proved by our testing laboratory to be good for you.
Beverly Gray, well-known tennis star, says, "It's wonderful. I drink it all the time."
"It's great!" says Jack Lance, world famous mountain climber. Join the smiling millions whose lives have been made happier by Bub-L!
Reproduced with permission of the copyright owner. Further reproduction prohibited without permission.
Why does the commercial use the words "great” and "wonderful"?a) To keep the listener alert.b) To give the listener positive thoughts about the drink.c) To make the listener feel the opposite of what is stated.d) To tell the listener how to describe the drink to
other people.
The commercial suggests that if you buy Bub-L you will:a) enjoy life more.b) have to work harder. L Rc) be wasting your time.d) be taking part in a laboratory test.
The phrase "inferior substitutes" is used to describe :a) laboratory tests.b) other soft drinks.c) foods that are not healthy.d) people who are not famous.
Reproduced with permission of the copyright owner. Further reproduction prohibited without permission.

129
For many years people dreamed of traveling under thesea. Alexander the Great may have been the first person touse a submarine vessel. He explored the floor of theMediterranean Sea in a glass barrel more than 2000 years ago. His only companion was a rooster, because people of that time thought that the rooster was a good luck symbol.
In Italy during the fifteenth century, Leonardo da Vinci designed submarines that were much like those built hundreds of years later. Leonardo kept his plans secret.He feared people would use submarines for war.
Leonardo was correct. The one person Turtle, built by David Bushnell, was used during the American Revolution to attack a British ship in New York Harbor. During the Civil War the South claimed that their submarines sank thirty-four Union ships. In World War I Germany used submarines, which were called U-boats. They proved to bedeadly raiders of the Atlantic Ocean. In World War II almost every fighting nation used submarines.
The submarine has also had peaceful uses. In this century an American named Simon Lake designed submarines and tested them in the Chesapeake Bay. They were built to explore under the water, to search for sunken ships, and to mine gold from the ocean floor. More recently, the use of nuclear power has made it possible for submarines to go faster than surface ships. They can also travel
Reproduced with permission of the copyright owner. Further reproduction prohibited without permission.

b e n e a th storms and ice, and remain under the water for weeks. In 1960 the American submarine Triton went around the world. It covered 41,600 miles in only eighty-four days. Perhaps, sometime submarines will be the major carriers of cargo and passengers across the world's oceans.
Reproduced with permission of the copyright owner. Further reproduction prohibited without permission.

According to the passage, where was the glass barrel submerged?a) in Chesapeake Bayb) in New York Harborc) in the Atlantic Oceand) in the Mediterranean Sea
Which of the following events happened last?a) U-boat raids.b) The Turtle attack.c) The Triton voyage.d) Alexander's exploration.
According to the passage, when was a rooster used as a good luck symbol?a) In 1960.b) During World War I.c) More than 2000 years ago.d) During the fifteenth century.
Reproduced with permission of the copyright owner. Further reproduction prohibited without permission.
Leonardo da Vinci feared that, if he revealed his plans for submarines, people would:a) consider him foolish.b) think the plans were inaccurate.c) use the plans to build weapons for war.d) prevent the development of submarines.
Which of the following titles best tells what this passage is about?a) "Submarines at War".b) "Ancient Submarines". L Rc) "Nuclear Submarines".d) "Submarines through the Years".
Which of the following will future submarines probably resemble?a) U-boats.b) The Triton.c) A barrel.d) The Turtle.
Reproduced with permission of the copyright owner. Further reproduction prohibited without permission.

Simon Lake was like Alexander the Great because they both:a) used vessels for undersea exploration.b) tested submarines in New York Harbor.c) lived in the fifteenth century.d) kept their plans secret.
Reproduced with permission of the copyright owner. Further reproduction prohibited without permission.
The following are letters to a city newspaper.
Editor :I want the sports program in our city's schools to
continue. So I shall vote for Proposition 9 next week. Defeating Proposition 9 would end sports and their lasting effects on students. If sports are dropped, many chances for building character and skills will be lost. The people who are against this proposition are a selfish, thoughtless group. Thier actions will hurt our whole city. Girls and boys will not gain school spirit and self-confidence, two of the most important parts of growing up.
Carol Phelps, Owner Phelps's Sports Store
Editor ;Schools should give the best education to the most
students. It is wrong to spend huge amounts of ourschool money on a few students who are athletes. Schoolsports are often unfair to people. To much importanceis placed on winning. The people who are for Proposition9 are selfish glory seekers. They are trying to help asmall select group. No one will miss school sports whenthey are gone. Defeating Proposition 9 will increaseopportunities for all students.
Lester Hatfield Parent
Reproduced with permission of the copyright owner. Further reproduction prohibited without permission.

What is probably the main reason Carol Phelps supports the sports program?a) She owns a sports store.b) She coaches a school team.c) She enjoys watching school sports events.d) She likes people who take part in school sports.
Which of the following states a fact?a) Few students like sports.b) Sports have beneficial effects on students.c) People who oppose Proposition 9 are selfish. Ld) Sports are part of the present school
programWhich of the following is an opinion expressed in Carol Phelps' letter?
c)
d)
It is expensive to have school sports. School sports place too much importance on winning.School spirit is one of the most important parts of growing up.There are many opportunities for taking part in sports at school.
Reproduced with permission of the copyright owner. Further reproduction prohibited without permission.

Lester Hatfield calls supporters of Proposition 9 "selfish glory seekers" in order to:a) make the supporters understand him.b) show the supporters his skill with words.c) create a poor impression of the supporters.d) remain completely objective about the supporters.
Which of the following states Lester Hatfield's opinion?a) Sports competition helpd build character.b) Too many students are interested in sports.c) School spirit is improved by sports L R
programs.d) Too much importance is placed on winning
on sports.
Both Carol Phelps and Lester Hatfield agree that :a) the benefits of sports outweigh the cost.b) no will miss sports when they are gone.c) defeating Proposition 9 will end school
sports.d) sports provide many opportunities for
building character.
Reproduced with permission of the copyright owner. Further reproduction prohibited without permission.

CALIFORNIA ACHIEVEMENT TEST Form 16D
Copyright 1978 by McGraw-Hill, Inc.
Reproduced with permission of the copyright owner. Further reproduction prohibited without permission.

138
The students in Ms. Odum's class arrived at Jarrett Cave early Saturday morning. They were eager to become spelunkers too. For weeks they had been studying about caves and how people called spelunkers explore them. At last the students were going to have a chance to be spelunkers too.
Ms. Odum and her assistant, Jed Jackson, were checking the equipment outside the cave. The class, anxious to begin, crowded around the entrance. Ron and Karen started to duck into the cave, but Ms. Odum, who had outlined the safety rules, called them back.
Before entering the cave, the students began to record their field notes. Shana quickly and carefully recorded the temperature. The others laughed as they watched him.
Finally the group prepared to go inside the cave. Jed and Ms. Odum turned their caps around backwards and put on head lamps. The students were given flashlights. They entered the cave and stood still until their eyes grew used to the dim light. Jed told the class that they were in the "twilight zone" of the cave. Ms. Odum explained why the simple plants called algae were growing on the top side of the rocks. Marcie found a brown and yellow cave cricket that she showed excitedly to the other students. Everyone took notes about the interesting things they saw.
Reproduced with permission of the copyright owner. Further reproduction prohibited without permission.

Next they move into the "dark zone" of the cave. Here the students found an eerie world. It was very dark, and bats hung form the ceiling. The crickets were pale and had longer legs and antennae than the cricket they had seen earlier. Some students noted that the white, eyeless crayfish they saw did not run away from the flashlight beam. The spelunkers moved deeper into the cave, looking forward to each new discovery.
Reproduced with permission of the copyright owner. Further reproduction prohibited without permission.
Which of the following persons wore a head lamp inside the Cave?a) Jed.b) Karen.c) Marcie.d) Mickey.
While taking notes at the entrance to the cave Shana was efficient and Mickey was:a) funny.b) angry.c) impatient.d) courageous.
Ms. Odum called Ron and Karen back from the cave because she :a) wanted them to take notes.b) didn't think it was safe for them to enter alone.c) wanted them to put on head lamps.d) needed them to carry some equipment.
What is this story mainly about?a) Finding a cave.b) Becoming spelunkers.c) Measuring temperatures.d) Studying unusual crickets.
Reproduced with permission of the copyright owner. Further reproduction prohibited without permission.

Where did the students see the bats?a) Outside the cave.b) In the cave's dark zone.c) In the cave's twilight zone.d) At the entrance to the cave.
The crayfish in the dark zone did not flee from the flashlight beam because they;a) had weak legs.b) were confused by the light.c) were unable to see the light.d) were curious about the students.
At the end of the story, how did the spelunkers feel about continuing the exploration?a) Eager.b) Weary.c) Relieved.d) Frightened.
Reproduced with permission of the copyright owner. Further reproduction prohibited without permission.

142
Walden's cafeteria is a noisy lunch-making machine. Clattering trays stack up on a moving rack. Plastic plates pop up from a hole in the shiny counter. Trays of tinkling glasses slide along to the bumpy beat of the lunchtime assembly line. Heavy metal forks and spoons clink and clang as they drop into place. Sandwiches, peas, and lemon pudding appear and disappear as lunches and more lunches are quickly assembled. Behind the shiny metal counter, workers in white are efficient gears— slapping bread and butter and cheese and meat into place, then turning back to begin again. The long line of hungry people extends from the door to the counter like a giant machine cord.
Reproduced with permission of the copyright owner. Further reproduction prohibited without permission.

The writer says that Walden's is a "lunch-making machine" because :a) Walden's makes machines.b) people buy their food at Walden's.c) Walden's is an active and noisy place.d) machines make the lunches at Walden's.
The writer compares the cafeteria workers to "efficient gears" because they:a) make loud noises while working.b) keep the work of the cafeteria going.c) stand behind the shiny metal counter.d) wear unusual clothing in the cafeteria.
The writer uses the words "clattering," "tinkling," "clink," and "clang" to:a) make the cafeteria seem humorous.b) describe the people in the cafeteria.c) create an impression of the cafeteria sounds.d) communicate a sense of danger in the cafeteria.
The line of people is like a giant "machine cord" because:a) the line is long and curved.b) the line is increasing in size.c) there is a large machine in the cafeteria.d) there are people stepping over machine cords.
Reproduced with permission of the copyright owner. Further reproduction prohibited without permission.

The following is a speech given by a student.
I am here to urge all of you to help change a recent decision of the Airport Board. The Board has rerouted air traffic over Grover School. The dangerous, noisy airplanes bother everyone at the school. Many of us cannot concentrate on our work. The flying monsters even frighten some of the younger girls and boys. Something must be done!
We need everyone's help— students', teachers', parents' We must present our position to the Airport Board meeting on Wednesday afternoon. We will ask them to reconsider their decision. Everyone who cares about the students at Grover School will be there. Please attend!
Reproduced with permission of the copyright owner. Further reproduction prohibited without permission.

The phrase "flying monsters" is used to make airplanes seem:a) clumsy.b) harmful.c) exciting.d) enjoyable.
The speaker uses the phrase, "Everyone who cares about the students at Grover School" to appeal to the listener's desire to:a) meet students.b) reorganize Grover School.c) be a part of a respected group.d) understand more about education.
What does the speaker wnat the listener to do?a) Learn more about airplanes.b) Organize a speaking campaign.c) Refuse to stay at Grover School.d) Attend the Airport Board meeting.
Reproduced with permission of the copyright owner. Further reproduction prohibited without permission.

146
"Babbage Rhymes with Cabbage," a London newspaper headline announced one morning in the 1860s. Even newspapers had begun to make fun of the brilliant inventor.
In the early 1820s Charles Babbage designed a machine that could work mathematical problems. The machine was called a "difference engine." This machine was far ahead of its time, and Babbage had to develop the tools with which to build its many parts. The "difference engine" interested scientist Sir Humphry Davy, who encouraged Babbage in his work. The machine would take much time and money to build. Sir Humphry Davy helped Babbage by persuading government leaders to pay some of the costs.
In 1834 Babbage planned and began building a more complicated, steam-powered computer. This was to be a machine that could quickly solve long and difficult problems. Babbage worked hard on this and other inventions. But many of his new inventions were not accepted.He became discouraged and angered.
Babbage’s bitterness influenced his relations with people. Once he became very upset with the organ grinders who played in the streets near his home. They disturbed his train of thought. He began a long court battle to silence them. But the organ grinders only bothered him more. They came from miles around to play beneath his windows.
Reproduced with permission of the copyright owner. Further reproduction prohibited without permission.

Finally, government leaders became angry at Babbage's ways and withdrew their support of his projects. Though Babbage had little money, he worked on his steam-powered computer for most of the rest of his life. However, he never finished it and died an unhappy, disappointed person. His death delayed what might have been the beginning of the computer revolution. It was nearly 100 years later, in 1944, that the world's first practical computer was finally built. Then another newspaper headline read "Babbage's Dream Comes True."
Reproduced with permission of the copyright owner. Further reproduction prohibited without permission.

Which of the following best describes Charles Babbage?a) Shy, but persuasive.b) Interested, but lazy.c) Angry, but supportive.d) Talented, but frustrated.
Sir Humphry Davy helped Charles Babbage because Davy:a) admired Babbage's work.b) hoped to sell Babbage new tools.c) was told to do so by the government.d) wanted to work on the "difference engine".
How did Babbage feel about the organ grinders' music?a) Amused.b) Envious.c) Annoyed.d) Disappointed.
Why did Babbage have to develop the tools with which to build his computer?a) The tools did not yet exist.b) Shops would not sell him the tools.c) The government would not return his tools.d) He did not have nay money to buy the tools.
Reproduced with permission of the copyright owner. Further reproduction prohibited without permission.

149
Which of the following titles best tells what this passage is about?a) ”A Long Court Battle."b) "A Determined Inventor."c) "A Design for a Computer."d) "Unusual Newspaper Headlines".
In what year was the first practical computer built?a) 1820.b) 1834.c) 1860.d) 1944.
Babbage lacked money to work on his computer because:a) he had to build many new parts.b) he loaned money to Sir Humphry Davy.c) the government stopped supporting him.d) the "difference engine" had to be rebuilt.
Reproduced with permission of the copyright owner. Further reproduction prohibited without permission.

Jubal Arioso
When Jubal Arioso strums on his strings,he sings about magicians and ancient kings.
As his musical notes float high in the sky,like a rare, golden coin, the moon rises high, and royal horses of stone whinny and fly.
When Jubal Arioso strums on his strings,the still air comes alive with wonderful things.
Reproduced with permission of the copyright owner. Further reproduction prohibited without permission.

The poet uses the epxression "musical notes float high in the sky" to make the reader feel that the music:a) is light and airy.b) is near the moon.c) can be seen in the air.d) has a kingly, magical quality.
The poet says the moon is like a "golden coin" because of the moon's :a) size and weight.b) color and shape.c) age and hardness.d) value and scarcity.
The poet uses the expression "horses of stone whinny and fly" to mean that :a) stones are flying in the air.b) horses can seem as cold as stone.c) statues are turning into real horses.d) music can seem to bring things to life.
Reproduced with permission of the copyright owner. Further reproduction prohibited without permission.

The following is the text of a radio commercial.
The R.C. Rogers Company is offering the popular Eye to the Sky telescope at the best price ever. This high-powered telescope is a fine instrument. Scientists agree that it is the best telescope for the price. Lydia Parker, a well-known astronomer, recommends it. She says,"I have used an Eye to the Sky for years. I have been quite pleased with it."
Don't be fooled by toy substitutes or cheap imitations. Join the scientists of today. They are all using Eye to the Sky telescopes. You too can look to the sky and make great discoveries. Get your Eye to the Sky today!
Reproduced with permission of the copyright owner. Further reproduction prohibited without permission.

The phrase "the best price ever":a) fails to tell the actual price of the telescope.b) compares the price to that of other telescopes.c) indicates the price scientists pay for the telescope.d) shows how much the price of the telescope has gone down.
Lydia Parker's statement is used as a recommendation for the telescope because she:a) is a well-known astronomer.b) has not been fooled by substitutes.c) has helped manufacture telescopes.d) works at the R.C. Rogers Company.
The phrases "toy substitutes" and "cheap imitations" are used to:a) quote scientists.b) describe the Eye to the Sky.c) criticize competitors' products.d) reveal results of scientific tests.
Reproduced with permission of the copyright owner. Further reproduction prohibited without permission.
154Hundreds of years ago, the Aztec people lived north
of the Colorado River. For unknown reasons, they began to migrate to the south. Around the year 1200 they reached the Valley of Mexico. Guided by the priests of their chief god Huitzilopochtlik the Aztecs learned that they were to keep moving until they saw a special sign. They were to look for an eagle holding a snake in its mouth and sitting on a cactus. On that site they were to build a city.
They searched for the sign for more than 100 years.In 1325 a band of weary Aztecs was resting on the shores of a large lake called Texcoco. They saw the sign they had been waiting for. There they build TenochtitlaH, which means "near the cactus".
Tenochtitlan was built on a small island in the lake.As the city outgrew the island, more land was made by loading rafts with earth, allowing the rafts to sink, and then piling more earth on top. The city’s construction gave the Aztecs an excellent water transportation system. Soon the city became very large. Great bridges leading to the shore connected Tenochtitlan with the rest of the Aztec empire. When the Spaniards come to Mexico in 1519, they were amazed by Tenochtitlan. It was the largest, richest city most of them had ever seen.
Today Mexico City, the capital of Mexico, is located where the ancient city of Tenochtitlad once stood. The
Reproduced with permission of the copyright owner. Further reproduction prohibited without permission.

155
Aztec symbol of the eagle perching on a cactus and holding a snake is now the national symbol of Mexico.
Reproduced with permission of the copyright owner. Further reproduction prohibited without permission.

Where did the Aztecs originally come from?a) Mexico City.b) Tenochtitlan.c) Around Lake Texcoco.d) North of the Colorado River.
The national symbol of Mexico represents:a) the commands of a god.b) a gift from the Spaniards.c) the conquest of Tenochtitlad.d) part of the history of the nation.
Which of the following best describes the Aztecs during their search for a place to build Tenochtitlad?a) Lazy.b) Gentle.c) Desperate.d) Purposeful.
When did the Aztecs began to build Tenochtitlan?a) V/hen they had built enough floating islands.b) After they developed a transportation system.c) After they saw the eagle perched on the cactus.d) As soon as they arrived in the Valley of Mexico.
Reproduced with permission of the copyright owner. Further reproduction prohibited without permission.

Why did the Aztecs have to keep adding soil to the island they lived on?a) They needed farmland.b) They needed more room.c) They wind blew the soil away.d) There was no bridge to the shore.
Yfhat is this passage mainly about?a) An eagle,h) A journey.c) The development of a city.d) The leadership of Huitzilopochtli.
When the Spaniards came to Mexico, Tenochtitlad was:a) just being built.b) the center of a nation.c) sinking into Lake Texcoco.d) without a transportation system.
Reproduced with permission of the copyright owner. Further reproduction prohibited without permission.
The following are reports from two student newspapers,
Carson Middle School ran away with the honors at this year’s Sports and Art Day. Carson did very well in the all-important track and field events. Clyde Prent's record-setting mile was the high point of the whole day. One luck team from Darmont Middle School won first place in tumbling, but Carson took most of the ribbons in all other sports events. Our art exhibits were enjoyed by many, even though we won only one prize. Julie Gray's moving Pipe art won a second place ribbon. In all, the Sports and Art Day was a great success for Carson Middle School !
Marie Brock, Reporter Carson Middle School News
The best Exhibit at Saturday's Sports and Art Day was Darmont Middle School's geodesic dome. It received the Grand Prize as well as a first place ribbon. The dome was built of cardboard boxes and was used later as a theater by the prize-winning Darmont Troupers. They amused everyone with a play they had written named "The Rider from Purple Flats." Several other prizes were given to Darmont students for paintings, sculptures, and other art work. Darmont 's great tumbling team also won a first
Reproduced with permission of the copyright owner. Further reproduction prohibited without permission.

ribbon. We certainly can be proud of our performance at this year's Sports and Art Day!
Robert Thompson, Reporter Darmont Middle School Gazette
Reproduced with permission of the copyright owner. Further reproduction prohibited without permission.

160
When Marie Brock uses the phrase "high point of the whole day," it shows that she is:a) stating the name of a field event.b) showing which school was best in track.c) giving importance to Clyde Prent's performance.d) indicating the order in which the activities were held.
Which of the following expresses an opinion about the Darmont Troupers?a) They wrote a play.b) They delighted everyone.c) They performed in a play.d) They used the dome as a theater.
Which of the following is true about Robert Thompson'sreport?a) Itb) Itc) Itd) It
Reproduced with permission of the copyright owner. Further reproduction prohibited without permission.

Which of the following phrases from Marie Brock's report is probably based on a fact?a) "One lucky team..."b) "...a great success..."c) "...record-setting mile..."d) "...all-important track and field events."
Which of the following is an opinion expressed in Robert Thompson's report?a) The dome won the Grand Prize.b) The Darmont Troupers used the dome.c) The dome was built of cardboard boxes.d) The best exhibit was the geodesic dome.
Marie Brock probably emphasized sports in her report because she:a) was a member of the track team.b) knew Carson did best in those events.c) thought readers would not be interested in art.d) thought the Darmont reporter was unqualified to
report sports.
Reproduced with permission of the copyright owner. Further reproduction prohibited without permission.

VITA
Lane Roy Gauthier was born January 4, 1953, in New Roads, Louisiana. Mr. Gauthier received his Bachelor of Science degree in elementary education from LSU in 1975, He also received his Master of Education degree from LSU in Special Education in 1977.
Mr. Gauthier has taught at the elementary and college levels, and has had several articles published in the United States as well as overseas. He has also made presentations and conducted several workshops for professional organizations.
Mr. Gauthier is married to the former Susanne Marie Fortner.
Reproduced with permission of the copyright owner. Further reproduction prohibited without permission.

EXAMINATION AND THESIS REPORT
Candidate; LANE ROY GAUTHIER
Major Field: EDUCATION
Title of Thesis: A STUDY OF THE THREE-LEVEL HIERARCHY OF INFORMATION PROCESSINGIN READING COMPREHENSION WITH RESPECT TO COGNITIVE DEMAND
Approved:>ved: A&JL K-M ajor Professor and Chairman
Dean of the Graduate
EXAMINING COMMITTEE:
oaIt C/F. ___
Date of Examination: ------------------------------ -------------------------------------------
______________ J u ly 2 0 , 1982________ ___________ ______________ _________________
Reproduced with permission of the copyright owner. Further reproduction prohibited without permission.