a study of the extent and potential causes of alternative ... · a study of the extent and...
TRANSCRIPT
ILRReviewVolume 66Number 4 Special Issue on Job Quality Article 6
7-29-2013
A Study of the Extent and Potential Causes ofAlternative Employment ArrangementsPeter H. CappelliThe Wharton School and NBER, [email protected]
JR KellerThe Wharton School, University of Pennsylvania, [email protected]
Follow this and additional works at: http://digitalcommons.ilr.cornell.edu/ilrreview
A Study of the Extent and Potential Causes of Alternative EmploymentArrangements
AbstractThe notion of regular, full-time employment as one of the defining features of the U.S. economy has beencalled into question in recent years by the apparent growth of alternative or “nonstandard” workarrangements—part-time hours, temporary help, independent contracting, and other configurations.Identifying the extent of these arrangements, whether they are increasing and where they occur, is the firststep to understanding their implications for the economy and the society. But such steps have been difficult totake because of the lack of appropriate data. Based on a national probability sample of U.S. establishments, theauthors present estimates of the extent of these practices, evidence on changes in their use over time, andanalyses that contribute to understanding why alternatives have come into play.
Keywordsnonstandard work arrangements
Cover Page FootnotePeter H. Cappelli is a Professor and the Director of the Center for Human Resources at The Wharton School,University of Pennsylvania, and a Research Associate at the National Bureau of Economic Research (NBER).JR Keller is a PhD student in The Wharton School, University of Pennsylvania. Opinions and conclusionsexpressed herein are those of the author(s) and do not necessarily represent the views of the U.S. CensusBureau. All results have been reviewed to ensure that no confidential information is disclosed. Thanks to theRussell Sage Foundation for financial support and to Matthew Bidwell for helpful comments. Informationabout the data used for this study is available from the Center for Economic Performance at the Bureau of theCensus, where the analyses here were conducted.
This article is available in ILRReview: http://digitalcommons.ilr.cornell.edu/ilrreview/vol66/iss4/6
ILRReview, 66(4), July 2013. © by Cornell University.Print 0019-7939/Online 2162-271X/00/6604 $05.00
A STUDY OF THE EXTENT AND POTENTIAL CAUSES
OF ALTERNATIVE EMPLOYMENT ARRANGEMENTS
PETER H. CAPPELLI AND JR KELLER*
The notion of regular, full-time employment as one of the defining features of the U.S. economy has been called into question in recent years by the apparent growth of alternative or “nonstandard” work arrangements—part-time hours, temporary help, independent con-tracting, and other configurations. Identifying the extent of these arrangements, whether they are increasing and where they occur, is the first step to understanding their implications for the economy and the society. But such steps have been difficult to take because of the lack of appropriate data. Based on a national probability sample of U.S. establishments, the authors present estimates of the extent of these practices, evidence on changes in their use over time, and analyses that contribute to understanding why alternatives have come into play.
Individuals who are working on behalf of an organization are commonly referred to as employees, yet organizations increasingly use an array of
arrangements other than employment for engaging workers. Such alterna-tives include temporary help, leased employees, independent contracting, and using Professional Employer Organizations (PEOs). Part-time work, though a type of employment, is often included in the set of alternative ar-rangements because employers typically treat workers in those roles differ-ently from full-time employees (e.g., no benefits or career advancement prospects). Despite their importance in the economy, we know surprisingly little about how extensively these alternative approaches are used.
Part of the challenge in identifying their use has been the difficulty in agreeing on the common elements of these alternative arrangements (Cappelli and Keller 2013). The phrase “nonstandard work,” for example, is all-inclusive, but ignores the considerable variation in the attributes of the components within that classification. The term “contingent work” is also
*Peter H. Cappelli is a Professor and the Director of the Center for Human Resources at The Wharton School, University of Pennsylvania, and a Research Associate at the National Bureau of Economic Re-search (NBER). JR Keller is a PhD student in The Wharton School, University of Pennsylvania. Opinions and conclusions expressed herein are those of the author(s) and do not necessarily represent the views of the U.S. Census Bureau. All results have been reviewed to ensure that no confidential information is disclosed. Thanks to the Russell Sage Foundation for financial support and to Matthew Bidwell for help-ful comments. Information about the data used for this study is available from the Center for Economic Performance at the Bureau of the Census, where the analyses here were conducted.
ALTERNATIVE EMPLOYMENT ARRANGEMENTS 875
common and refers to the sense that the relationships on average are less secure and more contingent on short-term changes in employer demand than is regular employment. Yet some of these alternative arrangements can be reasonably regular and stable, especially part-time jobs, whereas some full-time, regular jobs can be quite insecure. Given this circumstance, each of the specific alternative arrangements needs to be examined, and how extensively they are used needs to be determined.
We examine these alternative arrangements using national probability data from the Census. The 2000/2001 National Employer Survey is the larg-est and most recent nationally representative establishment-level survey on alternative work arrangements, and it contains detailed information of em-ployment in alternative work arrangements as a fraction of direct-hire em-ployees, data that are not found in any other source. And unlike previous establishment-level surveys, multiple versions of the NES have been con-ducted over time, providing an opportunity to examine trends in their use.
The descriptive data from the survey allow us to address three quite im-portant questions. The first is simply, how extensive are each of these alter-native arrangements? Second, how has the incidence of their use changed over time? Finally, what can we add to what little is known about why em-ployers choose particular arrangements?
Overall, we find that alternative work arrangements are used extensively, but considerable variation occurs in the use of each of the arrangements. Such arrangements are highly concentrated among relatively few establish-ments, which use them very intensively, suggesting that establishment-level factors must be involved in understanding that variance. The data over time suggest an overall increase but, again, the growth varies considerably across arrangements. Finally, we present preliminary analyses examining prior hy-potheses about the establishment-level attributes likely to be associated with greater use of these alternative arrangements. We find relatively little sup-port for the notion that their use is driven by either cost savings or flexibility needs, but some support for the idea that they vary with the ease of monitor-ing tasks and job performance.
Interest in Alternative Arrangements
What we now think of as the traditional employment relationship in the Anglo-U.S. context evolved from the traditions of agrarian economies in England, where employment relationships were based on crop cycles. Un-less otherwise stated, hired help on farms was engaged for one year, follow-ing the cycle of crops from planting to harvest, to prevent farmers from hiring laborers from spring through harvest and then laying them off in the winter when there was nothing much for them to do but, as a consequence, nothing much to eat. This arrangement was canonized into common law and carried over to the United States and Commonwealth countries. On the European continent, similar arrangements were put in place through legis-lation (Feinman 1976).
876 ILRREVIEW
The “at will” employment model in the United States developed later in a context in which labor was scarcer than in England. The notion that em-ployees and employers could walk away from employment arrangements at any time—this “at will” idea—was a sharp departure from earlier arrange-ments (Miles 2000). The rise of industrial employment in the early 1900s created opportunity to apply the “at will” model on a large scale and led to arrangements for which a reasonably stable group of skilled workers was sur-rounded by an ever-changing casual workforce. While turnover rates of 300% or more were common in U.S. industry through the 1920s, the rise of capital-intensive, mass production arrangements created the need for many more semiskilled workers and, in turn, a need for greater stability in the workforce. The notion of stable, full-time jobs for average workers that could last a lifetime began relatively late, after the Depression, and was en-forced by collective bargaining agreements in union facilities and similar arrangements (seniority-based provisions, etc.) in nonunion firms. That model of “standard” employment became the basis for modern employ-ment law in The New Deal, for assumptions about labor markets and the economy that governed policy, and for much of civil society.1
The experiences of the 1980s represented a sharp rift in that model of standard employment as downsizing waves eroded what had been lifetime jobs. Initially, temporary help engaged through agencies provided a means for lowering labor costs in this period and was followed by a steady rise in the variety of alternatives, supported by the efforts of the temp industry to legitimize these alternatives as acceptable practices (Smith and Neuwirth 2008). These other practices included contract or leased employees, similar to temporary help except that the relationships are often long-term; inde-pendent contracting in which relationships can be short-term like temps but lack an intermediary between worker and employer; engaging temp workers directly without an agency intermediary (“direct-hire” temps); Pro-fessional Employer Organizations (PEOs) that become the legal employer while leaving the day-to-day management of workers to the client’s supervi-sors (see, e.g., Cappelli 1999); and vendor-on-premise services in which workers are employees of the vendor but can be attached permanently to the client’s location (see Theodore and Peck 2002).
Several reasons come to mind for both practical and theoretical interest in these arrangements, with the first being that they appear to be both wide-spread and growing. Luo, Mann, and Holden (2010) reported, for example, that temporary agency workers doubled as a percentage of the total U.S. workforce from 1990 through 2000, accounting for 10% of all employment growth during this period. The number of workers in PEO arrangements has risen even faster, albeit starting at a very low base, with Lombardi and Ono (2008) reporting a 386% growth between 1992 and 2002. Many of these arrangements reduce the fixed costs of having workers engaged in
1 The historical background to nonstandard work can be found in Cappelli (2000), and the more recent context is outlined in Cappelli (1999), Chapters 2 and 3.
ALTERNATIVE EMPLOYMENT ARRANGEMENTS 877
tasks for the organization, allowing organizations to adjust the amount of work and the pay while making it easier to end the relationship.2
A large subset of these arrangements pushes work outside of the usual definition of the boundary of the firm, separating the legal employment re-lationship from the day-to-day management of employees (Muhl 2002; Stone 2006). Such arrangements typically introduce a third party into the relationship, raising new issues about how workers are managed and the extent to which the parties involved are able to exercise control over the work process. In general, alternative arrangements give a greater role to the mar-ket in shaping the terms and conditions under which work is performed. Together, they represent a dramatic shift from traditional employment.
Data on the use of specific arrangements are especially important given the recent interest in understanding the issues raised when employers use multiple alternative arrangements. For example, how is the choice among temps, contractors, and full-time workers determined (Kalleberg, Reynolds, and Marsden 2003)? What are the challenges for managers who have a vari-ety of workers engaged on their behalf under very different arrangements (Smith 2001)? How do the workers operating under these different arrange-ments interact with one another (Davis-Blake, Broschak, and George 2003)? All of these issues become more important as these alternative arrange-ments become more widespread.
Measuring the Extent of Nonstandard Employment
Efforts to collect data on these alternative arrangements have largely relied on individual-level data surveys, especially the Contingent Work Supple-ment (CWS) to the Current Population Survey (CPS) conducted by the Bu-reau of Labor Statistics (BLS). While studies using these data have done much to further our understanding of alternative arrangements and their effects on workers, they are limited in the picture they can present of the prevalence of such arrangements in the U.S. economy.
The BLS has been particularly interested in contingent work, which it defines as “any job in which an individual does not have an explicit or im-plicit contract for long-term employment” (Polivka 1996). The key criterion in the definition of contingent work, therefore, is the employee’s percep-tion of the stability of their job3 and not the actual nature of the relation-ship. By 2005, 4.1% of the workforce were in arrangements that workers perceived as contingent, almost identical to the 4.0% reported in 2001 and slightly lower than the estimates from previous surveys in 1999 (4.3%) and 1997 (4.9%) (von Hippel et al. 2006). The stability of these figures despite
2 Part-time workers may be the exception here. While they do create the opportunity for more flexible staffing arrangements, the fixed costs of recruiting and hiring new workers may be similar for full- and part-time positions.
3 “Any job in which an individual does not have an explicit or implicit contract for long-term employ-ment” (Hipple 2001: 4).

878 ILRREVIEW
business cycle variations and other changes leads to the question of whether perceptions of instability and insecurity may self-adjust.
Another concern about individual-level data is whether individual work-ers are able and willing to identify the type of arrangement they are in. Other researchers have noted that if the many respondents who were unable to answer whether their work was contingent were included in the BLS mea-sure, the percentage of contingent workers would be nearly 10% or almost two and a half times the current estimate of 4.1% (Belman and Golden 2000; Gleason 2006: 4). Dey, Houseman, and Polivka (2006) similarly observed that despite the addition of clarifying questions, difficulties with reporting accuracy remain. Contingent work does not map neatly onto categories of nonstandard work. For example, a 1999 BLS survey reported that only 10% of part-time workers say that their jobs are contingent (Hipple 2001).
The most important limitation to the CPS data on individuals is that ask-ing a worker about the nature of their working arrangements does not tell us how often or even if they are working at all. For example, individuals may correctly identify themselves as independent contractors even if they have no work, similar to temp agency workers who have no assignments.4 Social desirability biases may also affect how individuals respond (e.g., consultant or independent contractor sounds better than temp). Finally, most attempts to measure the use of alternative arrangements with individual-level data have not used the full range of intermediaries or arrangements, such as en-gagement through Professional Employer Organizations.
An alternative approach to mapping the extent to which nonstandard ar-rangements are being used is to ask employers directly about their use. The most obvious advantage to this approach is that the responses tell us about the actual use and extent of these arrangements in the workplace. Employer respondents may not have data on the number of individuals working under each arrangement at their fingertips (sometimes true even for the number of direct employees), but they are likely to be well aware of the different al-ternative arrangements, as each has implications for their budgets and for compliance with both tax and employment law.
Data from employers have been examined in the past by other research-ers relying on a variety of survey instruments. Abraham (1990) used a survey from the Bureau of National Affairs, Houseman (2001) used data from the 1995 W. E. Upjohn survey of 550 establishments, and Kalleberg and col-leagues (1995, 2003) surveyed HR managers at 1,002 establishments as part of the 1996 National Organizations Survey (NOSII; see Kalleberg et al. 1995 for details). Abraham and Taylor (1996) examined the related question of the propensity of establishments to contract out certain business services,
4 The Bureau of Labor Statistics attempted to measure how many individuals worked for vendors/contractors by asking whether they performed their work for an organization other than their employer and did so solely for that other organization for a period up to a year. That definition would seem to capture many individuals who work as contractors, but it might also exclude others, for example, who work in one place for more than a year or performed work for two organizations, as the cutoffs are rea-sonably arbitrary. See http://www.bls.gov/news.release/conemp.nr0.htm for details of the CPS survey.
ALTERNATIVE EMPLOYMENT ARRANGEMENTS 879
such as janitorial and accounting services, with a supplement to the Industry Wage Survey conducted by the BLS.
Houseman (2001) found that in addition to part-time help, 78% of em-ployers used at least one other alternative arrangement (agency temps, on-call workers, independent contractors, and workers from contractors), slightly higher than the 70% reported by Kalleberg et al. (2003) using the NOSII data. Somewhat more difficult, however, is to estimate the use of each arrangement in any simple way given the response options in these surveys, which were categorical. The design of the most recent NES survey extends these prior approaches in important ways.
The National Employer Surveys (NES I, NES II, and NES III)
The National Employer Survey is an establishment-based survey conducted by the Census Bureau. It was first conducted in 1994 (NES I) with a second major version in 1997 (NES II). The third version of the NES, the focus of this study, began in late 2000 and was completed in early 2001. (For conve-nience we refer to it as the 2000 survey, or NES III.) All three were spon-sored by the National Center on the Educational Quality of the Workforce (EQW). The NES III was motivated by concerns about the corporate re-structuring of the 1990s, and employer practices more generally. Among those new concerns was an interest in identifying the extent of nonstandard work in the U.S. economy. These data are not publicly available and have not previously been used to examine workplace issues.5
The NES I sample was drawn from the Standard Statistical Establishment List (SSEL), a listing of establishments drawn from Internal Revenue Ser-vice records and based on mandatory tax reporting by employers. As such, it is the definitive list of employers and should be superior in its represen-tativeness to other commonly used employer sampling frames (see, e.g., Kalleberg et al. 1990). The sampling frame is limited to private sector estab-lishments with more than 20 employees who are not solely at headquarters. Sampling establishments leads to more precise responses than sampling firms as firm-level data, especially in larger firms, represents averages across establishments for which practices may be quite different. The decision to exclude small establishments was made because they are less likely to have formal programs and practices, which were the focus of the survey, and they also account for a relatively small percentage of the workforce. A 72% re-sponse rate yielded 3,173 usable responses.
5 Access to the data has been delayed for much of the period since it was collected and is on indefinite hold since 2009 pending resolution of issues between the Census, which administered the survey, and the Internal Revenue Service, which “owns” the sampling frame. The challenge for researchers is that this means that all requests to 1) access the data, 2) have the analyses approved, and 3) approve any publica-tions, must be vetted by two agencies that disagree over who owns the data. In short, issues out of any researcher’s control have prevented this data from being used despite its being developed, in large mea-sure, in response to social science researchers’ argument that the absence of a representative survey data about organizations represented a serious gap in our knowledge about the economy and society.

880 ILRREVIEW
The NES II sampling frame was also drawn from the SSEL using identical criteria, with a 78% response rate yielding 3,463 usable responses. The sam-pling frame included a subset of the establishments that completed the NES I. Seventy-five percent of those establishments that were resurveyed re-sponded, creating a longitudinal panel of 915 establishments surveyed in both 1994 and 1997.
The sampling frame for the NES III was drawn from the establishments that responded to the NES II, some of which also responded to the NES I, with an 85% response rate yielding usable responses from 2,825 establish-ments (Table 1). The NES III survey responses thus created two additional longitudinal panels: 814 establishments who responded to all 3 NES surveys (1994, 1997, 2000), and 2,011 establishments surveyed in both 1997 and 2000. The longitudinal aspects of the survey make it easier to examine changes over time in practices, especially in the same establishments, albeit at the expense of representativeness of the sample at each point in time. The survey was conducted between December 2000 and January 2001, with questions referring to the 2000 calendar year. Because of sampling decisions made in prior surveys, manufacturing establishments are oversampled. As we note below, however, the estimates we present from each of the surveys are weighted to make them more representative of private sector establish-ments with more than 20 employees.
The survey was administered by the Bureau of the Census as a telephone survey using computer-assisted telephone interviewing (CATI), allowing the interviewer to clarify any questions about meaning of different arrange-ments or what information was being requested. Several questions asked about the number of workers engaged through the broad range of alterna-tive arrangements, as opposed to categorical responses, enabling more pre-cise estimates. A caveat is that the questions asked in the three surveys have not been entirely consistent in their wording over time, an issue we address below. Some types of nonstandard work emerged after the initial surveys were conducted, such as Professional Employer Organizations, and some questions asked in the later surveys were not asked in earlier surveys. Never-theless, the NES III data are the most recent available for examining alter-native arrangements in U.S. workplaces, and while other surveys have asked about individual arrangements, none to our knowledge have examined the set we consider here. Finally, the longitudinal aspects of the survey design provide a unique opportunity to examine trends in nonstandard work over time.
Table 1. Sampling Frame for the NES III
VariableCompleted surveys in 1997
(NES II)Completed surveys in 1994 and 1997
(NES I and NES II)
Establishments surveyed 3,463 915Usable responses 2,825 814

ALTERNATIVE EMPLOYMENT ARRANGEMENTS 881
Descriptive Results for Nonstandard Arrangements
Table 2 presents mean responses from the establishments surveyed in the 2000 NES. These estimates are weighted by the proportion of total employ-ment in the private sector workforce associated with each industry to make them more representative of the population of all workers in the private sector workforce. Other choices can be made for weighting results such as these (e.g., by establishment size), which might yield different results, but weighting by industry seemed particularly important here given that the sample overrepresented manufacturing-related industries.
The first column indicates the percentage of all establishments that re-port using a given arrangement, irrespective of the level of use. The second and third columns report the extent of use as a percentage of the total work-force—first as a percentage of regular “employees” of the establishment (in-cluding full-time, part-time, and direct-hire temporary workers) and second as a percentage of total workers at the establishment, which includes those individuals who are not direct employees of the establishment but are nev-ertheless working at that establishment (including workers employed by agencies, PEOs, and vendors on premise).6
This cross-sectional view of the pattern of use is broadly consistent with, but not identical to, previous survey results. “Agency temp” arrangements
6 What the survey cannot capture is work that is being performed for the establishment but being con-ducted elsewhere. Such work could be embodied in components purchased from a supply chain or in tasks that are contracted out. These areas would typically be seen as outside the boundary of the firm and not alternative arrangements for managing tasks within the firm. They are conceptually quite difficult to capture, requiring, for example, working backward from estimates of value added to track where all the value came from.
Table 2. Use of Nonstandard Arrangements in 2000 from the NES III
Type of arrangement
Percentage of establishments
(%) n
Percentage of average establishment’s workforce
Percentage of all employeesa
(%)
Percentage of all on-site workersb
(%)
Part-time n/a 2,943 15.76 15.48Direct-hire temporary 22.58 2,967 2.77 2.59
Total “on-roll” arrangements (%) 18.53 18.07Agency temporary 42.73 2,949 n/a 2.14Independent contractor 35.05 2,816 n/a 1.49PEO 21.35 2,871 n/a 0.87Vendor on premise 39.57 2,949 n/a 0.86
Total “off-roll” arrangements (%) 5.36Total nonstandard arrangements (%) 23.43
aIncludes all workers on the establishment’s payroll, that is, “on-roll” workers.bIncludes “on-roll workers” plus agency temps, independent contractors, PEO workers, and VOP workers.
882 ILRREVIEW
have arguably been the focus of much of the prior research. Prior employee surveys found that temps accounted for roughly 2% of the workforce (Autor 2003; von Hippel et al. 2006; Luo et al. 2010). That is the case here as well; the average establishment has the equivalent of 2.1% of its on-site workers in the form of agency temps. As other studies have also found, the number of temps engaged directly by the employer, as opposed to through an agency intermediary, is even greater than the use of agency temps—2.8% of on-site workers in these data. The total temporary workforce at the average estab-lishment, therefore, is just less than 5% of the total workforce. Approxi-mately 43% of all establishments report using at least one temp agency worker, which is significantly greater than the 29% reported by Kalleberg et al. (2003) but quite similar to the 46% reported by Houseman’s (2001) sur-vey. Interestingly, the NES III shows that only 23% of establishments use direct-hire temps, slightly less than the 30% reported in the NOSII (Kalleberg et al. 2003) and significantly less than the 40% reported in the 1995 Upjohn survey (Houseman 2001). The Upjohn survey, however, was based on firms, which are larger than establishments and therefore more likely to use direct-hire temps somewhere in their operations.
Whereas worker surveys have routinely estimated the percentage of inde-pendent contractors at greater than 6% of the overall workforce (Hipple 2001; von Hippel et al. 2006), the NES III data indicate that independent contractors actually at work in a representative week constitute less than 1.5% of the average organization’s on-site workforce. Taken together, these two sets of findings suggest there are many people calling themselves inde-pendent contractors who may not be engaged very often or for very long by clients.
Workers provided by on-site vendors exclude those who are doing work that could not be performed by regular employees, such as a repairman called in to service leased equipment, and asks only about vendors who are working on the premises every week. To our knowledge, these are the first systematic data available on the extent of on-site vendor use, and they show that while on-site vendors represent less than 1% of on-site workers, almost 40% of all establishments use such arrangements.
Approximately 21% of establishments use PEO arrangements, though workers in such arrangements account for less than 1% of all on-site work-ers, similar to the figures reported by others (Hipple 2001; von Hippel et al. 2006; Lombardi and Ono 2008). Comparing these values to those reported in the Upjohn and NOSII studies is difficult, as workers in PEO arrange-ments are included in broader measures of “contract” workers in those sur-veys. As in other surveys, part-time workers constitute by far the largest share of nonstandard work—just less than 16% of all employees here.
Temporary Agency Work in Detail
The survey asks several additional questions about the use of agency tempo-rary help, and these results are reported in Table 3. First, the survey reports

ALTERNATIVE EMPLOYMENT ARRANGEMENTS 883
the “peak use” of temps and finds that the average employer used agency temps equivalent to 3.7% of the workforce in their peak week over the course of the previous year. Among those who use temps at all, however, the figure is much greater, 8.7%. By comparison, only 8% of employers in the earlier Upjohn survey reported that temp agency workers exceed even 5% of their total workforce (Houseman 2001). The difference in these esti-mates may reflect the rapid growth of the temp agency industry during the latter half of the 1990s (Peck and Theodore 2007; Luo et al. 2010) and sug-gests a larger role for temp agencies than previously thought.
Second, the survey reports in which jobs agency temps are used. The ste-reotype of the temp worker is an office employee, and, indeed, 41% of all agency temp workers are used in office jobs. But even more of them, almost 44%, are used in production-related jobs. Though not all establishments have production-like jobs, more workers overall are in such jobs in the econ-omy than in office jobs. This result, therefore, does not imply that the per-centage of workers who are agency temps is greater in production jobs than in office jobs, but it does suggest that more agency temps are doing what could be thought of as “core” jobs in their establishments. Our results are consistent with recent findings indicating that even though white-collar jobs are well represented in the list of growing occupations for temp agency workers (Luo et al. 2010), the rise in such work has been accompanied by a similar or greater rise in blue-collar temp work (Dey et al. 2006).
Perhaps the most interesting statistic in the study concerns the percent-age of workers who are hired by the establishment into regular employment from the pool of agency temps working in that establishment. More than 90% of establishments have converted temp agency workers to permanent employees. In fact, converted temp workers constitute 1.7% of the average establishment’s on-site workforce. That may not seem like a huge number compared with the remaining 98% of the workforce, but it does seem
Table 3. Detailed Data on Use of Agency Temps from the NES III
Type of job n
Percentage of all on-site workersa (%)
Use in peak weekConverted
agency temps
All establishments 2,910 3.67 1.73Establishments using agency temps only 1,221 8.75 4.46
Type of job nPercentage of all
agency temps (%)
Production jobs 1,252 43.69Office jobs 1,250 41.22Technical jobs 1,251 10.24Managerial and professional jobs 1,254 3.99Supervisor jobs 1,253 0.79
aIncludes “on-roll workers” plus agency temps, independent contractors, PEO work-ers, and VOP workers.
884 ILRREVIEW
significant when one compares it to the fact that agency temps represent only 2.1% of all workers in the average establishment. Hiring may be an im-portant part of what temp agencies do for their clients.7
Overall Use of Alternative Arrangements
We can also use the above data to summarize the use of alternative work ar-rangements according to commonly used classifications. For example, all of the above categories collectively are at least conceptually close to the defini-tion of nonstandard work (assuming our categories exhaust contemporary instances of nonemployment), and they account for 23.4% of all workers across all establishments. On peak days, including peak agency temp use, the figure rises to 25% across all establishments and 30% in establishments that regularly use agency temp workers.
Because part-time work is often regular and reasonably long-term, we re-move it to generate a measure of the insecure or contingent component of nonstandard work. This yields an overall level of 8% of workers across all establishments in insecure jobs, rising in peak weeks to 9.7% across all estab-lishments, and 14.5% in establishments that regularly use agency temps.
Off-roll workers are those workers who are doing work for an establish-ment but are not employed by that establishment. The employer is physi-cally separated from the location where the employees work, and the day-to-day supervisor directing their work is not necessarily their employer.8 Off-roll is equivalent to nonstandard work minus part-time and direct-hire temps. Off-roll workers account for 5.4% of workers across all establish-ments, rising in peak weeks to 7.1% across all establishments and 11.8% in establishments that regularly use agency temp workers.
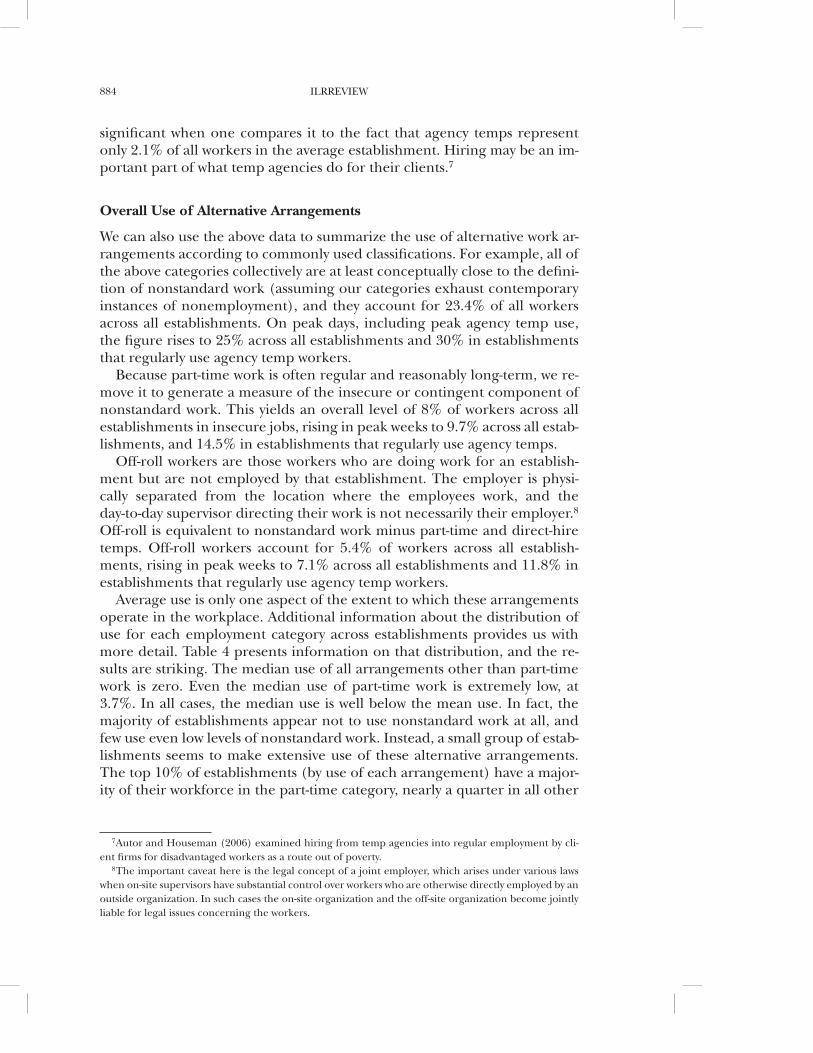
Average use is only one aspect of the extent to which these arrangements operate in the workplace. Additional information about the distribution of use for each employment category across establishments provides us with more detail. Table 4 presents information on that distribution, and the re-sults are striking. The median use of all arrangements other than part-time work is zero. Even the median use of part-time work is extremely low, at 3.7%. In all cases, the median use is well below the mean use. In fact, the majority of establishments appear not to use nonstandard work at all, and few use even low levels of nonstandard work. Instead, a small group of estab-lishments seems to make extensive use of these alternative arrangements. The top 10% of establishments (by use of each arrangement) have a major-ity of their workforce in the part-time category, nearly a quarter in all other
7 Autor and Houseman (2006) examined hiring from temp agencies into regular employment by cli-ent firms for disadvantaged workers as a route out of poverty.
8 The important caveat here is the legal concept of a joint employer, which arises under various laws when on-site supervisors have substantial control over workers who are otherwise directly employed by an outside organization. In such cases the on-site organization and the off-site organization become jointly liable for legal issues concerning the workers.
ALTERNATIVE EMPLOYMENT ARRANGEMENTS 885
arrangements, and 13% in arrangements involving labor market intermedi-aries.
Current but less reliable data derived from the labor market intermediar-ies themselves paints a strikingly similar picture of the great variance in use of these practices across organizations. A 2009 survey of U.S. employers by Manpower revealed that a majority of U.S. firms do not consider the use of alternative arrangements to be a key part of their workforce strategy (Man-power 2009), and the American Staffing Association found that, on average, only 15% of U.S. businesses use staffing services (agency temps and leased employees) in a given year (Berchem 2011). Among other things, these re-sults reinforce the point that variation in the use of alternative arrange-ments at the organization and establishment level is perhaps the central issue in understanding these arrangements.
Trends in Nonstandard Work over Time
Unlike previous establishment-level surveys, comparisons across the various versions of the NES conducted since 1994 provide an opportunity to exam-ine trends in alternative arrangements over time. The caveats, as noted ear-lier, are that the questions asked in each of the various surveys have not been entirely consistent in their wording, an issue we address below, and not all types of alternative arrangements were examined in each survey. Never-theless, some general conclusions can be drawn about trends in the use of nonstandard arrangements over time from the data.
Our initial approach involves a simple reporting of the mean use of vari-ous forms of nonstandard work in each period, on repeated cross-sectional samples of the population of establishments. Because all respondents to the 2000 NES replied to the 1997 survey and a subset of the respondents replied to all three surveys, comparisons of the same establishments over time can be made. A second approach, therefore, involves looking at how mean use compares for a set of respondents over time. This approach focuses on sur-vivors—establishments that were around in 1994 and were still in business six years later. This method reveals something about how individual estab-lishments have adapted over time, but it also excludes new establishments
Table 4. Distribution of Use of Alternative Arrangements as a Percentage of On-site Workers from the NES III
Type of arrangementMedian
(%)
25th percentile
(%)
75th percentile
(%)
90th percentile
(%)
95th percentile
(%)
99th percentile
(%)
Part-time 3.7 0.0 23.6 50.1 65.7 89.5Direct-hire temporary 0.0 0.0 0.7 10.9 29.1 96.6Agency temporary 0.0 0.0 1.3 5.5 10.0 21.9Independent contractor 0.0 0.0 0.6 2.9 6.8 30.2PEO 0.0 0.0 0.0 1.7 4.9 15.9Vendor on premise 0.0 0.0 0.6 3.2 7.3 27.2
886 ILRREVIEW
and those that have failed in the interim. Comparing the former approach (all respondents) with the latter (the survivors from 1994) can reveal some of the factors driving changes in the incidence of these practices within or-ganizations and in the population. The Census conducted a small, 1,000 es-tablishment supplemental survey to the NES in 1996 drawn from respondents to the 1994 survey that asked some similar questions, and we include the results of that survey for robustness purposes.
Trends across All Organizations
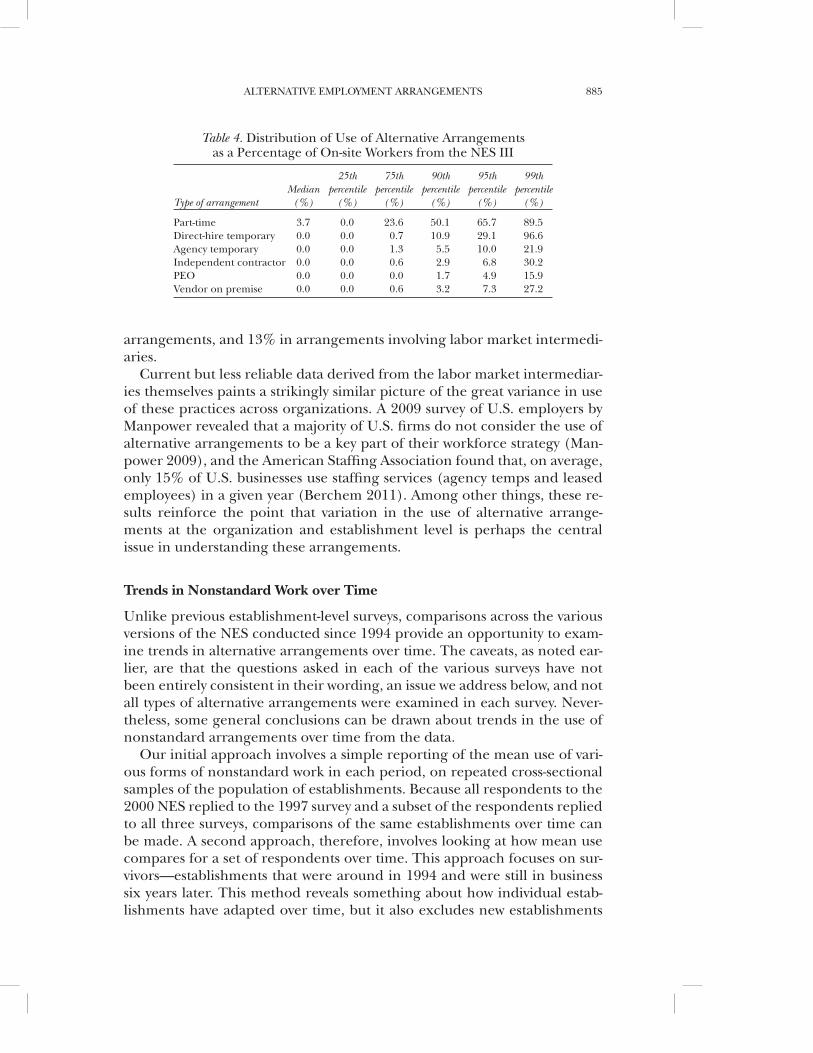
Table 5 reveals the use of all types of nonstandard work across the years of the NES samples. Looking first at part-time work, the mean level of use de-clined slightly but steadily over time. The percentage of temporary workers who work directly for the establishment—excluding those employed by agencies—jumped sharply from 2.7% in 1994 to 4.3% in 1996, and 5.7% in 1997, but then dropped sharply again in 2000, back to 2.8%. The rise in use during the economic boom of the 1990s is in line with the general view of temporary help as a pro-cyclical activity.9 The 2001 recession had begun (al-beit barely) when the survey was being completed, which may have had some influence on the decline in the 2000 figures.
Off-roll workers, defined as nonemployees, constituted less than 1% of the total workforce in 1994. By 1996, however, the comparable figure rose to 4.2%, rising again in 1997 to 5.4%, where it appears to have remained steady. When we think about the structurally insecure component of
9 The questions in the surveys explicitly ask respondents to exclude agency temps from their estimates and to include only their own “on-payroll” employees. The 1994 survey is less clear in defining temp workers. The prior question asks about the total number of the establishment’s direct employees and then goes on to ask what percentage of those were temps. The 1997 and 2000 estimates explicitly include seasonal workers in the definition of on-roll temps, whereas earlier estimates do not. Respondents in the 1994 and 1996 surveys may not have thought of summer workers or other seasonal employees as tempo-rary help even though seasonal workers are, in many ways, even more temporary than the typical direct-hire temp: their employment will clearly stop at the end of a season (generally four months or less) whereas temps can be employed indefinitely. Any bias associated with this response, however, would not explain the sharp jump in the 1996 survey results nor the sharp decline in the 2000 results.
Table 5. Trends in Use of Alternative Arrangements across NES Samples
Use as percentage of on-roll/employees 1994 1996 1997 2000
Part-time (%) Mean 17.92 16.24 16.66 15.76Median 5.20 3.60 4.00 4.04
Direct-hire temporary (%) Mean 2.66 4.28 5.73 2.77Median 0.00 0.00 0.00 0.00
Off-roll workers (%) Mean 0.51 4.15 5.35 5.36Median 0.00 0.11 0.83 0.00
Percentage of establishments reporting use 1994 1996 1997 2000
Off-roll workers (%) 9.00 50.00 54.00 n/aOff-roll + Temp workers (%) 25.00 65.00 66.00 n/a

ALTERNATIVE EMPLOYMENT ARRANGEMENTS 887
nonstandard work—that is, off-roll workers as well as direct-hire temps whose jobs are irregular (excluding part-time employees)—the estimates from the 1994 survey suggest 3.2% of the total workforce was in that group. By 1996, the percentage rose quite abruptly to more than 8%, climbing all the way past 11% in 1997 before declining to around 8% again in 2000. Again, this pattern may reflect business cycle expansion, at least until 2000.
Looking at how many employers report using any of these arrangements provides another perspective on these trends. In 1994, only 9% of establish-ments reported using any off-roll workers, and only 25% reported using any combination of off-role workers and direct-hire temps. By 1996, both figures had risen dramatically, to 50% and 65%, respectively. The 1997 figures are quite similar, 54% and 66%. The 2000 survey did not ask the same overall question, but the percentage of firms that report using various labor market intermediaries (ranging from the 21% using PEO workers to the 43% using agency temps—see Table 2) suggests that both percentages remained quite high in 2000.
Trends within Organizations
Table 6 compares the estimates available from establishments that re-sponded in both 1994 and 2000. Again, this restricted sample represents employers who are “survivors,” those in business in 1994 and 2000, and ex-cludes new establishments that started up after 1994 and those that failed after 1994. Changes in these results over time suggest modifications in the practices of establishments rather than changes in the establishments who responded to the survey.
The results in Table 6 suggest that the use of part-time workers seems to have declined somewhat over time among the survivors while the use of
Table 6. Trends in Use of Alternative Arrangements among Surviving Firms
Use as percentage of on-roll workers 1994 2000
Part-time (%) Mean 20.4 15.6Median 5.9 3.175th percentile 31.0 24.090th percentile 70.0 53.0
Direct-hire temporary (%) Mean 2.5 4.5Median 0.0 0.075th percentile 0.0 1.190th percentile 3.2 13.0
Off-roll workers (%) Mean 3.2 3.5Median 0.0 0.975th percentile 0.0 3.990th percentile 5.4 11.0
Percentage of firms reporting use 1994 2000
Off-roll workers (%) 10.0 56.0Off-roll + Temp workers (%) 25.0 66.0

888 ILRREVIEW
direct-hire temporaries has expanded considerably, nearly doubling from 2.5% to 4.5%. More generally, the various measures of off-roll arrangements suggest only a moderate increase in their incidence, virtually all of which seem to be explained by differences at the 90th percentile of the distribu-tion. In other words, a small number of employers have greatly expanded their use of these practices since 1994. At the same time, we see more than a fivefold increase in the number of firms using at least one type of off-roll arrangement, suggesting that many of these establishments have begun to experiment with a small number of workers in alternative arrangements.
Summary of Trends
In addition to providing new information on aspects of direct-hire and agency temp use as well as arguably the first rigorous data on PEO and ven-dor use, the above descriptive results suggest a number of things that we did not know before this study. For example:
1. Temp use is more extensive than previously thought.2. Nonstandard arrangements of all kinds are highly skewed by establish-
ment with a small number making very extensive use of them.3. These arrangements expanded faster in the population of establishments
than within individual establishments, suggesting that new establish-ments to the survey, possibly newer in age as well, given a representative sampling frame, made greater use of them.10
4. The increase in their use was not inexorable, however, as there were de-clines between 1997 and 2000.
What we cannot answer within the constraints of this article is why these changes over time occurred. An obvious explanation, as noted above, re-lates to the business cycle. A fast rate of economic growth in the late 1990s perhaps meant that employers were prepared to commit to a higher propor-tion of permanent jobs. Patterns in the data reveal that such growth was as-sociated with changes in the mix of employment arrangements (i.e., substituting permanent jobs for part-time and direct-hire temp jobs) but had little relationship with the mix of employment versus nonemployment arrangements, as the percentage of the latter increased slightly between 1996 and 1997 before leveling off in 2000. Even though the economy was still strong in 2000, the rate of increase in growth certainly slowed.
Given these trends, that systematic efforts to collect more recent data on the use of alternative arrangements by employers have not been done is un-fortunate. The available data, limited as they may be, suggest that overall patterns remained similar, even accounting for the Great Recession. While
10 Mach and Holmes (2008) found that among a representative sample of U.S. small businesses (fewer than 500 employees), younger firms are the most likely to use all forms of alternative arrangements (temps, leased, and contractors).
ALTERNATIVE EMPLOYMENT ARRANGEMENTS 889
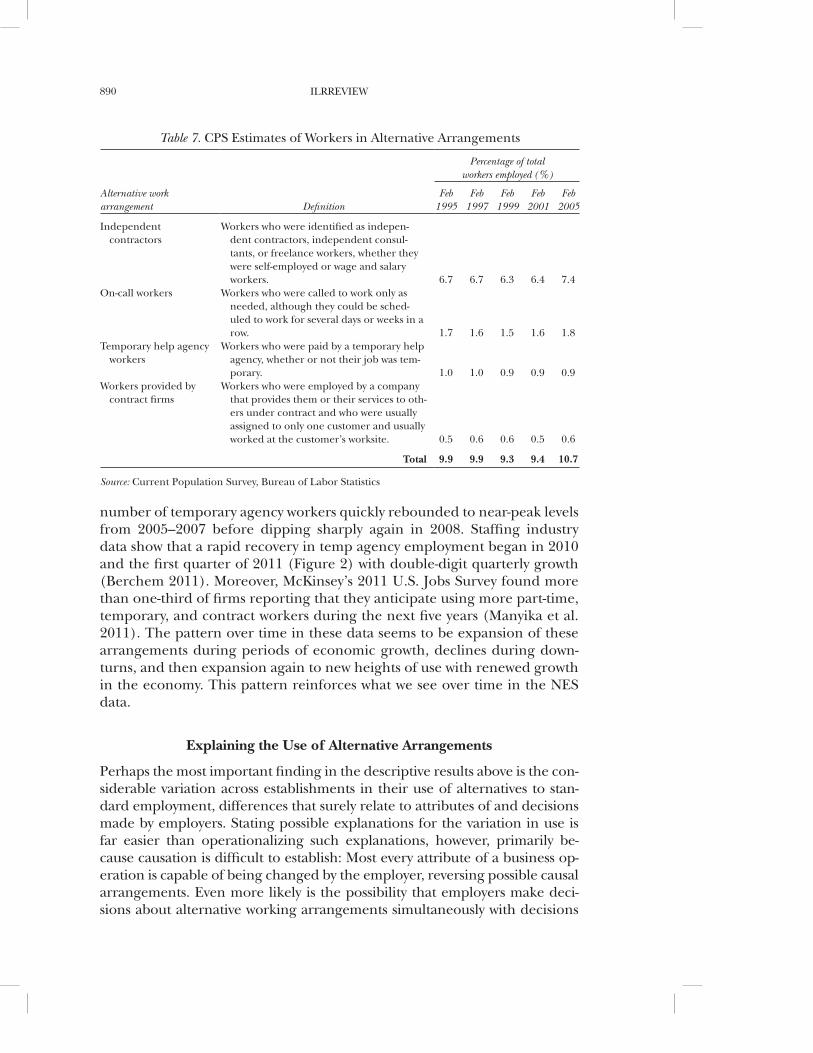
we previously noted the shortcoming with data collected at the individual level, estimates of the percentage of individuals employed in each of the four alternative arrangements identified in the Current Population Survey in 2005 (the last year data were collected) are similar to those reported in the CPS in 1999 and 2001 (Table 7). If anything, the slight increases in those identifying themselves as independent contractors and on-call workers sug-gest that those arrangements may have become more prevalent.
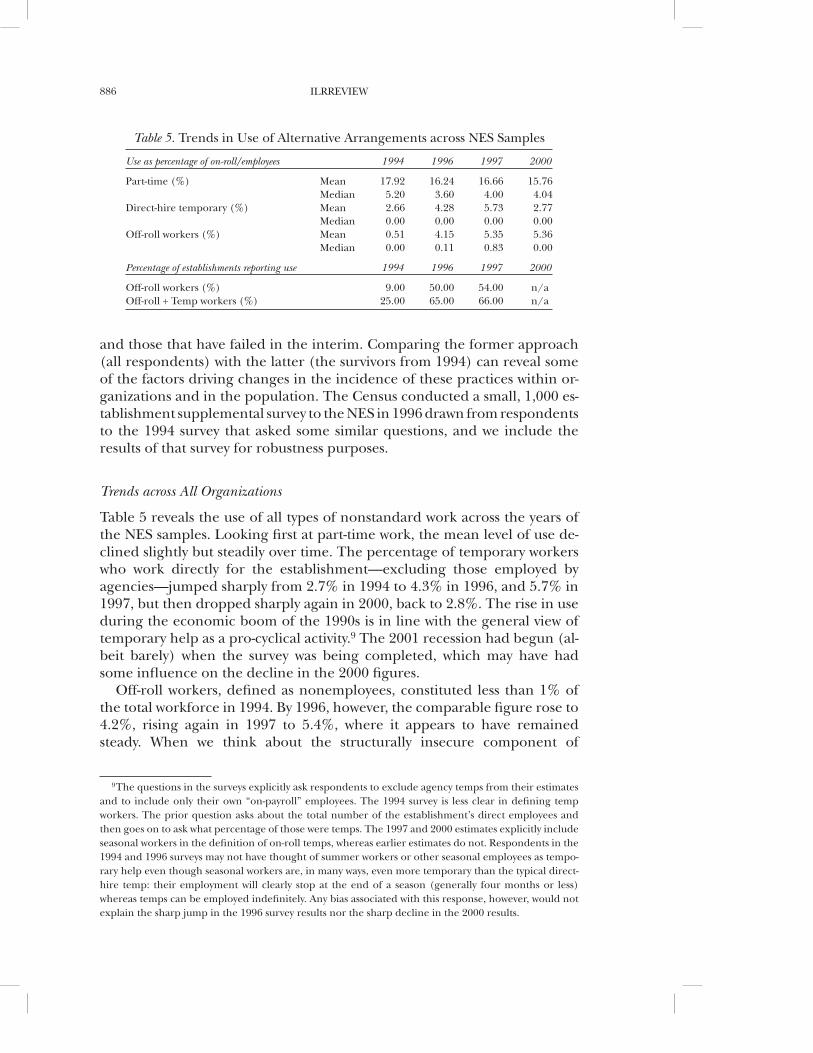
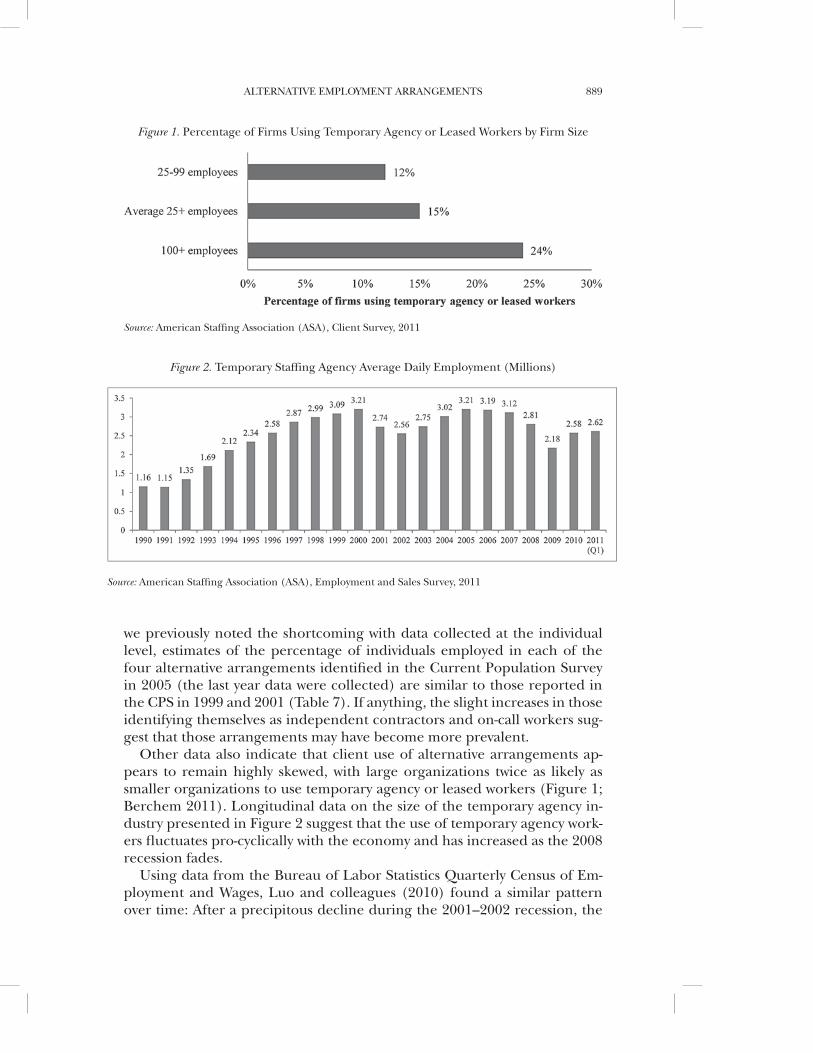
Other data also indicate that client use of alternative arrangements ap-pears to remain highly skewed, with large organizations twice as likely as smaller organizations to use temporary agency or leased workers (Figure 1; Berchem 2011). Longitudinal data on the size of the temporary agency in-dustry presented in Figure 2 suggest that the use of temporary agency work-ers fluctuates pro-cyclically with the economy and has increased as the 2008 recession fades.
Using data from the Bureau of Labor Statistics Quarterly Census of Em-ployment and Wages, Luo and colleagues (2010) found a similar pattern over time: After a precipitous decline during the 2001–2002 recession, the
Figure 1. Percentage of Firms Using Temporary Agency or Leased Workers by Firm Size
Source: American Staffing Association (ASA), Client Survey, 2011
Figure 2. Temporary Staffing Agency Average Daily Employment (Millions)
Source: American Staffing Association (ASA), Employment and Sales Survey, 2011
890 ILRREVIEW
number of temporary agency workers quickly rebounded to near-peak levels from 2005–2007 before dipping sharply again in 2008. Staffing industry data show that a rapid recovery in temp agency employment began in 2010 and the first quarter of 2011 (Figure 2) with double-digit quarterly growth (Berchem 2011). Moreover, McKinsey’s 2011 U.S. Jobs Survey found more than one-third of firms reporting that they anticipate using more part-time, temporary, and contract workers during the next five years (Manyika et al. 2011). The pattern over time in these data seems to be expansion of these arrangements during periods of economic growth, declines during down-turns, and then expansion again to new heights of use with renewed growth in the economy. This pattern reinforces what we see over time in the NES data.
Explaining the Use of Alternative Arrangements
Perhaps the most important finding in the descriptive results above is the con-siderable variation across establishments in their use of alternatives to stan-dard employment, differences that surely relate to attributes of and decisions made by employers. Stating possible explanations for the variation in use is far easier than operationalizing such explanations, however, primarily be-cause causation is difficult to establish: Most every attribute of a business op-eration is capable of being changed by the employer, reversing possible causal arrangements. Even more likely is the possibility that employers make deci-sions about alternative working arrangements simultaneously with decisions
Table 7. CPS Estimates of Workers in Alternative Arrangements
Alternative work arrangement Definition
Percentage of total workers employed (%)
Feb 1995
Feb 1997
Feb 1999
Feb 2001
Feb 2005
Independent contractors
Workers who were identified as indepen-dent contractors, independent consul-tants, or freelance workers, whether they were self-employed or wage and salary workers. 6.7 6.7 6.3 6.4 7.4
On-call workers Workers who were called to work only as needed, although they could be sched-uled to work for several days or weeks in a row. 1.7 1.6 1.5 1.6 1.8
Temporary help agency workers
Workers who were paid by a temporary help agency, whether or not their job was tem-porary. 1.0 1.0 0.9 0.9 0.9
Workers provided by contract firms
Workers who were employed by a company that provides them or their services to oth-ers under contract and who were usually assigned to only one customer and usually worked at the customer’s worksite. 0.5 0.6 0.6 0.5 0.6
Total 9.9 9.9 9.3 9.4 10.7
Source: Current Population Survey, Bureau of Labor Statistics
ALTERNATIVE EMPLOYMENT ARRANGEMENTS 891
about other practices. Longitudinal data per se do not solve these problems given that many important attributes are in place before the data begin to be collected, and such data cannot rule out simultaneous changes.
Most of the factors examined in prior studies to explain the incidence of alternative arrangements vary along with the incidence of those arrange-ments, so it makes more sense to suggest that the prior hypotheses we con-sider below are about association rather than causation.
Cost Reduction
The first and principal explanation suggested for the use of nonstandard relationships is employers’ desire to save on a variety of employment costs. The prior evidence and arguments are decidedly mixed, so exploring these explanations with the NES III seems especially warranted.
Some evidence supports that in some alternative arrangements employ-ers pay workers less than employees in comparable jobs. Temp agency work-ers experience a wage penalty in all occupations other than nursing, for which a premium is paid (Kilcoyne 2005; Peck and Theodore 2007). Yet, these savings are likely to be offset in part, if not entirely, by the margins paid to staffing agencies (Peck, Theodore, and Ward 2005). Houseman et al. (2003) found situations in which nonstandard workers were hired to avoid raising the wages of permanent employees. Similarly, Davis-Blake, Broschak, and George (2003) showed that employers may contract out high-wage jobs to avoid perceptions of internal wage inequality. Gramm and Schnell’s (2001) study of Alabama manufacturing establishments found that the likelihood of contracting out certain jobs was positively related to core employee’s wages, suggesting that when the costs of standard work ar-rangements are higher, we may expect to see higher use of nonstandard ar-rangements. The Federal Fair Labor Standards Act requires firms to pay nonexempt workers time-and-a-half for overtime hours, with exemptions for nonemployees (Coens and Storrs 2006). Firms that make more use of overtime hours may therefore have a greater incentive to save on wages by using nonstandard workers to cover those hours, even if they are paid a comparable base wage.11
While employers may save on wages, the most important compensation savings may concern the provision of benefits, as nonemployees are not re-quired to receive the same benefits as full-time employees.12 As a result,
11 The use of overtime hours may also indicate the need for numeric flexibility, which we address below.
12 The Employee Retirement Income Security Act (ERISA) and Internal Revenue Service regulations require that if employers offer pension, health insurance, and other employee benefits that have prefer-ential tax status to any employees, they must make them available to all regular, full-time employees. These benefits typically increase total compensation by 25 to 40% (Muhl 2002). Exceptions are allowed for workers who work fewer than what has traditionally been seen as regular hours, effectively exempting part-time workers, and tenure eligibility requirements (e.g., waiting six months before becoming eligible for certain benefits) are also allowed, effectively exempting many direct-hire temporary workers. Work-
892 ILRREVIEW
there appear to be greater incentives for employers that offer more gener-ous benefit packages to make more use of nonstandard arrangements in an effort to cut costs. Lautsch (2003) showed that many companies use non-standard workers to avoid paying for health care and other fringe benefits, and Peck and Theodore (1998) found that some employers use agency temps to save on overall compensation (including benefits). Mitlacher’s (2007) fieldwork in American banking and catering firms revealed that the use of temp agency workers was driven in part by the fact that these workers did not have to be included in the companies’ retirement and pension plans.
Yet, HR managers consistently report in recent years that they do not use these arrangements to save on employee benefits (Houseman 2001; Kalle-berg et al. 2003). While such responses may be subject to social desirability bias, establishment-level surveys have shown that the scale of benefits of-fered does not predict use of nonstandard arrangements (Kalleberg et al. 2003). Houseman (2001) found that offering good benefits predicts the use of temp agency workers but not independent contractors, even though both are nonemployee arrangements, as well as predicting the use of part-time and on-call workers, but not direct-hire temps, even though all are employ-ment arrangements. Reverse causation might be a possible explanation (e.g., greater use of temps makes it easier to provide more generous bene-fits to the fewer regular employees).
To test the cost-savings hypotheses, we see whether establishments that have higher pay, use more overtime hours, and offer more benefits, other things equal, make greater use of alternative arrangements.
Flexibility
The second common explanation for the use of alternative arrangements is that they provide employers with greater “numerical” flexibility, which is the ability to adjust the number of workers being used (Smith 1997; Kalleberg 2000). Surveys of human resource managers report that all nonstandard work arrangements are used to meet variations in demand, and firms in seasonal industries make greater use of most nonstandard arrangements, though in-dustry cyclicality seems to have no effect on their use (Houseman 2001; Kal-leberg et al. 2003). McLaughlin and Coleman-Jensen (2008) noted that in agriculture, a notoriously seasonal industry, 45% of work arrangements are nonstandard. Lombardi and Ono (2008) found that new manufacturing plants, which may be more likely to face more uncertain demand, are more likely to use leased employees. They also found the highest rate of use in the transportation industry, which is especially sensitive to fluctuations in demand.
Restructuring decisions associated with the term “reengineering” in the late 1990s, downsizing decisions, and outsourcing may also reflect business uncertainty and create uncertainty in labor needs. Employers began to add
ers who are not employees—contractors and agency temps, for example—are not eligible for employ-ment-related benefits.
ALTERNATIVE EMPLOYMENT ARRANGEMENTS 893
temporary agency workers while laying off permanent employees during the period of widespread downsizing and reengineering following the 2001 recession (Peck and Theodore 2007). More directly, Schreft and Singh (2003) concluded that substituting nonstandard for more permanent ar-rangements is a strategy used by firms to meet increases in demand follow-ing layoffs.
Establishments may also turn to nonstandard arrangements for numeri-cal flexibility when the fixed costs of hiring and dismissing workers make it more expensive to adjust the number of standard employees. Using temps allows employers to dismiss the temps who are not suitable for full-time jobs without the risk of violating employment laws, which apply only to direct employees,13 and to then hire those who are suitable into regular employ-ment (see Davis-Blake and Broschak 2000; Miles 2000). Houseman and col-leagues (2003) found that using agency temps allows firms to sample riskier employees in low-skill occupations. Gramm and Schnell (2001) found that the use of nonstandard arrangements was positively associated with the hir-ing costs for permanent employees in their sample of manufacturing firms. Severance pay is one clear factor that makes dismissals more expensive.
Scholars have suggested that the presence of a union may increase the employer’s interest in implementing nonstandard arrangements to get around union work, but may decrease the employer’s ability to do so by re-sisting the changes in collective bargaining (see Kalleberg et al. 2003 for a summary of this debate; Davis-Blake and Uzzi 1993, Theodore and Peck 2002, and Lombardi and Ono 2008 for evidence).
The NES III data include several measures associated with the need for greater flexibility, as reflected in the above hypotheses: seasonal employ-ment variability, reengineering in the past 3 years, a downsizing or outsourc-ing of a portion of their workforce in the past 12 months, whether they offered severance packages to standard employees, and their average re-cruiting costs. The survey also asks whether any of the firm’s employees are represented by a union.
Ability to Use Nonstandard Workers
Nonemployees are governed by contracts that specify job requirements and effort levels in advance, performance is monitored by the client, and dis-putes are ultimately adjudicated by the court system. As a result, alternative arrangements make the most sense for employers when performance re-quirements are straightforward and easy to specify, and where monitoring those requirements is straightforward as well. Masters and Miles’ (2002) multi-firm analysis of hiring decisions revealed that firms are more likely to use off-roll arrangements in positions for which performance is easy to as-sess. Mayer and Nickerson (2005) similarly found that firms are more likely
13 Again, the exception is if a client of a vendor or independent contractor directs such workers in ways that make them effectively employees. In that case, the client can become a co-employer, liable for the provisions of employment law.
894 ILRREVIEW
to use regular employees than independent contractors as the cost to verify project quality increases. In her qualitative study of the use of contingent workers, Lautsch (2002) found that in half of the firms, contingent workers were assigned to positions that had more narrowly defined tasks than regu-lar workers. To the extent that supervisors monitor the performance of tasks by individual workers, jobs are likely to require less monitoring when the ratio of workers to supervisors is high. Teamwork may represent the oppo-site situation: individual tasks are hard to define and hard to monitor, and inserting workers on a temporary or casual basis is difficult. Firm-specific skill requirements may also make it more difficult to use nonstandard ar-rangements. Training expenditures may represent something about the level of firm-specific skills that are required.
Analysis and Results
We examine the above hypotheses with regression analyses shown in Table 9, using the independent variables described in Table 8 to test the
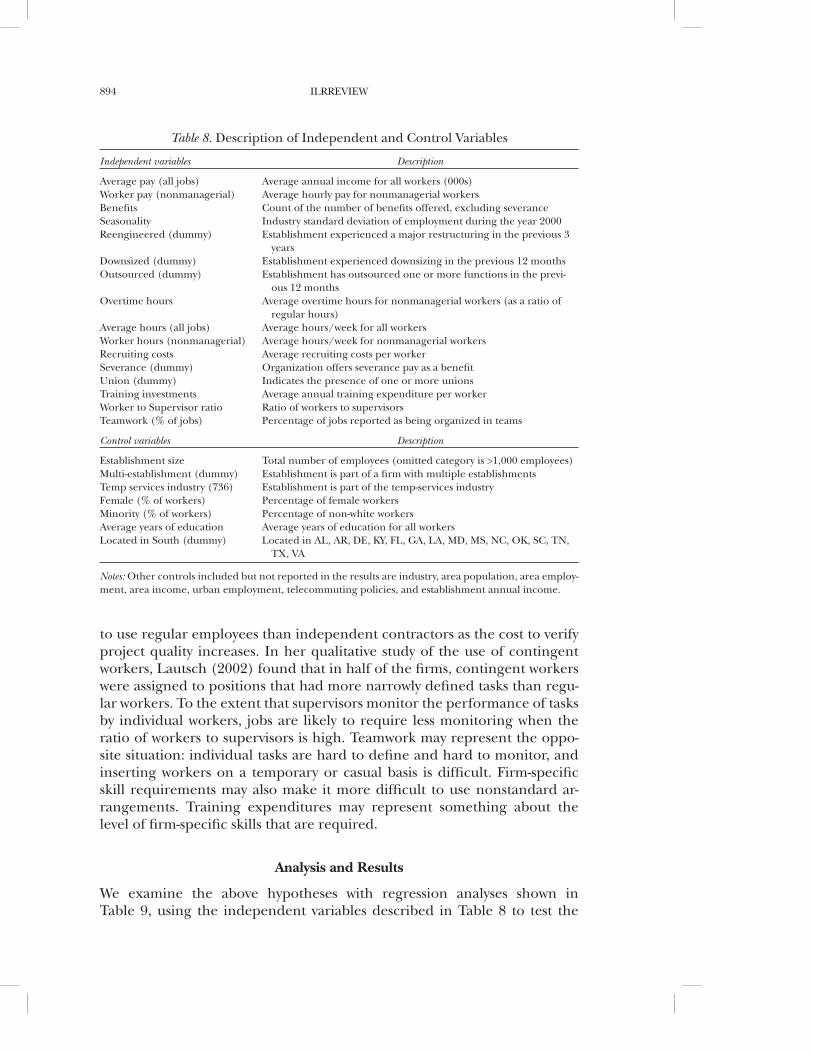
Table 8. Description of Independent and Control Variables
Independent variables Description
Average pay (all jobs) Average annual income for all workers (000s)Worker pay (nonmanagerial) Average hourly pay for nonmanagerial workersBenefits Count of the number of benefits offered, excluding severanceSeasonality Industry standard deviation of employment during the year 2000Reengineered (dummy) Establishment experienced a major restructuring in the previous 3
years Downsized (dummy) Establishment experienced downsizing in the previous 12 monthsOutsourced (dummy) Establishment has outsourced one or more functions in the previ-
ous 12 monthsOvertime hours Average overtime hours for nonmanagerial workers (as a ratio of
regular hours)Average hours (all jobs) Average hours/week for all workersWorker hours (nonmanagerial) Average hours/week for nonmanagerial workersRecruiting costs Average recruiting costs per workerSeverance (dummy) Organization offers severance pay as a benefitUnion (dummy) Indicates the presence of one or more unionsTraining investments Average annual training expenditure per workerWorker to Supervisor ratio Ratio of workers to supervisors Teamwork (% of jobs) Percentage of jobs reported as being organized in teams
Control variables Description
Establishment size Total number of employees (omitted category is >1,000 employees)Multi-establishment (dummy) Establishment is part of a firm with multiple establishmentsTemp services industry (736) Establishment is part of the temp-services industry Female (% of workers) Percentage of female workersMinority (% of workers) Percentage of non-white workersAverage years of education Average years of education for all workersLocated in South (dummy) Located in AL, AR, DE, KY, FL, GA, LA, MD, MS, NC, OK, SC, TN,
TX, VA
Notes: Other controls included but not reported in the results are industry, area population, area employ-ment, area income, urban employment, telecommuting policies, and establishment annual income.
ALTERNATIVE EMPLOYMENT ARRANGEMENTS 895
Table 9. Tobit Regression Models Predicting the Use of Nonstandard Work Arrangementsa
Variable
All nonstandard arrangements
Contingent arrangements
Agency temp workers
Direct-hire temp workers
PEO (leased) workers
Independent contractors
b s.e. b s.e. b s.e. b s.e. b s.e. b s.e.
Less than 50 employ-ees –8.03** 1.8 –9.92** 1.7 –14.69** 2.1 –21.73** 3.5 –6.23* 2.8 –8.32** 2.4
50 to 99 employees –3.88* 1.6 –3.78* 1.6 –10.30** 1.9 –14.66** 3.1 1.23 2.5 –5.63* 2.2100 to 249 employ-
ees –3.85** 1.5 –3.54* 1.4 –5.51** 1.6 –9.03** 2.7 –4.05† 2.4 –6.29** 2.0250 to 1,000 employ-
ees –2.67* 1.3 –1.37 1.2 –2.36† 1.4 –4.60* 2.3 –1.4 2.0 –3.75* 1.7Multi-establishment
(dummy) 0.68 0.9 0.84 0.9 2.57* 1.1 –0.29 1.8 –4.44** 1.5 4.28** 1.3Temp Services Indus-
try (736) 57.55** 5.6 62.83** 5.2 71.82 8.9Female (% of work-
ers) 6.50** 2.2 0.44 2.1 1.03 2.6 4.41 4.2 3.96 3.5 –0.51 3.2Minority (% of work-
ers) –0.83 1.7 2.58 1.6 4.67* 2.0 –7.93* 3.3 5.14† 2.6 4.33† 2.3Average years of edu-
cation 0.81† 0.5 0.96* 0.5 1.03† 0.6 1.06 0.9 2.22** 0.8 0 0.7Located in South
(dummy) –1.69† 1.0 0.78 1.0 1.57 1.2 –2.75 2.0 0.39 1.6 0.22 1.4Average pay (all
jobs) 2.92 3.1 3.82 3.0 11.17** 3.7 5.05 5.7 2.51 5.0 2 4.4Worker pay (non-
managerial) –8.19** 3.0 –4.04 3.0 –9.99** 3.6 –8.80 5.6 –3.03 4.9 4.56 4.4Benefits –0.88** 0.3 –0.64* 0.3 0.09 0.4 –1.84** 0.5 1.15* 0.5 –0.24 0.4Seasonality 52.57* 25.6 10.18** 2.6 –1.43 32.5 21.47** 4.4Reengineered
(dummy) 0.69 0.8 0.07 0.8 0.2 0.9 –1.05 1.5 3.72** 1.2 –1.04 1.1Downsized (dummy) –0.22 0.9 –0.67 0.8 –0.35 1.0 –2.02 1.7 2.89* 1.3 –0.86 1.2Outsourced
(dummy) 0.8 0.8 2.01** 0.8 1.96* 0.9 1.97 1.5 1.17 1.3 1.79~ 1.1Overtime hours 51.54** 7.4 6.44 7.3 2.16 11.0 –2.94 14.3 2.98 11.8 –4.39 12.3Average hours (all
jobs) –9.75 8.5 –17.98* 8.1 0.27 11.0 22.57 19.1 –59.72** 11.9 –8.87 11.5Worker hours (non-
managerial) –27.34** 8.4 15.38† 8.2 0.58 12.0 –23.88 17.7 54.43** 12.9 16.11 12.0Recruiting costs 0.57** 0.2 0.75** 0.2 0.47* 0.2 0.43 0.3 0.97** 0.3 0.47* 0.2Severance (dummy) 0.09 0.8 0.55 0.8 –0.39 1.0 3.16† 1.6 –3.06* 1.4 –0.53 1.2Union (dummy) –2.90* 1.2 –3.29** 1.2 –7.57** 1.4 2.95 2.3 –1.32 2.0 –1.21 1.7Worker to Supervisor
ratio –0.45* 0.2 –0.37* 0.2 –0.42† 0.2 –0.03 0.0 –0.01 0.0 –0.69* 0.3Training investments –0.42* 0.2 –0.35† 0.2 –0.05 0.2 –1.53** 0.4 –0.28 0.3 0.68* 0.3Teamwork (% of
jobs) 2.64* 1.3 1.63 1.3 1.48 1.5 2.17 2.6 1.21 2.1 0.9 1.8Constant 17.86** 3.9 –42.42 37.8 –55.49 51.3 –11.72 7.3 –33.14 61.2 –5.55 59.2
Observations 2,073 2,005 2,095 2,082 2,062 2,034Log likelihood –7763.25 –6228.22 –4261.53 –2595.9 –2501.16 –3679.45
aIndustry variables not reported. Other controls not reported are area population, employment, income, urban em-ployment, telecommuting policies, and establishment annual income.**p < 0.01, *p < 0.05, †p < 0.10
896 ILRREVIEW
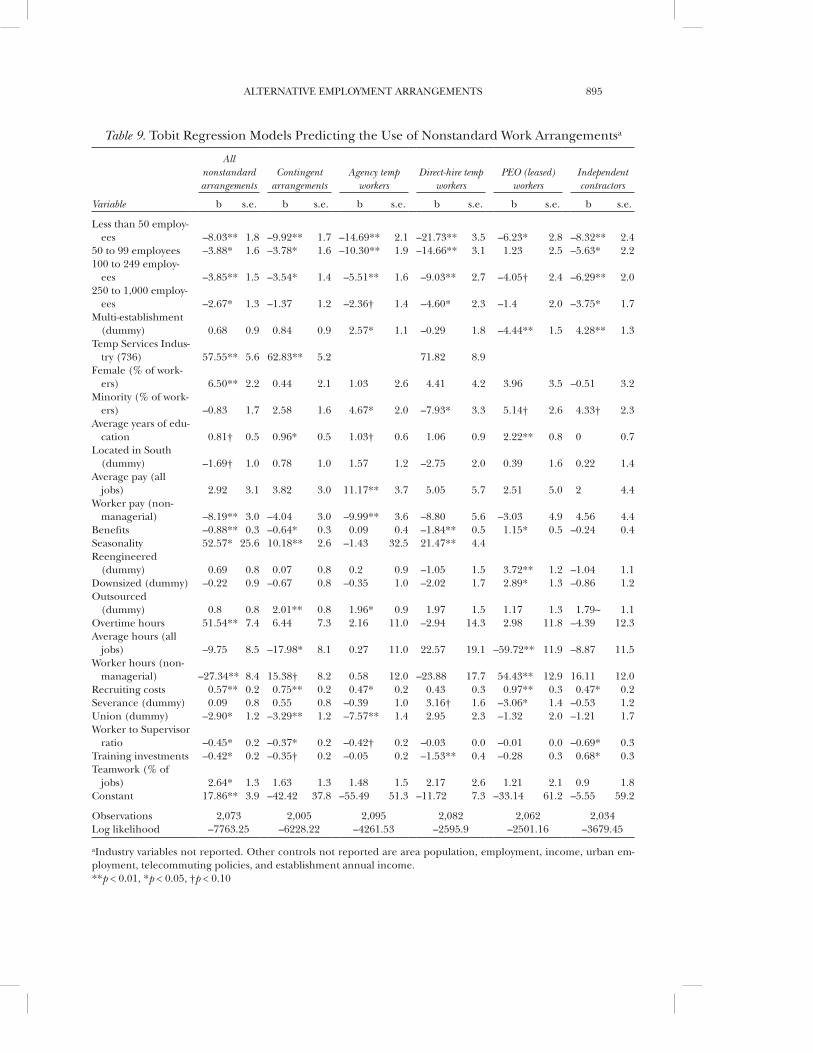
hypotheses described above. Access limitations at the Census Bureau re-stricted the analyses to the 2000/2001 data. Because of the difficulty in doing follow-up analyses of the data, these results should best be considered as preliminary.
The dependent variable in each case is a percentage of the workforce, bounded between 0 and 100, in a given arrangement. We know from the descriptive data presented earlier that many establishments use no alterna-tive arrangements while a few use them a great deal. Given that, many obser-vations will likely be at or near the limits of 0 and 100%. Ordinary least square regressions would be biased when the range of observations is con-strained in that manner, and Tobit estimation techniques are more appro-priate. The coefficients on such estimates cannot be interpreted in a straightforward fashion, however.14
Columns 3, 4, 5, and 6 in Table 9 represent specific alternative arrange-ments while Column 1 represents all arrangements other than full-time, standard employment; and Column 2 represents those associated with con-tingent work (i.e., everything but part-time work). Smaller establishments (the omitted category is more than 1,000 employees) make less use of these arrangements.15 More generally, the relationships differ across the types of nonstandard work, no doubt reflecting the varying attributes associated with each arrangement. For example, factors associated with using agency temps are different from those associated with using direct-hire temps, per-haps suggesting they are substitutes for each other.
Cost Reduction
No support is found in these results for the notion that higher pay and greater employee benefits are associated with greater use of alternative ar-rangements. Indeed, significant results are often in the opposite direction. While we do not have good measures as to how generous benefits are, we do have a simple count as to how many benefits the employer offered (“Benefits”).16 Perhaps surprisingly, the more benefits an establishment of-fered, the less they made use of nonstandard work.
The ratio of overtime hours (“Overtime Hours”), however, is significantly related to the incidence of nonstandard work. Presumably higher overtime
14 Weighting the observations based on weights representing the actual distribution of establishments by industry in the economy typically improves the results considerably. Weighted Tobit regression re-quires nonstandard software that was not available at CES when these analyses were conducted. The Appendix contains descriptive statistics for the subsample used in the regression analysis as the original sample is reduced because of missing data.
15 Among control variables not reported, manufacturing industries make greater use of alternative ar-rangements than nonmanufacturing, and establishments with more women have significantly more non-standard work as do those with a higher level of education in their workforce.
16 The list of benefits includes pensions, health care, dental care, child care, leave for family emergen-cies (presumably beyond what is required by law), life insurance, sick pay, paid vacations, and severance pay (estimated separately). While not a perfect estimate of how generous benefits are, this list is similar to the scale of benefits score used by Kalleberg et al. (2003), and is arguably better than the categorical responses used in the Upjohn survey (see Houseman 2001).

ALTERNATIVE EMPLOYMENT ARRANGEMENTS 897
hours suggests an opportunity to avoid overtime pay rates by using nonstan-dard jobs, especially off-role workers. Average weekly hours worked by all workers in the establishment (“Average Hours”) are also positively related to nonstandard work, but average weekly hours specifically for non-managers/nonexempt workers, who are the focus of these practices (“Worker Hours”), are not.
Flexibility
At the two-digit industry level, we use the standard deviation of employment over the course of the year 2000 to measure industry seasonality (“Seasonal-ity”) and find that establishments in industries with greater variance in em-ployment over the course of the year are associated with greater use of nonstandard employment. A second set of variables that may proxy for flex-ibility are major restructurings. We might think of these as “one-shot” varia-tions rather than seasonality. Reengineering in the past three years (“Reengineered”) and downsizing in the past 12 months (“Downsized”), which change organizational structure and job definitions, are not associ-ated with overall use of nonstandard or contingent work, but they do seem to be strongly associated with the use of PEOs. Perhaps moving workers to PEO status, a radical change, is easier in the context of these other big changes, or perhaps making all these changes simultaneously is easier. No relationship is observed with outsourcing decisions (“Outsourced”), and therefore we have no evidence as to whether alternative arrangements are either substitutes or complements for outsourcing.
We examine the fixed costs of hiring workers with the average amount of money spent on recruiting and hiring a full-time employee (“Recruiting Costs”) and find that it is positively associated with most of the alternative arrangements, suggesting that employers do make greater use of nonstan-dard employees when it costs more to hire regular employees. The one as-pect of nonstandard work for which the relationship is not significant is for the use of agency temps, which may be surprising because employers use agency temps as an alternative means for hiring regular employees. No rela-tionship is observed with the use of severance pay (“Severance”), which raises the costs of involuntary dismissal and these alternative arrangements.
We find that unionization is associated with less use of nonstandard ar-rangements, having the largest negative effect on the use of agency temps. The coefficient for the direct-hire temps is positive but insignificant, while the coefficients for all off-roll arrangements are negative, suggesting that unions primarily restrict the use of off-roll arrangements. Perhaps the rea-son is that off-role workers are not eligible to join the union.
Ability to Use Nonstandard Arrangements
We examine the ability to monitor work and workers with the span of con-trol (“Worker to Supervisor Ratio”) and find that greater span is associated with greater use of nonstandard arrangements. Establishments that use

898 ILRREVIEW
more firm-specific skills as measured by training expenditures per worker (“Training Investments”) are associated with less use of nonstandard work. The relationships with teamwork (“Teamwork”) are surprisingly positive with the overall use of nonstandard arrangements, suggesting that nonstan-dard work is more common where teamwork is more common.
Summary and Conclusions
Overall, the descriptive results suggest that nonstandard work accounts for a sizeable component of the actual work done inside U.S. establishments every day. Although such work has been on the rise, the increase has not been inexorable over time, and the variation of use across establishments is quite remarkable. Perhaps the most surprising results are those suggesting that few establishments actually use these alternative work arrangements but that many of those that do, use them intensively. Attributes unique to individual establishments appear to be powerfully related to the extent such arrangements are used.
Our regression results examine the most prominent arguments concern-ing the factors associated with the use of alternative arrangements across operations. Some of them do not support prior views, such as the lack of evidence for the idea that employers use alternative arrangements to econo-mize on wage and benefit costs, with the exception of increased use where overtime is greater. We find some support for the currently popular notion that establishments use alternative work arrangements to gain flexibility, as use is greater where industry employment has been more variable, but the only significant relationship with the proxies for restructuring is with con-tingent work, agency temps in particular.
Some of the results help settle arguments in which hypotheses ran in op-posite directions, such as whether unions increase or decrease the use of these practices (we find on average that they decrease them). Perhaps our most novel results concern the idea that these arrangements are used more when jobs are easier to monitor. Nonstandard work is used more where jobs appear easier to monitor and are less firm-specific, although we find unex-pected associations with the teamwork proxy.
Recognize that the measures used here are imperfect and are certainly incomplete proxies for many of the hypotheses being tested. For example, the common-sense idea that establishments will make greater use of non-standard arrangements when they are cheaper than regular employment requires knowing much more than we do here about all aspects of the costs of standard employment and the nonstandard alternatives. Measures of av-erage practices, such as teamwork, may not be capturing the most relevant aspects of whether jobs can be monitored. Perhaps the non-team jobs in such establishments are especially suited to nonstandard arrangements that support the teams. These concerns suggest the continuing need for more detailed, fine-grained studies, perhaps at the expense of generalizability, that can examine more of the relevant factors.
ALTERNATIVE EMPLOYMENT ARRANGEMENTS 899
Going forward, arguably the most important of the persistent questions concerning alternatives to standard work is to pin down causation. Can we find contexts in which we can see clearly what factors may be driving their use and specifically the change in use over time both within and across es-tablishments? Other, more novel questions concern how these arrange-ments affect other aspects of business operations. For example, what else changes when employers expand the use of these practices? These and re-lated questions will no doubt benefit from more context-specific data col-lected from within operations and organizations.
References
Abraham, Katharine G. 1990. Restructuring the employment relationship: The growth of market-mediated work arrangements. In Katharine G. Abraham and R. B. McKersie (Eds.), New Developments in the Labor Market: Toward a New Institutional Paradigm, pp. 85–119. Cam-bridge, MA: MIT Press.
Abraham, Katharine G., and Susan K. Taylor. 1996. Firms’ use of outside contractors: Theory and evidence. Journal of Labor Economics 14(3): 394–424.
Autor, David H. 2003. Outsourcing at will: The contribution of unjust dismissal doctrine to the growth of employment outsourcing. Journal of Labor Economics 21(1): 1–42.
Autor, David H., and Susan N. Houseman. 2006. Temporary agency employment as a way out of poverty? In Rebecca M. Blank, Sheldon H. Danziger, and Robert F. Schoeni (Eds.), Work-ing and Poor: How Economic and Policy Changes Are Affecting Low-Wage Workers, pp. 312–37. New York: Russell Sage Foundation.
Belman, Dale L., and Lonnie Golden. 2000. Nonstandard and contingent employment: Con-trasts by job type, industry, and occupation. In Françoise Carré, Marianne A. Ferber, Lonnie Golden, and Stephen A. Herzenberg (Eds.), Nonstandard Work: The Nature and Challenges of Changing Employment Arrangements, pp. 167–212. Champaign, IL: Industrial Relations Re-search Association.
Berchem, Steven P. 2011. Leading U.S. job growth. Staffing Success. http://www.americanstaff ing.net. Alexandria, VA: American Staffing Association.
Cappelli, Peter. 1999. The New Deal at Work: Managing the Market-Driven Workforce. Boston, MA: Harvard Business School Press.
———. 2000. Market-mediated employment: The historical context. In Margaret M. Blair and Thomas A. Kochan (Eds.), The New Relationship: Human Capital and the American Corpora-tion, pp. 66–101. Washington, DC: The Brookings Institution.
Cappelli, Peter, and JR Keller. 2013. Classifying work in the new economy. Academy of Manage-ment Review 8(4) (October).
Coens, Thomas A., and Alvin L. Storrs. 2006. No safe harbor: A review of significant laws af-fecting contingent workers. In Sandra E. Gleason (Ed.), The Shadow Workforce: Perspectives on Contingent Work in the United States, Japan, and Europe, pp. 135–168. Kalamazoo, MI: W. E. Upjohn Institute for Employment Research.
Davis-Blake, Alison, and Joseph P. Broschak. 2000. Speed bumps or stepping stones: The ef-fect of labor market intermediaries on relational wealth. In Denise Rousseau and C. Leana (Eds.), Relational Wealth: A New Model for Employment in the 21st Century. New York: Oxford University Press.
Davis-Blake, Alison, and Brian Uzzi. 1993. Determinants of employment externalization: A study of temporary workers and independent contractors. Administrative Science Quarterly 38(2): 195–223.
Davis-Blake, Alison, Joseph P. Broschak, and Elizabeth George. 2003. Happy together? How using nonstandard workers affects exit, voice, and loyalty among standard employees. Acad-emy of Management Journal 46(4): 475–85.
Dey, Matthew, Susan N. Houseman, and Anne E. Polivka. 2006. Manufacturers’ outsourcing to employment services. Upjohn Institute Working Paper 07-123. Kalamazoo, MI: W. E. Upjohn Institute for Employment Research.

900 ILRREVIEW
Feinman, Jay M. 1976. The development of the employment at will rule. American Journal of Legal History 20(2): 118–35.
Gleason, Sandra E. (Ed.). 2006. The shadow workforce. The Shadow Workforce: Perspectives on Contingent Work in the United States, Japan, and Europe, pp. 1–28. Kalamazoo, MI: W. E. Up-john Institute for Employment Research.
Gramm, Cynthia L., and John F. Schnell. 2001. The use of flexible staffing arrangements in core production jobs. Industrial and Labor Relations Review 54(2): 245–58.
Hipple, Steven. 2001. Contingent work in the late-1990s. Monthly Labor Review (March): 3–27.Houseman, Susan N. 2001. Why employers use flexible staffing arrangements: Evidence from
an establishment survey. Industrial and Labor Relations Review 55(1): 149–70.Houseman, Susan N., Arne L. Kalleberg, and George A. Erickcek. 2003. The role of tempo-
rary agency employment in tight labor markets. Industrial and Labor Relations Review 57(1): 105–27.
Kalleberg, Arne L. 2000. Nonstandard employment relations: Part-time, temporary and con-tract work. Annual Review of Sociology 26(1): 341–65.
Kalleberg, Arne L., David Knoke, and Peter V. Marsden. 1995. Interorganizational networks and the changing employment contract. Connections 18(2): 32–49.
Kalleberg, Arne L., Jeremy Reynolds, and Peter V. Marsden. 2003. Externalizing employment: Flexible staffing arrangements in US organizations. Social Science Research 32(4): 525–52.
Kalleberg, Arne L., Peter V. Marsden, Howard E. Aldrich, and James W. Cassell. 1990. Com-paring organizational sampling frames. Administrative Science Quarterly 35(4): 658–88.
Kilcoyne, Patrick. 2005. Occupations in the temporary help services industry. Occupational Employment and Wages. Washington, DC: US Department of Labor.
Lautsch, Brenda A. 2003. The influence of regular work systems on compensation for contin-gent workers. Industrial Relations 42(4): 565–88.
———. 2002. Uncovering and explaining variance in the features and outcomes of contin-gent work. Industrial & Labor Relations Review 56(1): 23–43.
Lombardi, Britton, and Yukako Ono. 2008. Professional employer organizations: What are they, who uses them, and why should we care? Economic Perspectives 32(4): 2–14.
Luo, Tian, Amar Mann, and Richard Holden. 2010. The expanding role of temporary help services from 1990 to 2008. Monthly Labor Review 133(8): 3–16.
Mach, Traci L., and John A. Holmes. 2008. The use of alternative employment arrangements by small businesses: Evidence from the 2003 Survey of Small Business Finances. Washing-ton, DC: Board of Governors of the Federal Reserve System.
Manpower. 2009. Manpower Employment Outlook Survey. Milwaukee, WI: Manpower Services.Manyika, James, Susan Lund, Byron Auguste, Lenny Mendonca, Tim Welsh, and Sreenivas
Ramaswamy. 2011. An Economy That Works: Job Creation and America’s Future. McKinsey Global Institute: McKinsey & Company. Accessed at http://www.mckinsey.com.
Masters, John K., and Grant Miles. 2002. Predicting the use of external labor arrangements: A test of the transaction costs perspective. Academy of Management Journal 45(2): 431–42.
Mayer, Kyle J, and Jack A. Nickerson. 2005. Antecedents and performance implications of contracting for knowledge workers: Evidence from information technology services. Orga-nization Science 16(3): 225–42.
McLaughlin, Diane K., and Alisha J. Coleman-Jensen. 2008. Nonstandard employment in the nonmetropolitan United States. Rural Sociology 73(4): 631–59.
Miles, Thomas J. 2000. Common law exceptions to employment at will and U.S. labor mar-kets. Journal of Law, Economics, and Organization 16(1): 74–101.
Mitlacher, Lars W. 2007. The role of temporary agency work in different industrial relations systems—A comparison between Germany and the USA. British Journal of Industrial Relations 45(3): 581–606.
Muhl, Charles J. 2002. What is an employee? The answer depends on the Federal law. Monthly Labor Review (January): 3–11.
Peck, Jamie, and Nikolas Theodore. 1998. The business of contingent work: Growth and re-structuring in Chicago’s temporary employment industry. Work, Employment & Society 12(4): 655–74.
———. 2007. Flexible recession: The temporary staffing industry and mediated work in the United States. Cambridge Journal of Economics 31(2): 171–92.
ALTERNATIVE EMPLOYMENT ARRANGEMENTS 901
Peck, Jamie, Nikolas Theodore, and Kevin Ward. 2005. Constructing markets for temporary labour: Employment liberalization and the internationalization of the staffing industry. Global Networks 5(1): 3–26.
Polivka, Anne E. 1996. Contingent and alternative work arrangements, defined. Monthly Labor Review 119(10): 3–9.
Schreft, Stacey L., and Aarti Singh. 2003. A closer look at jobless recoveries. Economic Review (Second Quarter): 45–72. Federal Reserve Bank of Kansas City, Missouri.
Smith, Vicki. 1997. New forms of work organization. Annual Review of Sociology 23(1): 315–39.———. 2001. Teamwork vs. tempwork: Managers and the dualisms of workplace restructur-
ing. In Daniel B. Cornfield, Karen E. Campbell, and Holly J. McCammon (Eds.), Working in Restructured Workplaces: New Directions for the Sociology of Work, pp. 7–28. Thousand Oaks, CA: Sage Publications.
Smith, Vicki, and Esther B. Neuwirth. 2008. The Good Temp. Ithaca, NY: Cornell University Press/ILR Press.
Stone, K. 2006. Legal protections for atypical employees: Employment law for workers with-out workplaces and employees with employers. Berkeley Journal of Employment and Labor Law 27(2): 251–86.
Theodore, Nik, and Jamie Peck. 2002. The temporary staffing industry: Growth imperatives and limits to contingency. Economic Geography 78(4): 463–93.
von Hippel, Courtney, Venkat Bendapudi, Judith Tansky, David B. Greenberger, Stephen L. Mangum, and Robert L. Heneman. 2006. Operationalizing the shadow workforce: Toward an understanding of the participants in nonstandard employment relationships. In Sandra E. Gleason (Ed.), The Shadow Workforce: Perspectives on Contingent Work in the United States, Japan, and Europe, Kalamazoo, MI: W. E. Upjohn Institute for Employment Research.