a study of the behaviour and interactions of the novel
TRANSCRIPT

A study of the behaviour and interactions of the novelFERM protein Willin
By Lissa Rocha Herron, B.S.
A thesis submitted to the University of St. Andrews in partial fulfillmentof the requirement of the degree of Doctor of Philosophy
School of Biology and School of Medicine
October 2007

CONTENTS
Declaration ii
Copyright declaration iii
Acknowledgements iv-v
Abbreviations vi-viii
Abstract ix
Table of contents x-xiv
Table of figures xv-xvix
List of tables xx

ii
Declaration
I, Lissa Rocha Herron, hereby certify that this thesis, which is approximately 35,000
words in length, has been written by me, that it is the record of work carried out by
me and that it has not been submitted in any previous application for a higher degree.
Date ______________ ___________________________
I was admitted as a research student in September, 2003 and as a candidate for the
degree of Ph.D. in September, 2004; the higher study for which this is a record was
carried out in the University of St Andrews between 2003 and 2007.
Date ______________ ___________________________
I hereby certify that the candidate has fulfilled the conditions of the Resolution and
Regulations appropriate for the degree of Ph.D. in the University of St Andrews and
that the candidate is qualified to submit this thesis in application for that degree.
Date ______________ ___________________________

iii
Copyright declaration
In submitting this thesis to the University of St Andrews I understand that I am giving
permission for it to be made available for use in accordance with the regulations of the
University Library for the time being in force, subject to any copyright vested in the
work not being affected thereby. I also understand that the title and abstract will be
published, and that a copy of the work may be made and supplied to any bona fide
library or research worker, that my thesis will be electronically accessible for personal
or research use, and that the library has the right to migrate my thesis into new
electronic forms as required to ensure continued access to the thesis. I have obtained
any third-party copyright permissions that may be required in order to allow such
access and migration.
Date ______________ ___________________________

iv
Acknowledgements
I would like to express my immense gratitude to Dr. Frank Gunn-Moore, who has
been a fantastic mentor and extremely supportive supervisor through what have been
some very difficult times in my life. I could not have completed this Ph.D. without
his help, kindness, generosity and understanding.
I would also like to thank:
My second supervisor, Prof. Simon Guild, especially for providing a friendly face at
my talk at Life Sciences.
Dr. Fleur Davey, the font of all lab knowledge, who taught me just about everything
I've learned in the last 4 years.
Dr. Maria Hill; without her thesis as a model, this one would have come on much
more slowly!
Dr. Colin Sinclair, who first got me started in the Gunn-Moore group and has been a
good friend and supporter ever since.
Yimin Ren, who could always be counted on for company in the lab on the weekends.
Dr. Dave Stevenson, for being a total dude.
The project students, Amy Cameron, Jessica Davis and Chris Cozens, for their help
and data.
All the office mates and E floor chums, especially Carol Jolly, for support, friendship
and long lunches.
My partner, Gary Stratton, for protecting me from the zombies.

v
Alex and Ian in stores for all their help with orders.
John Nicholson in the BMS for help with the Delta Vision and Brian Powell for
technical assistance in the lab.
My family, especially my mother Carmo Herron, who has been endlessly supportive
of all my educational endeavours throughout my life, even when they've taken me
halfway across the world.
For my daddy, Tom Herron, who would have been so very proud.

vi
Abbreviations used in this thesis
a adenine3AT 3-amino-1,2,4-triazoleA alanineBis-Tris Bis(2-hydroxyethyl)iminotris(hydroxymethyl)methanebp base pairBSA bovine serum albuminc cytosineC cysteineCaspr contactin-associated proteinCBB calmodulin binding bufferCD44 cluster of differentiation antigen 44cDNA complementary DNACEB calmodulin elution bufferCIAP calf intestinal alkaline phosphataseCNS central nervous systemCOS-7 african green monkey kidney cell lineC-terminus carboxy terminusD aspartic acid/aspartateDAPI 4',6-diamidino-2-phenylindoleDbl diffuse poorly differentiated B-cell lymphomaDMEM Dulbecco’s modified eagle’s mediumDMF N,N-dimethylformamideDNA deoxyribonucleic aciddNTP deoxynucleoside triphosphateDTT dithiothreitolE glutamic acid/glutamateE. coli Escherichia coliEDTA ethylenediaminetetraacetic acidEGF epidermal growth factorEGTA ethyleneglycol-bis-(-aminoethyl)-N,N’-tetraacetic acidERM ezrin radixin moesinERK2 Extracellular signal-regulated kinase 2EtBr ethidium bromideE3KARP Na(+)/H(+) exchanger type 3 kinase A regulatory proteinF phenylalanineFCS foetal calf serumFERM four-point-one ezrin radixin moesing guanineG glycineGDI Guanosine nucleotide dissociation inhibitorGFP green fluorescent proteinGlut/Q glutamineGSH reduced glutathioneGST glutathione S-transferaseH/His histidineHEI10 Human enhancer of invasion, clone 10HEK-293 human embryonic kidney cell lineHRP horseradish peroxidase

vii
I isoleucineICAM intracellular adhesion moleculeIPTG isopropyl--D-thiogalactopyranosideK lysinekb kilobase pairsL/Leu leucineLB Luria brothLiAc lithium acetateM methionineMEM minimum essential medium EagleMOPS 3-morpholinopropanesulfonic acidMQ milli-Q purified waterN asparagineNBF neutral buffered formalinNEAA non-essential amino acidsNGF nerve growth factorNP-40 nonidet P40NrCAM neuron-glia related cell adhesion moleculeN-terminus amino terminusOptiprep 60% (w/v) iodixanol in waterP prolinePBS phosphate buffered salinePCR polymerase chain reactionPDGF Platelet-derived growth factorPDZ Post Synaptic Density-95, discs-large, and zonula occludens-1PEG polyethylene glycol 3350pen penicillinPFA paraformaldehydePfuTURBO DNA polymerase derived from Pyrococcus furiosusPH pleckstrin homologyPI protease inhibitor cocktailPIPES piperazine-N,N’-bis(ethanesulfonic acid)PIPK phosphoinositol phosphate kinasePMSF phenylmethylsulfonyl fluoridePNS peripheral nervous systemPSB protein sample bufferPTPH1 Protein tyrosine phosphatase, non-receptor type 3PTPMEG Protein tyrosine phosphatase megakaryocytePak1 p21-activating kinase 1R argininerpm revolutions per minuteRIPA radio-immunoprecipitation assayS/Ser serineSAP102 synapse associated protein 102SDS sodium dodecyl sulfateSDS-PAGE sodium dodecyl sulfate polyacrylamide gel electrophoresisSK-UT-1 human uterine leiomyosarcoma cell lineSOB super optimal brothSOC super optimal catabolite repression brothT/Thr threonine
viii
TAP tandem affinity purificationTB transformation bufferTBE tris-borate-EDTA bufferTBS tris buffered salineTBS-T tris buffered saline with Tween 20TEV protease tobacco etch virus proteaseTris tris(hydroxymethyl) methylamineTris-HCl tris(hydroxymethyl) aminomethane hydrochlorideTriton X-100 t-OctylphenoxypolyethoxyethanolTween 20 polyoxyethylenesorbitan monolaurateUV ultravioletV valineVASP Vasodilator-stimulated PhosphoproteinW/Trp tryptophanX-gal 5-bromo-4-chloro-3-indolyl-D-galactopyranosideY/Tyr tyrosineYPAD Yeast Extract - Peptone - Dextrose plus Adenine medium
ix
Abstract
Willin is a novel member of the Four-point-one Ezrin Radixin Moesin
(FERM) protein superfamily, containing an N-terminal FERM domain most like the
Ezrin-Radixin-Moesin (ERM) family but also the closely related protein Merlin.
Willin was initially discovered as a yeast two-hybrid binding partner of
neurofascin155, and this interaction has now been confirmed by both co-localisation
studies and the use of two different biochemical methods. Like neurofascin155,
Willin also localises to detergent resistant membranes, and like the ERM family, it is
able to bind to phospholipids. The expression of Willin appears to be toxic as the
production of cell-lines stably expressing Willin proved to be not possible and this
appears to be because it induces apoptosis in cultured cells. This is a proliferation
control function consistent with the suggestion that Willin is the human homologue of
the Drosophila tumour suppressor ‘Expanded’. Three antibodies to Willin were also
characterised and a novel splice variant, Willin2, subcloned into a GFP-tagged
plasmid for comparison with the original form.
x
Table of Contents
Section Page
Chapter 1 Introduction 1-38
1.1 The Band 4.1 Superfamily 21.1.1 Band 4.1 21.1.2 The FERM domain 41.1.3 Ezrin, radixin and moesin 51.1.3.1 The ERM Association Domains regulate ERM protein activation 61.1.3.2 Expression of ERM proteins 71.1.3.3 ERM proteins and disease 81.1.3.4 ERM proteins are involved in cell signalling 91.1.4 Merlin 121.1.4.1 Neurofibromatosis type 2 and the NF2 tumour suppressor gene 121.1.4.2 Merlin expression 131.1.4.3 ERM Association Domains and activation of Merlin 151.1.5 FERM-containing proteins in Drosophila melanogaster 151.1.5.1 DMoesin 161.1.5.2 DMerlin and expanded 161.1.5.3 Coracle 181.1.6 FERM binding motifs 19
1.2 The L1 family of cell adhesion molecules 201.2.1 L1 211.2.2 CHL1 221.2.3 NrCAM 221.2.4 Neurofascin 231.2.4.1 Neurofascin and multiple sclerosis 251.2.4.2 Neurofascin localisation to lipid rafts is important in paranode
formation 261.2.5 Neuroglian 261.2.6 The interaction of L1 family members and FERM-containing
proteins 261.2.6.1 L1 interaction with Ezrin is important for normal
axonal morphogenesis 281.2.6.2 Neurofascin interacts with Ezrin in the microvilli of Schwann
cells 281.2.6.3 Drosophila septate junctions are analogous to vertebrate
paranode septate-like junctions 291.2.6.4 A novel protein discovered from a yeast two-hybrid screen
of neurofascin 32
1.3 Willin 32

xi
Section Page
Chapter 2 Materials and Methods 39-61
2.1 Molecular biology and cloning 402.1.1 Polymerase Chain Reaction 402.1.2 Restriction enzyme digest 402.1.3 Alkaline phosphatase treatment of digested plasmids 412.1.4 Klenow reaction 412.1.5 Ligation reaction 412.1.6 Agarose gel electrophoresis 412.1.7 Gel purification of digested DNA 422.1.8 Preparation of plasmid DNA 422.1.9 Preparation of CaCl2-competent E. coli 422.1.10 Preparation of 'super'-competent E. coli 432.1.11 Transformation of competent E. coli 43
2.2 Cell culture 442.2.1 Cell culture 442.2.2 Passage of cell lines 442.2.3 Cryogenic storage of mammalian cell lines 452.2.4 Rescue of frozen cell lines 452.2.5 Transfection of mammalian cells with Lipofectamine
Transfection Reagent 452.2.6 Transfection of mammalian cells with GeneJammer
Transfection Reagent 462.2.7 Making stable cell lines 472.2.8 Fixing cells and immunocytochemistry for fluorescence
microscopy 47
2.3 Protein assays and Western blot 482.3.1 Large scale GST fusion protein production 482.3.2 Preparation of glutathione sepharose 4B beads 492.3.3 GST protein purification 492.3.4 Bradford assay 502.3.5 Small-scale GST induction (for positive control samples) 502.3.6 Preparation of samples for SDS-PAGE 502.3.7 SDS-PAGE 512.3.8 Coomassie staining of SDS-PAGE gels 512.3.9 Transfer of proteins to nitrocellulose 522.3.10 Western blotting 522.3.11 Triton X-100 solubility assay 532.3.12 S100/P100 subcellular fractionation 532.3.13 Optiprep density gradient fractionation 542.3.14 Actin binding biochem kit protocol 542.3.15 Tandem affinity purification- Stratagene 552.3.16 Tandem affinity purification- pCMV5/TAP 56
xii
Section Page
2.3.17 GST Pulldown 572.3.18 Immunoprecipitation with monoclonal FLAG antibody
and protein A 58
2.4. Yeast two-hybrid 592.4.1 Media for yeast growth 592.4.2 LiAc transformation 592.4.3 Filter lift assay 60
Chapter 3 Characterisation of novel antibodies to Willin 62-87
3.1 Introduction 63
3.2 Characterisation of a custom-made polyclonalchicken antibody 64
3.3 Characterisation of the custom-made polyclonalrabbit antibody WR1 & 2 75
3.4 Characterisation of the commercial antibody FRMD6 79
3.5 Discussion 853.5.1 9143 and WR Antibodies and the 622 Amino Acid
Isoform of Willin 853.5.2 APHen2 853.5.3 WR 863.5.4 FRMD6 86
3.6 Conclusion 87
Chapter 4 Intracellular localisation and behaviour 88-115
4.1 Introduction 89
4.2 The distribution and effect of expressed Willin constructson mammalian cells 91
4.2.1 Construction of the pWillin-FLAG plasmid 914.2.2 Expression of Willin-FLAG 934.2.3 Construction of the pWillin-DsRed plasmid 95
4.3 Production of stable cell lines expressing Willin-GFP andWillin-FLAG 97

xiii
Section Page
4.4 Quantitation of cell death in cells expressing Willin-GFP 98
4.5 Investigation of solubility and lipid raft localisation of Willin 1004.5.1 Solubility of Willin in Schwann cells 1004.5.2 Detergent resistant membrane subfractionation 1014.5.2.1 COS-7 cells express Willin-GFP in DRM 1024.5.2.2 Willin-GFP DRM localisation in HEK-293 cells is not dependent
on actin 1034.5.2.3 Willin-GFP DRM localisation in PC12 cells does not require
stimulation by growth factors 1044.5.2.4 Willin-GFP floats to a lipid raft fraction of an Optiprep gradient 105
4.6 Characterisation of a novel splice variant of Willin 106
4.7 Discussion 1094.7.1 The effect of Willin on cultured cells 1094.7.2 Willin-DsRed2 1104.7.3 Willin interaction with lipid rafts 1114.7.4 Initial characterisation of Willin2 114
4.8 Conclusion 115
Chapter 5 Investigations into the binding partners of Willin 116-150
5.1 Introduction 117
5.2 Confirmation of L1 family binding using the yeasttwo-hybrid method 117
5.3 Confirmation of neurofascin 155 binding using theTAP method 123
5.3.1 Construction of the Willin-pIRESpuro2 CBP/TEV protein Aplasmid 123
5.3.2 Construction of the Willin Stratagene CTAP A plasmid 1275.3.3 Construction of the Willin239 Stratagene NTAP A plasmid 1315.3.4 Confirmation of binding by pCMV/NTAP neurofascinCT 133
5.4 Confirmation of neurofascin 155 binding by FLAGco-immunoprecipitation 135
5.5 Confirmation of neurofascin155 binding by GST pulldown 136
5.6 Investigation of Merlin binding by FLAGco-immunoprecipitation 136
xiv
Section Page
5.7 The interaction of Willin with Actin 137
5.8 Neurofascin155 co-localisation studies with Willin,Ezrin and Merlin 140
5.8.1 Willin co-localises with neurofascin 155 1405.8.2 Ezrin co-localises with neurofascin 155 1415.8.3 Merlin co-localises with neurofascin 155 143
5.9 Discussion 1465.9.1 Yeast two-hybrid studies 1465.9.2 Tandem affinity purification 1475.9.3 Co-immunoprecipitation assays 1475.9.4 The actin binding assay 1485.9.5 Co-localisation studies 149
Chapter 6 Discussion 151-159
6.1 Junctions, FERM proteins and the L1 family 152
6.2 Future work 157

xv
List of Figures
Figure Page
Chapter 1
1.1 Scanning electron micrographs of normal andprotein 4.1-mutant red blood cells 3
1.2 Diagrammatic structure of protein 4.1 3
1.3 Crystal structures of Ezrin, Radixin and Moesin FERM domains 5
1.4 Diagrammatic ERM protein structure 6
1.5 A model of ERM protein involvement in signalling pathways 11
1.6 A model of Merlin buoyancy within lipid rafts 14
1.7 The Hippo pathway 18
1.8 The L1 family of cell adhesion molecules 21
1.9 Electron micrographs of paranodes in wild type andneurofascin-null mice 24
1.10 Construction of the Node of Ranvier 25
1.11 A model of the changes that occur during MSdemyelination/remyelination 26
1.12 Immunofluorescence localization of neurofascin155 andEzrin to the microvilli of Schwann cells 29
1.13 Cell-cell junctions of the paranode 30
1.14 Comparison of the invertebrate septate junction and vertebrateparanodal septate-like junction 31
1.15 Sequence alignments of Willin, Ezrin Radixin and Moesin andpredicted crystal structure of Willin FERM domain compared tocrystal structures of Ezrin, Radixin and Moesin FERM domains 33-34
1.16 Structural domains present in the Band 4.1 superfamily 34
1.17 Phospholipid blot overlay experiment comparing GST-Willinand GST-Moesin phospholipid binding profiles and HEK-293cell expressing Willin-GFP 35
xvi
Figure Page
1.18 Translocation of Willin-GFP in a PC12 cell stimulated with EGF 36
1.19 PC12 cells co-expressing Willin-GFP and RFP-ARNO treatedwith wortmannin and EGF 37
Chapter 3
3.1 A Western blot of GST-Willin with Hen1 and APHen1 antibodiesand pAP9143 antibody control, gelatine block 65
3.2 A Western blot of GST-Willin with Hen2 and APHen2 antibodiesand pAP9143 antibody control, gelatine block 65
3.3 A Western blot of GST-Willin with Hen2 and APHen2 antibodiesand pAP9143 antibody control, BSA overnight block 66
3.4 A Western blot of GST-Willin with Hen1 and Hen2 antibodiesand pAP9143 antibody control, 0.2% FSG block 67
3.5 A Western blot of GST-Willin with Hen1 antibody, 1% and 2%FSG block 67
3.6 A Western blot of GST-Willin with Hen1 and Hen2 antibodiesand pAP9143 antibody control, milk overnight block 68
3.7 A Western blot of GST-Willin with APHen1 and APHen2antibodies and pAP9143 antibody control, milk overnight block 69
3.8 A Western blot of COS-7 whole cell extract and BSA withAPHen2 antibody 70
3.9 A Western blot of COS-7 whole cell extract and BSA withAPHen2 antibody and two different secondary antibodies 70
3.10 A Western blot of GST-Willin with APHen2 antibody andtwo different secondary antibodies 71
3.11 A Western blot of GST-Willin and rat sciatic nervewith APHen2 antibody 72
3.12 A Western blot of HEK-293 whole cell extract and GST-Willinwith APHen2 antibody 73

xvii
Figure Page
3.13 Peptide blocking experiment with APHen2 antibody 74
3.14 A Western blot of Willin2-GFP with APHen2 antibody 75
3.15 A Western blot of GST-Willin and BSA with WR1 and 2antibodies 76
3.16 A Western blot of RIPA-extracted untransfected and Willin-GFPtransfected COS-7 cells with WR1 and 2 and anti-GFP antibodies 77
3.17 A Western blot of RIPA-extracted untransfected and Willin-GFPtransfected HEK-293 cells with WR1 and anti-GFP antibodies 78
3.18 Peptide blocking experiment with GST-Willin and WR1 antibody 79
3.19 Peptide blocking experiment with Willin-GFP and WR1 antibody 79
3.20 A Western blot of FRMD6 by Atlas Antibodies 80
3.21 A Western blot of GST-Willin with FRMD6 and pAP9143
antibodies 81
3.22 A Western blot of HEK-293 cells either untransfected ortransfected with either Willin-GFP, M1GFP, GFP-Moesin orGFP-Ezrin, with FRMD6 antibody 82
3.23 A Western blot of untransfected and Willin-GFP transfectedCOS-7 cells with FRMD6 and anti-GFP antibodies 83
3.24 Immunocytochemistry of FRMD6 on cells expressingmito-ABAD-GFP 84
Chapter 4
4.1 Two-step cloning strategy for pWillin-FLAG 93
4.2 A Western blot of HEK-293 cell expression Willin-FLAG 94
4.3 Immunocytochemistry of a HEK-293 cell expressingWillin-FLAG 95
4.4 Cloning strategy for pWillin-DsRed2 96

xviii
Figure Page
4.5 A COS-7 cell expressing pWillin-DsRed2 97
4.6 Bar graph showing percentage of apoptotic cells at two timepoints post-transfection for Willin-GFP, Merlin1-GFP andGFP-Moesin expressing cells 100
4.7 A Western blot of RIPA-extracted Schwann cells 101
4.8 A Western blot of a DRM subfractionation of COS-7 cellsexpressing Willin-GFP 103
4.9 Western blots of DRM subfractionations of HEK-293 cellsexpressing Willin-GFP or GFP and treated with cytochalasin D 104
4.10 A Western blot of a DRM subfractionation of PC12 cellsexpressing Willin-GFP and treated with EGF 105
4.11 Western blots of Optiprep gradient subfractionations of HEK-293cells expressing Willin-GFP or Merlin1-GFP 106
4.12 Cloning strategy for pMouse Willin2-GFP 107
4.13 A Western blot of COS-7 cells expressing Mouse Willin2-GFP 107
4.14 COS-7 cells expressing Mouse Willin2-GFP and Willin-GFP 108
4.15 Cloning strategy for truncated pGST-Willin constructs 112
4.16 A Western blot of BL21/DE3 E. coli expressing truncatedGST-Willin proteins 113
Chapter 5
5.1 The yeast two-hybrid system 118
5.2 Summary of yeast two-hybrid constructs used 121
5.3 The tandem affinity purification method 124
5.4 The initial cloning strategy for Willin-pIRESpuro2CBP/TEV protein A 125-126
5.5 The second cloning strategy for Willin-pIRESpuro2CBP/TEV protein A 127
xix
Figure Page
5.6 The Stratagene tandem affinity purification method 128
5.7 The cloning strategy for pWillin-CTAP A 129-130
5.8 A Western blot of a COS-7 cell expressing Willin-CTAP A 130
5.9 A Western blot of the fractions of a Stratagene TAP experimentwith Willin-CTAP A 131
5.10 The cloning strategy for pWillin239-NTAP A 132
5.11 A Western blot of the fractions of a Stratagene TAP experimentwith Willin239-NTAP A 133
5.12 Western blots of the fractions of a pCMV/NTAP experiment withCMV/NTAP neurofascinCT 134
5.13 Western blots of Willin-FLAG immunoprecipitation experimentswith neurofascin155 135
5.14 A Western blot of GST-Willin pulldown experiment withneurofascin155 136
5.15 Western blots of Willin-FLAG immunoprecipitation experimentswith Merlin1 137
5.16 A Coomassie-stained gel and Western blot of the actin bindingbiochem kit experiment 139
5.17 HEK-293 cells co-expressing Willin-GFP and neurofascin155 141
5.18 HEK-293 cells expressing GFP-Ezrin, neurofascin155 or both 142
5.19 HEK-293 cells expressing Merlin1-GFP and neurofascin155 144
5.20 A summary of results for putative Willin binding partners 150
Chapter 6
6.1 A proposed mechanism for FERM protein action in paranodedevelopment 156

xx
List of Tables
Table Page
2.1 Reagent volumes for Lipofectamine transfection ofdifferent sized dishes 46
2.2 Reagent volumes for GeneJammer transfection ofdifferent sized dishes 47
2.3 Updated reagent volumes for GeneJammer transfectionof different sized dishes 47
2.4 Experimental setup for actin binding kit protocol 55
5.1 A summary of yeast two-hybrid results for rat N-terminalWillin with L1 family members 122

CHAPTER 1: INTRODUCTION
2
Chapter 1: Introduction
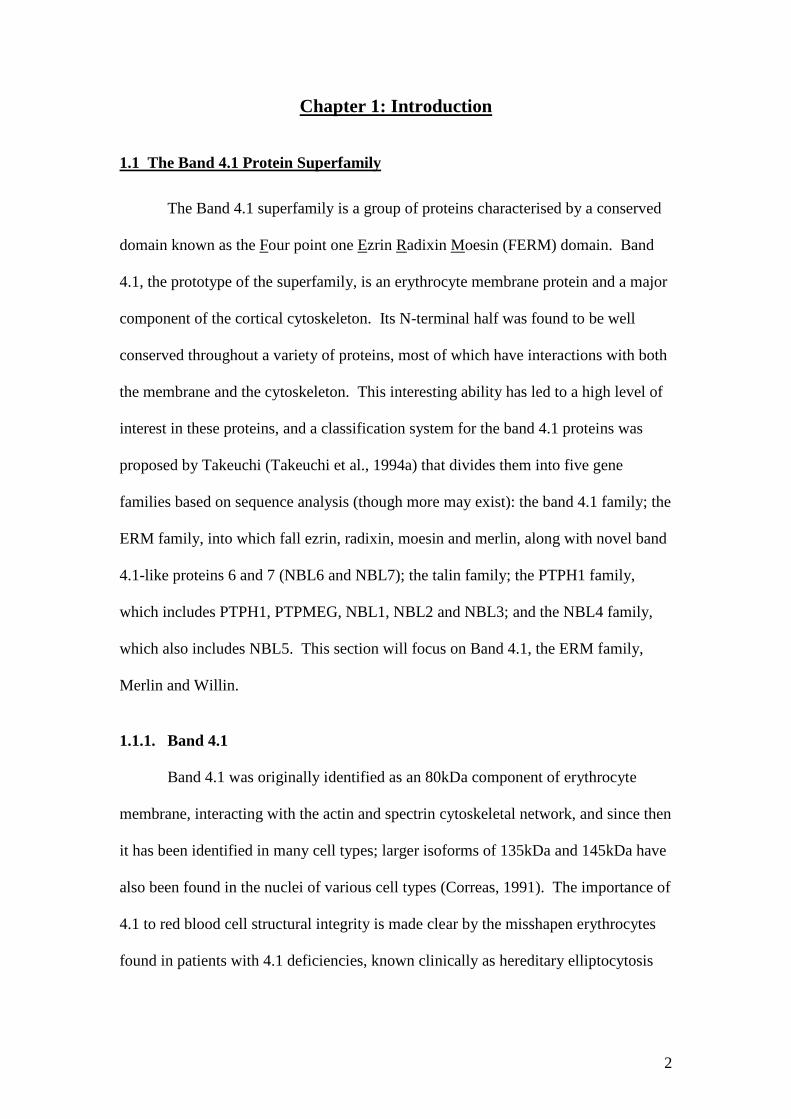
1.1 The Band 4.1 Protein Superfamily
The Band 4.1 superfamily is a group of proteins characterised by a conserved
domain known as the Four point one Ezrin Radixin Moesin (FERM) domain. Band
4.1, the prototype of the superfamily, is an erythrocyte membrane protein and a major
component of the cortical cytoskeleton. Its N-terminal half was found to be well
conserved throughout a variety of proteins, most of which have interactions with both
the membrane and the cytoskeleton. This interesting ability has led to a high level of
interest in these proteins, and a classification system for the band 4.1 proteins was
proposed by Takeuchi (Takeuchi et al., 1994a) that divides them into five gene
families based on sequence analysis (though more may exist): the band 4.1 family; the
ERM family, into which fall ezrin, radixin, moesin and merlin, along with novel band
4.1-like proteins 6 and 7 (NBL6 and NBL7); the talin family; the PTPH1 family,
which includes PTPH1, PTPMEG, NBL1, NBL2 and NBL3; and the NBL4 family,
which also includes NBL5. This section will focus on Band 4.1, the ERM family,
Merlin and Willin.
1.1.1. Band 4.1
Band 4.1 was originally identified as an 80kDa component of erythrocyte
membrane, interacting with the actin and spectrin cytoskeletal network, and since then
it has been identified in many cell types; larger isoforms of 135kDa and 145kDa have
also been found in the nuclei of various cell types (Correas, 1991). The importance of
4.1 to red blood cell structural integrity is made clear by the misshapen erythrocytes
found in patients with 4.1 deficiencies, known clinically as hereditary elliptocytosis

3
(Figure 1.1). Molecularly, the skeletal network and membrane structures become
abnormally distributed (Yawata et al., 1997).
Figure 1.1. A) Scanning electron microscopy (EM) of normal red blood cells, withcharacteristic disc shape. B) Scanning EM of red blood cells from patient withhomozygous hereditary elliptocytosis. The cytoskeleton is improperly formed. Takenfrom Yawata et al., 1997.
Interest in 4.1 increased when it was discovered that it was able to bind
membrane, cytoskeletal and membrane proteins, which, combined with the clincial
evidence, suggested an important linking function (Hemming et al., 1994; Pasternack
et al., 1985; Walensky et al., 1998). Three distinct binding domains have been
observed in protein 4.1: a C-terminal domain, a spectrin-actin binding domain, and a
~30kDa N-terminal domain that mediates binding with the membrane and membrane
proteins (Sun et al., 2002; see Figure 1.2.)
Figure 1.2. Overall structure of protein 4.1. The FERM domain is in the N-terminus,flanked by two regions of unique sequence, with a spectrin-actin binding domainlocated centrally and a C-terminal domain capable of binding further cytoplasmic andcytoskeletal proteins. Image taken from Sun et al., 2002.
4
It was recognised that the N-terminal domain of 4.1 was conserved in a rapidly
growing list of other proteins, and was termed the Four point one Ezrin Radixin
Moesin (FERM) domain after the proteins initially discovered to have this domain
(Chishti et al., 1998).
1.1.2. The FERM domain
The FERM domain is usually found in the N-terminus of proteins, though in
myosinVIIA it is in the C-terminus (Chishti et al., 1998), and in at least one novel
FERM-containing family it is centrally located (Ussar et al., 2006). Around 300
amino acids in length, it is hydrophobic, cysteine-rich (Conboy, 1986) and globular
(Chishti et al., 1998). Studies of crystal structures have shown that there are three
subdomains, F1/A, F2/B and F3/C, forming a ‘cloverleaf’ structure (Hamada et al.,
2000; Pearson et al., 2000). F1/A has a ubiquitin-like structure, F2/B an acyl-CoA
binding protein-like structure, and F3/C resembles a fold found in phosphotyrosine
binding (PTB), pleckstrin homology (PH), and Enabled/VASP Homology 1 (EVH1)
domains (Hamada et al., 2000; Pearson et al., 2000). The FERM domain of various
proteins has been shown to bind such a diverse range of molecules as
phosphoinositols, glycophorins, CD44, ICAM-2 and the C-terminal domain of
FERM-containing proteins (Chishti et al., 1998); there is also some evidence that it
can bind actin (Martin et al., 1997; Roy et al., 1997). The crystal structures of Ezrin,
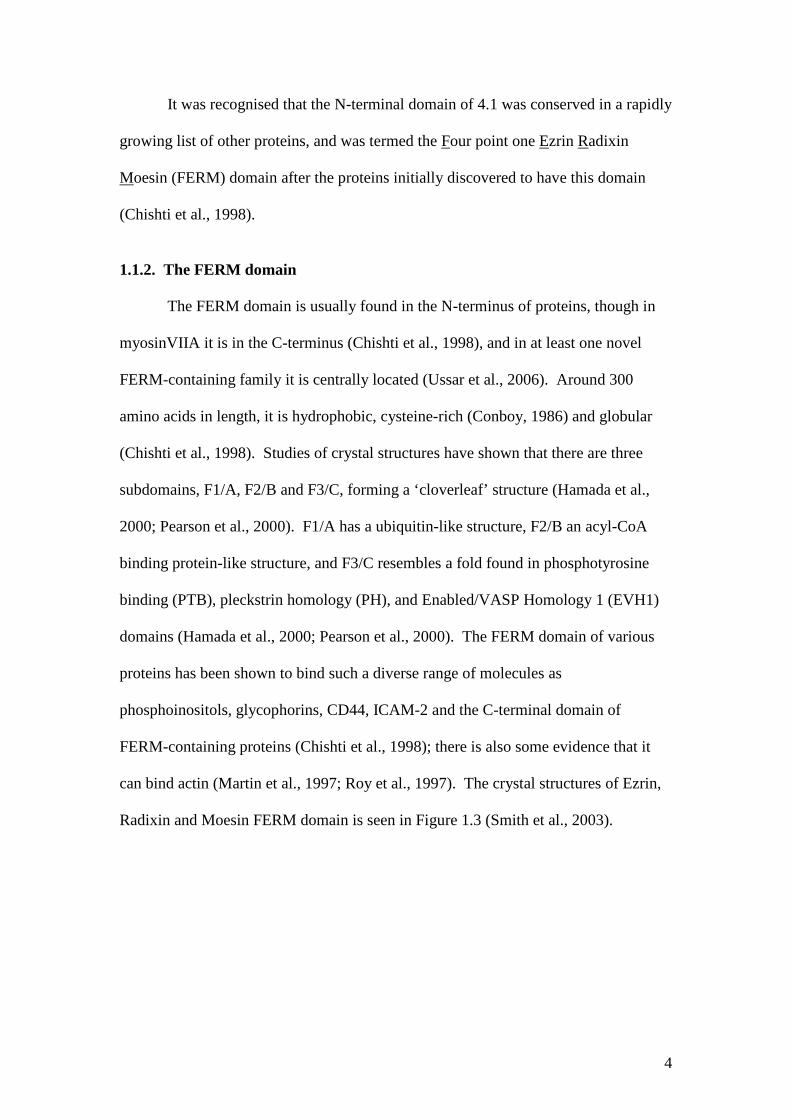
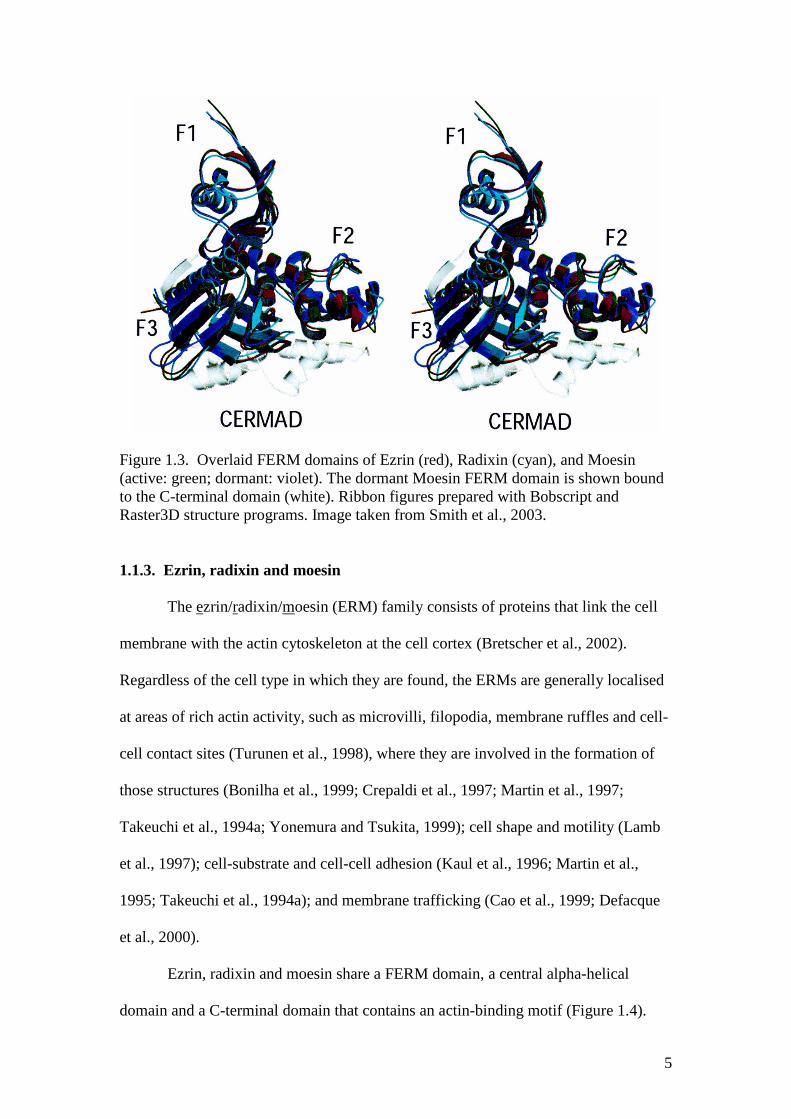
Radixin and Moesin FERM domain is seen in Figure 1.3 (Smith et al., 2003).
5
Figure 1.3. Overlaid FERM domains of Ezrin (red), Radixin (cyan), and Moesin(active: green; dormant: violet). The dormant Moesin FERM domain is shown boundto the C-terminal domain (white). Ribbon figures prepared with Bobscript andRaster3D structure programs. Image taken from Smith et al., 2003.
1.1.3. Ezrin, radixin and moesin
The ezrin/radixin/moesin (ERM) family consists of proteins that link the cell
membrane with the actin cytoskeleton at the cell cortex (Bretscher et al., 2002).
Regardless of the cell type in which they are found, the ERMs are generally localised
at areas of rich actin activity, such as microvilli, filopodia, membrane ruffles and cell-
cell contact sites (Turunen et al., 1998), where they are involved in the formation of
those structures (Bonilha et al., 1999; Crepaldi et al., 1997; Martin et al., 1997;
Takeuchi et al., 1994a; Yonemura and Tsukita, 1999); cell shape and motility (Lamb
et al., 1997); cell-substrate and cell-cell adhesion (Kaul et al., 1996; Martin et al.,
1995; Takeuchi et al., 1994a); and membrane trafficking (Cao et al., 1999; Defacque
et al., 2000).
Ezrin, radixin and moesin share a FERM domain, a central alpha-helical
domain and a C-terminal domain that contains an actin-binding motif (Figure 1.4).

6
This structure is highly conserved: ezrin shows about 97% identity amongst the
mammalian forms, and 99% identity in the FERM domain between mouse and human
forms; ezrin, radixin and moesin have 73-81% sequence identity (Turunen et al.,
1998). The FERM domain connects to the cell membrane either directly through
phosphoinositols, especially phosphatidylinositol-4,5-bisphosphate (Niggli et al.,
1995), or by binding to membrane proteins such as CD44 (Tsukita et al., 1994) CD43
and ICAM-2 (Yonemura et al., 1998). The C-terminal domain has a highly-conserved
actin binding site in the last 34 amino-acids (Turunen et al., 1994). Recently, the
central coiled-coil domain has been shown to participate in masking of the FERM
domain region and regulation of FERM binding (Li et al., 2007).
Figure 1.4. The ERM proteins share an overall structure consisting of an N-terminalFERM domain, a central coiled-coil domain and a C-terminal domain that includes ahighly-conserved actin-binding motif in the final 34 amino acids. Image taken fromSun et al., 2002.
1.1.3.1. The ERM Association Domains regulate ERM protein activation
The ERM family members form intra- and intermolecular associations via N
and C-terminal areas known as ERM Association Domains (ERMAD). The
intramolecular association masks the membrane and actin binding sites, rendering the
molecule inactive (Bretscher et al., 2000). Phosphorylation of a conserved threonine
residue (Thr558 in Moesin, Thr567 in ezrin, and Thr564 in radixin) in the C-ERMAD
seems to be responsible for the conversion to the active form (Pearson et al., 2000;
Zhou et al., 2005), although two tyrosine residues (Tyr145 and Tyr353) in ezrin can
be phosphorylated by the epidermal growth factor (EGF) receptor to produce an
7
active form (Krieg and Hunter, 1992). It has also been observed that EGF stimulation
of A431 cells not only activates ERMs to break the intramolecular association, but
also stimulates ERM oligomer formation, suggesting the oligomeric form could be a
transition form in the activation pathway (Bretscher et al., 2000; Gautreau et al.,
2002). Deactivation of the ERMs by dephosphorylation is also important for cell
dynamics, and has been observed in vivo to correlate with breakdown of microvilli in
such situations as anoxia and apoptosis (Chen and Mandel, 1997).
1.1.3.2. Expression of ERM proteins
In vivo, ERM proteins are found in most tissues, with each family member
showing unique expression in different tissues. Ezrin was initially purified from
intestinal microvilli, but is also present in the placenta, stomach, lung and kidney at
high levels, and in lower levels in the spleen. Subcellularly, its distribution is largely
in actin-rich surface projections, and in the tissues in which it can be found, ezrin is
mainly associated with the apical surface of epithelial cells (Berryman et al., 1993).
In Schwann cells, Ezrin has been found to localise at the paranodal microvilli that
project into the Node of Ranvier (Gatto et al., 2003).
Moesin was first isolated from bovine uterine cells and originally thought to
be an extracellular heparin-binding protein (Lankes et al., 1988), but was soon shown
to be intracellular and very similar to ezrin (Lankes and Furthmayr, 1991; Sato et al.,
1992). Berryman et al. (1993) found it to be most abundant in lung and spleen, and to
a lesser extent in kidney, while others have observed it in macrophages, lymphocytes,
fibroblastic, endothelial, epithelial and neuronal cell lines as well (Amieva and
Furthmayr, 1995). Like ezrin, its subcellular localisation is specific to certain areas,
chiefly filopodia, microvilli, microspikes and retraction fibres (Amieva and
Furthmayr, 1995).

8
Radixin was initially purified from hepatic adherens junctions (Tsukita et al.,
1989), but its subcellular localisation has been somewhat uncertain due to conflicting
results with radixin antibody studies (Bretscher et al., 1997); different groups have
shown it to localise to adherens junctions (Tsukita et al., 1989), microvilli (Amieva et
al., 1994) contractile rings (Henry et al., 1995), focal contacts and cleavage furrows
(Sato et al., 1991). Li and Crouch (2000) carried out experiments in chicken tissue
and found high levels of radixin in kidney, liver, ovary and bone marrow; lower levels
were detected in lung, thymus, colon and skin.
In contrast to the tissue-specific distribution in vivo, all three ERMs are
usually co-expressed in cultured cells, perhaps due to the unique conditions of the in
vitro environment (Franck et al., 1993; Sato et al., 1992). The tissue-specific
distribution pattern of the ERMs implies functional differences amongst the family
members, but there is redundancy to the extent that deleting one or even two of the
proteins via antisense oligonucleotide inhibition (Takeuchi et al., 1994b) or in
transgenic knockout mice (Doi et al., 1999) produces no observable changes in
phenotype.
1.1.3.3. ERM proteins and disease
All members of the ERM family have been implicated in disease, particularly
tumours. In Drosophila, which contains only Moesin and is thus an easier system in
which to create complete knockout phenotypes, epithelial cells that lack Moesin lose
epithelial morphological characteristics, such as apical-basal polarity, and adopt
invasive migratory behaviour (Speck et al., 2003). Similar effects have been seen in
prostate cancer cell lines interacting with endothelial cells; Harrison et al. (2002)
found that ezrin co-localised and co-translocated with CD44, variants of which have
been linked to metastasis and tumour progression, during tumour-endothelial cell
9
interactions in which healthy cells were captured by the tumour. This seems to imply
that ezrin plays a key role in the cell motility and adhesion involved in metastasis.
Further evidence of this is seen in glial cell tumours, known as gliomas, in the brain,
where ezrin appears to be involved in a hepatocyte growth factor signalling cascade
that promotes tumour migration (Wick et al., 2001). It is also likely that Ezrin is able
to activate signalling pathways for cell survival, such as MAPK and Akt (see section
1.1.3.4), allowing metastatic cells to survive in what might have otherwise been a
hostile environment (Curto and McClatchey, 2004). In addition, increased expression
of Ezrin in some cancer types correlated with both metastatic potential and poor
prognosis (Curto and McClatchey, 2004), while cytoplasmic ezrin in head and neck
cancers correlates with poor outcome (Madan et al., 2006).
1.1.3.4. ERM proteins are involved in cell signalling
The ERMs appear to be involved in several signalling pathways- not a
surprising observation given their essential linking position in the cell. Best studied
have been their roles in Rho GTPase signalling pathways, implicated in cell survival
and motility, again suggesting an important role for the ERM proteins in these cellular
functions. RhoA has been shown to cause Rho kinase to phosphorylate ERM proteins
and drive their localisation into apical membrane and actin rich structures (Shaw et
al., 1998a), while in cortical neurons, Rho kinase is involved in ERM activation that
leads to the formation of filopodia associated with neurite outgrowth (Haas et al.,
2007). Another Rho GTPase, Rac1, can be activated by a constitutively active Ezrin,
leading to E-cadherin dependent adherens junction assembly (Pujuguet et al., 2003);
conversely, Auvinen et al. (2007) found that Ezrin localisation to N-cadherin-
containing adherens junctions was regulated by Rac1 through PIPK activity. Recent
studies suggest that Ras signalling can also be activated by the ERM proteins

10
(Morrison et al., 2007). Further regulation and activation of the Rho family by ERMs
can also be accomplished through ERM binding of RhoGDI (Takahashi et al., 1997),
which inhibits all Rho members, or Dbl, which stimulates all Rho members, and it
appears that the interaction with these two regulators is mutually exclusive (Takahashi
et al., 1998).
However, Rho-independent activation mechanisms also exist; it was observed
that in the kidney-derived cell line MDCK ERM proteins appeared to be active in the
absence of Rho, and that phosphatidylinositol-4,5-bisphosphate (PI(4,5)P2), a
membrane lipid, could regulate activation (Yonemura et al., 2002). The FERM
domain of Ezrin is able to bind PI(4,5)P2 (Niggli et al., 1995), which in turn has a
great deal of influence on the intracellular localisation of Ezrin (Barret et al., 2000).
PI(4,5)P2 may in fact mediate the interaction of ERMs with adhesion molecules such
as CD44 (Niggli et al., 1995).
ERM proteins have been implicated in additional pathways that may explain
their potential role in cancer and tumour metastasis. They can activate cell survival
signalling pathways through phosphatidylinositol 3-kinase (PI3K)/Akt signalling
(Gautreau et al., 1999), such as in cases of apoptotic stress, where ERMs interact with
NHE1 to mediate PI3K and Akt cell survival messages (Wu et al., 2004). Protein
kinase C theta (PKC) and alpha (PCK) forms are able to phosphorylate moesin
(Pietromonaco et al., 1998) and ezrin (Ng et al., 2001) respectively, leading to
formation of membrane protrusions and migratory cell behaviour.
Figure 1.5 shows a model for ERM activation in the context of the above
signalling pathways (Mangeat et al., 1999). Active, phosphorylated ERM proteins are
shown to interact with the membrane either through PI(4,5)P2-mediated interaction
with cell adhesion molecules such as CD44, or through multispanning transmembrane

11
proteins indirectly via PDZ domain-containing binding partners such as Ezrin binding
protein 50 (EBP50) and E3KARP. ERMs can be phosphorylated by Rho, and when
active ERMs are then able to recruit positive and negative regulators of Rho, Dbl and
RhoGDI respectively, to maintain activation of the pathway. Also, PKC is another
potential activator of the ERM proteins through ERMAD phosphorylation, perhaps
under the influence of different extracellular signals than those that affect Rho.
Figure 1.5. A model of ERM involvement in various signalling pathways.Extracellular signals lead to activation of ERM proteins through phosphorylatingbinding partners such as Rho kinase, PKC and PI(4,5)P2. This allows the ERMs tobind to actin, membrane and cytoplasmic binding partners, and regulators of Rho tokeep the pathway active. Figure taken from Mangeat et al., 1998.
12
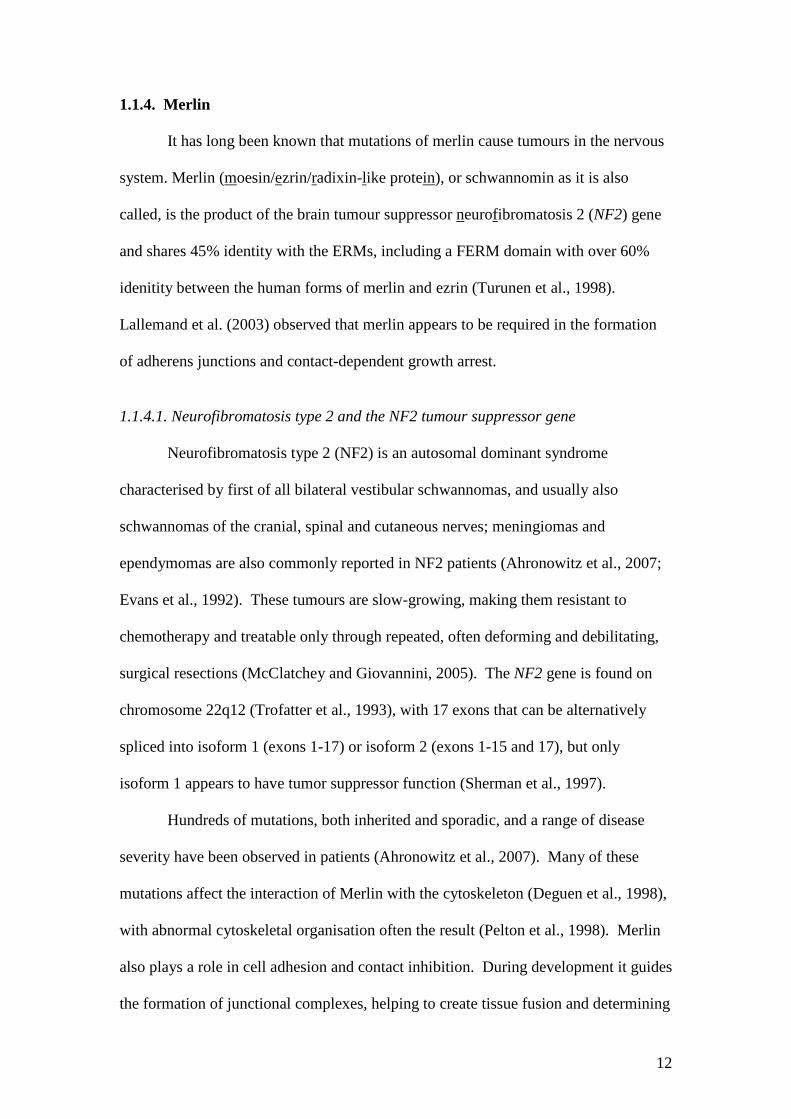
1.1.4. Merlin
It has long been known that mutations of merlin cause tumours in the nervous
system. Merlin (moesin/ezrin/radixin-like protein), or schwannomin as it is also
called, is the product of the brain tumour suppressor neurofibromatosis 2 (NF2) gene
and shares 45% identity with the ERMs, including a FERM domain with over 60%
idenitity between the human forms of merlin and ezrin (Turunen et al., 1998).
Lallemand et al. (2003) observed that merlin appears to be required in the formation
of adherens junctions and contact-dependent growth arrest.
1.1.4.1. Neurofibromatosis type 2 and the NF2 tumour suppressor gene
Neurofibromatosis type 2 (NF2) is an autosomal dominant syndrome
characterised by first of all bilateral vestibular schwannomas, and usually also
schwannomas of the cranial, spinal and cutaneous nerves; meningiomas and
ependymomas are also commonly reported in NF2 patients (Ahronowitz et al., 2007;
Evans et al., 1992). These tumours are slow-growing, making them resistant to
chemotherapy and treatable only through repeated, often deforming and debilitating,
surgical resections (McClatchey and Giovannini, 2005). The NF2 gene is found on
chromosome 22q12 (Trofatter et al., 1993), with 17 exons that can be alternatively
spliced into isoform 1 (exons 1-17) or isoform 2 (exons 1-15 and 17), but only
isoform 1 appears to have tumor suppressor function (Sherman et al., 1997).
Hundreds of mutations, both inherited and sporadic, and a range of disease
severity have been observed in patients (Ahronowitz et al., 2007). Many of these
mutations affect the interaction of Merlin with the cytoskeleton (Deguen et al., 1998),
with abnormal cytoskeletal organisation often the result (Pelton et al., 1998). Merlin
also plays a role in cell adhesion and contact inhibition. During development it guides
the formation of junctional complexes, helping to create tissue fusion and determining

13
which cells will survive (McLaughlin et al., 2007). It also inhibits Rac (Okada et al.,
2005) and Pak1 (Kissil et al., 2003), which allows for contact inhibition to occur.
Lallemand et al. (2003) found that loss of NF2 destabilised adherens junctions, thus
allowing tumourigenesis. Cell cycle control is also a potential function for Merlin, as
it has been found to interact with the cell cycle regulator HEI10 and affect its
targeting (Gronholm et al., 2006). Additionally, Merlin is shuttled to the nucleus in a
cell cycle and density-dependent manner; once there it can inhibit activation of cell
cycle promoter ERK2 (Muranen et al., 2005).
1.1.4.2. Merlin expression
Understandably, Merlin has mostly been studied within the context of its
expression in Schwann cells of the peripheral nervous system, where it is
developmentally regulated and a component of the paranode and Schmidt-Lanterman
incisures (Scherer and Gutmann, 1996). It may play a role in Schwann cell
differentiation from the pro-myelinating to the myelinating stage (Hung et al., 2002),
and NF2 null mutants show abnormal myelination (Giovannini et al., 2000).
However, Merlin has been found in other cell types, such as fibroblasts (Shaw et al.,
2001); and in neurons of the central nervous system it is also a component of
paranodes, though this time interacting with membrane glycoprotein Caspr on the
axonal side (Denisenko-Nehrbass et al., 2003).
Subcellularly, Merlin shows strong cortical membrane localisation,
particularly in actin-rich areas such as filopodia and membrane ruffles (Shaw et al.,
1998b), and Stickney et al. (2004) showed that Merlin is constitutively localised to
detergent-resistant membrane fractions known as lipid rafts. Raft localisation was not
dependent on actin cytoskeleton or activation state, but activation did allow merlin to
move from a less buoyant raft fraction with greater actin enrichment to a more
14
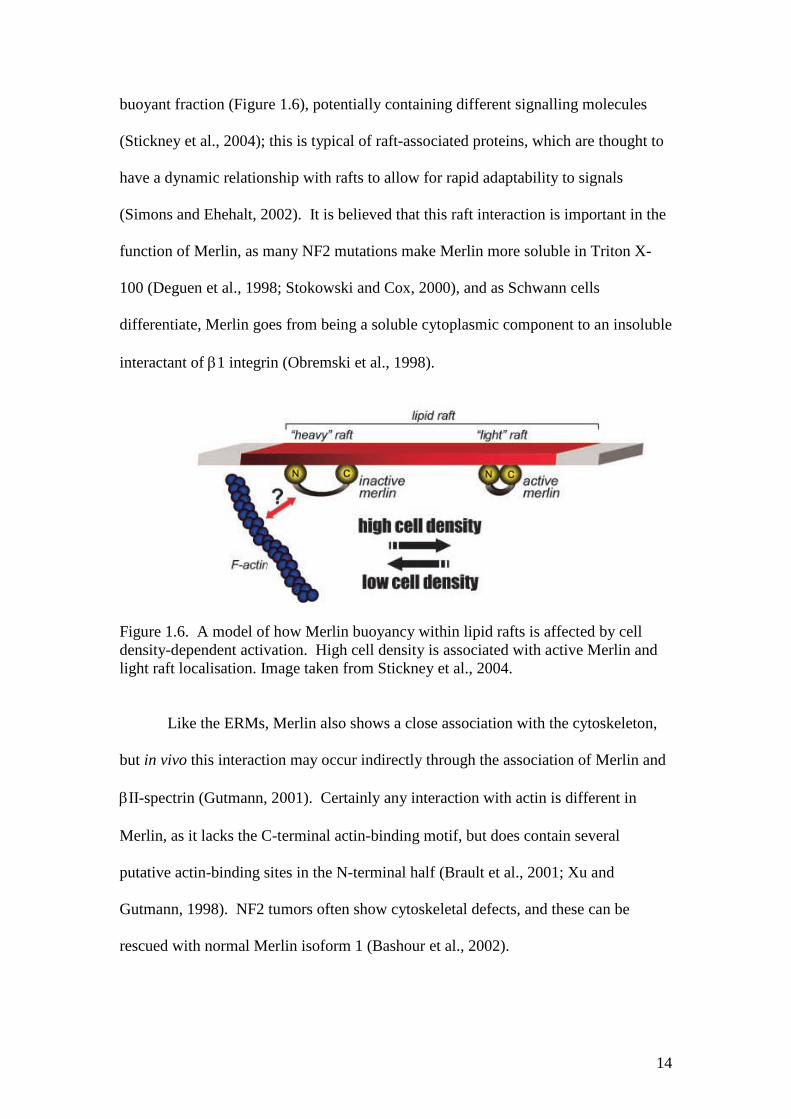
buoyant fraction (Figure 1.6), potentially containing different signalling molecules
(Stickney et al., 2004); this is typical of raft-associated proteins, which are thought to
have a dynamic relationship with rafts to allow for rapid adaptability to signals
(Simons and Ehehalt, 2002). It is believed that this raft interaction is important in the
function of Merlin, as many NF2 mutations make Merlin more soluble in Triton X-
100 (Deguen et al., 1998; Stokowski and Cox, 2000), and as Schwann cells
differentiate, Merlin goes from being a soluble cytoplasmic component to an insoluble
interactant of 1 integrin (Obremski et al., 1998).
Figure 1.6. A model of how Merlin buoyancy within lipid rafts is affected by celldensity-dependent activation. High cell density is associated with active Merlin andlight raft localisation. Image taken from Stickney et al., 2004.
Like the ERMs, Merlin also shows a close association with the cytoskeleton,
but in vivo this interaction may occur indirectly through the association of Merlin and
II-spectrin (Gutmann, 2001). Certainly any interaction with actin is different in
Merlin, as it lacks the C-terminal actin-binding motif, but does contain several
putative actin-binding sites in the N-terminal half (Brault et al., 2001; Xu and
Gutmann, 1998). NF2 tumors often show cytoskeletal defects, and these can be
rescued with normal Merlin isoform 1 (Bashour et al., 2002).

15
1.1.4.3. ERM Association Domains and activation of Merlin
Merlin has ERMADs as well, but their interactions are weaker and more
dynamic than those in ezrin, radixin and moesin (Nguyen et al., 2001).
Phosphorylation of a serine residue is required to break the association rather than the
conserved threonine, but it has not yet been determined which form of merlin is
active. It has been proposed that in fact the merlin oligomeric or ‘closed’
conformation is active, based on evidence that the ERMAD interaction and
dephosphorylation is a requisite step in merlin function (Shaw et al., 2001). Hetero-
oligomers of ezrin and merlin have been detected using affinity binding assays of their
domains (Nguyen et al., 2001), coimmunoprecipitation, yeast two-hybrid, blot overlay
and affinity precipitation (Gronholm et al., 1999; Meng et al., 2000), and it has been
observed that the merlin C-ERMAD has a much stronger affinity for the ezrin N-
ERMAD than its own (Meng et al., 2000; Nguyen et al., 2001). It is possible that this
interaction exists in a regulatory capacity to control the activity of ezrin and/or merlin
(Gautreau et al., 2002). This seems to coincide with their opposing functions in
growth regulation.
1.1.5. FERM-containing proteins in Drosophila melanogaster
Because of its short reproductive cycle and simpler genetics compared to
vertebrates, the fruit fly Drosophila melanogaster has been used as a model organism
for research since the early 20th century; its complete genome was sequenced in 2000
(Ashburner and Bergman, 2005). It contains several FERM-domain containing
proteins, apparently fulfilling many of the functions of their vertebrate homologues.
Loss of function studies for these genes have provided valuable insight into the
function of their protein products.
16
1.1.5.1 DMoesin
Drosophila have only one ERM protein homologue, DMoesin, which has 58%
sequence homology with human moesin, including 26% identity in the C-terminal
divergent region (McCartney and Fehon, 1996). This unique expression makes it
possible to side-step the problem of redundant function found in vertebrate mutants
(see section 1.1.3.2). In a molecular context, loss of DMoesin show that this protein
is essential for cytoskeletal distribution, maintenance of apical-basal polarity, and
epithelial integrity; this study also suggests that DMoesin acts antagonistically to the
Rho pathway, contradicting the results discussed in section 1.1.3.4 (Speck et al.,
2003), but further in vivo studies are required in vertebrates. Its subcellular
localisation was found to be primarily in apical membrane regions (McCartney and
Fehon, 1996).
Physiologically, loss of DMoesin causes severe developmental problems, with
the posterior structures missing completely from the fly embryos; in addition,
imaginal discs, adherens junctions and photoreceptors are all dependent on DMoesin
for correct organisation and assembly (Polesello and Payre, 2004).
1.1.5.2. DMerlin and expanded
DMerlin shows a 55% identity with human Merlin, with particular similarity
at the C-terminus (McCartney and Fehon, 1996). It shows a subcellular expression at
the membrane and cytoplasmic puncta, indicating that it may have an endocytic
function (LaJeunesse et al., 1998). Maitra et al. (2006) found that DMerlin mutants
showed defects in endocytic trafficking of signalling receptors from the membrane,
and suggested that DMerlin’s growth-suppressive function was at least in part due to
the regulation it thus exerts on expression of positive growth signals at the membrane.
17
As with the human protein, DMerlin exerts a growth-suppressive function at
the plasma membrane (LaJeunesse et al., 1998). In the developing eye, DMerlin
appears to regulate normal apoptosis, with mutants exhibiting overgrowth due to a
higher number of cells than the normal fly (Pellock et al., 2007), and wings show
broadening and cross-vein disruption (McCartney et al., 2000).
Recent work has shown that DMerlin acts closely with another FERM-
containing protein, expanded, to regulate growth, proliferation and differentiation in
Drosophila tissues (McCartney et al., 2000). Like DMerlin mutants, expanded
mutants show overgrowth phenotypes in various tissues (Boedigheimer and Laughon,
1993); (Blaumueller, and Mlodzik 2000) due to overproliferation (Boedigheimer et
al., 1997).
DMerlin and expanded co-localise in Drosophila cells, both in tissues and in
culture (McCartney et al., 2000). The two act through the Hippo tumour suppressor
signalling pathway, causing downstream activation of the Hippo/Salvador complex
and Warts/Mats complex (Hamaratoglu et al., 2006), inhibiting the transcriptional
coactivator Yorkie, which induces growth (Huang et al., 2005); this leads to further
activation of the DMerlin and expanded genes, as well as repression of cyclin E and
Drosophila inhibitor of apoptosis protein 1 (diap1) genes (Hamaratoglu et al., 2006).
Cyclin E induces entry into S-phase from G1 (Richardson et al., 1995), so DMerlin
and expanded are in this case preventing re-entry into the cell cycle; DIAP1,
meanwhile, plays an essential role in cell survival through its inhibition of caspase-
induced apoptosis (Wang et al., 1999), so the role of DMerlin and expanded here is to
allow this apoptotic pathway to operate during differentiation.
The Hippo pathway is conserved in vertebrates: Mst2 (Hippo) activates the
NDR type kinases Lats1 and Lats 2 (Warts) in a growth-suppressive pathway (Chan et
18
al., 2005), and the Mats homologues (MOB proteins) also associate with NDR type
kinases (Tamaskovic et al., 2003).
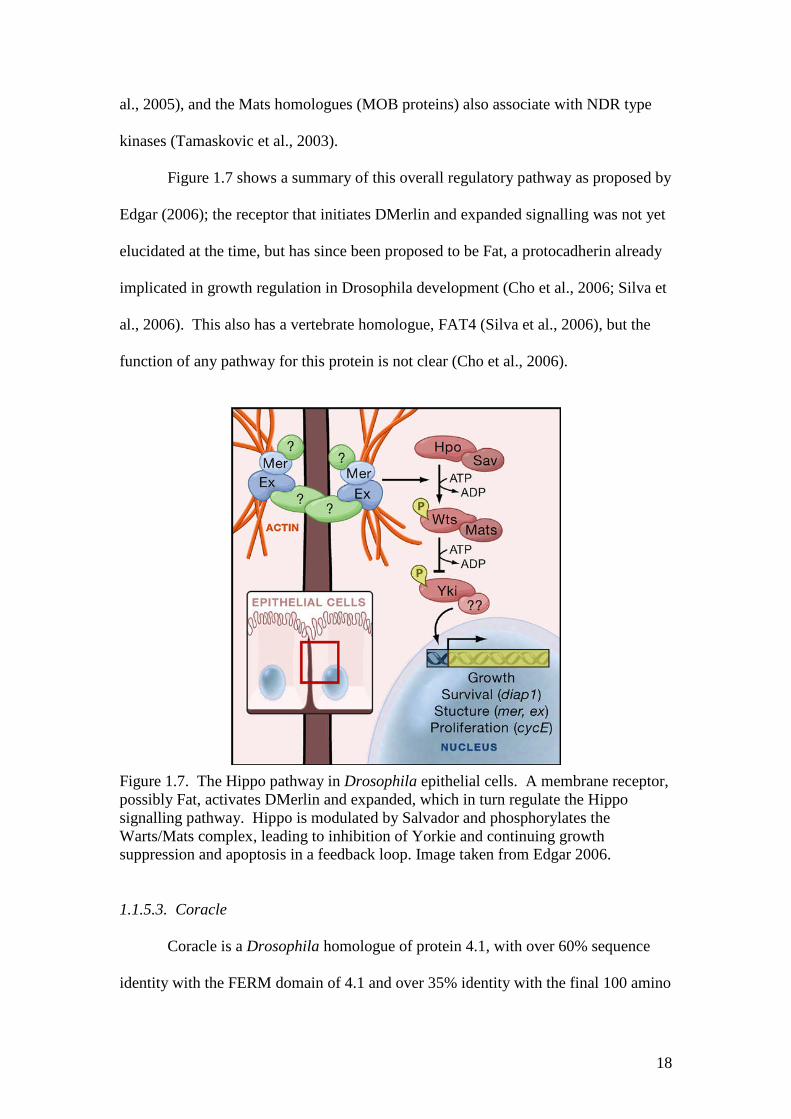
Figure 1.7 shows a summary of this overall regulatory pathway as proposed by
Edgar (2006); the receptor that initiates DMerlin and expanded signalling was not yet
elucidated at the time, but has since been proposed to be Fat, a protocadherin already
implicated in growth regulation in Drosophila development (Cho et al., 2006; Silva et
al., 2006). This also has a vertebrate homologue, FAT4 (Silva et al., 2006), but the
function of any pathway for this protein is not clear (Cho et al., 2006).
Figure 1.7. The Hippo pathway in Drosophila epithelial cells. A membrane receptor,possibly Fat, activates DMerlin and expanded, which in turn regulate the Hipposignalling pathway. Hippo is modulated by Salvador and phosphorylates theWarts/Mats complex, leading to inhibition of Yorkie and continuing growthsuppression and apoptosis in a feedback loop. Image taken from Edgar 2006.
1.1.5.3. Coracle
Coracle is a Drosophila homologue of protein 4.1, with over 60% sequence
identity with the FERM domain of 4.1 and over 35% identity with the final 100 amino
19
acids of the C-terminus, but lacks the spectrin-actin binding domain (Fehon et al.,
1994). Coracle localises to the septate junctions of epithelial cells, where it is
required for correct septate junction structure, but unlike protein 4.1, not apical-basal
polarity or structural integrity of epithelial cells (Lamb et al., 1998). This septate
junction role is probably linked to correct proliferation in embryonic development, as
coracle mutants show defects in proliferative aspects such as dorsal closure and
cuticle thickness (Ward et al., 2001).
1.1.6. FERM-binding motifs
Several proteins have shown conserved motifs that recognise FERM domains
for binding. One such site, MDWxxxxx(L/I)Fxx(L/F), is found in the C-terminus of
Na+/H+ exchanger regulatory factor (NHERF), an ERM binding partner that anchors
ion channels and receptors, as a motif that binds to the F3/C lobe of the FERM
domain (Terawaki et al., 2006). Another, and better-characterised, FERM-binding
motif, (R/K/Q)xxT(Y/L)xx(A/G), is found in cell adhesion molecules at the
juxtamembrane region of their cytoplasmic tails (Dickson et al., 2002; Hamada et al.,
2003; Terawaki et al., 2006) and been observed to bind ERMs. A similar motif is also
found at the C-terminus of neurofascin (Gunn-Moore et al., 2006).
The interaction of cell adhesion molecules of the L1 family with FERM-
containing proteins has been a particular interest of our laboratory for some time, and
these will now be discussed.
20
1.2 The L1 family of cell adhesion molecules
The L1 family of cell adhesion molecules share an overall structure of six IgG-
like domains and three to five fibronectin III-like domains extracellularly, a single
transmembrane domain, and a short (~110 amino acids) cytoplasmic C-terminus that
is highly conserved (Hortsch, 2000). The high level of conservation of the
cytoplasmic C-terminus implies similar roles in intracellular signalling, and perhaps
even shared binding partners. One known partner of L1 family members is the
ankyrin family, a cytoskeletal molecule that binds to a highly conserved 36 amino
acid domain found in all L1 proteins (Hortsch, 2000). This cytoskeletal link suggests
a role in the regulation of cell morphology and structure for the L1 family.
Members of the family include the prototype, L1 (also known as Neuron-glia
cell adhesion molecule or NgCAM), Close Homolog of L1 (CHL1), Neuron-glia-
related cell adhesion molecule (NrCAM), and neurofascin in mammals, and
neuroglian in Drosophila (Figure 1.8). The NrCAM and neurofascin genes are
subject to extensive alternative splicing, a process which is tightly linked to
development and tissue type (Hassel et al., 1997; Lane et al., 1996). In all, L1 family
members make up about 1% of the total membrane protein in brain (Davis et al.,
1996).
21
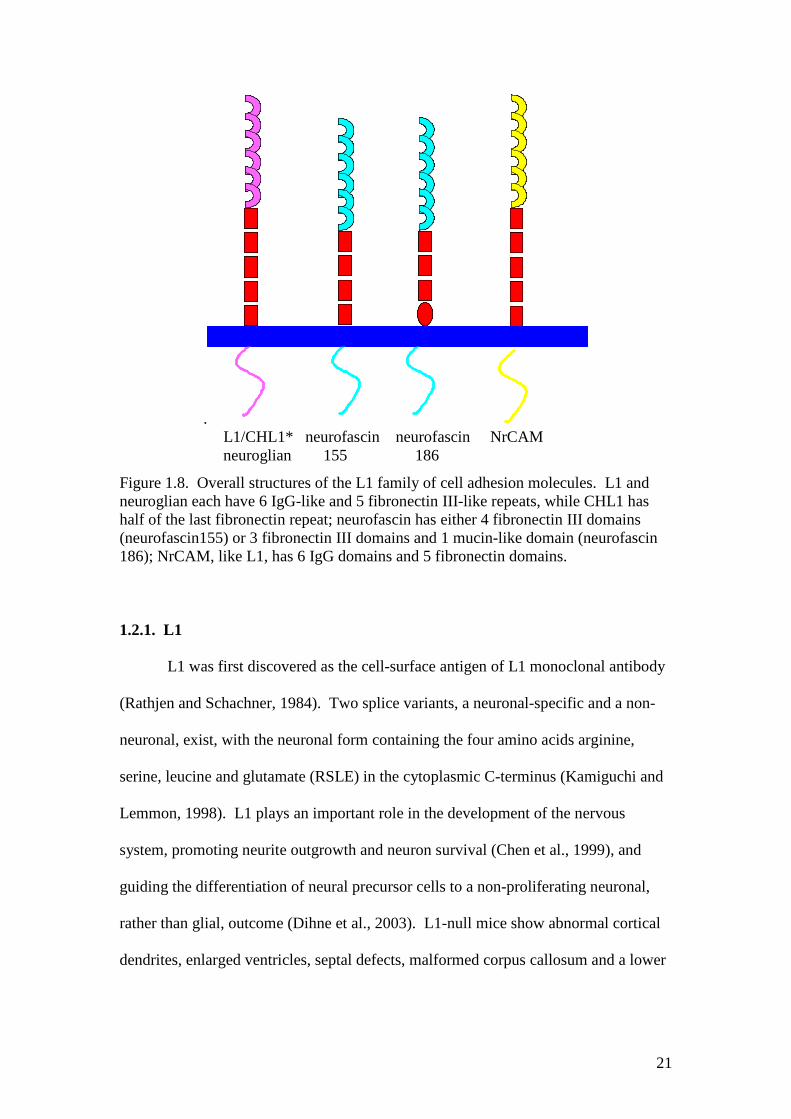
.L1/CHL1* neurofascin neurofascin NrCAMneuroglian 155 186
Figure 1.8. Overall structures of the L1 family of cell adhesion molecules. L1 andneuroglian each have 6 IgG-like and 5 fibronectin III-like repeats, while CHL1 hashalf of the last fibronectin repeat; neurofascin has either 4 fibronectin III domains(neurofascin155) or 3 fibronectin III domains and 1 mucin-like domain (neurofascin186); NrCAM, like L1, has 6 IgG domains and 5 fibronectin domains.
1.2.1. L1
L1 was first discovered as the cell-surface antigen of L1 monoclonal antibody
(Rathjen and Schachner, 1984). Two splice variants, a neuronal-specific and a non-
neuronal, exist, with the neuronal form containing the four amino acids arginine,
serine, leucine and glutamate (RSLE) in the cytoplasmic C-terminus (Kamiguchi and
Lemmon, 1998). L1 plays an important role in the development of the nervous
system, promoting neurite outgrowth and neuron survival (Chen et al., 1999), and
guiding the differentiation of neural precursor cells to a non-proliferating neuronal,
rather than glial, outcome (Dihne et al., 2003). L1-null mice show abnormal cortical
dendrites, enlarged ventricles, septal defects, malformed corpus callosum and a lower

22
number of hippocampal neurons (Demyanenko et al., 1999). Schwann cell-axon
interactions are also disrupted, leading to abnormal myelination (Itoh et al., 2005).
Mutations in L1, located on the X chromosome, cause a range of human
syndromes known collectively as CRASH (corpus callosum hypoplasia, retardation,
adducted thumbs, spastic paraplegia, hydrocephalus), and which show a great deal of
diversity in both appearance and severity of symptoms depending on which mutation
is present (Yamasaki et al., 1997).
1.2.2. CHL1
CHL1, like L1, promotes neuron survival and neurite outgrowth (Chen et al.,
1999); it is believed to interact with integrins for regulation of cell migration, but with
perhaps a differential preference for extracellular binding partners than L1 (Buhusi et
al., 2003). Its expression during nervous system development is also distinct from L1,
and in contrast to L1, the soluble form of CHL1 can promote neurite outgrowth
(Hillenbrand et al., 1999).
1.2.3. NrCAM
In the nervous system, NrCAM is found in both glia and neurons, with most
studies focusing on its neuronal functions. It is localised at the nodes of Ranvier and
axon initial segment, where Na+ channels cluster (Hillenbrand et al., 1999).
Intracellular binding partners of NrCAM have only recently been elucidated, and
include the cytoskeletal linker Ankyrin G (Davis and Bennett, 1994), Synapse
Associated Protein 102 (SAP102) (Davey et al., 2005), post-synaptic density-95
(PSD95), also known as SAP90, and SAP97 (Dirks et al., 2006). These three related
proteins are involved in many processes, but particularly synaptic activities such as
vesicle trafficking and receptor modulation (Davey et al., 2005). Interfering with
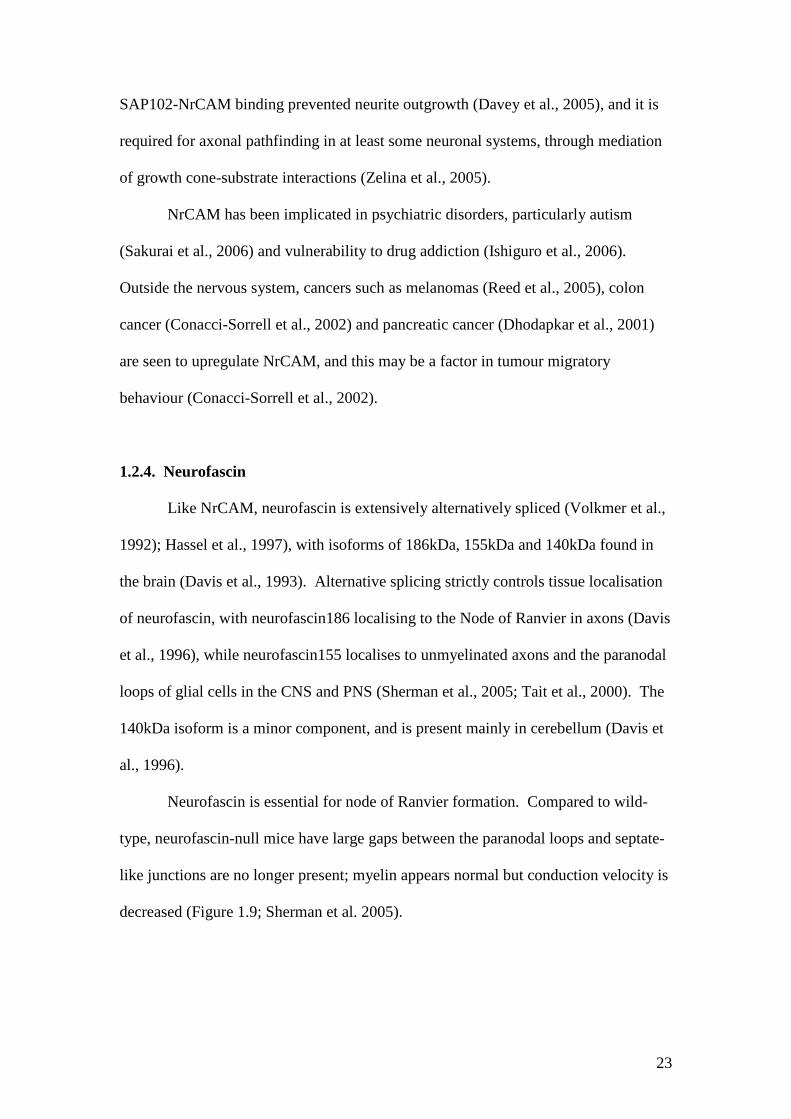
23
SAP102-NrCAM binding prevented neurite outgrowth (Davey et al., 2005), and it is
required for axonal pathfinding in at least some neuronal systems, through mediation
of growth cone-substrate interactions (Zelina et al., 2005).
NrCAM has been implicated in psychiatric disorders, particularly autism
(Sakurai et al., 2006) and vulnerability to drug addiction (Ishiguro et al., 2006).
Outside the nervous system, cancers such as melanomas (Reed et al., 2005), colon
cancer (Conacci-Sorrell et al., 2002) and pancreatic cancer (Dhodapkar et al., 2001)
are seen to upregulate NrCAM, and this may be a factor in tumour migratory
behaviour (Conacci-Sorrell et al., 2002).
1.2.4. Neurofascin
Like NrCAM, neurofascin is extensively alternatively spliced (Volkmer et al.,
1992); Hassel et al., 1997), with isoforms of 186kDa, 155kDa and 140kDa found in
the brain (Davis et al., 1993). Alternative splicing strictly controls tissue localisation
of neurofascin, with neurofascin186 localising to the Node of Ranvier in axons (Davis
et al., 1996), while neurofascin155 localises to unmyelinated axons and the paranodal
loops of glial cells in the CNS and PNS (Sherman et al., 2005; Tait et al., 2000). The
140kDa isoform is a minor component, and is present mainly in cerebellum (Davis et
al., 1996).
Neurofascin is essential for node of Ranvier formation. Compared to wild-
type, neurofascin-null mice have large gaps between the paranodal loops and septate-
like junctions are no longer present; myelin appears normal but conduction velocity is
decreased (Figure 1.9; Sherman et al. 2005).

24
Figure 1.9. Electron micrographs of paranodes in wild type and neurofascin-nullmice. In wild-type mice, paranodal loops connect to the axons with septate-likejunctions as indicated by arrows (a), but these connections are disrupted and the gapsbetween loops and the axon (block arrows) are greater in neurofascin-null mice (b).Taken from Sherman et al., 2005.
In the PNS, neurofascin186 is anchored to the node by gliomedin, a
component of Schwann cell microvilli, and can then act as a pioneer molecule for
recruiting other binding partners, such as NrCAM, ankyrin and sodium channels
(NaV). Neurofascin155, meanwhile, guides formation of the septate-like junctions of
the paranodal loops with the axons, via interactions with Caspr and contactin (Charles
et al., 2002; Sherman et al., 2005). This is summarised in Figure 1.10.
25
Figure 1.10. Construction of the node of Ranvier. Neurofascin186 and NrCAM inthe axon and gliomedin in the Schwann cell microvilli establish the node, andneurofascin and NrCAM recruit additional binding partners to the node. In theparanodal loops, neurofascin 155 arrives independently of Caspr and contactin, andrecruits them from the axonal side to form the paranodal complex. Taken formSherman et al., 2005.
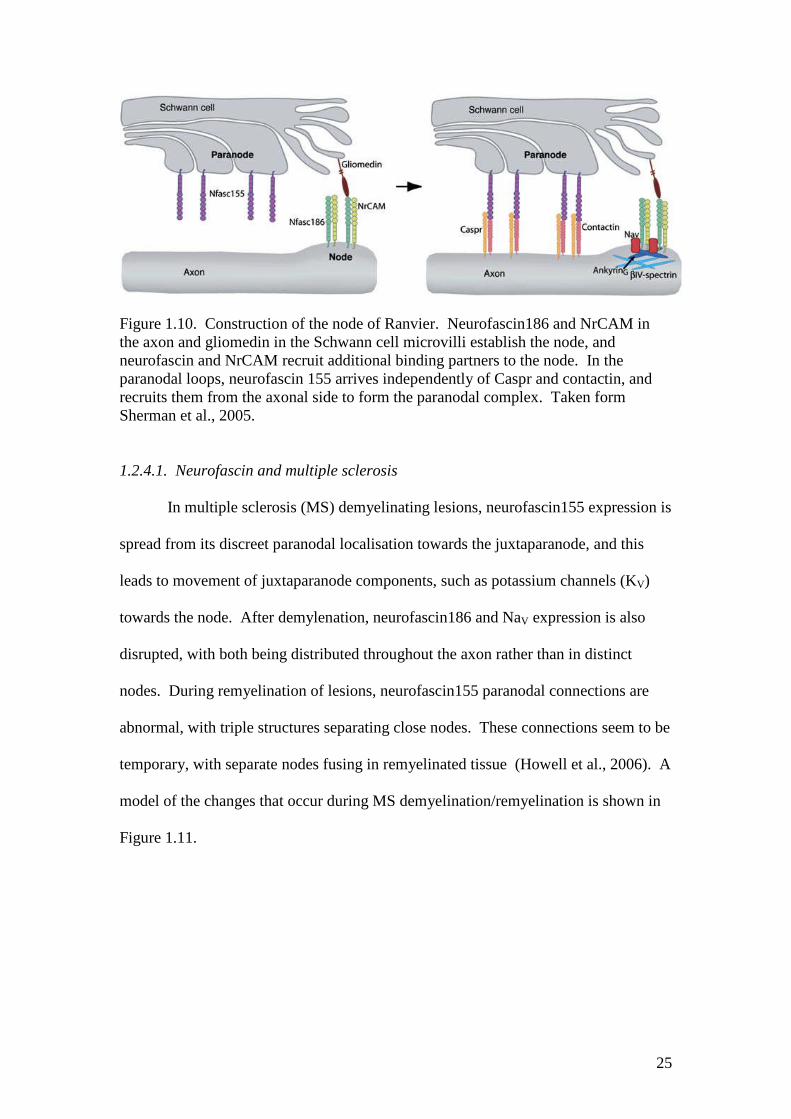
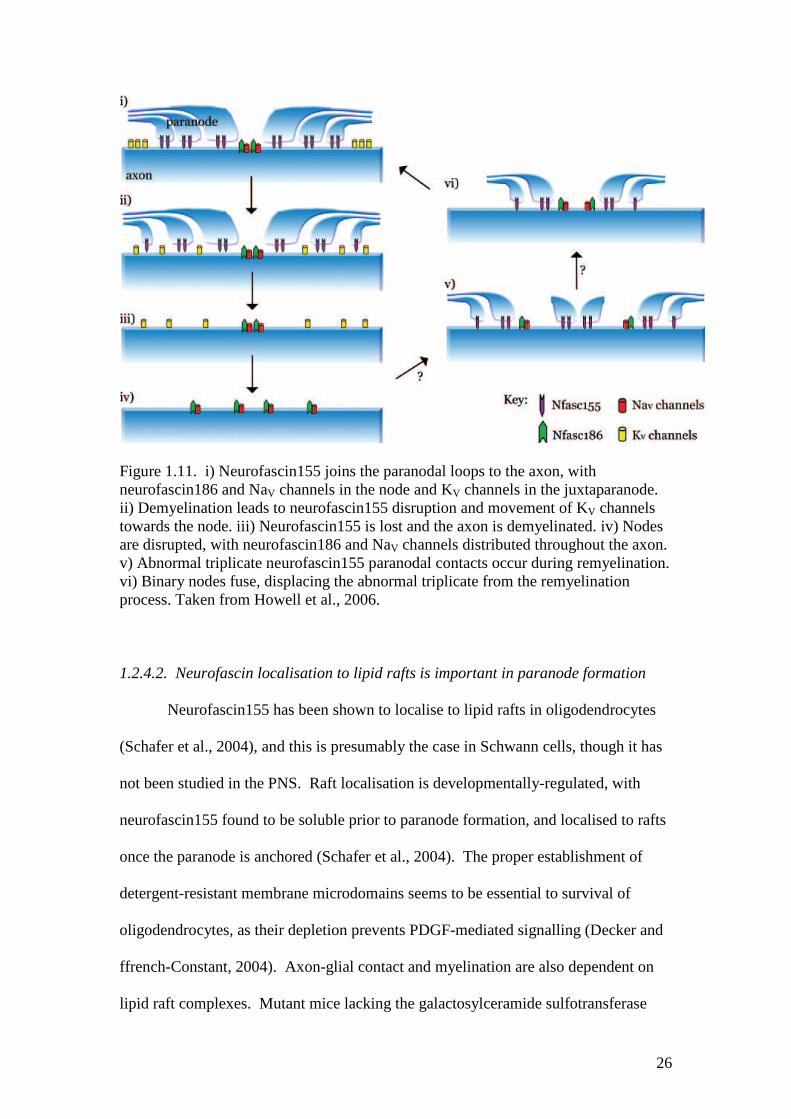
1.2.4.1. Neurofascin and multiple sclerosis
In multiple sclerosis (MS) demyelinating lesions, neurofascin155 expression is
spread from its discreet paranodal localisation towards the juxtaparanode, and this
leads to movement of juxtaparanode components, such as potassium channels (KV)
towards the node. After demylenation, neurofascin186 and NaV expression is also
disrupted, with both being distributed throughout the axon rather than in distinct
nodes. During remyelination of lesions, neurofascin155 paranodal connections are
abnormal, with triple structures separating close nodes. These connections seem to be
temporary, with separate nodes fusing in remyelinated tissue (Howell et al., 2006). A
model of the changes that occur during MS demyelination/remyelination is shown in
Figure 1.11.
26
Figure 1.11. i) Neurofascin155 joins the paranodal loops to the axon, withneurofascin186 and NaV channels in the node and KV channels in the juxtaparanode.ii) Demyelination leads to neurofascin155 disruption and movement of KV channelstowards the node. iii) Neurofascin155 is lost and the axon is demyelinated. iv) Nodesare disrupted, with neurofascin186 and NaV channels distributed throughout the axon.v) Abnormal triplicate neurofascin155 paranodal contacts occur during remyelination.vi) Binary nodes fuse, displacing the abnormal triplicate from the remyelinationprocess. Taken from Howell et al., 2006.
1.2.4.2. Neurofascin localisation to lipid rafts is important in paranode formation
Neurofascin155 has been shown to localise to lipid rafts in oligodendrocytes
(Schafer et al., 2004), and this is presumably the case in Schwann cells, though it has
not been studied in the PNS. Raft localisation is developmentally-regulated, with
neurofascin155 found to be soluble prior to paranode formation, and localised to rafts
once the paranode is anchored (Schafer et al., 2004). The proper establishment of
detergent-resistant membrane microdomains seems to be essential to survival of
oligodendrocytes, as their depletion prevents PDGF-mediated signalling (Decker and
ffrench-Constant, 2004). Axon-glial contact and myelination are also dependent on
lipid raft complexes. Mutant mice lacking the galactosylceramide sulfotransferase
27
gene, disrupting production of two major glycolipids, show improper ion channel
clustering, altered nodal length and diffuse distribution of Caspr along the internode
(Ishibashi et al., 2002). Active MS lesions that show disrupted paranodes also have
reduced neurofascin155 localisation to lipid rafts (Maier et al., 2007).
1.2.5. Neuroglian
Drosophila have only one L1 family member, neuroglian. Like the other
family members, neuroglian interacts with and may be necessary for membrane
localisation of ankyrin (Dubreuil et al., 1996). In the Drosophila nervous system,
neuroglian is important in neuronal pathfinding (Hall and Bieber, 1997) and axonal
substrate choice (Garcia-Alonso et al., 2000); in other tissues, it is important for
stabilisation of epithelial tissue at points of cell-to-cell contact (Wei et al., 2004), and
indeed it has been found to localise to the ladder-like pleated septate junctions of the
epithelium (Genova and Fehon, 2003) along with neurexin IV (Baumgartner et al.,
1996) and contactin (Faivre-Sarrailh et al., 2004). These three adhesion molecules
allow the formation of the Drosophila blood-brain barrier, which keeps the potassium-
rich hemolymph separate from neurons. Septate junctions also form between
insulating glia around axon in a homologous structure to the vertebrate septate-like
junctions of the paranodes (Banerjee et al., 2006).
1.2.6. The interaction of L1 family members and FERM-containing proteins
While the behaviour of the extracellular component of L1 family proteins is
relatively well-defined, cytoplasmic binding partners have not been well-elucidated.
In fact, despite the high degree of conservation among the L1 family members,
ankyrin is the only mammalian universal binding partner found to date (Davey et al.,

28
2005; Davis et al., 1993). Yeast two-hybrid screens for binding partners of the C-
terminus of L1 family members have revealed multiple sites capable of bind ERM
proteins in both L1 and neurofascin, but not NrCAM (Cheng et al., 2005; Dickson et
al., 2002; Gunn-Moore et al., 2006).
1.2.6.1. L1 interaction with Ezrin is important for normal axonal morphogenesis
Dickson et al. (2002) first screened for cytoplasmic binding partners and found
that the FERM domain of Ezrin bound to the neuronal isoform of L1 at a region
encompassing the RSLE motif, a region previously shown to regulate sorting of L1 to
the axonal growth cone (Kamiguchi and Lemmon, 1998). A second, juxtamembrane
region also mediates ERM-binding, and both regions are involved in regulation of
neurite outgrowth and branching (Dickson et al. 2002; Cheng et al. 2005). The L1-
ERM interaction occurs in early in vitro development, with active, phosphorylated
ERM expression peaking at 3 days in vitro (DIV) and diminished by 21 DIV; between
21 and 28 DIV, mainly inactive ERMs are expressed, but after injury active ERMs are
re-expressed for regeneration of neurites (Haas et al., 2004).
1.2.6.2. Neurofascin interacts with Ezrin in the microvilli of Schwann cells
A yeast two-hybrid screen of neurofascin C-terminus against a rat sciatic nerve
cDNA library was performed to identify novel intracellular binding partners, and
Ezrin was identified as a positive interaction. Experiments with truncated constructs
showed it was the FERM domain of Ezrin that bound to neurofascin, while only the
extreme C-terminus of neurofascin was required for the interaction (Gunn-Moore et
al., 2006). This is a different mechanism for the interaction with Ezrin than that used
by L1.
29
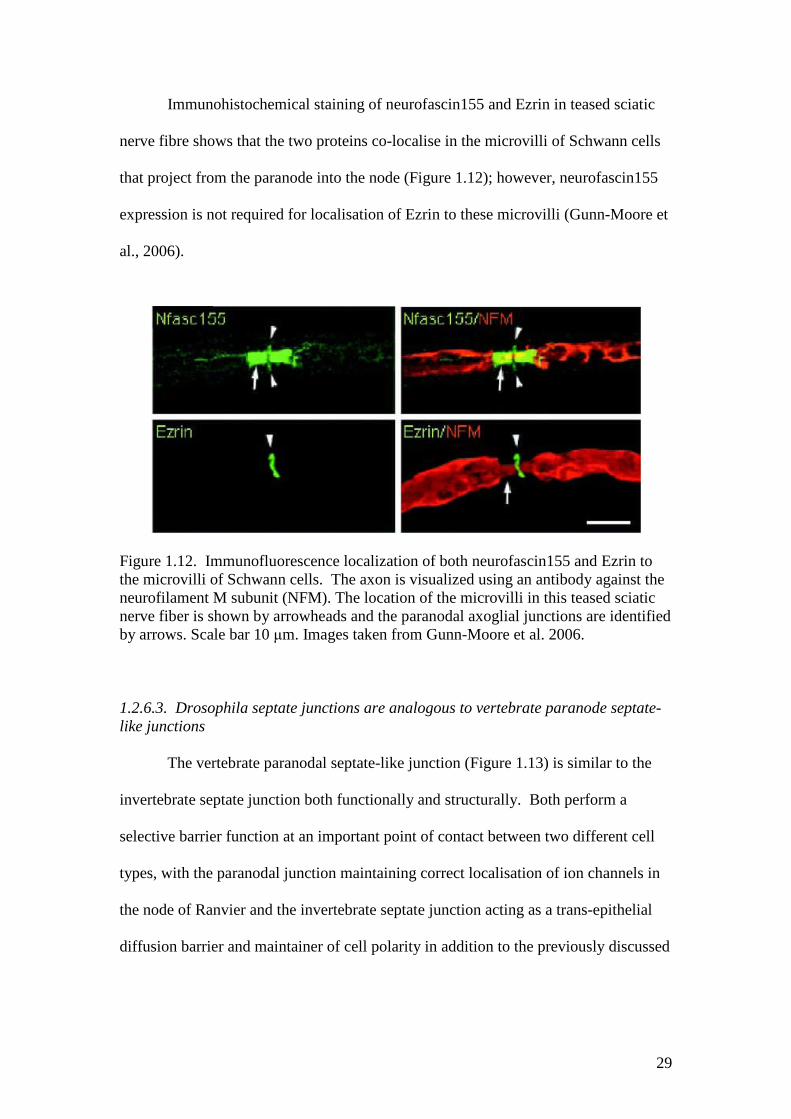
Immunohistochemical staining of neurofascin155 and Ezrin in teased sciatic
nerve fibre shows that the two proteins co-localise in the microvilli of Schwann cells
that project from the paranode into the node (Figure 1.12); however, neurofascin155
expression is not required for localisation of Ezrin to these microvilli (Gunn-Moore et
al., 2006).
Figure 1.12. Immunofluorescence localization of both neurofascin155 and Ezrin tothe microvilli of Schwann cells. The axon is visualized using an antibody against theneurofilament M subunit (NFM). The location of the microvilli in this teased sciaticnerve fiber is shown by arrowheads and the paranodal axoglial junctions are identifiedby arrows. Scale bar 10 μm. Images taken from Gunn-Moore et al. 2006.
1.2.6.3. Drosophila septate junctions are analogous to vertebrate paranode septate-like junctions
The vertebrate paranodal septate-like junction (Figure 1.13) is similar to the
invertebrate septate junction both functionally and structurally. Both perform a
selective barrier function at an important point of contact between two different cell
types, with the paranodal junction maintaining correct localisation of ion channels in
the node of Ranvier and the invertebrate septate junction acting as a trans-epithelial
diffusion barrier and maintainer of cell polarity in addition to the previously discussed

30
function (see section 1.2.5) in the insect blood-brain barrier (Tepass and Tanentzapf,
2001).
Figure 1.13. At the paranode, glia form septate-like junctions with the axon. Betweenparanodal loops are tight junctions and adherens junctions. Image from Tepass et al.,2001.
Several molecules have been identified in both junction types: Caspr is a
vertebrate homologue of neurexin IV and localises to the paranodal septate-like
junctions of myelinated axons (Einheber et al., 1997). It can also bind the neuronal
isoform of protein 4.1, the homologue of coracle (Menegoz et al., 1997).
Interestingly, neuroglian interacts genetically with coracle in septate junctions,
forming a protein complex along with other junction components including neurexin
IV (Genova and Fehon, 2003); as Caspr has also been shown to bind neurofascin155
31
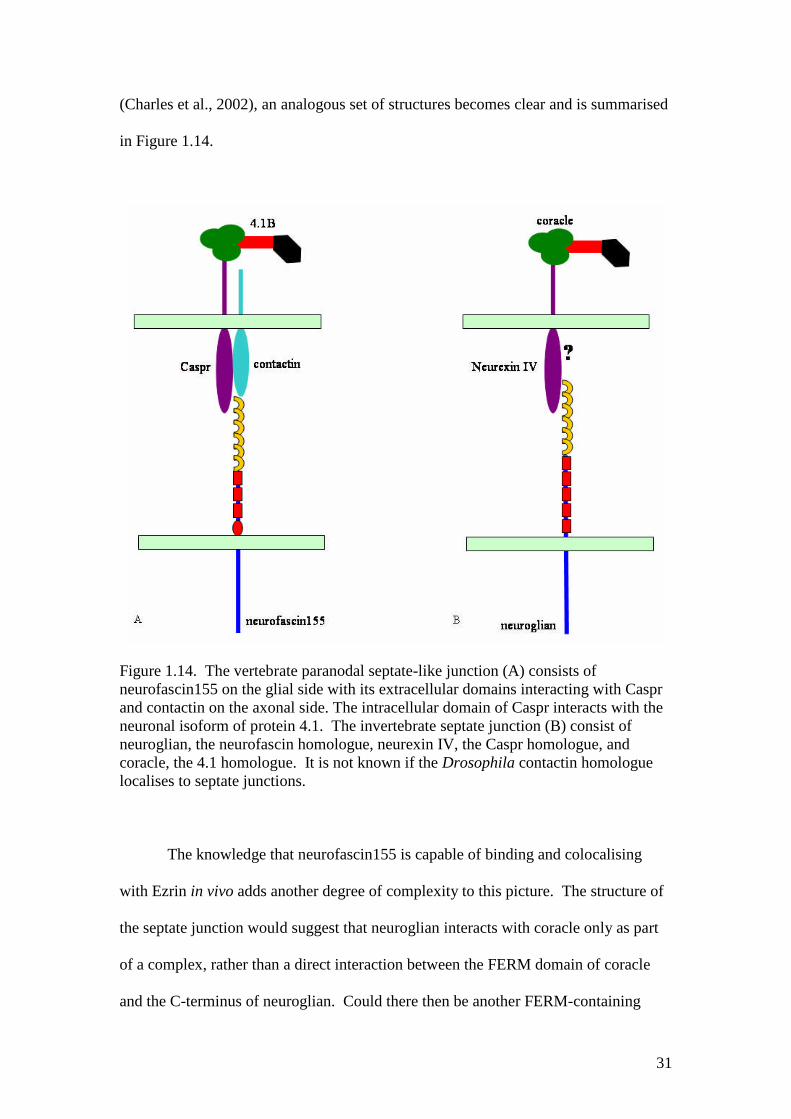
(Charles et al., 2002), an analogous set of structures becomes clear and is summarised
in Figure 1.14.
Figure 1.14. The vertebrate paranodal septate-like junction (A) consists ofneurofascin155 on the glial side with its extracellular domains interacting with Casprand contactin on the axonal side. The intracellular domain of Caspr interacts with theneuronal isoform of protein 4.1. The invertebrate septate junction (B) consist ofneuroglian, the neurofascin homologue, neurexin IV, the Caspr homologue, andcoracle, the 4.1 homologue. It is not known if the Drosophila contactin homologuelocalises to septate junctions.
The knowledge that neurofascin155 is capable of binding and colocalising
with Ezrin in vivo adds another degree of complexity to this picture. The structure of
the septate junction would suggest that neuroglian interacts with coracle only as part
of a complex, rather than a direct interaction between the FERM domain of coracle
and the C-terminus of neuroglian. Could there then be another FERM-containing
32
protein that interacts with neuroglian as Ezrin does with neurofascin155? As yet, all
other FERM-containing proteins in Drosophila have been observed to localise to
adherens, not septate, junctions (Boedigheimer et al., 1997; McCartney and Fehon,
1996), but as will be discussed in Chapter 6, this picture is not as clear cut as it may
seem, and leaves some scope for further speculation.
1.2.6.4. A novel protein discovered from a yeast two-hybrid screen of neurofascin
During a yeast two-hybrid screen of the neurofascin C-terminus against a rat
sciatic nerve library, a novel FERM-containing cDNA was identified and called
163ScII (accession number AF441249). This sequence was found to have 86%
identity at the DNA level and 91% identity at the protein level to a full-length cDNA
human clone (MGC:17921 image: 3941276) which has also been identified as Open
Reading Frame 31 Chromosome 14 (accession number BC020521). The cDNA
image clone, obtained from a human uterine leiomyosarcoma, was acquired from the
MRC IMAGE consortium and termed Willin, after the founder of the Royal (Dick)
School Veterinary College of the University of Edinburgh, William Dick, and is also
known as FRMD6.
1.3. Willin
Upon complete sequencing, the protein was found to have 614 amino acids,
with a predicted molecular weight of approximately 71kDa and a FERM domain
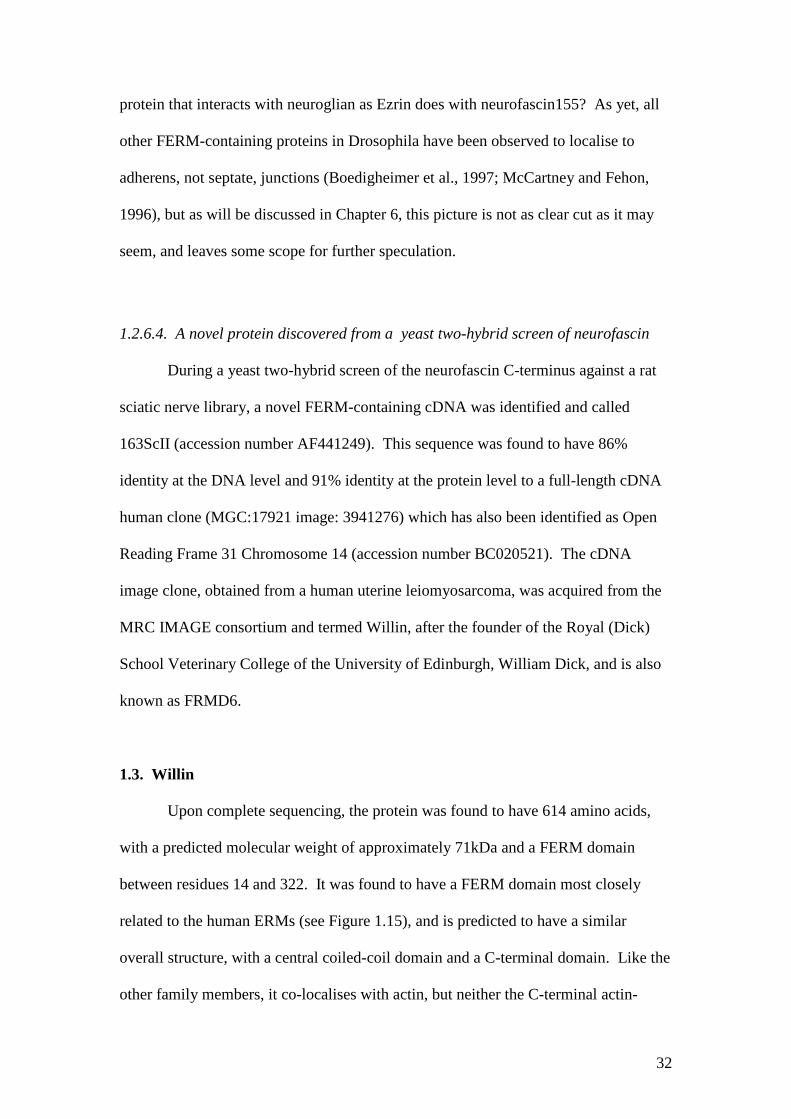
between residues 14 and 322. It was found to have a FERM domain most closely
related to the human ERMs (see Figure 1.15), and is predicted to have a similar
overall structure, with a central coiled-coil domain and a C-terminal domain. Like the
other family members, it co-localises with actin, but neither the C-terminal actin-

33
binding motif nor the putative N-terminal actin-binding regions of the ERMs and
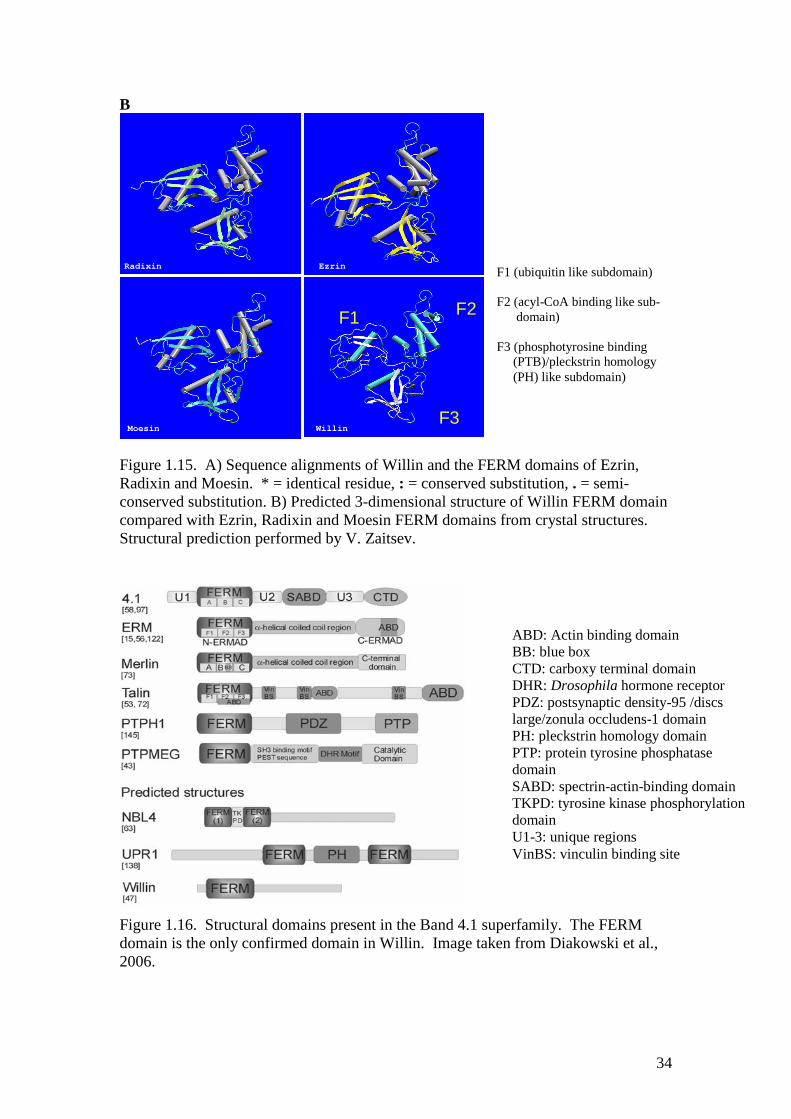
Merlin are conserved; to date, only the FERM domain is confirmed to be present (see
Figure 1.16).
A
34
B
Radixin Ezrin
Willin
FERMDOMAINS
F1 F2
F3
F1 (ubiquitin like subdomain)
F2 (acyl-CoA binding like sub-domain)
F3 (phosphotyrosine binding(PTB)/pleckstrin homology(PH) like subdomain)
Moesin
Figure 1.15. A) Sequence alignments of Willin and the FERM domains of Ezrin,Radixin and Moesin. * = identical residue, : = conserved substitution, . = semi-conserved substitution. B) Predicted 3-dimensional structure of Willin FERM domaincompared with Ezrin, Radixin and Moesin FERM domains from crystal structures.Structural prediction performed by V. Zaitsev.
Figure 1.16. Structural domains present in the Band 4.1 superfamily. The FERMdomain is the only confirmed domain in Willin. Image taken from Diakowski et al.,2006.
ABD: Actin binding domainBB: blue boxCTD: carboxy terminal domainDHR: Drosophila hormone receptorPDZ: postsynaptic density-95 /discslarge/zonula occludens-1 domainPH: pleckstrin homology domainPTP: protein tyrosine phosphatasedomainSABD: spectrin-actin-binding domainTKPD: tyrosine kinase phosphorylationdomainU1-3: unique regionsVinBS: vinculin binding site

35
Like the ERMs and Merlin, Willin has been observed in the cytoplasm and
nucleus (Madan et al., 2006). We have also shown that Willin has a phosphoinositol
binding profile comparable to that of Moesin (Figure 1.17), and Willin-GFP is often
localised to the membrane; this is particularly true in adjoining cells.
A
B
Figure 1.17. A) A phospholipid blot overlay experiment using purified GST, GST-Moesin and GST-Willin. Image provided by Dr. Kanamarlapudi Venkateswarlu. B)A HEK-293 cell expressing Willin-GFP. Membrane localisation indicated by arrows.Image obtained by Dr. Frances Brannigan.
In PC12 cells, a cytoplasmic pool of Willin-GFP is seen to translocate to the
membrane when the cells are treated with growth factors, even in adjoining cells
where Willin-GFP is already present in the membrane (Gunn-Moore et al., 2005).
This effect occurred under the influence of both epidermal growth factor (EGF;

36
Figure 1.18) and nerve growth factor (NGF; data not shown), but the translocation is
not blocked when the cells are treated with wortmannin (Figure 1.19). This indicates
that phosphatidylinositol 3-kinase (PI3K) activity is not required to translocate Willin
(Venkateswarlu et al., 1999). It is probable that, like Ezrin, EGF is causing tyrosine
phosphorylation of Willin; EGF is a known activator of Ras (Marshall, 1995), Rho
and Rac (Maddala et al., 2003), which in turn interact with ERM proteins (see section
1.1.3.4), so Rho family activation is a possible pathway for Willin translocation.
These and other possibilities have yet to be studied.
Figure 1.18. A PC-12 cell expressing Willin-GFP, mostly in the cytoplasm. Uponaddition of 100 ng/mL of EGF, the majority of cytoplasmic pool of Willin-GFPtranslocates to the plasma membrane in under 10 minutes. t = time after addition ofEGF. Images taken from Gunn-Moore et al., 2005.
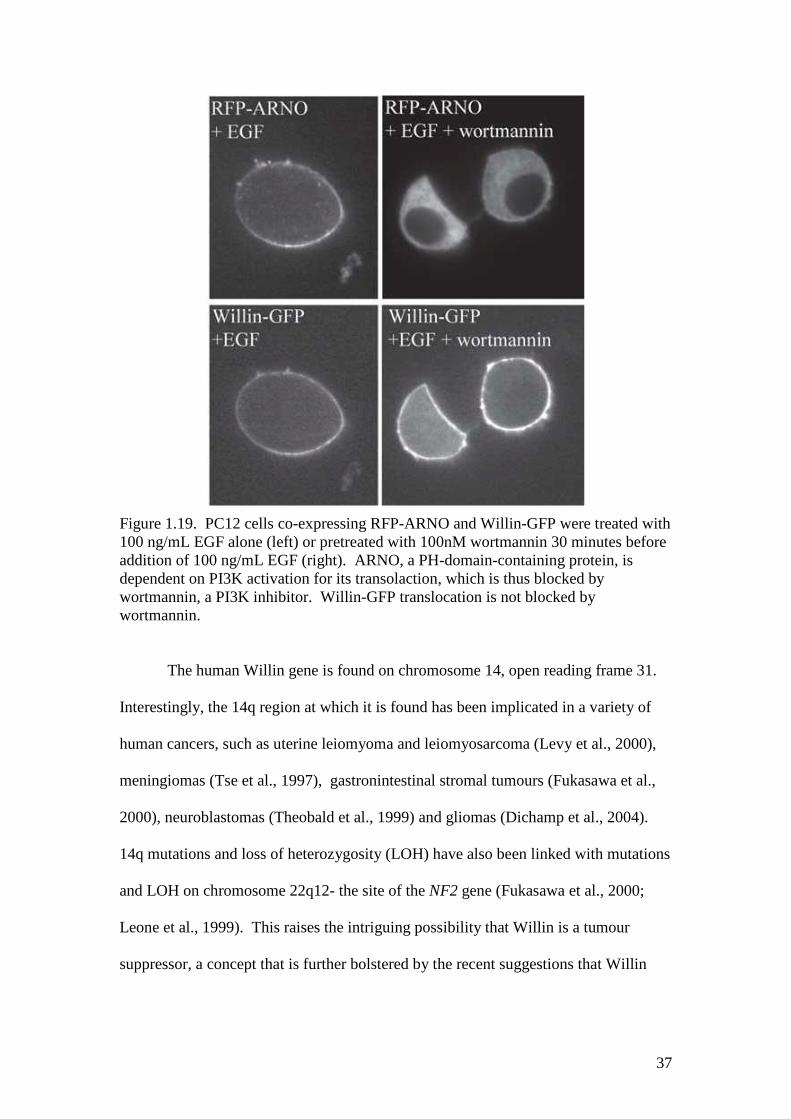
37
Figure 1.19. PC12 cells co-expressing RFP-ARNO and Willin-GFP were treated with100 ng/mL EGF alone (left) or pretreated with 100nM wortmannin 30 minutes beforeaddition of 100 ng/mL EGF (right). ARNO, a PH-domain-containing protein, isdependent on PI3K activation for its transolaction, which is thus blocked bywortmannin, a PI3K inhibitor. Willin-GFP translocation is not blocked bywortmannin.
The human Willin gene is found on chromosome 14, open reading frame 31.
Interestingly, the 14q region at which it is found has been implicated in a variety of
human cancers, such as uterine leiomyoma and leiomyosarcoma (Levy et al., 2000),
meningiomas (Tse et al., 1997), gastronintestinal stromal tumours (Fukasawa et al.,
2000), neuroblastomas (Theobald et al., 1999) and gliomas (Dichamp et al., 2004).
14q mutations and loss of heterozygosity (LOH) have also been linked with mutations
and LOH on chromosome 22q12- the site of the NF2 gene (Fukasawa et al., 2000;
Leone et al., 1999). This raises the intriguing possibility that Willin is a tumour
suppressor, a concept that is further bolstered by the recent suggestions that Willin
38
could be the mammalian homologue of the Drosophila tumour suppressor Expanded
(Hamaratoglu et al., 2006).
The aims of this project were: to characterise further the novel protein Willin,
with particular emphasis on elucidation of potential binding partners, subcellular
localisation and function; to test several antibodies to Willin which were raised in
chicken, rabbit and mouse; and to perform an initial comparison between the 614
amino acid isoform of Willin and a 622 amino acid splice variant that was found late
in this project.

39
CHAPTER 2: MATERIALS AND METHODS
40
Chapter 2: Materials and Methods
Unless otherwise stated, chemical reagents were obtained from Sigma. See appendix
4 for a list of suppliers.
2.1 Molecular biology and cloning
2.1.1 Polymerase Chain Reaction (PCR)
PCR was performed using PfuTURBO DNA Polymerase (Stratagene or
Rovalab,Teltow, Germany) or Expand High Fidelity Taq Polymerase (Roche)
according to manufacturer’s instructions in the buffer supplied and adding 200M
dNTPs (Promega), 0.5M forward and reverse primers (Invitrogen) and 200-300ng
template. Thermal cycling was then done in a Biometra Tpersonal Combi thermal
cycler (Biometra, Goettingen, Germany) as follows:
1. 94ºC for 5 minutes
2. 94ºC for 1 minute.
3. 54ºC for 1 minute.
4. 72ºC for 2minutes 30 seconds. (steps 2-4 repeated 34 times for a total of 35 cycles)
5. 72ºC for 10 minutes.
PCR products were run on a 1% or 2% agarose gel alongside a 1kb DNA
ladder for size analysis.
2.1.2 Restriction enzyme digest
Restriction enzymes were acquired from Promega or New England Biolabs.
Restriction digests were performed according to manufacturer’s instructions with
supplied buffers and either single enzymes or in double digests. Generally, 10 units
of enzyme were used to digest 1g of plasmid DNA or PCR product. Digests were

41
incubated at 37oC for 1-5 hours. They were then either heat inactivated at 65oC for 15
minutes for further treatment with alkaline phosphatase (see section 2.1.3) or run
directly on an agarose gel for analysis or purification.
2.1.3 Alkaline phosphatase treatment of digested plasmids
To prevent religation of sticky ends in digested plasmids, phosphate groups
were removed from their 5’ overhangs by the addition of 1 unit of calf intestinal
alkaline phosphatase (CIAP) (Promega) incubated for 30 minutes at 37oC, followed
by addition of another unit of CIAP and a further 30 minute incubation at 37oC. Blunt
ends and 3’ overhangs were treated by addition of 1 unit CIAP for 15 minutes at 37oC
and then 15 minutes at 56oC, repeated with a second unit of CIAP.
2.1.4 Klenow reaction
For cloning strategies where a blunt end was required for ligation, sticky ends
were filled in using Klenow fragment and supplied buffer (Promega) according to
manufacturer’s instructions.
2.1.5 Ligation reaction
Ligations were performed using T4 DNA ligase (Promega) according to
manufacturer’s instructions.
2.1.6 Agarose gel electrophoresis
DNA fragments were separated by molecular weight using agarose gel
electrophoresis. Agarose was melted in Tris-borate ethylenediamine tetra acetic acid
(TBE) buffer (0.45M Tris-borate, 10mM EDTA, pH 8.3) with ethidium bromide
added to a final concentration of 0.5g/mL, and poured into an AGTI submarine gel
casting apparatus unit (VWR) to set. A 1% (w/v) agarose solution was used for DNA
42
fragments > 1kb, and 2% (w/v) for fragments <1kb. The samples had 20% 6x agarose
gel loading buffer (50% glycerol, 49.75% TBE, 0.25% bromophenol blue) added. For
analytical gels, 1kb or 100bp DNA ladders were loaded into a lane in 1% and 2% gels
respectively for sizing and quantification of DNA bands. Gels were run at 60-80V for
30-60 minutes. Analytical gels were visualised with a UV lamp and photographed by
a digital camera (Mitsubishi 85mm lens, Thistle Scientific), while preparation gels
were visualised with a low intensity UV lamp (230V-50Hz, Ultratec, Ltd.) and desired
bands excised from the gel with a sterile scalpel blade.
2.1.7 Gel purification of digested DNA
Digested DNA was separated on a 1% agarose purification gel and purified
with the Wizard SV Gel and PCR Cleanup Kit (Promega) according to manufacturer’s
instructions.
2.1.8 Preparation of plasmid DNA
Small scale plasmid purification was done with the Qiagen Spin Miniprep Kit
according to manufacturer’s instructions. Large scale purifications were done with
the Qiagen Endofree Maxi Kit or the Promega PureYield Midi Prep kit according to
manufacturer’s instructions.
2.1.9 Preparation of CaCl2-competent E. coli
A 5mL overnight culture of DH5 or BL21/DE3 E. coli was grown shaking
overnight at 37oC in LB without antibiotics. The next day, 50mL of LB without
antibiotics were inoculated with 500L of preculture and grown shaking at 37oC until
A600 was 0.3-0.4. Cells were then harvested by centrifugation at 3500g for 10 minutes
at 4oC. The cell pellet was resuspended in 20mL of chilled sterile 100mM CaCl2 and
incubated on ice for 30 minutes-2 hours. The suspension was again centrifuged at
43
3500g for 5 minutes at 4oC and the pellet resuspended in 1mL 100mM CaCl2 for an
additional 30 minute incubation on ice. Competent cells were then used for
transformation or frozen at -80oC for later use.
2.1.10 Preparation of ‘super’-competent E. coli
DH5 E. coli were streaked from a glycerol stock onto an LB-Agar plate and
grown overnight at 37oC. The following day, 10-12 colonies were picked to inoculate
250mL of SOB medium (2% (w/v) Bacto-tryptone, 0.5% (w/v) Bacto yeast extract,
10mM NaCl, 2.5mM KCl, 10mM MgCl2, 10mM MgSO4), which was the grown at
18oC with shaking until O.D.600 reached 0.6. The cells were then incubated on ice for
10 minutes before being centrifuged at 2500g for 10 minutes at 4oC. The pellet was
gently resuspended in 80mL ice-cold TB (10mM PIPES, 15mM CaCl2, 250mM KCl,
pH 6.7, 55mM MnCl2, 0.45m filter sterilised), and aliquots snap frozen and stored in
liquid nitrogen. These cells were used for more difficult transformations.
2.1.11 Transformation of competent E. coli
The desired amount of plasmid or ligation was added to a 100-200L aliquot
of competent cells in a 15mL tube, and the mixture was incubated on ice for 30
minutes. Cells were heat-shocked at 42oC for 45 seconds, incubated on ice for a
further 2 minutes, then left to shake at 37oC in SOC medium (2% w/v tryptone, 0.5%
bacto-yeast extract, 10mM NaCl, 2.5mM KCl, 10mM MgCl2, 10mM MgSO4, 20mM
glucose) for 1 hour. Cells were plated onto LB-Agar plates containing the appropriate
antibiotic for selection of transformed colonies (100g/mL ampicillin, 34g/mL
chloramphenicol, 50g/mL kanamycin) and left to grow upside down overnight at
37oC.

44
2.2 Cell culture
2.2.1 Cell culture
All plasticware and glass coverslips were from Nunc/VWR. All cells were
cultured in T-75 flasks (80cm3) at 37oC in the presence of 5% CO2. COS-7
(laboratory stocks) cells were routinely cultured in Dulbecco’s modified Eagle
medium (DMEM) supplemented with 10% (v/v) foetal calf serum (FCS)
(Globepharm), 2mM L-glutamine, 100 units/mL penicillin (pen) and 0.1mg/mL
streptomycin (strep). PC12 cells were routinely cultured in DMEM, 10% FCS, 10%
horse serum (HS), 1mM L-glutamine, 100 units/mL pen and 0.1mg/mL strep. SK-
UT-1 (Cell Lines Service, Eppelheim, Germany) cells were routinely cultured in
minimum essential medium (MEM), 10% FCS, 2mM L-glutamate, 100 units/mL pen,
0.1mg/mL strep, 1% (v/v) non-essential amino acids (NEAA), and 1mM sodium
pyruvate. Human embryonic kidney (HEK-293) cells (laboratory stocks) were
routinely cultured in MEM, 10% FCS, 2mM L-glutamate, 100 units/mL pen,
0.1mg/mL strep and 1% NEAA. Stable cell lines were maintained in their normal
medium supplemented with 1mg/mL G-418 sulfate (geneticin) (Melford
Laboratories).
2.2.2 Passage of cell lines
Cells were passaged prior to reaching confluence by washing the flask with
trypsin-EDTA (0.25% (w/v) trypsin, 0.5mM EDTA in PBS) warmed to 37oC, then
incubating the flask in with trypsin-EDTA for the amount of time required to loosen
them according to cell type. HEK293 cells were incubated for 30 seconds-2 minutes
in the hood and the trypsin-EDTA removed prior to striking the flask to dislodge
them. COS-7 cells were incubated for 5 minutes in the hood and struck without
45
removing the trypsin-EDTA. SK-UT-1 cells were incubated for 2 minutes in the
hood, then the trypsin-EDTA was removed and the flask incubated at 37oC for a
further 8-10 minutes before being struck. Detached cells were harvested with 15mL
medium by pipetting and seeded into flasks or Petri dishes at appropriate seeding
densities as required.
2.2.3 Cryogenic storage of mammalian cell lines
Frozen stocks of cells were prepared by treating confluent cells as for passage,
but upon harvesting the suspension was pelleted by centrifugation at 2000g for 5
minutes at room temperature. The pellet was resuspended in 40% FCS, 50% normal
growth medium, and 10% DMSO and 1.5mL aliquots pipetted into cryotubes.
Cryotubes were slowly brought to -80oC by placing in a ‘Mr. Frosty’ cryo 1oC
freezing container (Nalgene) in a -80oC freezer for 5-12 hours, then transferred to
liquid nitrogen for long-term storage.
2.2.4 Rescue of frozen cell lines
Cell lines were rescued by rapid thawing of the cryotube at 37oC and seeding
into a T-75 flask with 15mL usual medium. Medium was then changed 8-24 hours
later to remove DMSO.
2.2.5 Transfection of mammalian cells with Lipofectamine Transfection Reagent
Cells were grown to 40-80% confluence, depending on cell type, in a dish,
with or without coverslips, of desired size and transfected according to manufacturer’s
instructions. Optimem medium was prewarmed to 37oC and aliquoted into two sterile
tubes. To one tube was added the desired amount of plasmid DNA, and to the other
the appropriate amount of Lipofectamine (Invitrogen). The contents were then added
together and left to incubate for at least 30 minutes. Meanwhile, the dish was gently
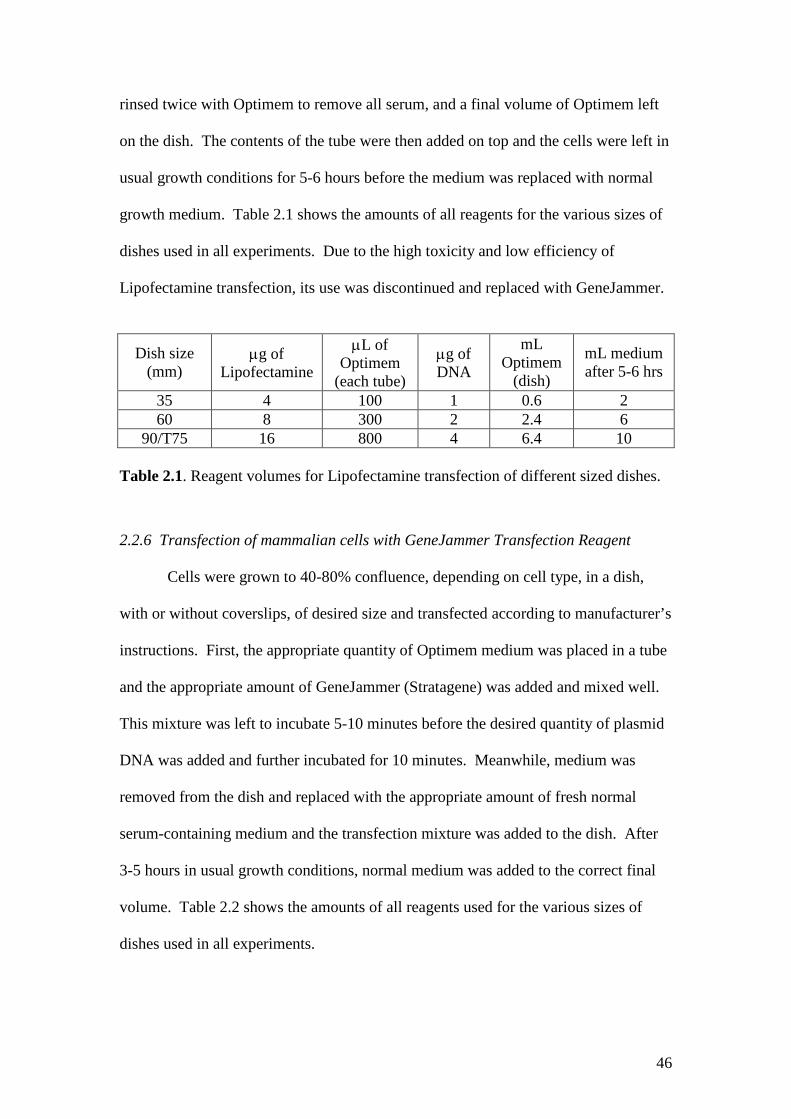
46
rinsed twice with Optimem to remove all serum, and a final volume of Optimem left
on the dish. The contents of the tube were then added on top and the cells were left in
usual growth conditions for 5-6 hours before the medium was replaced with normal
growth medium. Table 2.1 shows the amounts of all reagents for the various sizes of
dishes used in all experiments. Due to the high toxicity and low efficiency of
Lipofectamine transfection, its use was discontinued and replaced with GeneJammer.
Dish size(mm)
g ofLipofectamine
L ofOptimem
(each tube)
g ofDNA
mLOptimem
(dish)
mL mediumafter 5-6 hrs
35 4 100 1 0.6 260 8 300 2 2.4 6
90/T75 16 800 4 6.4 10
Table 2.1. Reagent volumes for Lipofectamine transfection of different sized dishes.
2.2.6 Transfection of mammalian cells with GeneJammer Transfection Reagent
Cells were grown to 40-80% confluence, depending on cell type, in a dish,
with or without coverslips, of desired size and transfected according to manufacturer’s
instructions. First, the appropriate quantity of Optimem medium was placed in a tube
and the appropriate amount of GeneJammer (Stratagene) was added and mixed well.
This mixture was left to incubate 5-10 minutes before the desired quantity of plasmid
DNA was added and further incubated for 10 minutes. Meanwhile, medium was
removed from the dish and replaced with the appropriate amount of fresh normal
serum-containing medium and the transfection mixture was added to the dish. After
3-5 hours in usual growth conditions, normal medium was added to the correct final
volume. Table 2.2 shows the amounts of all reagents used for the various sizes of
dishes used in all experiments.
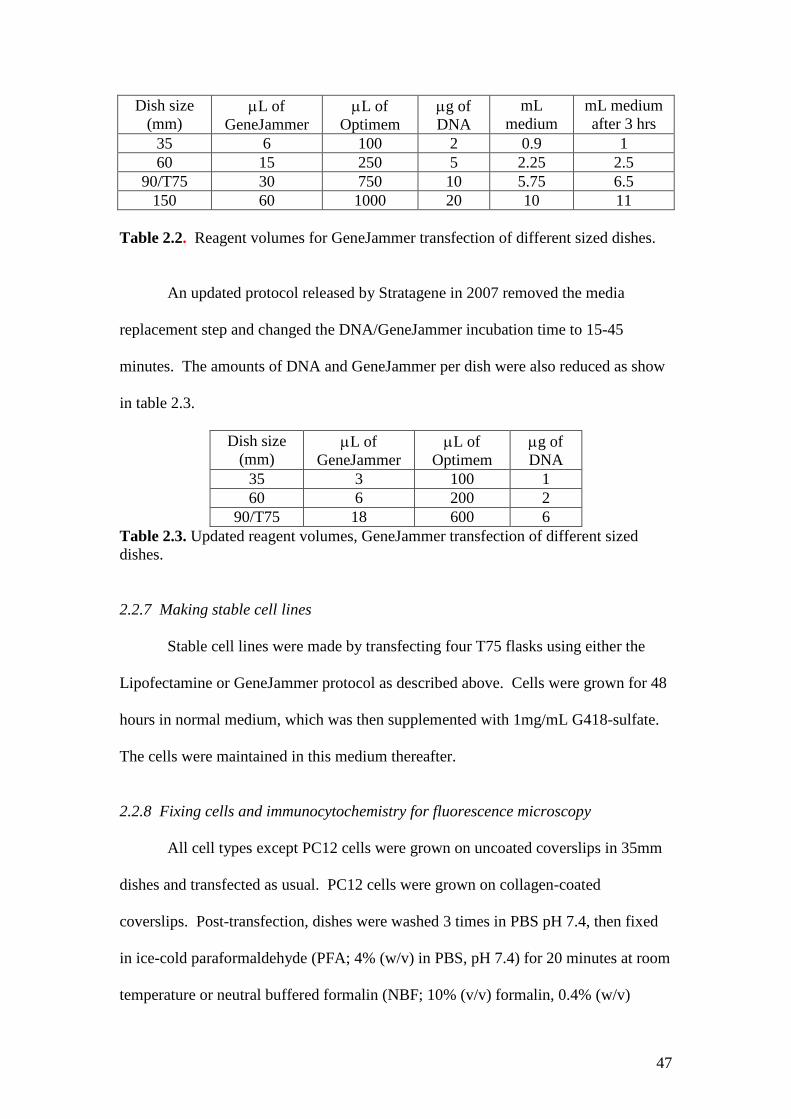
47
Dish size(mm)
L ofGeneJammer
L ofOptimem
g ofDNA
mLmedium
mL mediumafter 3 hrs
35 6 100 2 0.9 160 15 250 5 2.25 2.5
90/T75 30 750 10 5.75 6.5150 60 1000 20 10 11
Table 2.2. Reagent volumes for GeneJammer transfection of different sized dishes.
An updated protocol released by Stratagene in 2007 removed the media
replacement step and changed the DNA/GeneJammer incubation time to 15-45
minutes. The amounts of DNA and GeneJammer per dish were also reduced as show
in table 2.3.
Dish size(mm)
L ofGeneJammer
L ofOptimem
g ofDNA
35 3 100 160 6 200 2
90/T75 18 600 6Table 2.3. Updated reagent volumes, GeneJammer transfection of different sizeddishes.
2.2.7 Making stable cell lines
Stable cell lines were made by transfecting four T75 flasks using either the
Lipofectamine or GeneJammer protocol as described above. Cells were grown for 48
hours in normal medium, which was then supplemented with 1mg/mL G418-sulfate.
The cells were maintained in this medium thereafter.
2.2.8 Fixing cells and immunocytochemistry for fluorescence microscopy
All cell types except PC12 cells were grown on uncoated coverslips in 35mm
dishes and transfected as usual. PC12 cells were grown on collagen-coated
coverslips. Post-transfection, dishes were washed 3 times in PBS pH 7.4, then fixed
in ice-cold paraformaldehyde (PFA; 4% (w/v) in PBS, pH 7.4) for 20 minutes at room
temperature or neutral buffered formalin (NBF; 10% (v/v) formalin, 0.4% (w/v)
48
NaH2PO4.H2O, 0.65% (w/v) Na2HPO4) for 10 minutes at room temperature. They
were then washed three further times and either mounted directly onto glass slides for
fluorescent proteins or used for immunocytochemistry or other labelling. For
phalloidin staining of actin cytoskeleton, cells were permeabilised with 0.2% Triton
X-100 for 10 minutes and washed three times, then phalloidin tagged with Alexa 568
(Molecular Probes/Invitrogen) was added 1/100 in PBS onto the coverslip and
incubated at room temperature in the dark for 15 minutes. For immunocytochemistry,
coverslips were incubated for 1 hour at room temperature in the dark in blocking
reagent and 0.2% Triton X-100 with primary antibody (anti-FLAG-FITC 1:100 in
TBS pH 7.4; anti-FLAG M2 1:100 in 3% BSA; anti-FLAG polyclonal 1:100 in 3%
BSA; pAP9143 1:100 in 3% BSA; anti-neurofascin 1:2000 in 5% fish skin gelatin
PBS). After another 3 washes, coverslips were either mounted directly to glass slides
(for primary antibodies with fluorescent tags) or continued for another incubation for
1 hour at room temperature in the dark in blocking reagent with secondary antibody
conjugated with fluorescent tag (Alexa 568 goat anti-rabbit 1:1000-1:20,000 in 3%
BSA or 5% goat serum; Alexa 568 goat anti-mouse 1:1000-1:10,000 in 3% BSA or
5% goat serum). After the final 3 washes, coverslips were mounted onto glass slides
using Mowiol with DAPI.
2.3 Protein assays and Western blot
2.3.1 Large-scale GST fusion protein production
A 5mL culture of BL21/DE3 E. coli strain, transformed with pGST-Willin,
was grown overnight shaking at 37oC in Luria Broth (LB) supplemented with
100g/mL ampicillin and 34g/mL chloramphenicol. The following morning,
500mL of LB without antibiotics was inoculated with the 5mL overnight culture and
49
grown shaking at 30oC until absorbance at 600nm (A600) was between 0.5-1. At this
point a 1mL sample was taken as a control. Protein production in the remaining
culture was induced by addition of 0.2mM isopropyl--D-thiogalactopyranoside
(IPTG), continuing for three hours shaking at 30oC. A 500L sample was taken at
this point to test for induction. The remaining culture was harvested by centrifugation
at 5000g for ten minutes at 4oC. The pellet was resuspended in 5mL PBS with 1x
Roche protease inhibitor, snap frozen in N2(l), and stored at -70oC until use.
Uninduced and induced samples were centrifuged at 16000g for 1 minute and
resuspended in 50L and 100L of 2x PSB respectively and boiled for SDS-PAGE.
2.3.2 Preparation of glutathione sepharose 4B beads
1.33mL of bead slurry was centrifuged at 2000g for 5 minutes and washed
three times in 10 mL PBS. The final bead pellet was resuspended in 1mL PBS to
make a 50% slurry.
2.3.3 GST protein purification
Frozen pellets were thawed on ice and lysed by sonication in 4 x 30 seconds
bursts with 30 seconds rest on ice between bursts. Triton X-100 was added to a final
concentration of 1% and the lysate tumbled at room temperature for 30 minutes. The
lysate was centrifuged at 12000g for 15 minutes at 4oC and the supernatant added to
the glutathione sepharose bead slurry. This mixture was tumbled at room temperature
for 30 minutes or 4oC for 2 hours. Beads were then washed 4 times with PBS. To
elute pure GST proteins, 0.5mL reduced glutathione (GSH) buffer (0.5mL 1M Tris
pH8.0, 1mL 0.1M GSH, 8.5mL MQ, 0.1% Triton X-100) was added to the beads and
tumbled at room temperature for 10 minutes. Eluate was collected by centrifugation
at 1500g for 5 minutes. Three further elutions were performed and the eluates pooled.

50
Samples were concentrated in a 30,000MW Vivaspin column (Sigma) according to
the manufacturer’s instructions. Protein concentrations were determined by Bradford
assay.
2.3.4 Bradford assay
A mixture consisting of 1L protein sample, 499L MQ and 500L Bradford
Reagent was made and its absorbance at 595nm measured. Concentration of the
sample was determined by comparison with a standard curve created with known
concentrations of BSA.
2.3.5 Small-scale GST induction (for positive control samples)
A 5mL overnight was grown as described for large scale GST production.
The following morning, 50mL LB supplemented with 100g/mL ampicillin and
34g/mL chloramphenicol was inoculated with 100mL of pre-culture and grown
shaking at 37oC until A600 reached 0.3-0.4. Several 1mL samples were taken as an
uninduced control, and the remaining culture induced by addition of 0.2mM IPTG.
Three hours post-induction, 500L aliquots were taken and all samples centrifuged at
16000g for 1 minute. Uninduced samples were resuspended in 50L of 2x protein
sample buffer (PSB; 2% SDS, 20% glycerol, 20mM Tris HCl pH 8.0, 2mM EDTA
pH 8.0, 0.1mg/mL bromophenol blue, 2% -mercaptoethanol) and induced samples
in 100L of 2x PSB, and all were boiled for SDS-PAGE.
2.3.6 Preparation of samples for SDS-PAGE
Mammalian cells were grown in 35, 60 or 90mm dishes and transfected as
required for 24-48 hours. For whole cell extracts, dishes were washed 4x with PBS
and harvested with 50, 100 or 200L (respectively) PBS supplemented with PI. For
RIPA extraction, dishes were washed 4x with PBS, removed with a cell scraper and
51
harvested with 50, 100 or 200L (respectively) of radio-immunoprecipitation assay
(RIPA) buffer (50mM Tris HCl pH 7.4, 1% NP-40, 0.25% Na-deoxycholate, 150mM
NaCl, 1mM EDTA, 1g/mL aprotinin, 1g/mL leupeptin, 1g/mL pepstatin, Roche
protease inhibitor cocktail, 1mM PMSF), then centrifuged for 15 minutes and the
supernatant separated from the pellet. An equal amount of 2x PSB was added and
samples were boiled as usual for SDS-PAGE.
2.3.7 SDS-PAGE
Unless otherwise stated, samples were diluted in 2X protein sample buffer and
boiled for 5-10 minutes. For rat sciatic nerve, hot 2% SDS was added to the nerve,
which was then boiled for 15 minutes, then centrifuged at 16000g for 5 minutes; the
supernatant was removed to a new tube, diluted in 2x protein sample buffer and boiled
for an additional 5 minutes. Pre-cast Invitrogen NuPage 3-8% Tris-Acetate were
prepared according to manufacturer’s instructions with provided Tris-Acetate running
buffer. The desired amount of sample was loaded into lanes with SeeBlue Plus2
molecular weight marker. Gels were run at 150V for 1 hour. After a short period of
use, it was decided that the separation of proteins between 70-100kDa was not as clear
as desired, and thus Tris-Acetate was abandoned and replaced with 4-12% Bis-Tris
gels and provided MOPS or MES running buffer. Bis-Tris gels were run at 200V for
1 hour with MOPS or 35 minutes with MES.
2.3.8 Coomassie staining of SDS-PAGE gels
Gels were stained for 10-20 minutes at room temperature in Coomassie stain
solution (0.1% (w/v) Coomassie brilliant blue R-250, 45% (v/v) methanol, 10% (v/v)
glacial acetic acid). The stain was then removed with multiple changes of destain

52
solution (10% (v/v) glacial acetic acid, 40% (v/v) methanol) for several hours at room
temperature.
2.3.9 Transfer of proteins to nitrocellulose
The Invitrogen NuPage blot module was used to transfer proteins to a
nitrocellulose membrane according to manufacturer’s instructions with provided
transfer buffer supplemented with either 10% methanol for single gel transfer or 20%
methanol for double gel transfer. Transfer was completed at 30V for 1-2 hours and
verified by staining with Ponceau S solution (0.1% Ponceau S (w/v), 5% acetic acid).
Ponceau was washed off with distilled water and Tris-buffered saline (0.05M Tris,
0.138M NaCl, 0.0027M KCl, pH 8.0) with added 0.1% Tween-20 (TBS-T).
2.3.10 Western blotting
Antibody-specific protocols are detailed in appendix 3. In general,
membranes were blocked overnight in 5% (w/v) fat-free powdered milk in TBS-T
either overnight at 4oC or 2 hours at room temperature. The blot was then washed
once in TBS-T and incubated with primary antibody for 1 hour at room temperature in
3% (w/v) fat-free powdered milk in TBS-T. Primary antibody was removed by three
10 minute washes in TBS-T at room temperature. The blot was then incubated with
HRP-conjugated secondary antibody (Santa Cruz or Abcam) in 3% milk TBS-T for 1
hour at room temperature and washed three further times as before. All incubations
and washes were done with rocking. Bands were visualised with SuperSignal West
Pico enhanced chemiluminescence reagent (Pierce) according to the manufacturer’s
instructions.

53
2.3.11 Triton X-100 Solubility Assay
Cells were grown on 90mm dishes and transfected as usual. After 24-48 hours
they were washed two times with PBS and harvested with 200L 1% ice-cold Triton
X-100 (Triton X-100). They were then incubated on ice for 15 minutes to lyse, and
centrifuged at 16,000g for 15 minutes at 4oC. The supernatant (S/N) was transferred
to another tube and the pellet (P) was resuspended in an additional 200L 1% ice-cold
Triton X-100. Both fractions were mixed with 200L 2x PSB and boiled for SDS-
PAGE.
2.3.12 S100/P100 subcellular fractionation
Cells were washed twice with PBS and harvested by centrifugation at 1500g
for 5 minutes at 4oC. They were then resuspended in 5mL hypotonic buffer (20mM
Tris-HCl, 10mM KCl, 1mM EDTA, 1mM DTT, 1% aprotinin, pH 7.4) with 1mM
phenylmethylsulfonyl flouride (PMSF) and incubated on ice for 10 minutes for cells
to swell. Cells were gently lysed by 40 strokes in a Dounce homogeniser and
equilibrated to 125mM NaCl. The lysate was centrifuged at 1500g for 10 minutes at
4oC to remove whole cells and nuclei (P1 fraction), and the supernatant was collected
into Beckman Ultraclear centrifuge tubes to be centrifuged in a SW55Ti rotor at
100,000g for 30 minutes or 1 hour at 4oC. The supernatant (S100) was incubated with
4 volumes of ice-cold acetone for 45 minutes to precipitate soluble proteins. The
pellet was resuspended in 200L 1% ice-cold Triton X-100 and incubated on ice for
15 minutes, then centrifuged at 16,000g for 15 minutes at 4oC. The Triton-soluble
supernatant (P100s) was removed and mixed with 200L 2x PSB, while the Triton-
insoluble pellet (P100i) was resuspended in 200L 1% Triton X-100 and 200L 2x

54
PSB. The P1 fraction was also resuspended in 200L 1% Triton X-100 and 200L 2x
PSB, and all samples were boiled for ten minutes.
2.3.13 Optiprep Density Gradient Fractionation
Optiprep Fractionation for separation of lipid rafts was carried out as described
in Stickney et. al., 2004. COS-7 and HEK-293 cells were grown on 35mm dishes and
transfected with pWillin-GFP, pMerlin1-GFP, pGFP-Ezrin or pcDNA3
neurofascin155. After 24-48 hours, cells were washed two times with TBS and
harvested with 267L of chilled optibuffer (50mM Tris pH 7.5, 150mM NaCl, 1mM
DTT, 1mM PMSF, 1 tablet PI, 1% Triton X-100, 10% sucrose), then left on ice for
thirty minutes to lyse. Additional lysis was achieved by freeze-thawing at -20oC. To
make the 40% fraction, 533mL of 60% Optiprep (Sigma) was added to the lysate and
mixed well in a 5mL Ultraclear centrifuge tube (Beckman). Fractions 35%-20% were
made by diluting 60% stock with appropriate amounts of optibuffer, and 800L of
each were overlaid in the centrifuge tube. Samples were centrifuged at 100,000g for
at least 16 hours at 4oC, forming a continuous gradient that was separated by
removing 800L fractions into 1.5mL Eppendorf tubes. Samples were then prepared
as usual for SDS-PAGE and Western blotting. Lipid rafts floated to 20% and 25%
fractions.
2.3.14 Actin binding biochem kit protocol
Actin binding experiment was performed as described by the manufacturer
(Cytoskeleton). GST-tagged protein was purified and concentrated as described in
section 2.3.3 to a concentration of at least 20mM for maximum likelihood of binding.
All other reagents were provided in the kit unless otherwise specified. A 250g
aliquot of actin was thawed and resuspended in General Actin Buffer and left on ice

55
for 30 minutes, at which point 25L of Actin Polymerisation Buffer was added and
the mixture left to incubate at room temperature for 1 hour to make the 23M F-actin
stock. Meanwhile, GST-tagged test protein was centrifuged at 150,000g for 1 hour at
24oC and the supernatant kept. 1mL of F-actin buffer was made with 900L General
Actin Buffer and 100L of Actin Polymerisation Buffer and put on ice. Centrifuge
tubes were labelled 1a, 1,2,3 and 4 and the tubes were filled as shown in Table 2.4.
1 40L F-actin buffer 10L test protein2 40L F-actin stock "3 " 8L F-actin buffer + 1L -actinin + 1L Tris-HCl pH 7.04 " 8L F-actin buffer + 1L BSA or GST
Table 2.4. Experimental setup for actin binding kit protocol. Tubes 1, 3 and 4 werecontrols.
These were then incubated at room temperature for 30 minutes. This was followed by
a centrifugation at 150,000g for 1.5 hours at 24oC. The supernatants were separated
and supplemented with user-supplied 10L 5X PSB; pellets were resuspended in
user-supplied 30L 2X PSB and all samples were prepared for SDS-PAGE as usual.
The gel was stained with Coomassie stain and the bands interpreted according to
manufacturer’s instructions.
2.3.15 Tandem Affinity Purification - Stratagene
HEK-293 cells were grown on a 150mm dish as instructed by the
manufacturer to obtain sufficient protein for Western blot analysis. Cells were then
transfected with 10g Willin-CTAP A and left to express for 48 hours. Tandem
affinity purification was performed according to the manufacturer’s instructions. Test
aliquots were taken at various sample points and all samples were boiled in 2X
protein sample buffer and used for SDS-PAGE and Western blotting as usual.
56
2.3.16 Tandem Affinity Purification – pCMV5/TAP
HEK-293 cells were grown on ten 150mm dishes and transfected as usual with
10g pWillin-FLAG or pFLAG-Ezrin and 10g of either pCMV5/TAP (NTAP) or
pCMV5/TAP-neurofascin155 (NTAPNF). pCMV5/TAP inserts a tandem affinity
purification tag to the N-terminus of neurofascin155, and was a kind gift from
Professor Ron Hay (University of Dundee). 36 hours post-transfection, dishes were
washed twice with PBS and harvested in 10mL PBS by centrifugation at 1500g for 5
minutes at 4oC. Cells were resuspended in lysis buffer (50mM Tris-HCl pH 7.4,
150mM NaCl, 1mM EDTA pH 7.4, 1% NP-40, 15% glycerol, 1X protease inhibitor,
1mM PMSF) and tumbled at 4oC for 30 minutes. These were then centrifuged at
14000g for 5 minutes at 4oC and the supernatants pooled, with a 250L aliquot taken
as the input sample. 200L of Rabbit IgG bead slurry was added to the lysate and the
mixture tumbled at 4oC for 2 hours, then centrifuged at 2000rpm in a benchtop
centrifuge for 1 minute at 4oC. An aliquot was taken of the supernatant before it was
discarded and the beads washed 3 times with 10mL TBS pH 7.4 0.05% Tween, then
twice more with 500L TEV cleavage buffer (10mM Tris-HCl pH 8.0, 150mM NaCl,
0.1% NP-40, 0.5mM EDTA pH 8.0, 1mM DTT) and the mixture was moved to a
1.5mL tube. After another spin, beads were resuspended in 200L TEV cleavage
buffer with 5L TEV protease (Invitrogen) and tumbled overnight at 4oC.
The following day, the tube was centrifuged at 2000rpm for 1 minute at 4oC and the
supernatant kept, and a second elution with 200L TEV cleavage buffer done.
Supernatants were kept both times and an aliquot taken, and 0.6L of 1M CaCl2 per
200L of supernatant was added. Meanwhile, 40L of calmodulin resin slurry was
aliquoted and washed twice with 1mL calmodulin binding buffer (CBB: 10mM -
mercaptoethanol, 10mM Tris-HCl pH 8.0, 150mM NaCl, 1mM Mg-acetate, 1mM

57
imidazole, 2mM CaCl2, 0.1% NP-40) and resuspended in 20L CBB. 3 volumes of
CBB were added to the TEV-cleaved supernatant, the mixture was added to the
calmodulin resin, and tumbled at 4oC for 2 hours. This was then centrifuged at
2000rpm for 2 minutes at 4oC and the supernatant discarded. Beads were washed 5
times with 1mL CBB. Purified proteins were eluted 4 times with 50mL calmodulin
elution buffer (CEB: 10mM -mercaptoethanol, 10mM Tris-HCl pH 8.0, 150mM
NaCl, 1mM Mg-acetate, 1mM imidazole, 2mM EGTA, 0.1% NP-40), then 1 time
with Extra buffer (50mM Tris-HCl pH 8.0, 2mM EGTA, 1M NaCl), centrifuging at
14000g for 10 seconds each time. To ensure all proteins were accounted for, the
calmodulin beads were then boiled for 5 minutes in PSB and centrifuged at maximum
speed for 15 seconds, with the supernatant containing any protein that may have
remained bound to the beads. All samples were prepared for SDS-PAGE and
Western blot as usual. A shortened protocol was also used which stopped after TEV
protease cleavage, and the rabbit IgG beads were boiled instead of the calmodulin
beads; this protocol was used to minimise protein loss caused by the second
purification step.
2.3.17 GST Pulldown
HEK-293 cells were cultured on two 90mm dishes and transfected with
pcDNA3 neurofascin155 for 48 hours, then washed twice with PBS and harvested
with 500mL RIPA extraction buffer. The cells were then sonicated 4 x 30 seconds.
Glutathione sepharose 4B beads were separated into two 37.5L aliquots and one
75L aliquot and washed 3 times with RIPA extraction buffer. The cell lysate was
added to the 75mL aliquot as a pre-clearing step, and 10g of purified GST were
added to one 37.5L aliquot while 10g of purified GST-Willin were added to the

58
other, and 250L of RIPA were added to both. All three aliquots were rotated
overnight at 4oC. The following day, the cell lysate fraction was centrifuged at
16000g for 20 seconds, leaving a cleared cell lysate, from which an input sample was
taken before being split into 2 x 250L aliquots. The GST- and GST-Willin-
conjugated beads were centrifuged at 2000rpm for 1 minute and one 250L aliquot of
the cleared lysate was added to each tube of beads. These were then rotated for 2
hours at 4oC and centrifuged at 2000rpm for 1 minute. The beads were washed 5
times with 50L RIPA and 5 times with 50L PBS, then boiled in 2X PSB and
centrifuged at maximum speed for 1 minute. The supernatant was kept as the final
sample. Input and final samples were prepared for SDS-PAGE and Western blotting
as usual.
2.3.18 Immunoprecipiation with monoclonal FLAG antibody and protein A
FLAG immunoprecipitation was carried out as described in Crawford et
al.(2005). HEK-293 cells were grown on 90mm dishes and co-transfected with
pcDNA3 neurofascin155 and either pWillin-FLAG or empty FLAG vector. After 2
PBS washes, cells were harvested in 1mL IP buffer (50mM NaF, 50mM Tris-HCl,
150mM NaCl, 1mM NaPPi, 1mM EDTA, 1mM EGTA, pH 6.8; 1mM DTT and
protease inhibitors added just before use) and sonicated 3 X 20 seconds. FLAG M2
monoclonal antibody (Sigma) was conjugated with Protein A from Staphylococcus
aureus immobilised on polyacrylic beads and tumbled with 500L IP buffer and 100-
200L whole cell lysate at room temperature for 2 hours. The beads were then
washed 3 times in IP buffer brought up to 1M NaCl and centrifuged at 16,000g for 45
seconds after each wash, and again 3 times in normal IP buffer; with all washes, the
pellet was not disturbed. The entire bead-protein complex was then resuspended in a

59
loading volume of IP buffer and protein sample buffer and heated at 70oC for 10
minutes, then loaded as usual for Western blotting.
2.4 Yeast two-hybrid
2.4.1 Media for yeast growth
Untransfected Y190 were grown in YPAD 1% (w/v) yeast extract (Difco), 2%
(w/v) peptone (Difco), 2% (w/v) glucose, 0.01% (w/v) adenine hemisulfate) medium
or YPAD agar plates. Transfected Y190 were grown in omission liquid medium
(0.67% (w/v) Yeast nitrogen base without amino acids (Difco), 2% (w/v) glucose,
0.067% synthetic dropout mix) or omission medium agar plates. Synthetic dropout
mix included all of the following amino acids excluding the amino acid(s) being
selected for: 2.0g adenine hemisulfate, 2.0g arginine-HCl, 2.0g histidine-HCl, 2.0g
isoleucine, 4.0g leucine, 2.0g lysine-HCl, 2.0g methionine, 3.0g phenylalanine, 2.0g
serine, 2.0g threonine, 3.0g tryptophan, 2.0g tyrosine, 1.2g uracil and 9.0g valine.
Glycerol stocks of Y190 were prepared from overnight cultures of Y190 grown in
YPAD. 600L of culture was mixed with 400L of 50% sterile glycerol and stored at
-70oC.
2.4.2 LiAc transformation
The lithium acetate/single-stranded carrier DNA/polyethylene glycol
(LiAc/ssDNA/PEG) transformation protocol developed by the Gietz laboratory
(Agatep et al, 1998) was used to transform Y190. A YPAD plate was streaked with
the Y190 glycerol stock and grown for 2-3 days at 30oC. From this plate, 3-4 colonies
were used to inoculate 5mL of YPAD liquid medium, grown overnight at 30oC with
shaking. The following morning, 2.5 x 10⁸ cells were inoculated into 50mL YPAD

60
medium and grown to a titre of 2 x 10⁷ cells per mL. They were then harvested by
centrifugation at 3000g for 5 minutes at room temperature. They were washed in
25mL sterile distilled water and centrifuged again. Cells were now resuspended in
1mL 0.1M LiAc and moved to a 1.5mL microcentrifuge tube, where it was
centrifuged again at maximum speed for 15 seconds. The pellet was again
resuspended in 400L 0.1M LiAc and divided into the required number of 50L
aliquots in fresh 1.5mL tubes. Aliquots were centrifuged again at maximum speed for
15 seconds and resuspended by vortexing for ~1 minute in transformation mix added
in the following order: 240L PEG (50% polyethylene glycol 3350, filter sterilised),
36L 1M LiAc, 50L (10g) ssDNA, sterile distilled water, pAS2-1 bait (1g) and
pACT2 contruct (1g). This mixture was incubated at 30oC for 30 minutes, then heat
shocked in a water bath at 42oC for 30 minutes and pelleted at 7000g and gently
resuspended in 1mL sterile distilled water. 200L of cell suspension was plated onto
an omission plate lacking tryptophan and leucine (Trp-Leu-) and grown at 30oC for 3-
4 days.
The overnight culture was also used to prepare a Y190 glycerol stock. This
was made with 600L of culture and 400L of sterile 50% glycerol and stored at -
70oC.
2.4.3 Filter lift assay
Positive interaction between proteins was tested for by-galactosidase activity
as described by Parchaliuk (1999). Sterile 7.5cm diameter Whatman grade 1 paper
was soaked in a solution of 10mL Z buffer (60mM Na2HPO4.7H2O, 40mM
NaH2PO4.H2O, 10mM KCl, 1mM MgSO4
.7H2O, pH 7.0), 0.5mL of 20mg/mL 5-
bromo-4-chloro-3-indolyl-D-galactopyranoside (X-gal) in N,N-dimethylformamide
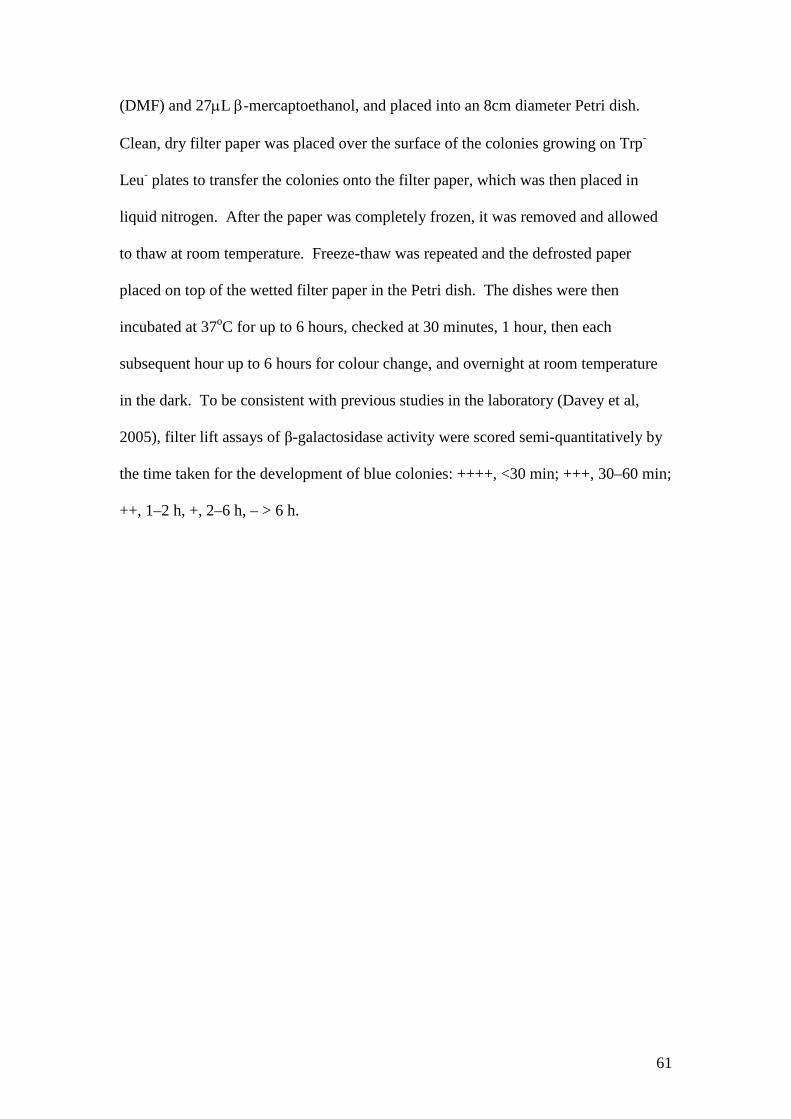
61
(DMF) and 27L -mercaptoethanol, and placed into an 8cm diameter Petri dish.
Clean, dry filter paper was placed over the surface of the colonies growing on Trp-
Leu- plates to transfer the colonies onto the filter paper, which was then placed in
liquid nitrogen. After the paper was completely frozen, it was removed and allowed
to thaw at room temperature. Freeze-thaw was repeated and the defrosted paper
placed on top of the wetted filter paper in the Petri dish. The dishes were then
incubated at 37oC for up to 6 hours, checked at 30 minutes, 1 hour, then each
subsequent hour up to 6 hours for colour change, and overnight at room temperature
in the dark. To be consistent with previous studies in the laboratory (Davey et al,
2005), filter lift assays of β-galactosidase activity were scored semi-quantitatively by
the time taken for the development of blue colonies: ++++, <30 min; +++, 30–60 min;
++, 1–2 h, +, 2–6 h, – > 6 h.

62
CHAPTER 3: CHARACTERISATION OF
NOVEL ANTIBODIES TO WILLIN
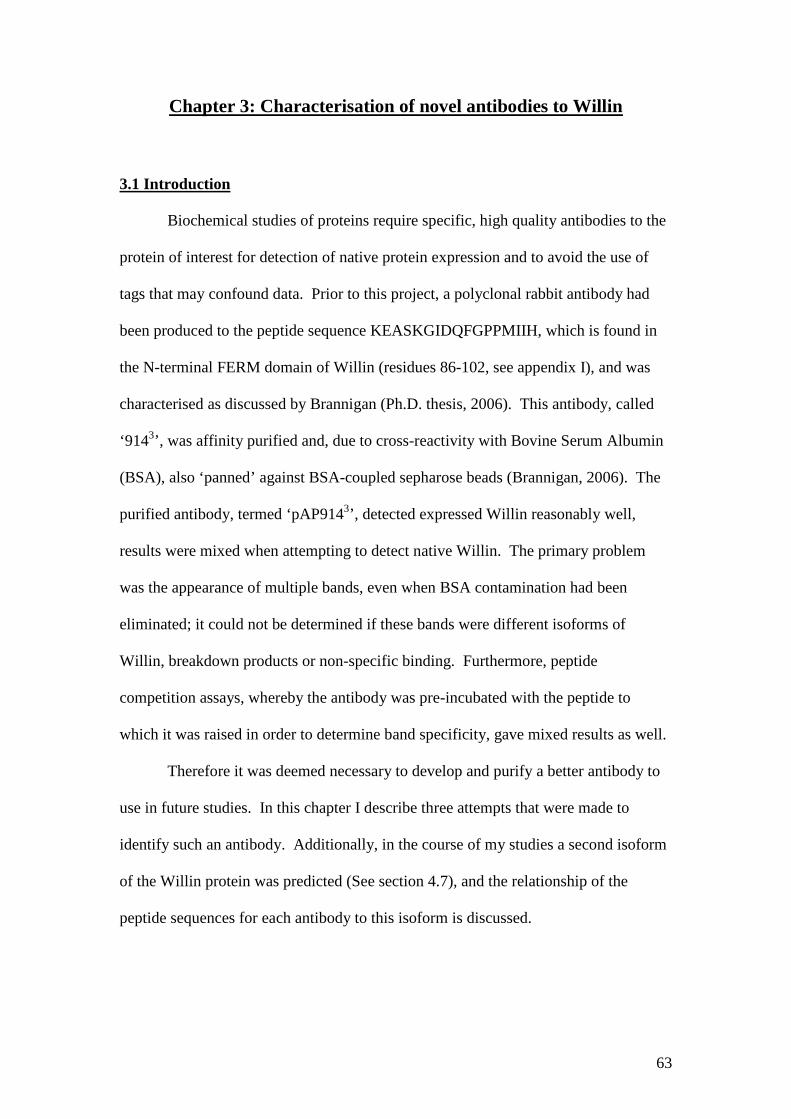
63
Chapter 3: Characterisation of novel antibodies to Willin
3.1 Introduction
Biochemical studies of proteins require specific, high quality antibodies to the
protein of interest for detection of native protein expression and to avoid the use of
tags that may confound data. Prior to this project, a polyclonal rabbit antibody had
been produced to the peptide sequence KEASKGIDQFGPPMIIH, which is found in
the N-terminal FERM domain of Willin (residues 86-102, see appendix I), and was
characterised as discussed by Brannigan (Ph.D. thesis, 2006). This antibody, called
‘9143’, was affinity purified and, due to cross-reactivity with Bovine Serum Albumin
(BSA), also ‘panned’ against BSA-coupled sepharose beads (Brannigan, 2006). The
purified antibody, termed ‘pAP9143’, detected expressed Willin reasonably well,
results were mixed when attempting to detect native Willin. The primary problem
was the appearance of multiple bands, even when BSA contamination had been
eliminated; it could not be determined if these bands were different isoforms of
Willin, breakdown products or non-specific binding. Furthermore, peptide
competition assays, whereby the antibody was pre-incubated with the peptide to
which it was raised in order to determine band specificity, gave mixed results as well.
Therefore it was deemed necessary to develop and purify a better antibody to
use in future studies. In this chapter I describe three attempts that were made to
identify such an antibody. Additionally, in the course of my studies a second isoform
of the Willin protein was predicted (See section 4.7), and the relationship of the
peptide sequences for each antibody to this isoform is discussed.
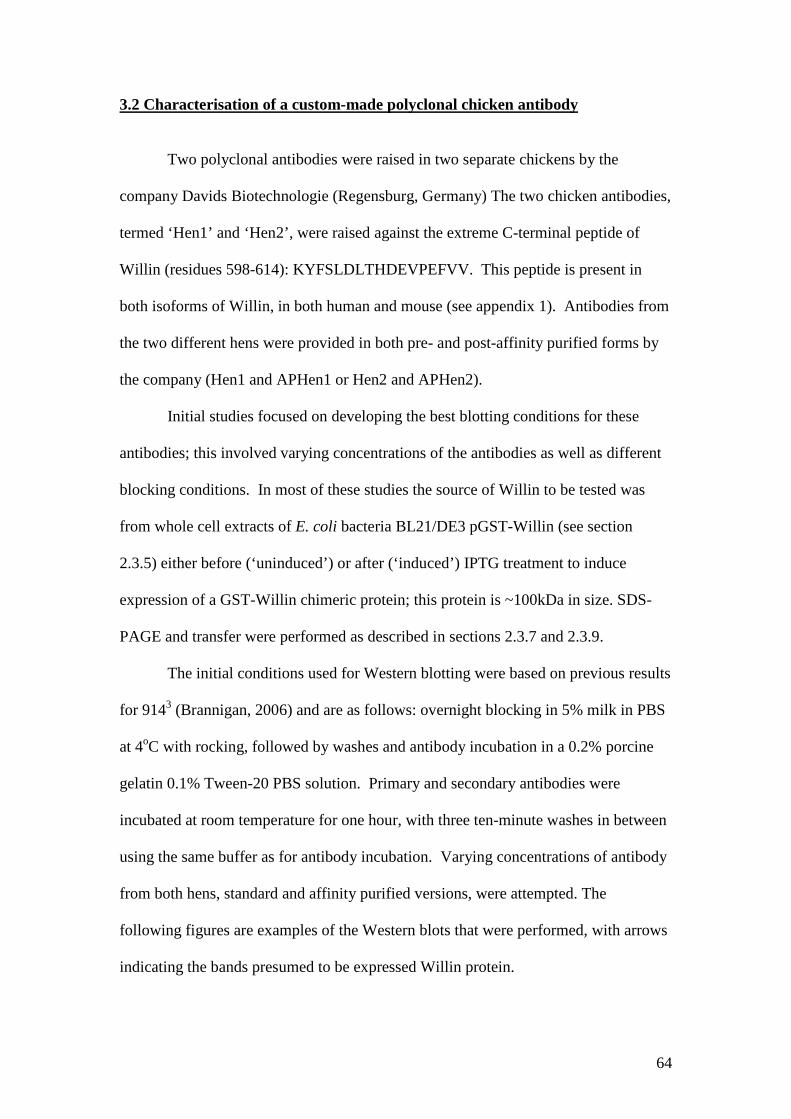
64
3.2 Characterisation of a custom-made polyclonal chicken antibody
Two polyclonal antibodies were raised in two separate chickens by the
company Davids Biotechnologie (Regensburg, Germany) The two chicken antibodies,
termed ‘Hen1’ and ‘Hen2’, were raised against the extreme C-terminal peptide of
Willin (residues 598-614): KYFSLDLTHDEVPEFVV. This peptide is present in
both isoforms of Willin, in both human and mouse (see appendix 1). Antibodies from
the two different hens were provided in both pre- and post-affinity purified forms by
the company (Hen1 and APHen1 or Hen2 and APHen2).
Initial studies focused on developing the best blotting conditions for these
antibodies; this involved varying concentrations of the antibodies as well as different
blocking conditions. In most of these studies the source of Willin to be tested was
from whole cell extracts of E. coli bacteria BL21/DE3 pGST-Willin (see section
2.3.5) either before (‘uninduced’) or after (‘induced’) IPTG treatment to induce
expression of a GST-Willin chimeric protein; this protein is ~100kDa in size. SDS-
PAGE and transfer were performed as described in sections 2.3.7 and 2.3.9.
The initial conditions used for Western blotting were based on previous results
for 9143 (Brannigan, 2006) and are as follows: overnight blocking in 5% milk in PBS
at 4oC with rocking, followed by washes and antibody incubation in a 0.2% porcine
gelatin 0.1% Tween-20 PBS solution. Primary and secondary antibodies were
incubated at room temperature for one hour, with three ten-minute washes in between
using the same buffer as for antibody incubation. Varying concentrations of antibody
from both hens, standard and affinity purified versions, were attempted. The
following figures are examples of the Western blots that were performed, with arrows
indicating the bands presumed to be expressed Willin protein.
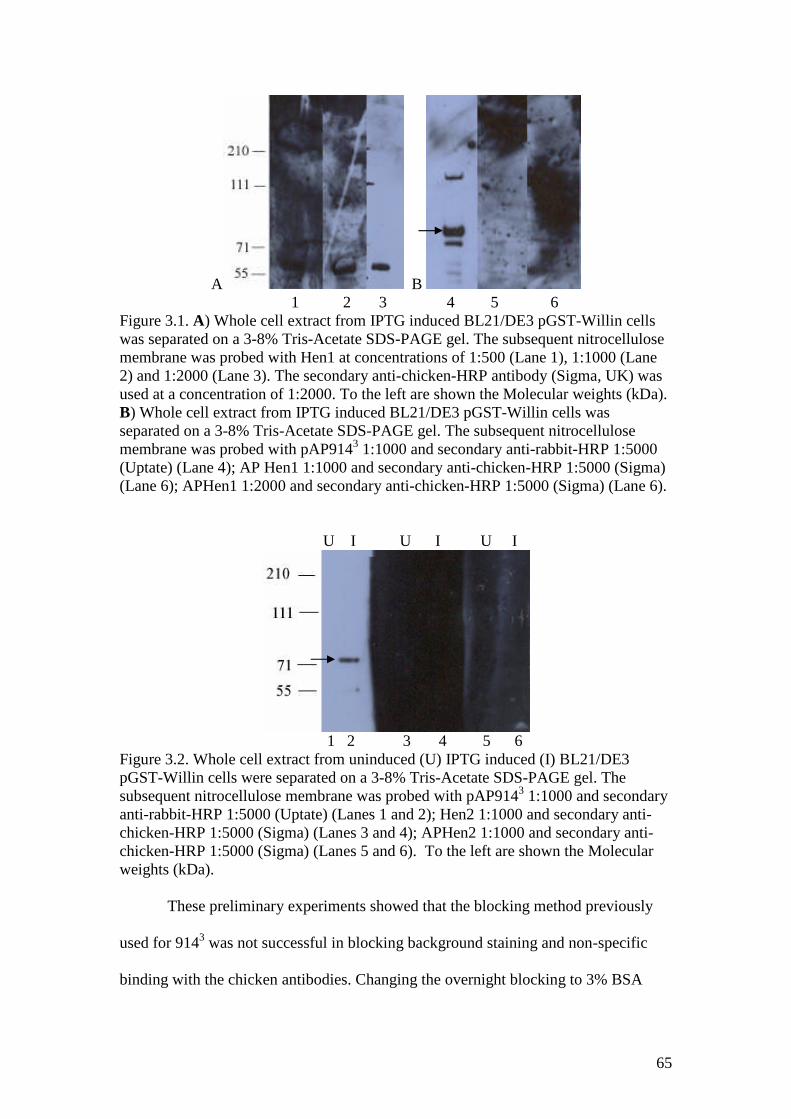
65
A B1 2 3 4 5 6
Figure 3.1. A) Whole cell extract from IPTG induced BL21/DE3 pGST-Willin cellswas separated on a 3-8% Tris-Acetate SDS-PAGE gel. The subsequent nitrocellulosemembrane was probed with Hen1 at concentrations of 1:500 (Lane 1), 1:1000 (Lane2) and 1:2000 (Lane 3). The secondary anti-chicken-HRP antibody (Sigma, UK) wasused at a concentration of 1:2000. To the left are shown the Molecular weights (kDa).B) Whole cell extract from IPTG induced BL21/DE3 pGST-Willin cells wasseparated on a 3-8% Tris-Acetate SDS-PAGE gel. The subsequent nitrocellulosemembrane was probed with pAP9143 1:1000 and secondary anti-rabbit-HRP 1:5000(Uptate) (Lane 4); AP Hen1 1:1000 and secondary anti-chicken-HRP 1:5000 (Sigma)(Lane 6); APHen1 1:2000 and secondary anti-chicken-HRP 1:5000 (Sigma) (Lane 6).
U I U I U I
1 2 3 4 5 6Figure 3.2. Whole cell extract from uninduced (U) IPTG induced (I) BL21/DE3pGST-Willin cells were separated on a 3-8% Tris-Acetate SDS-PAGE gel. Thesubsequent nitrocellulose membrane was probed with pAP9143 1:1000 and secondaryanti-rabbit-HRP 1:5000 (Uptate) (Lanes 1 and 2); Hen2 1:1000 and secondary anti-chicken-HRP 1:5000 (Sigma) (Lanes 3 and 4); APHen2 1:1000 and secondary anti-chicken-HRP 1:5000 (Sigma) (Lanes 5 and 6). To the left are shown the Molecularweights (kDa).
These preliminary experiments showed that the blocking method previously
used for 9143 was not successful in blocking background staining and non-specific
binding with the chicken antibodies. Changing the overnight blocking to 3% BSA
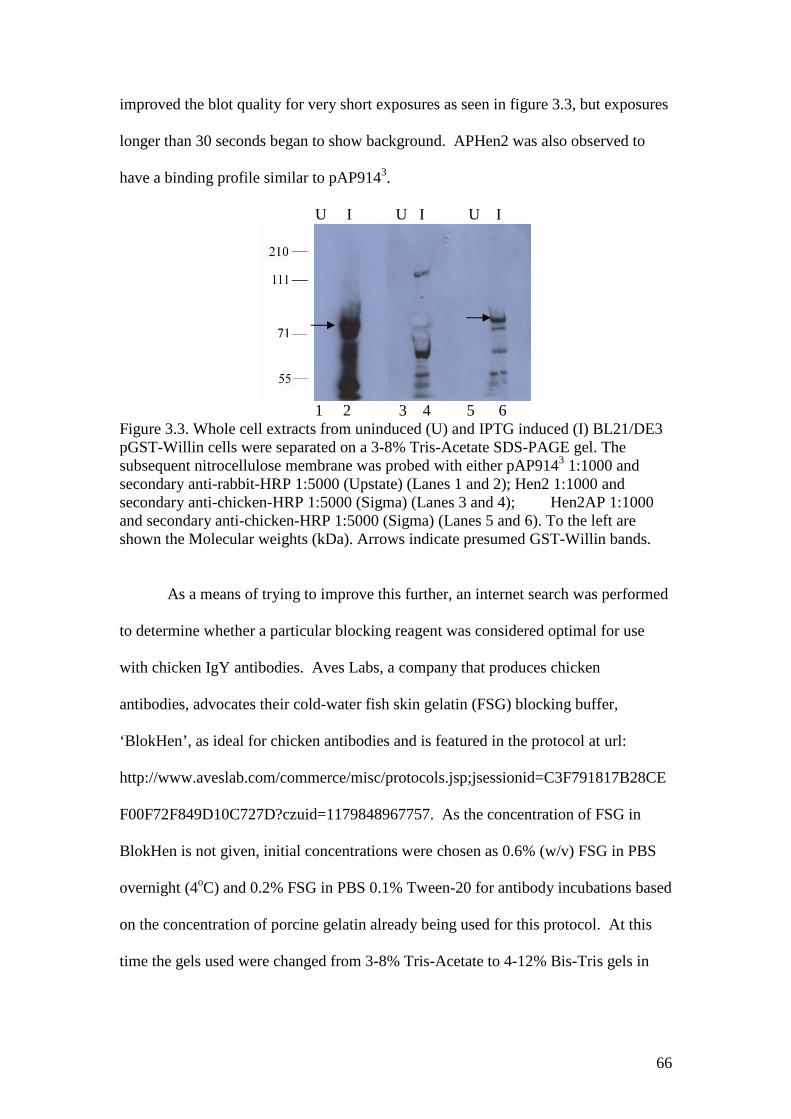
66
improved the blot quality for very short exposures as seen in figure 3.3, but exposures
longer than 30 seconds began to show background. APHen2 was also observed to
have a binding profile similar to pAP9143.
U I U I U I
1 2 3 4 5 6Figure 3.3. Whole cell extracts from uninduced (U) and IPTG induced (I) BL21/DE3pGST-Willin cells were separated on a 3-8% Tris-Acetate SDS-PAGE gel. Thesubsequent nitrocellulose membrane was probed with either pAP9143 1:1000 andsecondary anti-rabbit-HRP 1:5000 (Upstate) (Lanes 1 and 2); Hen2 1:1000 andsecondary anti-chicken-HRP 1:5000 (Sigma) (Lanes 3 and 4); Hen2AP 1:1000and secondary anti-chicken-HRP 1:5000 (Sigma) (Lanes 5 and 6). To the left areshown the Molecular weights (kDa). Arrows indicate presumed GST-Willin bands.
As a means of trying to improve this further, an internet search was performed
to determine whether a particular blocking reagent was considered optimal for use
with chicken IgY antibodies. Aves Labs, a company that produces chicken
antibodies, advocates their cold-water fish skin gelatin (FSG) blocking buffer,
‘BlokHen’, as ideal for chicken antibodies and is featured in the protocol at url:
http://www.aveslab.com/commerce/misc/protocols.jsp;jsessionid=C3F791817B28CE
F00F72F849D10C727D?czuid=1179848967757. As the concentration of FSG in
BlokHen is not given, initial concentrations were chosen as 0.6% (w/v) FSG in PBS
overnight (4oC) and 0.2% FSG in PBS 0.1% Tween-20 for antibody incubations based
on the concentration of porcine gelatin already being used for this protocol. At this
time the gels used were changed from 3-8% Tris-Acetate to 4-12% Bis-Tris gels in
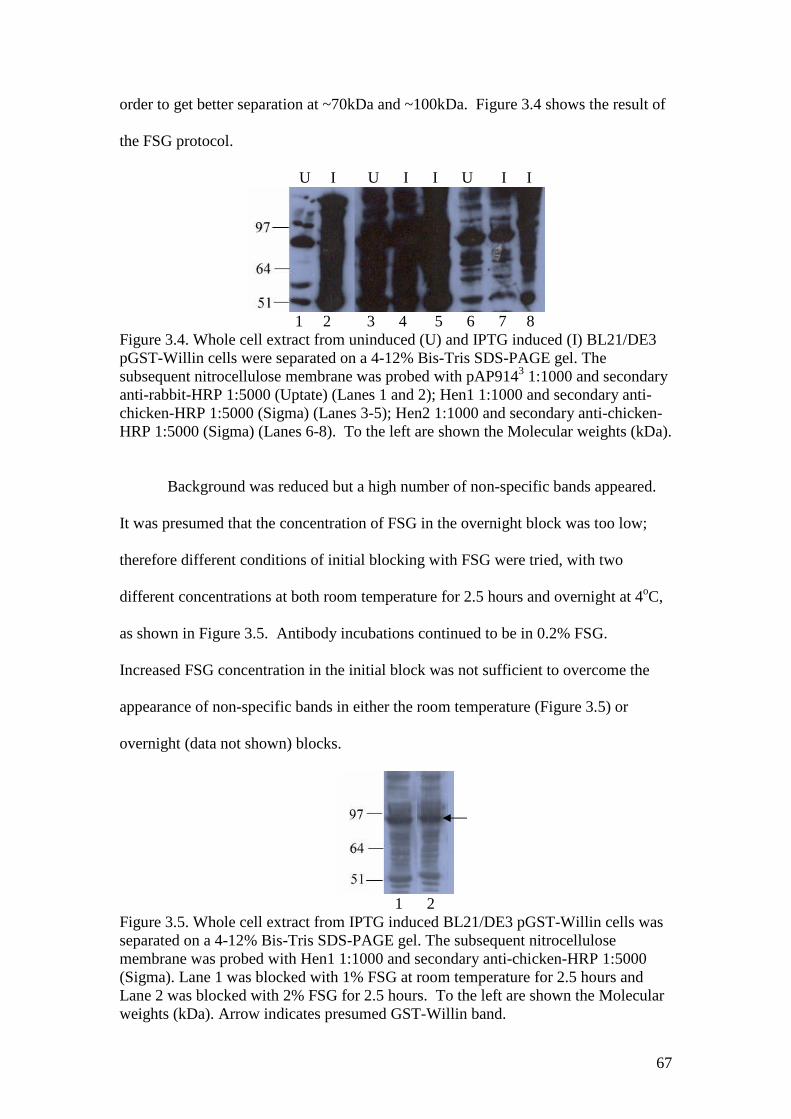
67
order to get better separation at ~70kDa and ~100kDa. Figure 3.4 shows the result of
the FSG protocol.
U I U I I U I I
1 2 3 4 5 6 7 8Figure 3.4. Whole cell extract from uninduced (U) and IPTG induced (I) BL21/DE3pGST-Willin cells were separated on a 4-12% Bis-Tris SDS-PAGE gel. Thesubsequent nitrocellulose membrane was probed with pAP9143 1:1000 and secondaryanti-rabbit-HRP 1:5000 (Uptate) (Lanes 1 and 2); Hen1 1:1000 and secondary anti-chicken-HRP 1:5000 (Sigma) (Lanes 3-5); Hen2 1:1000 and secondary anti-chicken-HRP 1:5000 (Sigma) (Lanes 6-8). To the left are shown the Molecular weights (kDa).
Background was reduced but a high number of non-specific bands appeared.
It was presumed that the concentration of FSG in the overnight block was too low;
therefore different conditions of initial blocking with FSG were tried, with two
different concentrations at both room temperature for 2.5 hours and overnight at 4oC,
as shown in Figure 3.5. Antibody incubations continued to be in 0.2% FSG.
Increased FSG concentration in the initial block was not sufficient to overcome the
appearance of non-specific bands in either the room temperature (Figure 3.5) or
overnight (data not shown) blocks.
1 2Figure 3.5. Whole cell extract from IPTG induced BL21/DE3 pGST-Willin cells wasseparated on a 4-12% Bis-Tris SDS-PAGE gel. The subsequent nitrocellulosemembrane was probed with Hen1 1:1000 and secondary anti-chicken-HRP 1:5000(Sigma). Lane 1 was blocked with 1% FSG at room temperature for 2.5 hours andLane 2 was blocked with 2% FSG for 2.5 hours. To the left are shown the Molecularweights (kDa). Arrow indicates presumed GST-Willin band.

68
As FSG still did not provide the desired result, 5% milk was again used for
blocking overnight, with 0.2% FSG still used during antibody incubation. In addition,
the concentration of primary antibody was reduced from 1:1000 to 1:2000 in the hope
of reducing non-specific binding. This method proved more successful, with fewer
bands appearing as shown in Figure 3.6. Unfortunately, the non-affinity purified
chicken antibodies did not appear to detect the induced GST-Willin as the pAP9143
control did.
U I U I U I
1 2 3 4 5 6Figure 3.6. Whole cell extract from uninduced (U) and IPTG induced (I) BL21/DE3pGST-Willin cells were separated on a 4-12% Bis-Tris SDS-PAGE gel. Thesubsequent nitrocellulose membrane was probed with pAP9143 1:1000 and secondaryanti-rabbit-HRP 1:5000 (Upstate) (Lanes 1 and 2); Hen1 1:2000 and secondary anti-chicken-HRP 1:5000 (Sigma) (Lanes 3 and 4); Hen2 1:2000 and secondary anti-chicken-HRP 1:5000 (Sigma) (Lanes 5 and 6). To the left are shown the Molecularweights (kDa). Arrow indicates presumed GST-Willin band.
APHen1 and APHen2 were then tested under the same blocking conditions,
and APHen2 did detect a band of the same size to that detected by pAP9143 (Figure
3.7).
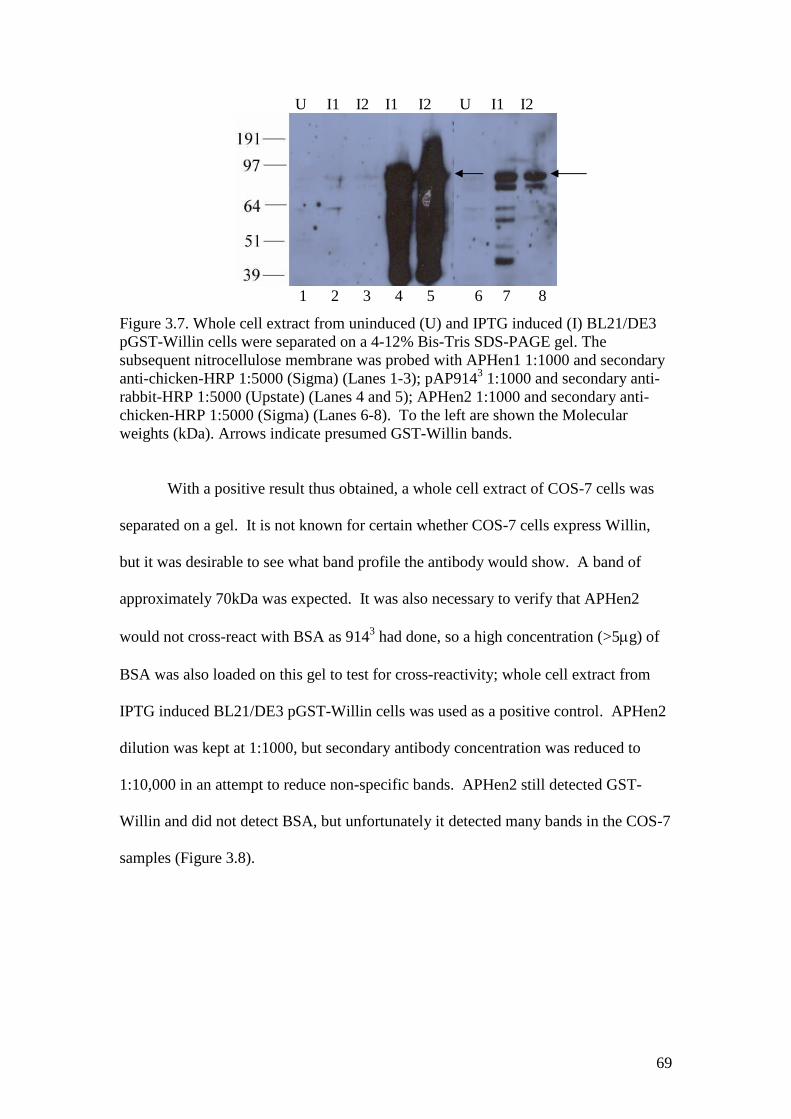
69
U I1 I2 I1 I2 U I1 I2
1 2 3 4 5 6 7 8
Figure 3.7. Whole cell extract from uninduced (U) and IPTG induced (I) BL21/DE3pGST-Willin cells were separated on a 4-12% Bis-Tris SDS-PAGE gel. Thesubsequent nitrocellulose membrane was probed with APHen1 1:1000 and secondaryanti-chicken-HRP 1:5000 (Sigma) (Lanes 1-3); pAP9143 1:1000 and secondary anti-rabbit-HRP 1:5000 (Upstate) (Lanes 4 and 5); APHen2 1:1000 and secondary anti-chicken-HRP 1:5000 (Sigma) (Lanes 6-8). To the left are shown the Molecularweights (kDa). Arrows indicate presumed GST-Willin bands.
With a positive result thus obtained, a whole cell extract of COS-7 cells was
separated on a gel. It is not known for certain whether COS-7 cells express Willin,
but it was desirable to see what band profile the antibody would show. A band of
approximately 70kDa was expected. It was also necessary to verify that APHen2
would not cross-react with BSA as 9143 had done, so a high concentration (>5g) of
BSA was also loaded on this gel to test for cross-reactivity; whole cell extract from
IPTG induced BL21/DE3 pGST-Willin cells was used as a positive control. APHen2
dilution was kept at 1:1000, but secondary antibody concentration was reduced to
1:10,000 in an attempt to reduce non-specific bands. APHen2 still detected GST-
Willin and did not detect BSA, but unfortunately it detected many bands in the COS-7
samples (Figure 3.8).
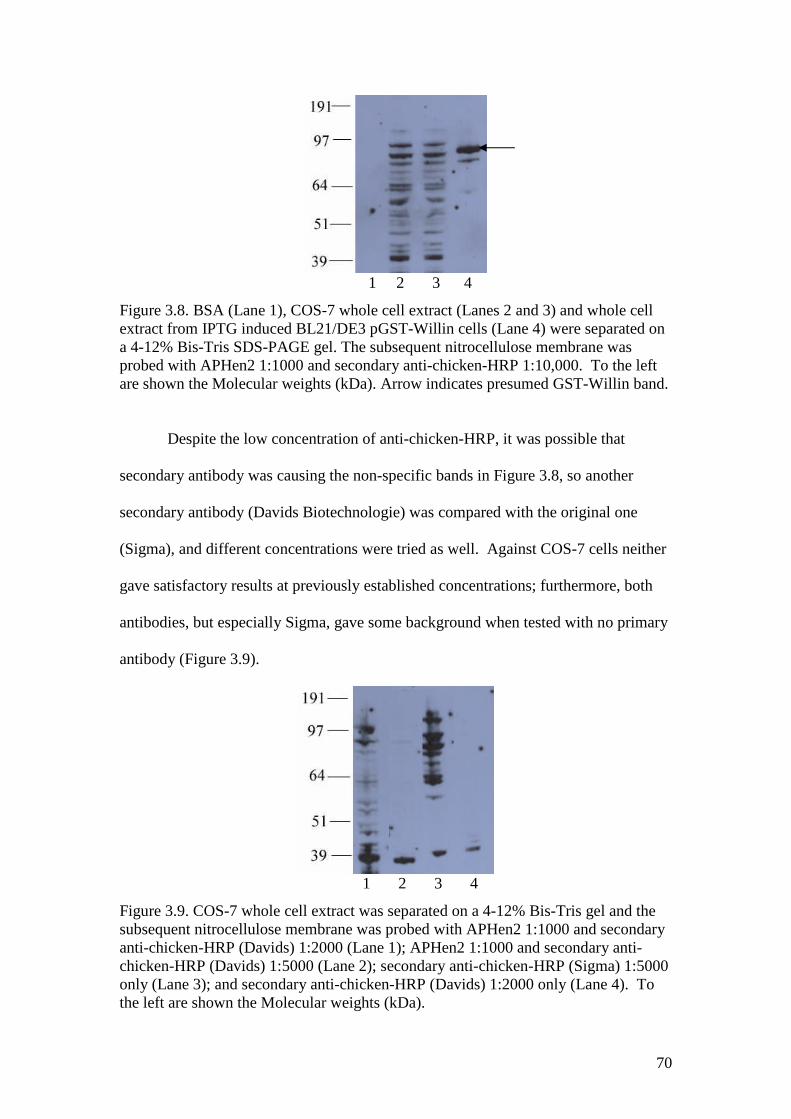
70
1 2 3 4
Figure 3.8. BSA (Lane 1), COS-7 whole cell extract (Lanes 2 and 3) and whole cellextract from IPTG induced BL21/DE3 pGST-Willin cells (Lane 4) were separated ona 4-12% Bis-Tris SDS-PAGE gel. The subsequent nitrocellulose membrane wasprobed with APHen2 1:1000 and secondary anti-chicken-HRP 1:10,000. To the leftare shown the Molecular weights (kDa). Arrow indicates presumed GST-Willin band.
Despite the low concentration of anti-chicken-HRP, it was possible that
secondary antibody was causing the non-specific bands in Figure 3.8, so another
secondary antibody (Davids Biotechnologie) was compared with the original one
(Sigma), and different concentrations were tried as well. Against COS-7 cells neither
gave satisfactory results at previously established concentrations; furthermore, both
antibodies, but especially Sigma, gave some background when tested with no primary
antibody (Figure 3.9).
1 2 3 4
Figure 3.9. COS-7 whole cell extract was separated on a 4-12% Bis-Tris gel and thesubsequent nitrocellulose membrane was probed with APHen2 1:1000 and secondaryanti-chicken-HRP (Davids) 1:2000 (Lane 1); APHen2 1:1000 and secondary anti-chicken-HRP (Davids) 1:5000 (Lane 2); secondary anti-chicken-HRP (Sigma) 1:5000only (Lane 3); and secondary anti-chicken-HRP (Davids) 1:2000 only (Lane 4). Tothe left are shown the Molecular weights (kDa).
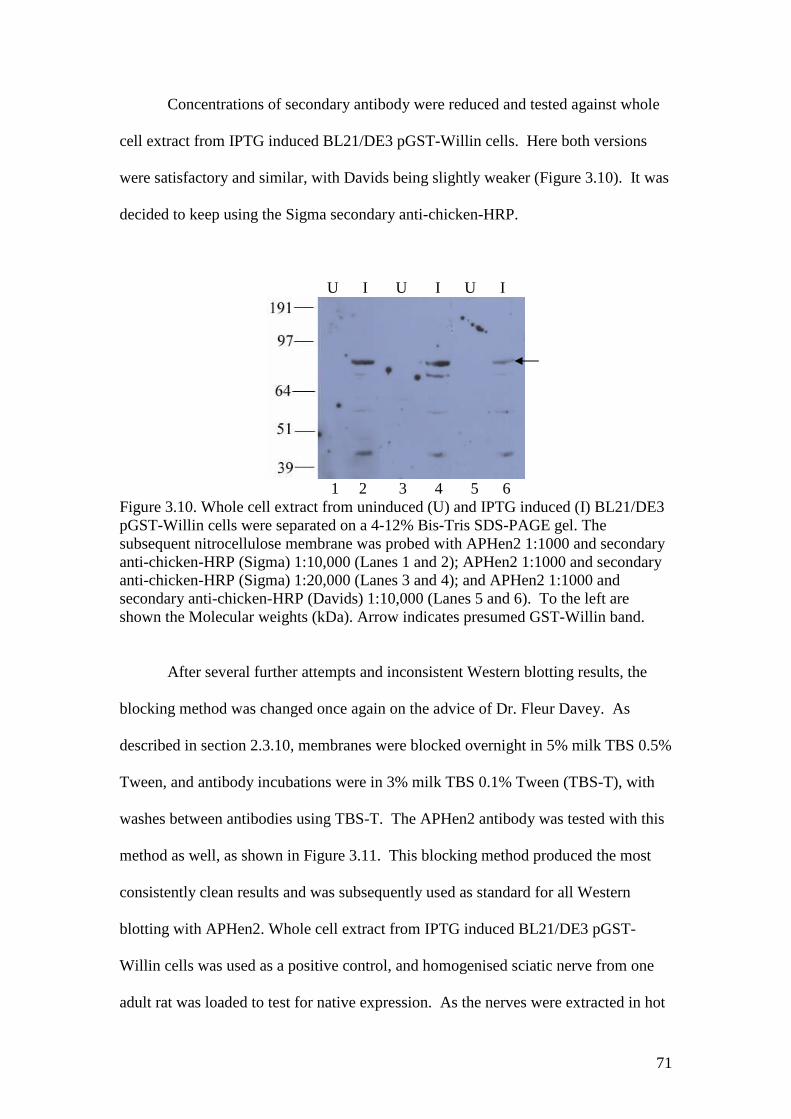
71
Concentrations of secondary antibody were reduced and tested against whole
cell extract from IPTG induced BL21/DE3 pGST-Willin cells. Here both versions
were satisfactory and similar, with Davids being slightly weaker (Figure 3.10). It was
decided to keep using the Sigma secondary anti-chicken-HRP.
U I U I U I
1 2 3 4 5 6Figure 3.10. Whole cell extract from uninduced (U) and IPTG induced (I) BL21/DE3pGST-Willin cells were separated on a 4-12% Bis-Tris SDS-PAGE gel. Thesubsequent nitrocellulose membrane was probed with APHen2 1:1000 and secondaryanti-chicken-HRP (Sigma) 1:10,000 (Lanes 1 and 2); APHen2 1:1000 and secondaryanti-chicken-HRP (Sigma) 1:20,000 (Lanes 3 and 4); and APHen2 1:1000 andsecondary anti-chicken-HRP (Davids) 1:10,000 (Lanes 5 and 6). To the left areshown the Molecular weights (kDa). Arrow indicates presumed GST-Willin band.
After several further attempts and inconsistent Western blotting results, the
blocking method was changed once again on the advice of Dr. Fleur Davey. As
described in section 2.3.10, membranes were blocked overnight in 5% milk TBS 0.5%
Tween, and antibody incubations were in 3% milk TBS 0.1% Tween (TBS-T), with
washes between antibodies using TBS-T. The APHen2 antibody was tested with this
method as well, as shown in Figure 3.11. This blocking method produced the most
consistently clean results and was subsequently used as standard for all Western
blotting with APHen2. Whole cell extract from IPTG induced BL21/DE3 pGST-
Willin cells was used as a positive control, and homogenised sciatic nerve from one
adult rat was loaded to test for native expression. As the nerves were extracted in hot
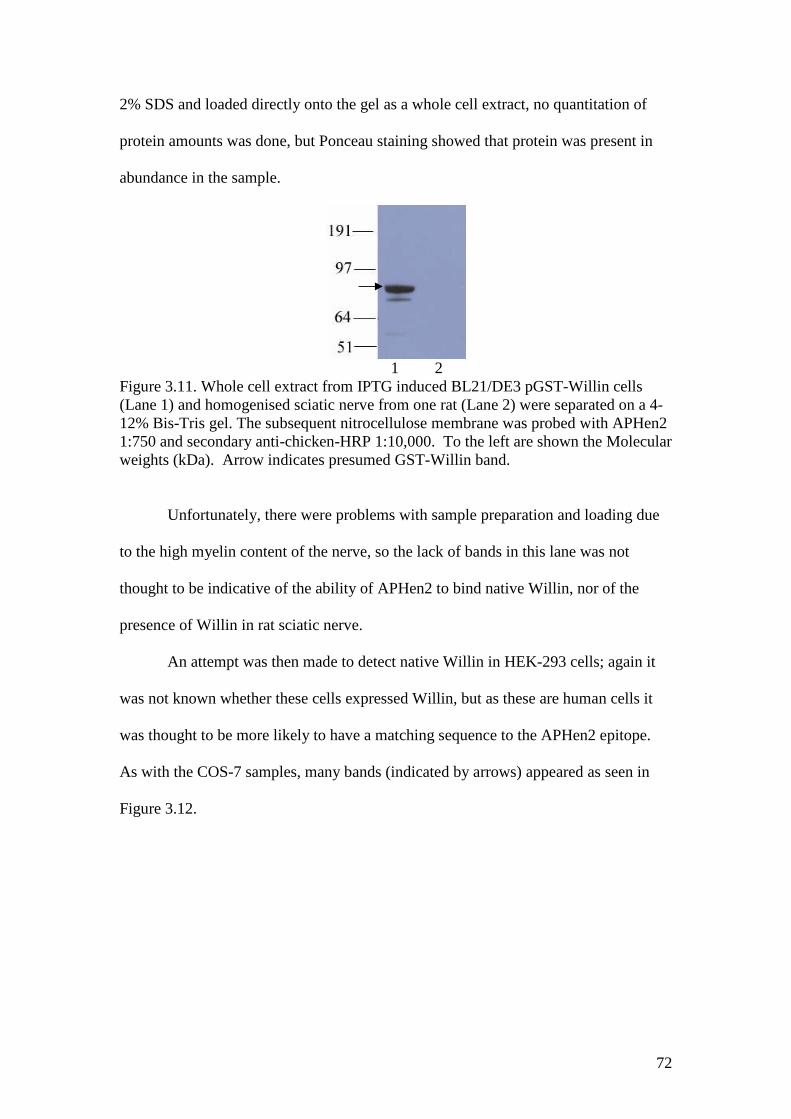
72
2% SDS and loaded directly onto the gel as a whole cell extract, no quantitation of
protein amounts was done, but Ponceau staining showed that protein was present in
abundance in the sample.
1 2Figure 3.11. Whole cell extract from IPTG induced BL21/DE3 pGST-Willin cells(Lane 1) and homogenised sciatic nerve from one rat (Lane 2) were separated on a 4-12% Bis-Tris gel. The subsequent nitrocellulose membrane was probed with APHen21:750 and secondary anti-chicken-HRP 1:10,000. To the left are shown the Molecularweights (kDa). Arrow indicates presumed GST-Willin band.
Unfortunately, there were problems with sample preparation and loading due
to the high myelin content of the nerve, so the lack of bands in this lane was not
thought to be indicative of the ability of APHen2 to bind native Willin, nor of the
presence of Willin in rat sciatic nerve.
An attempt was then made to detect native Willin in HEK-293 cells; again it
was not known whether these cells expressed Willin, but as these are human cells it
was thought to be more likely to have a matching sequence to the APHen2 epitope.
As with the COS-7 samples, many bands (indicated by arrows) appeared as seen in
Figure 3.12.

73
1 2Figure 3.12. Whole cell extract from IPTG induced BL21/DE3 pGST-Willin cells(Lane 1) and HEK-293 whole cell extract (Lane 2) were separated on a 4-12% Bis-Tris gel. The subsequent nitrocellulose membrane was probed with APHen2 1:750and secondary anti-chicken-HRP 1:10,000. To the left are shown the Molecularweights (kDa).
Because of the large number of bands, it was difficult to determine if APHen2
was detecting native Willin. To determine which, if any, bands were specific to the
epitope against which APHen2 had been raised, a peptide blocking experiment was
performed. 100g/mL of the pure peptide were incubated with APHen2 about 2
hours at room temperature. Antibodies were incubated in TBS-T only to avoid milk
interference with the peptide. Figure 3.13 shows that, while the peptide blocking was
apparently successful for whole cell extract from IPTG induced BL21/DE3 pGST-
Willin cells, no blocking appeared to occur for the HEK-293 whole cell extract.

74
1 2 3 4Figure 3.13. Whole cell extract from IPTG induced BL21/DE3 pGST-Willin cells(Lanes 1 and 3) and HEK-293 whole cell extract (Lanes 2 and 4) were separated on a4-12% Bis-Tris gel. The subsequent nitrocellulose membranes were probed witheither APHen2 1:1000 secondary anti-chicken-HRP (Sigma) 1:10,000 (Lanes 1 and2); or APHen2 1:1000 + 100g/mL peptide and secondary anti-chicken-HRP1:10,000 (Lanes 3 and 4). To the left are shown the Molecular weights (kDa).
During the course of these investigations, a 622 amino acid isoform of Willin
was found which could not be detected by 9143 due to the insertion of an octapeptide
in the same sequence to which 9143 was made. However, the epitope to which
APHen2 was made is present in the longer isoform, and thus may be detectable by
this antibody. A human clone of this isoform was not available, so a highly-
conserved mouse version was obtained from the IMAGE consortium and tagged with
GFP (see section 4.7). Unfortunately, the antibody was unable to detect the GFP-
tagged version of this protein (Figure 3.14A). It is not yet known why this occurs,
though there may be a problem with the GFP tag, which is directly adjacent to the
APHen2 epitope.

75
1 2 3 4 5Figure 3.14. Whole cell extract from IPTG induced BL21/DE3 pGST-Willin cells(Lane 1) and whole cell extract from HEK-293 cells either untransfected (Lanes 2 and4) or transfected with mouse Willin-GFP (Lanes 3 and 5) were separated on a 4-12%Bis-Tris gel. The subsequent nitrocellulose membrane was probed with APHen21:1000 and secondary anti-chicken HRP1:5000 (Lanes 1-3) or anti-GFP 1:1000 andsecondary anti-mouse HRP 1:5000 (Lanes 4 and 5).
3.3 Characterisation of the custom-made polyclonal rabbit antibody WR1 & 2
The chicken antibody was found to be too inconsistent and unable to detect
native protein with any certainty; therefore another custom antibody was produced.
Two polyclonal antibodies were raised in two separate rabbits by the company
Genovac (Freiburg, Germany), using the same peptide sequence as the more-
successful 9143: KEASKGIDQFGPPMIIH. Antibodies from the two different rabbits
were provided in both pre- and post-affinity purified forms by the company, but
because they were more likely to yield clean results, only the affinity purified versions
were tested. These were called WR1 and WR2. Initial concentrations were as
recommended by the manufacturer.
Because 9143, the previous antibody with this sequence, cross-reacted with
BSA and thus required panning before use, it was first desirable to test the new
antibody for the same reactivity. Whole cell extract from uninduced (U) and IPTG
induced (I) BL21/DE3 pGST-Willin cells and 5g of BSA were separated on a gel;
pAP9143 was used as a positive control for GST-Willin expression. Blocking and
antibody incubations were used as for APHen2; the membrane was first blocked
overnight in 5% milk TBS 0.5% TWEEN-20, and antibody incubations were done in
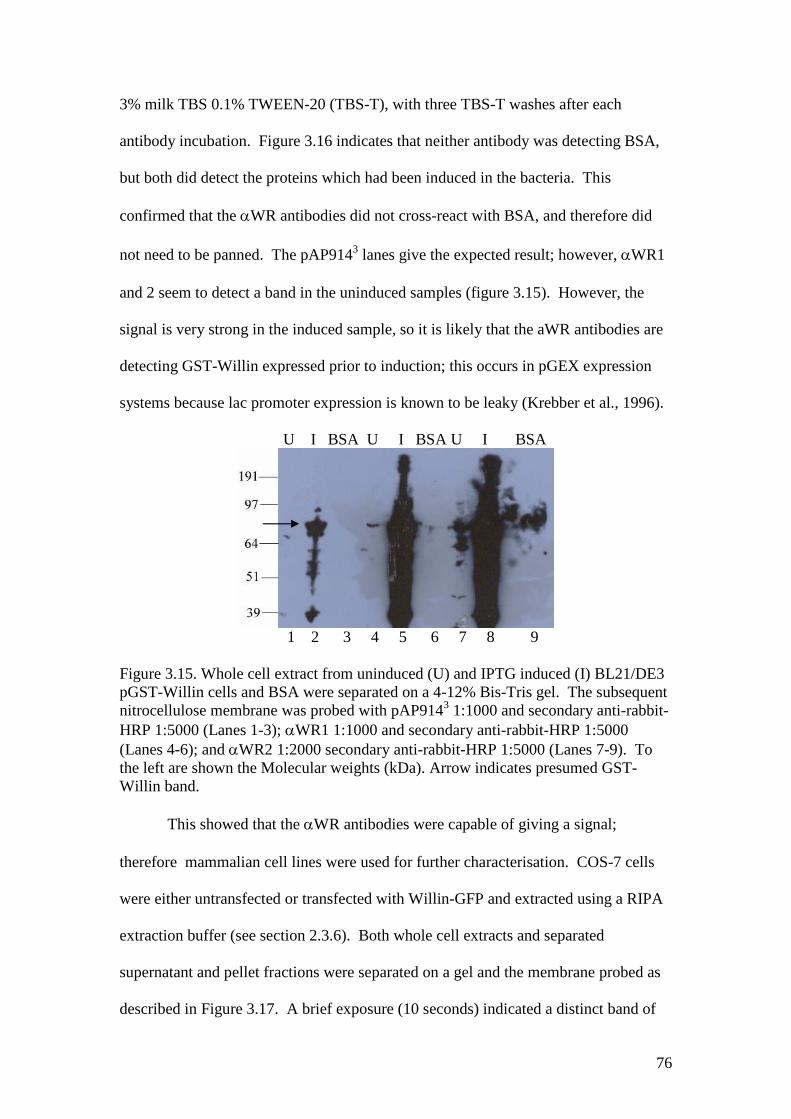
76
3% milk TBS 0.1% TWEEN-20 (TBS-T), with three TBS-T washes after each
antibody incubation. Figure 3.16 indicates that neither antibody was detecting BSA,
but both did detect the proteins which had been induced in the bacteria. This
confirmed that the WR antibodies did not cross-react with BSA, and therefore did
not need to be panned. The pAP9143 lanes give the expected result; however, WR1
and 2 seem to detect a band in the uninduced samples (figure 3.15). However, the
signal is very strong in the induced sample, so it is likely that the aWR antibodies are
detecting GST-Willin expressed prior to induction; this occurs in pGEX expression
systems because lac promoter expression is known to be leaky (Krebber et al., 1996).
U I BSA U I BSA U I BSA
1 2 3 4 5 6 7 8 9
Figure 3.15. Whole cell extract from uninduced (U) and IPTG induced (I) BL21/DE3pGST-Willin cells and BSA were separated on a 4-12% Bis-Tris gel. The subsequentnitrocellulose membrane was probed with pAP9143 1:1000 and secondary anti-rabbit-HRP 1:5000 (Lanes 1-3); WR1 1:1000 and secondary anti-rabbit-HRP 1:5000(Lanes 4-6); and WR2 1:2000 secondary anti-rabbit-HRP 1:5000 (Lanes 7-9). Tothe left are shown the Molecular weights (kDa). Arrow indicates presumed GST-Willin band.
This showed that the WR antibodies were capable of giving a signal;
therefore mammalian cell lines were used for further characterisation. COS-7 cells
were either untransfected or transfected with Willin-GFP and extracted using a RIPA
extraction buffer (see section 2.3.6). Both whole cell extracts and separated
supernatant and pellet fractions were separated on a gel and the membrane probed as
described in Figure 3.17. A brief exposure (10 seconds) indicated a distinct band of

77
about 70kDa in the transfected whole cell extract samples probed by WR1 and 2
(Figure 3.16A); because of its exclusive presence in the transfected lane, it was
thought that this could be a breakdown product of Willin-GFP, as without the GFP tag
Willin would be about 70kDa. However, a slightly longer exposure time (30 seconds)
showed high non-specific binding, making it difficult to analyse whether Willin-GFP
expression, confirmed by anti-GFP in lane 2, was detected by WR1 and 2 in the
transfected samples (Figure 3.16B).
UT T S/N P UT T UT T
A
UT T S/N P UT T UT T
B1 2 3 4 5 6 7 8
Figure 3.16. Whole cell extracts of RIPA-extracted COS-7 cells, both untransfected(UT) and transfected with Willin-GFP (T), were taken prior to separation ofsupernatant (S/N) and pellet (P). Samples were separated on a 4-12% Bis-Tris gel asshown. The subsequent nitrocellulose membrane was probed with anti-GFP 1:1000and secondary anti-mouse-HRP 1:5000 (Lanes 1-4); WR1 1:200 and secondary anti-rabbit-HRP 1:2000 (Lanes 5 and 6); or WR2 1:200 and secondary anti-rabbit-HRP1:2000. A) Exposure time of 10 seconds yields a potential band of correct size, asindicated by the yellow arrow. B) Exposure time of 30 seconds; the yellow arrowindicates the Willin-GFP band. To the left are shown the Molecular weights (kDa).
This result was still not satisfactory, so another attempt was made, this time
using HEK-293 cells instead of COS-7 cells. Both untransfected and Willin-GFP-
transfected HEK-293 whole cell extracts were separated on a gel. As shown in figure
3.17, a band matching that detected by anti-GFP was weakly detected by both WR1
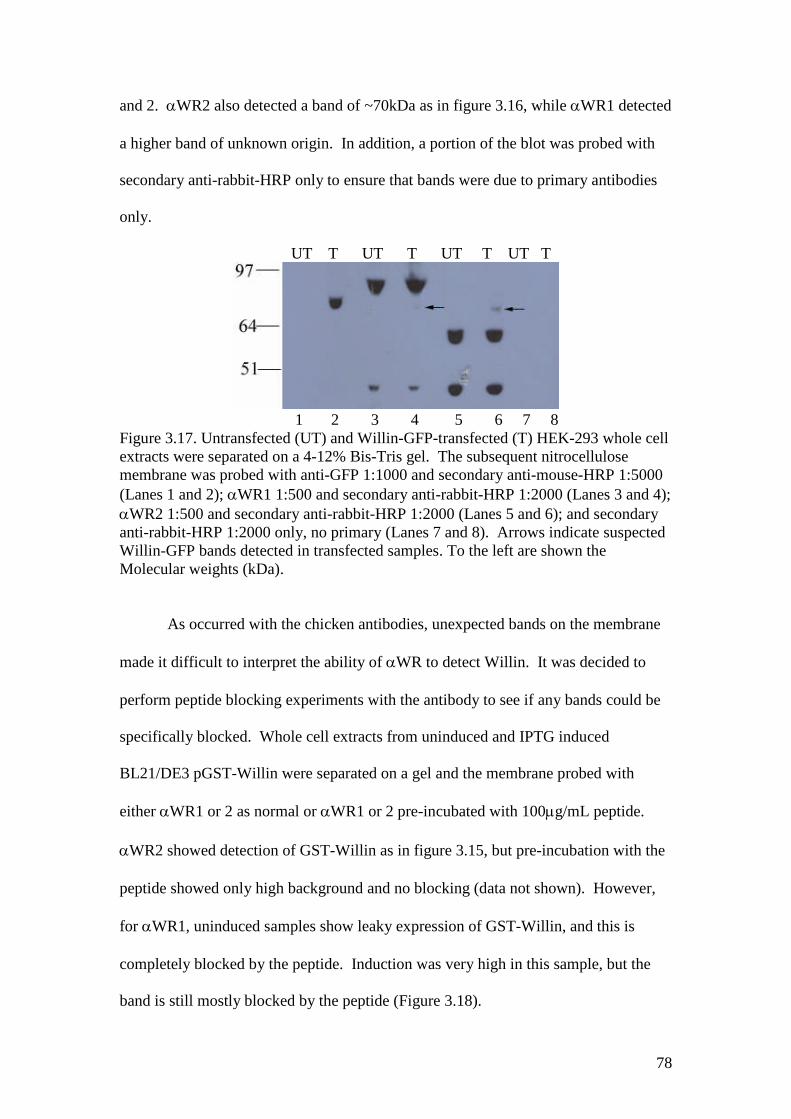
78
and 2. WR2 also detected a band of ~70kDa as in figure 3.16, while WR1 detected
a higher band of unknown origin. In addition, a portion of the blot was probed with
secondary anti-rabbit-HRP only to ensure that bands were due to primary antibodies
only.
UT T UT T UT T UT T
1 2 3 4 5 6 7 8Figure 3.17. Untransfected (UT) and Willin-GFP-transfected (T) HEK-293 whole cellextracts were separated on a 4-12% Bis-Tris gel. The subsequent nitrocellulosemembrane was probed with anti-GFP 1:1000 and secondary anti-mouse-HRP 1:5000(Lanes 1 and 2); WR1 1:500 and secondary anti-rabbit-HRP 1:2000 (Lanes 3 and 4);WR2 1:500 and secondary anti-rabbit-HRP 1:2000 (Lanes 5 and 6); and secondaryanti-rabbit-HRP 1:2000 only, no primary (Lanes 7 and 8). Arrows indicate suspectedWillin-GFP bands detected in transfected samples. To the left are shown theMolecular weights (kDa).
As occurred with the chicken antibodies, unexpected bands on the membrane
made it difficult to interpret the ability of WR to detect Willin. It was decided to
perform peptide blocking experiments with the antibody to see if any bands could be
specifically blocked. Whole cell extracts from uninduced and IPTG induced
BL21/DE3 pGST-Willin were separated on a gel and the membrane probed with
either WR1 or 2 as normal or WR1 or 2 pre-incubated with 100g/mL peptide.
WR2 showed detection of GST-Willin as in figure 3.15, but pre-incubation with the
peptide showed only high background and no blocking (data not shown). However,
for WR1, uninduced samples show leaky expression of GST-Willin, and this is
completely blocked by the peptide. Induction was very high in this sample, but the
band is still mostly blocked by the peptide (Figure 3.18).
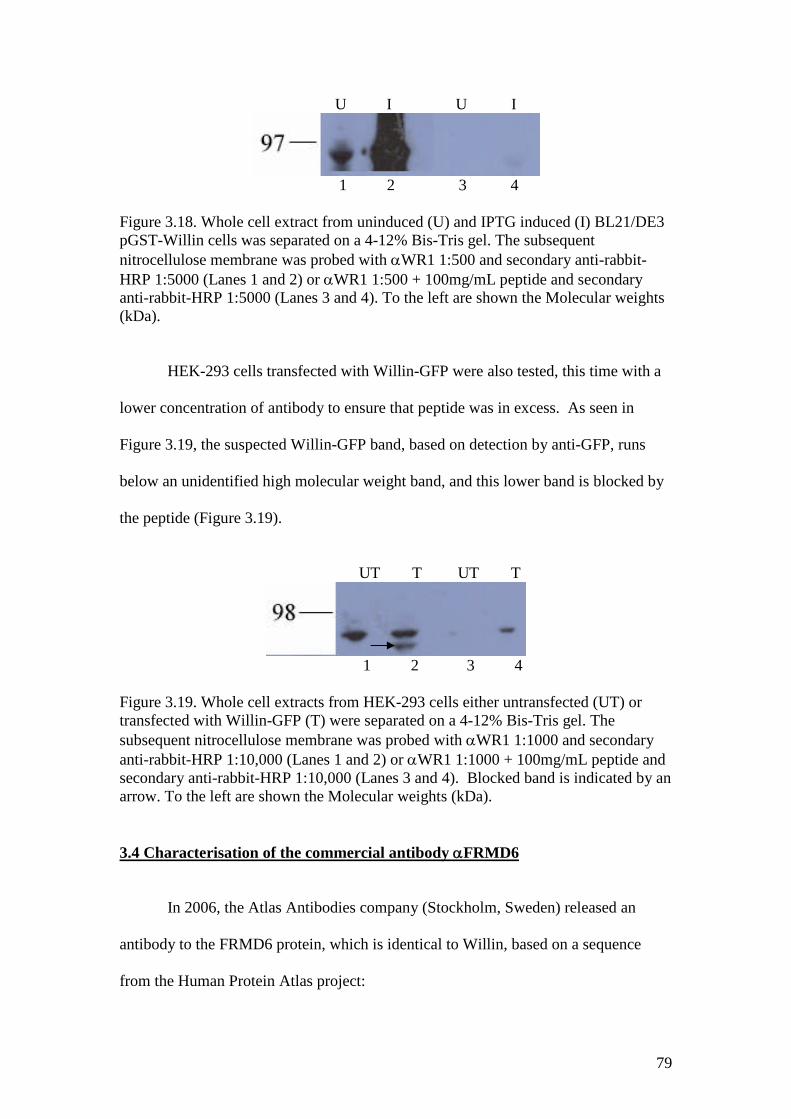
79
U I U I
1 2 3 4
Figure 3.18. Whole cell extract from uninduced (U) and IPTG induced (I) BL21/DE3pGST-Willin cells was separated on a 4-12% Bis-Tris gel. The subsequentnitrocellulose membrane was probed with WR1 1:500 and secondary anti-rabbit-HRP 1:5000 (Lanes 1 and 2) or WR1 1:500 + 100mg/mL peptide and secondaryanti-rabbit-HRP 1:5000 (Lanes 3 and 4). To the left are shown the Molecular weights(kDa).
HEK-293 cells transfected with Willin-GFP were also tested, this time with a
lower concentration of antibody to ensure that peptide was in excess. As seen in
Figure 3.19, the suspected Willin-GFP band, based on detection by anti-GFP, runs
below an unidentified high molecular weight band, and this lower band is blocked by
the peptide (Figure 3.19).
UT T UT T
1 2 3 4
Figure 3.19. Whole cell extracts from HEK-293 cells either untransfected (UT) ortransfected with Willin-GFP (T) were separated on a 4-12% Bis-Tris gel. Thesubsequent nitrocellulose membrane was probed with WR1 1:1000 and secondaryanti-rabbit-HRP 1:10,000 (Lanes 1 and 2) or WR1 1:1000 + 100mg/mL peptide andsecondary anti-rabbit-HRP 1:10,000 (Lanes 3 and 4). Blocked band is indicated by anarrow. To the left are shown the Molecular weights (kDa).
3.4 Characterisation of the commercial antibody FRMD6
In 2006, the Atlas Antibodies company (Stockholm, Sweden) released an
antibody to the FRMD6 protein, which is identical to Willin, based on a sequence
from the Human Protein Atlas project:
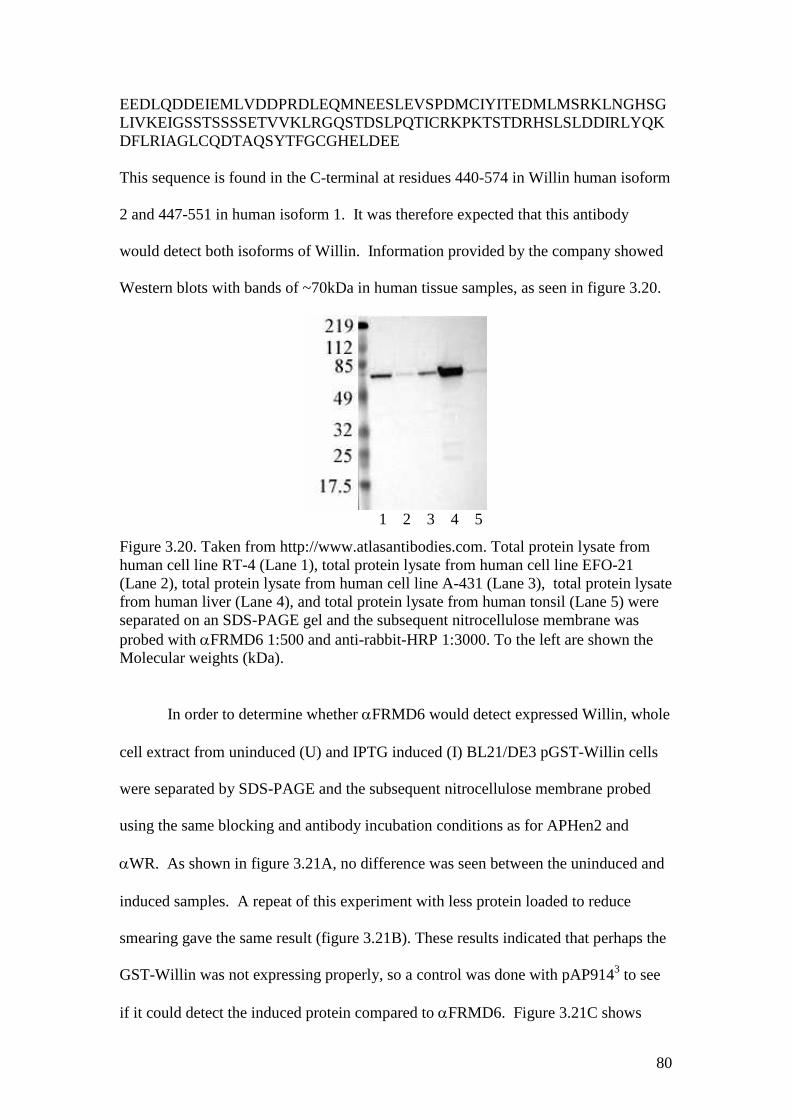
80
EEDLQDDEIEMLVDDPRDLEQMNEESLEVSPDMCIYITEDMLMSRKLNGHSGLIVKEIGSSTSSSSETVVKLRGQSTDSLPQTICRKPKTSTDRHSLSLDDIRLYQKDFLRIAGLCQDTAQSYTFGCGHELDEE
This sequence is found in the C-terminal at residues 440-574 in Willin human isoform
2 and 447-551 in human isoform 1. It was therefore expected that this antibody
would detect both isoforms of Willin. Information provided by the company showed
Western blots with bands of ~70kDa in human tissue samples, as seen in figure 3.20.
1 2 3 4 5
Figure 3.20. Taken from http://www.atlasantibodies.com. Total protein lysate fromhuman cell line RT-4 (Lane 1), total protein lysate from human cell line EFO-21(Lane 2), total protein lysate from human cell line A-431 (Lane 3), total protein lysatefrom human liver (Lane 4), and total protein lysate from human tonsil (Lane 5) wereseparated on an SDS-PAGE gel and the subsequent nitrocellulose membrane wasprobed with FRMD6 1:500 and anti-rabbit-HRP 1:3000. To the left are shown theMolecular weights (kDa).
In order to determine whether FRMD6 would detect expressed Willin, whole
cell extract from uninduced (U) and IPTG induced (I) BL21/DE3 pGST-Willin cells
were separated by SDS-PAGE and the subsequent nitrocellulose membrane probed
using the same blocking and antibody incubation conditions as for APHen2 and
WR. As shown in figure 3.21A, no difference was seen between the uninduced and
induced samples. A repeat of this experiment with less protein loaded to reduce
smearing gave the same result (figure 3.21B). These results indicated that perhaps the
GST-Willin was not expressing properly, so a control was done with pAP9143 to see
if it could detect the induced protein compared to FRMD6. Figure 3.21C shows

81
that, while pAP9143 is able to detect induced GST-Willin as normal, FRMD6 still
does not.
U I U I I I
A B C1 2 3 4 5 6
Figure 3.21. A) Whole cell extracts from uninduced (U) and IPTG induced (I)BL21/DE3 pGST-Willin cells were separated on a 4-12% Bis-Tris gel. Thesubsequent nitrocellulose membrane was probed with FRMD6 1:500 and secondaryanti-rabbit-HRP 1:3000. There is no difference between the samples, and a bandappears just above 64kDa. B) The same conditions with reduced protein loading toreduce smearing. C) Whole cell extracts from IPTG induced BL21/DE3 pGST-Willincells were separated on a 4-12% Bis-Tris gel. The subsequent nitrocellulosemembrane was probed with pAP9143 1:1000 and secondary anti-rabbit-HRP 1:5000(Lane 5) or FRMD6 1:500 and secondary anti-rabbit-HRP 1:3000 (Lane 6). To theleft are shown the Molecular weights (kDa).
It was determined that FRMD6 does not detect GST-Willin. An attempt was
then made to see if FRMD6 could detect Willin-GFP expressed in mammalian cells.
First, HEK-293 cells were either untransfected or transfected with plasmids
expressing Willin-GFP, Merlin1-GFP, GFP-Moesin or GFP-Ezrin. Whole cell
extracts were prepared as usual (section 2.3.6) and separated on a gel, and the
subsequent nitrocellulose membrane was probed with FRMD6 as described in figure
3.22. Willin-GFP and Merlin1-GFP were expected to be approximately 98kDa, while
GFP-Moesin and GFP-Ezrin were expected to be approximately 108kDa. It was
expected that FRMD6 would react exclusively with Willin and not the other ERM

82
proteins. Figure 3.22 shows an approximately 39kDa band and an approximately
60kDa band in all lanes, and an approximately 85kDa band in all transfected lanes.
1 2 3 4 5Figure 3.22. HEK cells were either untransfected (1) or transfected with Willin-GFP(2), M1GFP (3), GFP-Moesin (4) or GFP-Ezrin (5); whole cell extracts wereseparated on a 4-12% Bis-Tris gel and the subsequent nitrocellulose membrane wasprobed with FRMD6 1:500 and secondary anti-rabbit-HRP 1:3000. To the left areshown the Molecular weights (kDa).
This experiment showed possible detection of a band of similar size to
previous Willin-GFP samples, but it also appeared in lanes with other ERM proteins.
To determine if this band was Willin-GFP, whole cell extracts from COS-7 cells
either untransfected or transfected with Willin-GFP were separated on a gel and the
subsequent nitrocellulose membrane probed with FRMD6 and GFP as a control.
Figure 3.23A shows that, while GFP detected an expressed band, FRMD6 did not;
increasing the exposure time to 15 minutes (figure 3.23B) still did not bring up
Willin-GFP bands in FRMD6.
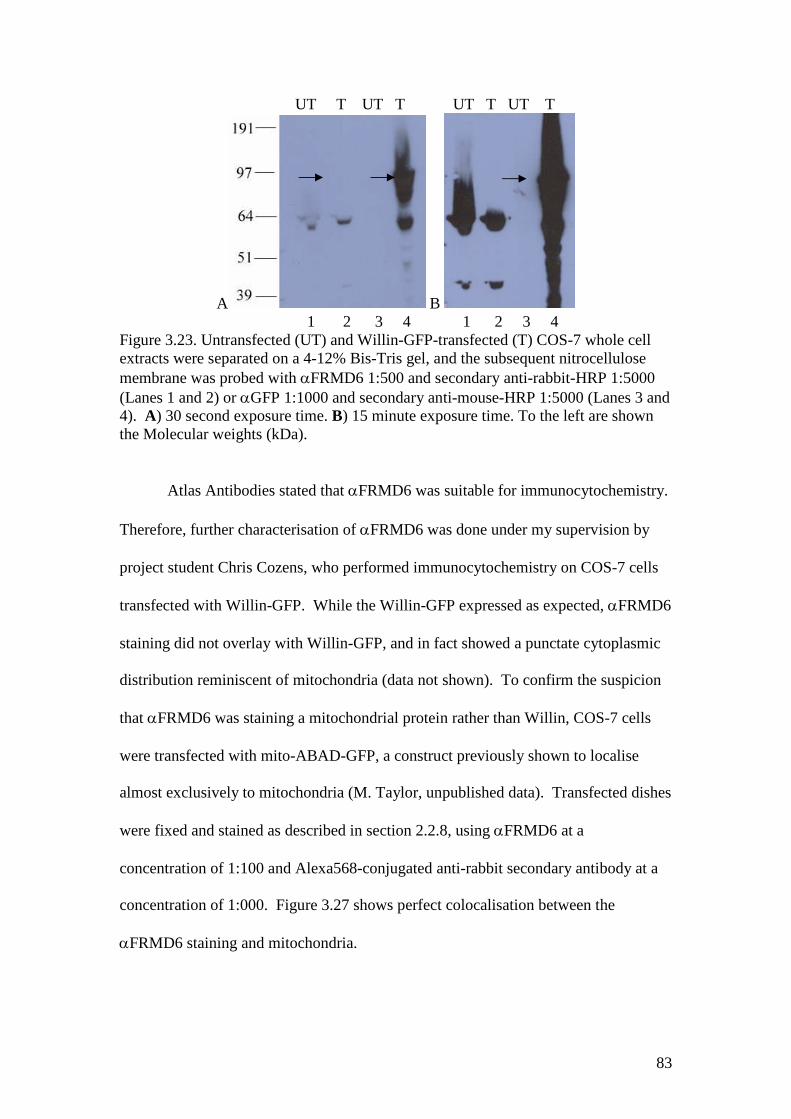
83
UT T UT T UT T UT T
A B1 2 3 4 1 2 3 4
Figure 3.23. Untransfected (UT) and Willin-GFP-transfected (T) COS-7 whole cellextracts were separated on a 4-12% Bis-Tris gel, and the subsequent nitrocellulosemembrane was probed with FRMD6 1:500 and secondary anti-rabbit-HRP 1:5000(Lanes 1 and 2) or GFP 1:1000 and secondary anti-mouse-HRP 1:5000 (Lanes 3 and4). A) 30 second exposure time. B) 15 minute exposure time. To the left are shownthe Molecular weights (kDa).
Atlas Antibodies stated that FRMD6 was suitable for immunocytochemistry.
Therefore, further characterisation of FRMD6 was done under my supervision by
project student Chris Cozens, who performed immunocytochemistry on COS-7 cells
transfected with Willin-GFP. While the Willin-GFP expressed as expected, FRMD6
staining did not overlay with Willin-GFP, and in fact showed a punctate cytoplasmic
distribution reminiscent of mitochondria (data not shown). To confirm the suspicion
that FRMD6 was staining a mitochondrial protein rather than Willin, COS-7 cells
were transfected with mito-ABAD-GFP, a construct previously shown to localise
almost exclusively to mitochondria (M. Taylor, unpublished data). Transfected dishes
were fixed and stained as described in section 2.2.8, using FRMD6 at a
concentration of 1:100 and Alexa568-conjugated anti-rabbit secondary antibody at a
concentration of 1:000. Figure 3.27 shows perfect colocalisation between the
FRMD6 staining and mitochondria.
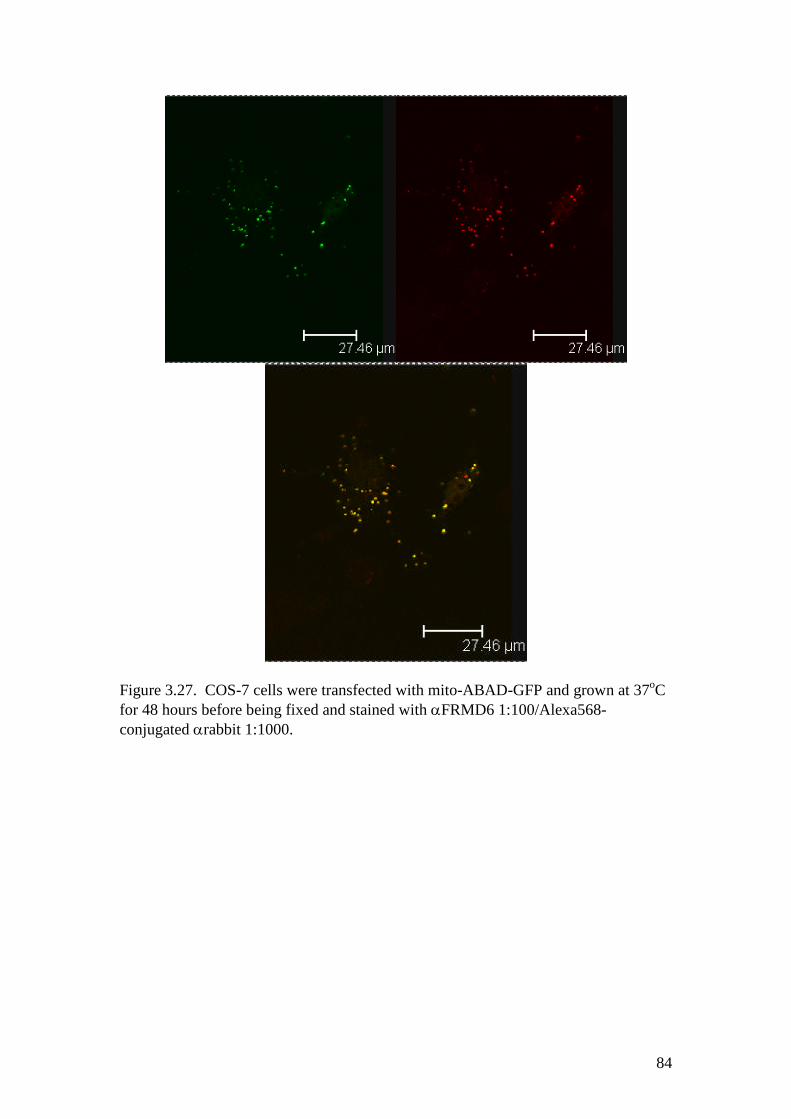
84
Figure 3.27. COS-7 cells were transfected with mito-ABAD-GFP and grown at 37oCfor 48 hours before being fixed and stained with FRMD6 1:100/Alexa568-conjugated rabbit 1:1000.
85
3.5 Discussion
3.5.1 9143 and WR Antibodies and the 622 Amino Acid Isoform of Willin
The rabbit polyclonal antibodies 9143 and WR were made against the peptide
sequence KEASKGIDQFGPPMIIH. The panned, affinity purified version of 9143
detects expressed Willin reasonably well in Westerns, but has been mostly
unsuccessful in detecting native Willin; affinity purified versions of WR had the
same problems. All of the expressed proteins used in our experiments were the 614
amino acid length version, called isoform 2, but there is another isoform, isoform 1,
that is 622 amino acids in length. This version has 8 additional amino acids within the
very sequence to which 9143 was raised (KEASKVRQYEVTWGIDQFGPPMIIHC).
If the native form of Willin expressed in the cell types studied is isoform 1, it is clear
that 9143 and WR are unlikely to detect it. As yet it is unknown what difference
there is in expression and function between the two different isoforms of Willin, but it
would be advisable to avoid this sequence in the design of future antibodies against
Willin. However, once more is known about Willin isoform distribution, it is possible
that either of these antibodies can be used as an isoform-specific detection method if
the need arises.
3.5.2 APHen2
APHen2 was found to be no better than pAP9143 in detecting expressed Willin
and inconclusive as to whether it could detect native Willin in cultured cells and rat
sciatic nerve. COS-7 cells are from African green monkey (Chlorocebus sabaeus), so
it is possible that the APHen2 epitope is not present in the monkey version, if indeed
there is a green monkey homologue. In addition, BLAST searches of the rat Willin
sequence led to the discovery that a rat sequence with a complete C-terminus had not

86
been cloned at the time, and it was as yet impossible to know if the antibody peptide
is even present in the rat protein. This line of inquiry was therefore abandoned. A
recent BLAST search has shown a predicted 615 amino acid rat version (accession
number XP_001080473) with a C-terminal sequence of VLFSGPHSRRGPRVPCL,
which matches only 2 amino acids of the APHen2 sequence
(KYFSLDLTHDEVPEFVV). Although this is only a predicted sequence, this may
explain why APHen2 was unable to detect Willin in rat sciatic nerve. The mouse
protein does have this sequence, but the C-terminal GFP tag may prevent binding of
the antibody to expressed protein. To study the antibody further, the mouse Willin
sequence should be expressed in another mammalian expression vector without a C-
terminal tag. Unfortunately this was outwith the scope of this project.
3.5.3 WR
The WR rabbit antibody was made to the same sequence as 9143, but did not
cross-react with BSA. Unfortunately, it was also inconsistent with its detection of
Willin. Non-specific binding was high and peptide blocking seemed to work only for
expressed protein. Further characterisation was done by project student Amy
Cameron, and her results also showed a high level of inconsistency with this antibody.
For these reasons, it was abandoned.
FRMD6
The commercial antibody FRMD6 was shown not to bind expressed Willin
in cultured mammalian cells and bacteria. The ~70kDa band that appeared in
Western blots with cultured cells also appeared in bacterial samples. FERM proteins
are not found in bacteria, so it is very unlikely that this band is Willin. In addition, the
immunocytochemistry results show that FRMD6 staining is exclusive to the
87
mitochondria, but does not overlap with expressed Willin-GFP. As further
confirmation, Professor Simon Harrington, a pathologist at the University of St.
Andrews, observed the original immunocytochemistry images made available on the
Atlas Antibodies website, and suggested that the granular staining is typical of
mitochondria (CS Herrington, personal communication). Therefore, FRMD6 should
not be used as an antibody to Willin.
3.6. Conclusion
Overall, the antibodies so far raised to Willin have not been successful despite
several attempts. After the conclusion of this work, a monoclonal antibody was raised
to GIDQFGPPMIIH, found in both splice variants; initial testing has indicated that
this has also been unsuccessful. The use of peptides to produce antibodies can be
difficult, as it cannot be known for certain whether a peptide sequence will prove to
be a good antigen without cross-reactivity. In future it may be useful to raise an
antibody to purified protein rather than a peptide, but with a protein as labile and
difficult to purify (see section 5.9.4) as Willin, this will also prove challenging.

88
CHAPTER 4: INTRACELLULAR
LOCALISATION AND BEHAVIOUR
89
Chapter 4: Intracellular localisation and behaviour of Willin
4.1 Introduction
As discussed in Chapter 3, antibodies against Willin have not been as specific
as desired for the study of native protein. Therefore, tagged constructs have been
expressed in cells to observe the protein’s behaviour in cell lines. Prior to the start of
this project, a pWillin-GFP construct was produced by Frances Brannigan (Gunn-
Moore et al., 2005), and has been very useful in characterisation. However, GFP has
been shown to be toxic to living cells (Liu et al., 1999), and as it is a large tag of about
27kDa, there was a fear that it could affect localisation of the protein by masking
binding sites or simply preventing proper targetting. To determine if the Willin-GFP
data was valid, it was determined that a FLAG-tagged construct should be made for
comparison; this tag is only 8 amino acids long, so in theory it should not affect the
distribution or behaviour of Willin. Also, specific antibodies are available to the
FLAG octapeptide, making it a good tag for both immunofluorescence and Western
blot studies. In addition, a DsRed-tagged clone of Willin, allowing for double
transfectant fluorescence microscopy without the use of antibodies, was produced
under my supervision and in collaboration with undergraduate project student Jessica
Davis as discussed in section 4.2.3.
Overexpression of proteins in transient transfections is also a concern. It has
been observed that overexpression can lead to mistargeting, which is an obvious
problem when trying to determine subcellular localisation of a novel protein. To
overcome this problem, stable cell lines are usually produced. This involves
transfecting a cell line, then selecting the transfected cells with antibiotic until only
the cells expressing the construct remain; only the cells that have integrated the gene

90
will survive, and these cells should produce the gene at close to native expression
levels. A stable Willin-expressing cell line had not been made before, so an attempt
was made to produce four such lines: COS-7 cells expressing Willin-GFP, COS-7
cells expressing Willin-FLAG, HEK-293 cells expressing Willin-GFP and HEK-293
cells expressing Willin-FLAG.
The purification of Willin has always been fraught with difficulties. The
protein has been found to be very labile, preventing any long-term storage of purified
protein and whole cell extracts, and the lack of a good antibody has precluded the
study of native protein. As will be discussed in section 4.4, cells expressing Willin
for longer than 72 hours tend to die, restricting longer-term study of transfected cells
and the production of stably-transfected cell lines. This suggests that a function of
Willin could be in the regulation of cell growth and proliferation, potentially
triggering cell death when it is overexpressed or cells have reached a certain density.
There is precedent for this in the FERM proteins, with merlin as a proven tumour
suppressor and growth regulator in species as diverse as Drosophila and humans
(Evans et al., 1992; LaJeunesse et al., 1998). This possibility is further supported by
mRNA data showing that the Willin signal is very low in cells (Stewart Gillespie,
personal communication), and that in some head and neck cancers, Willin is
downregulated (Michael B. Prystowsky, personal communication).
The biggest challenge, however, has been solubility. We have found this
protein to be highly insoluble. Traditionally this has been assumed to mean an
association with the actin cytoskeleton in mammalian cells, and indeed, because of the
often close association and colocalisation with actin, we at first assumed this was the
case. However, disruption of the actin cytoskeleton made no difference either to
Willin localisation or solubility (Gunn-Moore et al., 2005). This finding led to the
91
question of what was causing the insolubility of Willin if not the cytoskeleton.
Intriguingly, merlin is also highly insoluble, but this is because it localises to lipid
rafts (see section 1.1.4.2), special membrane domains that are resistant to
solubilisation by ice-cold 1% Triton X-100 due to their unique packing of cholesterols
and glycosphingolipids (Stickney et al., 2004). As Willin is often found to localise to
the membrane, it was thought that this might be the reason for the insolubility. The
association of Willin constructs with lipid rafts was therefore studied, in conjunction
with Dr. Wally Ip’s group at the University of Cincinnati, Ohio, USA.
During the course of this project, a splice variant of Willin containing 622
amino acids was found. As discussed in section 3.5.1, this variant, referred to here
Willin2, has 8 additional amino acids within the part of the sequence used to produce
two of our antibodies. Therefore, in order to compare this isoform to the one used
previously, a GFP-tagged construct was cloned under my supervision by
undergraduate project student Chris Cozens. A human version of Willin2 was not
available as an Image clone, so a full-length mouse cDNA was purchased instead
(Image Clone 6389695, NCBI accession number: BC053929). Initial characterisation
of this clone is presented in section 4.7.
4.2 The distribution and effect of expressed Willin constructs on mammalian
cells
4.2.1. Construction of the pWillin-FLAG plasmid
A previously constructed plasmid (pWillin-GFP) expressing Willin fused to
the N-terminus of EGFP was shown to express this chimeric protein (Willin-GFP)
such that it had an intracellular distribution that was different from the ERMs and
Merlin, and that varied according to the cell type within which it was expressed and
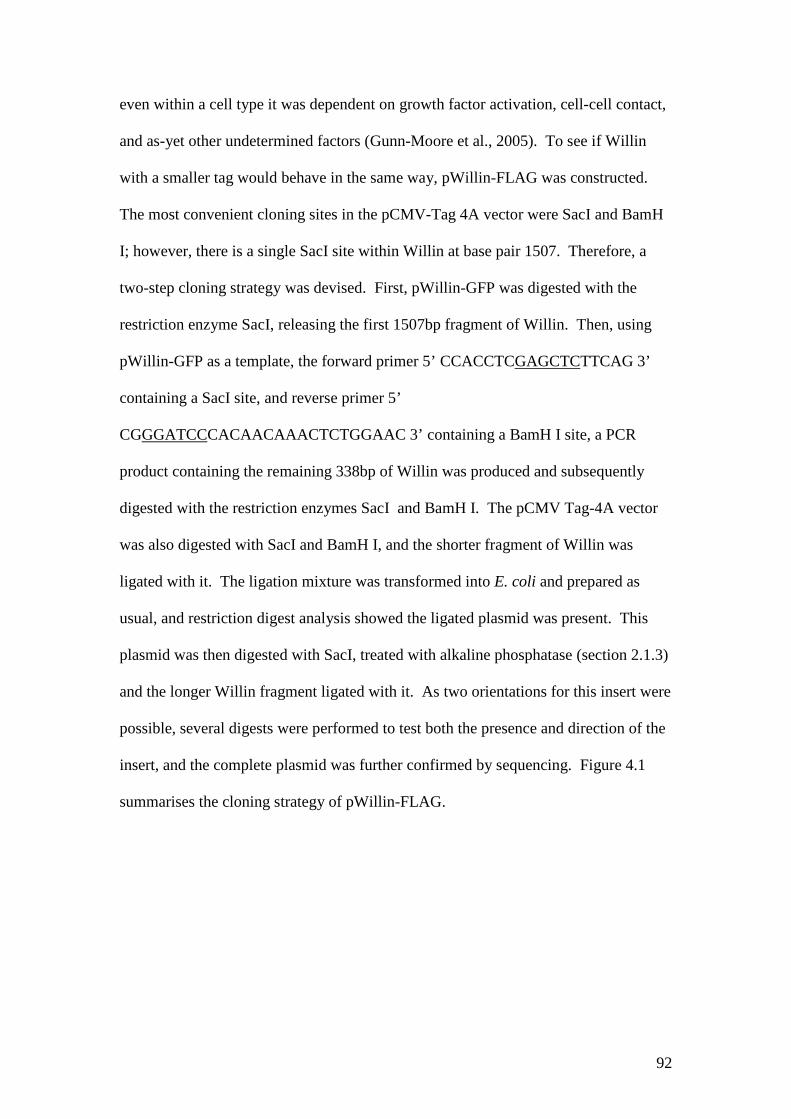
92
even within a cell type it was dependent on growth factor activation, cell-cell contact,
and as-yet other undetermined factors (Gunn-Moore et al., 2005). To see if Willin
with a smaller tag would behave in the same way, pWillin-FLAG was constructed.
The most convenient cloning sites in the pCMV-Tag 4A vector were SacI and BamH
I; however, there is a single SacI site within Willin at base pair 1507. Therefore, a
two-step cloning strategy was devised. First, pWillin-GFP was digested with the
restriction enzyme SacI, releasing the first 1507bp fragment of Willin. Then, using
pWillin-GFP as a template, the forward primer 5’ CCACCTCGAGCTCTTCAG 3’
containing a SacI site, and reverse primer 5’
CGGGATCCCACAACAAACTCTGGAAC 3’ containing a BamH I site, a PCR
product containing the remaining 338bp of Willin was produced and subsequently
digested with the restriction enzymes SacI and BamH I. The pCMV Tag-4A vector
was also digested with SacI and BamH I, and the shorter fragment of Willin was
ligated with it. The ligation mixture was transformed into E. coli and prepared as
usual, and restriction digest analysis showed the ligated plasmid was present. This
plasmid was then digested with SacI, treated with alkaline phosphatase (section 2.1.3)
and the longer Willin fragment ligated with it. As two orientations for this insert were
possible, several digests were performed to test both the presence and direction of the
insert, and the complete plasmid was further confirmed by sequencing. Figure 4.1
summarises the cloning strategy of pWillin-FLAG.
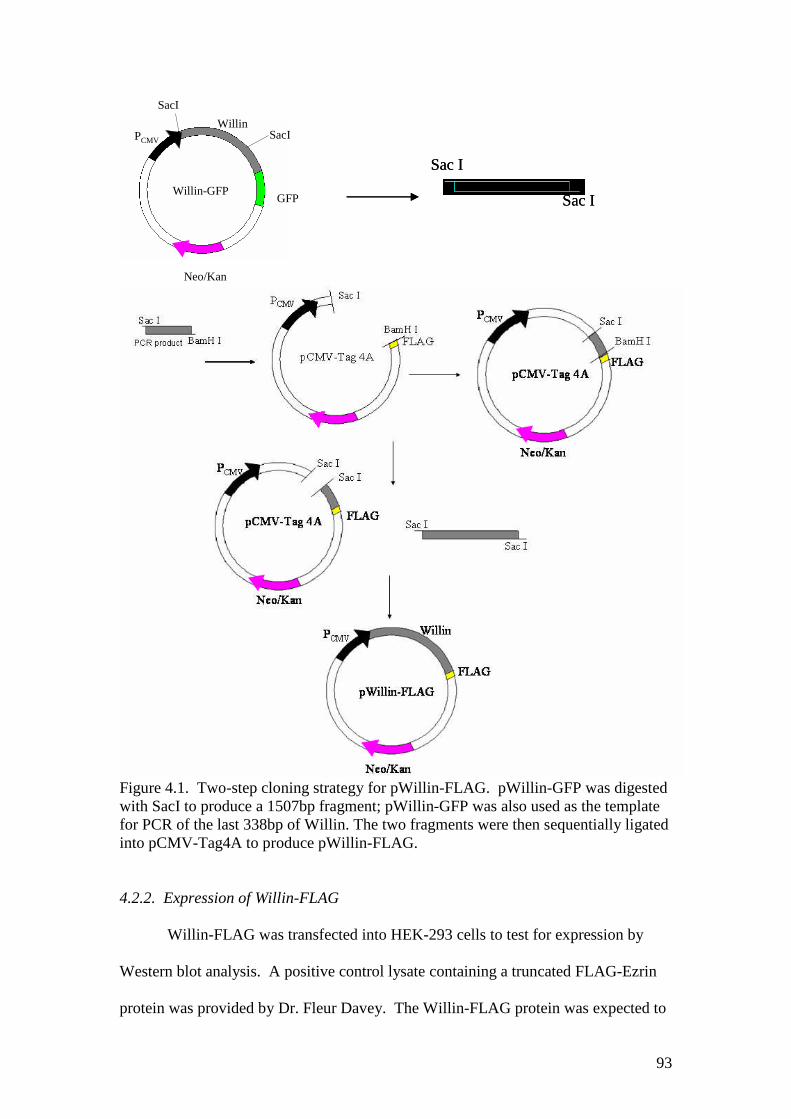
93
Willin
GFP
Neo/Kan
PCMV
SacI
SacI
Willin-GFP
Figure 4.1. Two-step cloning strategy for pWillin-FLAG. pWillin-GFP was digestedwith SacI to produce a 1507bp fragment; pWillin-GFP was also used as the templatefor PCR of the last 338bp of Willin. The two fragments were then sequentially ligatedinto pCMV-Tag4A to produce pWillin-FLAG.
4.2.2. Expression of Willin-FLAG
Willin-FLAG was transfected into HEK-293 cells to test for expression by
Western blot analysis. A positive control lysate containing a truncated FLAG-Ezrin
protein was provided by Dr. Fleur Davey. The Willin-FLAG protein was expected to
Sac I
Sac I
Sac I
Sac I

94
be about 72kDa, but as is usually seen with Willin, the detected protein had a lower
apparent molecular weight (Figure 4.2).
1 2Figure 4.2. Truncated FLAG-Ezrin positive control (Lane 1) and whole cell extractfrom Willin-FLAG transfected HEK-293 cells (Lane 2) were separated on a 4-12%Bis-Tris gel and the subsequent nitrocellulose membrane probed with anti-FLAG M21:500 and secondary anti-mouse-HRP (Santa Cruz) 1:10,000.
Immunocytochemistry was also performed in HEK-293 cells transfected with
pWillin-FLAG (see section 2.2.8) to study the distribution of the Willin-FLAG
protein. It was observed that Willin-FLAG has a comparable distribution pattern to
Willin-GFP (see Figure 1.17B): localisation is punctate throughout the membrane and
cytoplasm in the vast majority of cells (Figure 4.3). In addition, Willin-FLAG-
expressing cells showed the same tendency towards high levels of cell death 48 hours
post-transfection as those expressing Willin-GFP. This indicated that the GFP tag did
not have a significant effect on Willin localisation and was not solely responsible for
increased levels of cell death, and could thus continue to be used for other studies.
Co-expression of Willin-GFP and Willin-FLAG was attempted, but due to
technical problems with the FLAG antibodies that were not FITC-tagged, images
could not be obtained to show co-localisation.

95
Figure 4.3. HEK-293 cell expressing Willin-FLAG. Image is a maximum projectionof 46 Z-sections acquired on Olympus IX70 Deltavision RT microscope withCoolsnap 2HQ camera (Roper Sci). Images were deconvolved and converted to TIFformat with SoftWorx (Applied Precision) and projection assembled using ImageJsoftware. Z-sections were 0.2m thick.
4.2.3. Construction of the pWillin-DsRed plasmid
Under my supervision, undergraduate project student Jessica Davis
constructed a pWillin-DsRed plasmid that could be used for co-localisation studies
with GFP-tagged proteins of interest. PCR was not required; instead, the GFP
sequence was digested from the pWillin-GFP plasmid using BamHI and NotI and
replaced with DsRed2 that had been digested from pDsRed2-Mito with BamHI and
NotI (Figure 4.4).

96
Figure 4.4. Cloning strategy for pWillin-DsRed2. DsRed2 was digested from thepDsRed2-Mito plasmid with BamHI and NotI, while GFP was digested from thepWillin-GFP plasmid. The DsRed2 fragment was then ligated into the Willin vector.
Once the sequence of the plasmid produced was verified by sequencing to
ensure it was in frame, COS-7 cells were transfected with the plasmid. As can be
seen in Figure 4.5, the Willin-DsRed2 protein was found to form aggregates in the

97
cytoplasm, and did not display the characteristic Willin distribution usually found
with Willin-GFP. DsRed1 previously showed this tendency, and though DsRed2 is
supposed to show drastically reduced aggregation (Clontech manual,
http://www.clontech.com/upload/images/ctq/full/CTQJUL01.pdf), it is likely that the
cause of aggregation is DsRed itself. This construct could therefore not be used.
Figure 4.5. A single Z-section snapshot of a COS-7 cell expressing Willin-DsRed2.Single section snapshots were created using LCS Lite V2.61 Build 1538 and croppedwith Adobe Photoshop 7.0 (no other post-processing)
4.3. Production of stable cell lines expressing Willin-GFP and Willin-FLAG
To overcome potential overexpression issues, the production of stable cell
lines was attempted in two cell lines of interest. As HEK-293 cells were in constant
use for many experiments and showed an interesting distribution of Willin, one flask
was transfected with Willin-GFP and another with Willin-FLAG as described in
98
section 2.2.7. In addition, PC12 cells, which showed Willin translocation when
stimulated by growth factors (Gunn-Moore et al., 2005), were also selected and
transfected with the same constructs.
About 48 hours post-transfection, normal medium was supplemented with
1mg/mL G418-sulfate to select for cells that had incorporated the tagged Willin gene.
Almost immediately, problems arose. The cells first continued proliferating until
passaged, and once selection did begin, it took over a month for enough cells to grow
back to a T-25 flask. At this point, cells were seeded onto coverslips to check for
expression, and mixed populations were observed for both cell types and both genes
of interest (data not shown). The PC12 cells had a very low (>5%) transfection
efficiency to begin with, and upon further selection, the protein expression grew
fainter and fewer cells seemed to be expressing the protein in any quantity. The
HEK-293 cells, though showing a higher initial transfection rate, also displayed this
tendency towards dramatically reduced expression. After only a few passages, it
seemed that the cells had expelled the Willin gene but retained the resistance gene, as
the G-418 no longer killed any of the cells. The individual remaining cells were too
faint for imaging, and were severely stressed. Time constraints prevented a second
attempt at producing any of these cell lines.
4.4. Quantitation of cell death in cells expressing Willin-GFP
It had been observed in the laboratory that cells transfected with any of the
Willin constructs seemed to have a high level of cell death if left to express the
protein for longer than 2-3 days. As discussed in section 4.3.1, stable transfections
did not seem to take very well, as the cells that did grow after a significant amount of
time expressed Willin only faintly. This was initially unexpected, as the ERM
99
proteins usually promote cell survival (see section 1.1.3.4), but as Merlin is a growth
suppressor (see section 1.1.4), it was hypothesised that Willin may also have a
suppressive function. Blind cell counts at two different time points post-transfection
were performed under my supervision and in collaboration with undergraduate project
students Amy Cameron and Jessica Davis
COS-7 cells were grown on glass coverslips and transfected with either
pWillin-GFP, pMerlin1-GFP, or pGFP-Moesin, then left to express the proteins for
either 48 or 72 hours before fixation with either PFA in Amy Cameron’s experiments,
or NBF in Jessica Davis’ experiments, as described in section 2.2.8. Coverslips were
mounted on glass slides with Mowviol containing DAPI to allow for visualisation of
nuclei. These slides were then observed under a 63x oil objective lens on a Zeiss
Axioscop microscope. The number of transfected cells in 5 random fields of view
were counted, as well as the number of apoptotic nuclei among those transfected cells.
The number of apoptotic cells was divided by the total number of transfected cells to
give a percentage of transfected cells undergoing apoptosis. All transfected cells
could be expected to have some cell death from the transfection process; cells
transfected with GFP-Moesin were expected to have the least due to the growth and
survival promoting ability of Moesin (see section 1.1.3.4), while Merlin1-GFP was
expected to have more, particularly as cell density increased over time and Merlin1
became more active (see section 1.1.4.1). Willin-GFP was also expected to show
higher cell death compared to GFP-Moesin, particularly after 72 hours as previously
observed. All the data sets were compiled and the outcome shown below in Figure
4.6. As expected, Merlin1-GFP-expressing cells shows a higher level of cell death
than GFP-Moesin-expressing cells, and more after 72 hours than after 48 hours.
Willin-GFP-expressing cells, however, showed little death at 48 hours, but the

100
number of apoptotic cells increased markedly after 72 hours. While intriguing, this
data is still preliminary, and further cell counts must be done for statistical analysis to
be valid.
0
5
10
15
20
25
Merlin1-GFP GFP-Moesin Willin-GFP
%ap
op
toti
cce
lls
48 hours post-transfection
72 hours post-transfection
Figure 4.6. Percentage of apoptotic COS-7 cells transfected with either Merlin1-GFP,GFP-Moesin or Willin-GFP. Cells were counted either 48 hours (blue) or 72 hourspost-transfection. Cell counts were too small for statistical analysis to be performed.
4.5. Investigation of solubility and lipid raft localisation of Willin
4.5.1. Solubility of Willin in Schwann cells
Brannigan (2006) first observed that Willin tended to localise to the insoluble
fraction of detergent extractions. This was mostly the case with expressed Willin, but
it was believed that this insolubility may be a characteristic of Willin, possibly
because of its association with the cytoskeleton. Ideally this would be tested on native
protein, but it was not known which cell lines express Willin. However, Schwann
cells seemed a likely candidate because of Willin’s discovery as the yeast two-hybrid
binding partner of a Schwann cell protein and has been shown to be expressed in
sciatic nerves (Gunn-Moore et al., 2005). RIPA extraction was carried out as
described in 2.3.6. A confluent T-25 flask of rat Schwann cells was a kind gift from
Dr. Sue Barnett, University of Glasgow. These cells were harvested in RIPA buffer

101
and an aliquot of whole cell extract was taken prior to separation of supernatant and
pellet by centrifugation. The samples were separated on a 4-12% Bis-Tris gel and the
subsequent nitrocellulose membrane was probed with pAP9143 antibody, which had
previously been shown to detect some native protein. As shown in Figure 4.7, a
single band of approximately 64kDa protein is strongly detected in the whole cell
extract and insoluble pellet, but only faintly in the soluble supernatant. This
confirmed the presence of a Willin antigen in Schwann cells and the probably native
insolubility of this protein.
1 2 3Figure 4.7. Schwann cells were grown in a T-25 flask and harvested in RIPA buffer.Whole cell extract (Lane 1), supernatant (Lane 2) and insoluble pellet (Lane 3)fractions were separated onto a 4-12% Bis-Tris gel and the subsequent nitrocellulosemembrane probed with pAP9143 1:1000 and anti-rabbit secondary (Santa Cruz)1:2000.
4.5.2. Detergent resistant membrane subfractionation
It was initially believed that association with the cytoskeleton was the cause of
Willin’s insolubility. However, disruption of the cytoskeleton did not affect the
membrane localisation of Willin (Gunn-Moore et al., 2005), which raised questions
about how strong this association might be. A literature search for other causes of
insolubility pointed to detergent-resistant membranes (DRMs) as the most likely
candidates for investigation (Brown and London, 2000; Simons and Ehehalt, 2002).
These patches of membrane are high in sphingolipids and cholesterol, leading to tight
packing and resistance to solubilisation by non-ionic detergents (Brown and London,
2000). It was also found that there is precedent for a FERM protein to localise to
DRMs; Stickney et al. (2004) found that Merlin1-GFP localised to lipid rafts, and that
this localisation appeared to be the main cause for its insolubility. It was therefore

102
decided to repeat their experiments using Willin-GFP to determine if lipid raft
localisation could explain the insolubility of Willin. While detergent-based methods
for determining raft association can be prone to artefacts (Kahya et al., 2005),
subfractionation results of this kind can provide at least a basis for further
investigation into potential raft localisation.
Using a detergent-based high speed centrifugation protocol as described in
2.3.12, cells were gently homogenised and subfractionated into nuclear/cellular
debris, cytoplasmic, detergent-soluble membrane and detergent-resistant membrane
(DRM) fractions. For Merlin, localisation to DRMs was supported by fluorescence
microscopy evidence of punctate membrane expression of the GFP-tagged protein.
Willin has also shown this distribution, so DRM extractions under various conditions
were attempted on four cell types for which solubility and localisation data already
existed for Willin-GFP: COS-7, HEK-293, PC12 and SK-UT-1.
4.5.2.1. COS-7 cells express Willin-GFP in DRM
COS-7 cells were grown on 150mm tissue culture dishes and transfected with
20g of pWillin-GFP. Cells were harvested forty-eight hours post-transfection and
S100/P100 fractionation performed as described in section 2.3.13 and fractions P1,
S100, P100s and P100i were boiled in 2X PSB and loaded onto a 4-12% Bis-Tris
NuPage gels. Proteins were then transferred to nitrocellulose membranes and
detected with a mouse monoclonal antibody to GFP and an HRP-conjugated anti-
mouse secondary antibody raised in goat (Figure 4.8). As expected based on previous
microscopy data, Willin-GFP in COS-7 cells expresses almost exclusively in the
DRM fraction, with some faint detergent-soluble membrane and cytoplasmic
expression. P1 is referred to as a nuclear fraction, but while it cannot be proven that it
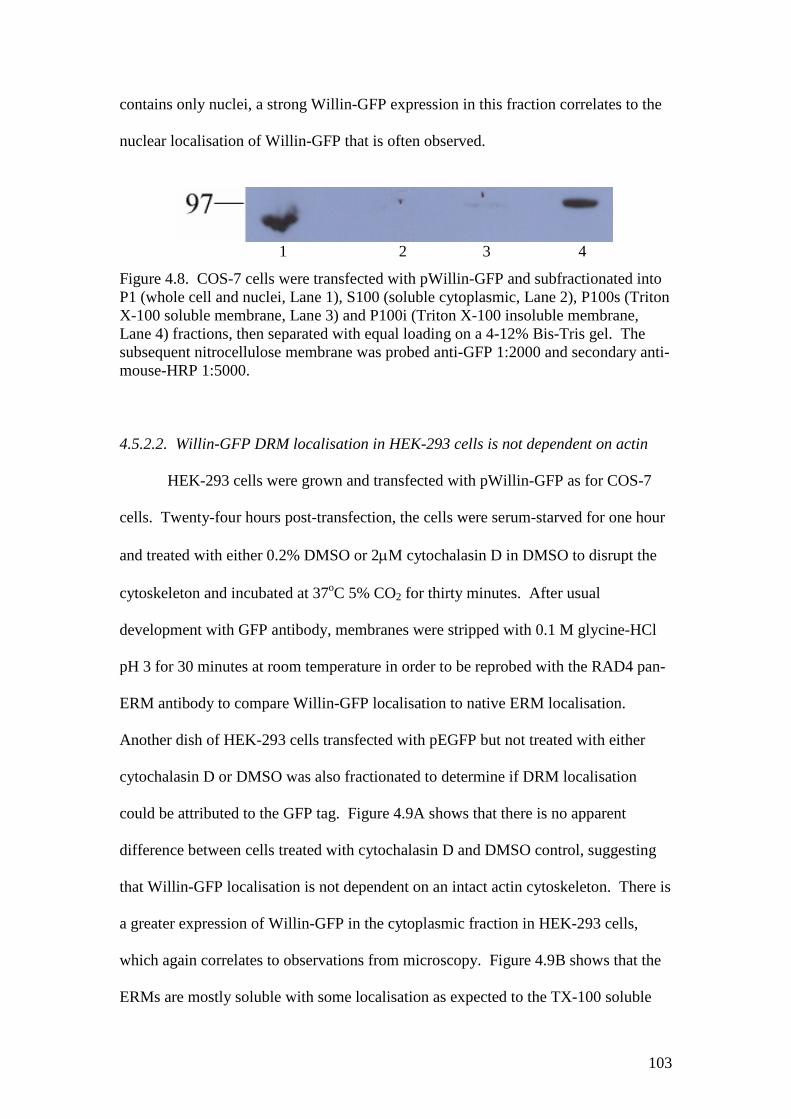
103
contains only nuclei, a strong Willin-GFP expression in this fraction correlates to the
nuclear localisation of Willin-GFP that is often observed.
1 2 3 4
Figure 4.8. COS-7 cells were transfected with pWillin-GFP and subfractionated intoP1 (whole cell and nuclei, Lane 1), S100 (soluble cytoplasmic, Lane 2), P100s (TritonX-100 soluble membrane, Lane 3) and P100i (Triton X-100 insoluble membrane,Lane 4) fractions, then separated with equal loading on a 4-12% Bis-Tris gel. Thesubsequent nitrocellulose membrane was probed anti-GFP 1:2000 and secondary anti-mouse-HRP 1:5000.
4.5.2.2. Willin-GFP DRM localisation in HEK-293 cells is not dependent on actin
HEK-293 cells were grown and transfected with pWillin-GFP as for COS-7
cells. Twenty-four hours post-transfection, the cells were serum-starved for one hour
and treated with either 0.2% DMSO or 2M cytochalasin D in DMSO to disrupt the
cytoskeleton and incubated at 37oC 5% CO2 for thirty minutes. After usual
development with GFP antibody, membranes were stripped with 0.1 M glycine-HCl
pH 3 for 30 minutes at room temperature in order to be reprobed with the RAD4 pan-
ERM antibody to compare Willin-GFP localisation to native ERM localisation.
Another dish of HEK-293 cells transfected with pEGFP but not treated with either
cytochalasin D or DMSO was also fractionated to determine if DRM localisation
could be attributed to the GFP tag. Figure 4.9A shows that there is no apparent
difference between cells treated with cytochalasin D and DMSO control, suggesting
that Willin-GFP localisation is not dependent on an intact actin cytoskeleton. There is
a greater expression of Willin-GFP in the cytoplasmic fraction in HEK-293 cells,
which again correlates to observations from microscopy. Figure 4.9B shows that the
ERMs are mostly soluble with some localisation as expected to the TX-100 soluble
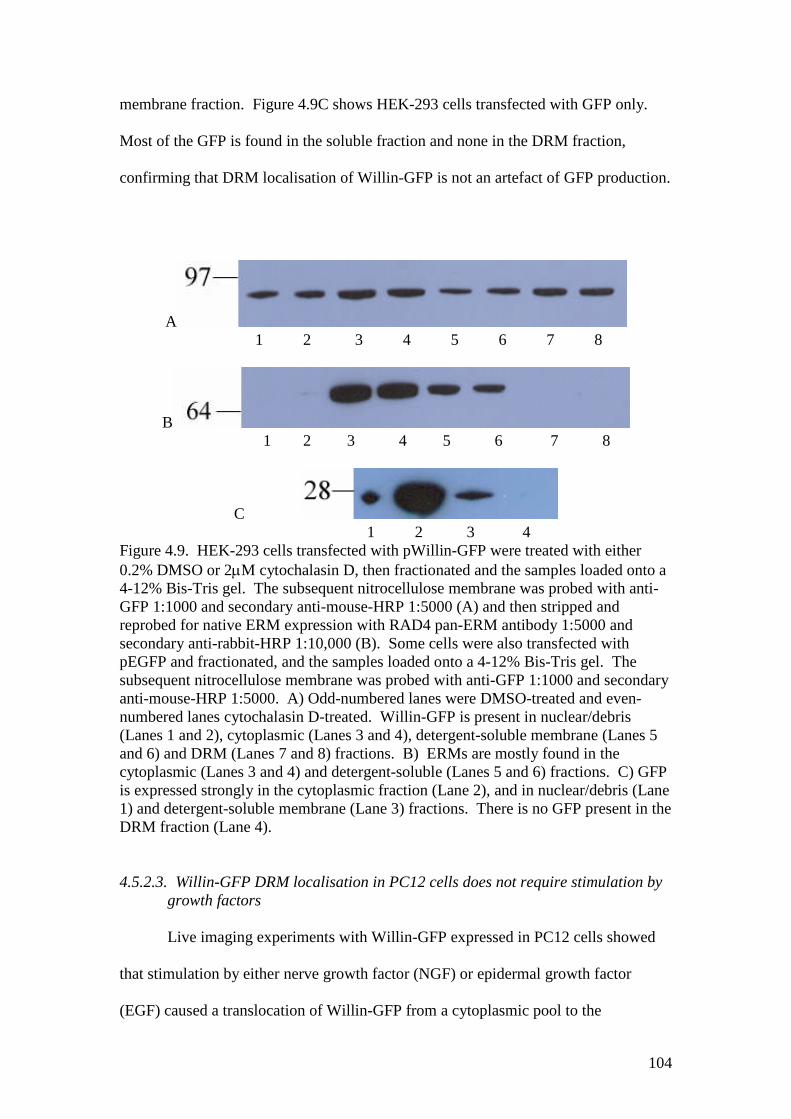
104
membrane fraction. Figure 4.9C shows HEK-293 cells transfected with GFP only.
Most of the GFP is found in the soluble fraction and none in the DRM fraction,
confirming that DRM localisation of Willin-GFP is not an artefact of GFP production.
A1 2 3 4 5 6 7 8
B1 2 3 4 5 6 7 8
C1 2 3 4
Figure 4.9. HEK-293 cells transfected with pWillin-GFP were treated with either0.2% DMSO or 2M cytochalasin D, then fractionated and the samples loaded onto a4-12% Bis-Tris gel. The subsequent nitrocellulose membrane was probed with anti-GFP 1:1000 and secondary anti-mouse-HRP 1:5000 (A) and then stripped andreprobed for native ERM expression with RAD4 pan-ERM antibody 1:5000 andsecondary anti-rabbit-HRP 1:10,000 (B). Some cells were also transfected withpEGFP and fractionated, and the samples loaded onto a 4-12% Bis-Tris gel. Thesubsequent nitrocellulose membrane was probed with anti-GFP 1:1000 and secondaryanti-mouse-HRP 1:5000. A) Odd-numbered lanes were DMSO-treated and even-numbered lanes cytochalasin D-treated. Willin-GFP is present in nuclear/debris(Lanes 1 and 2), cytoplasmic (Lanes 3 and 4), detergent-soluble membrane (Lanes 5and 6) and DRM (Lanes 7 and 8) fractions. B) ERMs are mostly found in thecytoplasmic (Lanes 3 and 4) and detergent-soluble (Lanes 5 and 6) fractions. C) GFPis expressed strongly in the cytoplasmic fraction (Lane 2), and in nuclear/debris (Lane1) and detergent-soluble membrane (Lane 3) fractions. There is no GFP present in theDRM fraction (Lane 4).
4.5.2.3. Willin-GFP DRM localisation in PC12 cells does not require stimulation bygrowth factors
Live imaging experiments with Willin-GFP expressed in PC12 cells showed
that stimulation by either nerve growth factor (NGF) or epidermal growth factor
(EGF) caused a translocation of Willin-GFP from a cytoplasmic pool to the

105
membrane, even in contacting cells which already expressed Willin-GFP in the
membrane to some extent (Gunn-Moore et al., 2005). However, not all transfected
cells responded in this way (Frances Brannigan, personal communication). To test
whether this stimulation was required for a membrane, and thus DRM, localisation,
PC12 cells were transfected with pWillin-GFP, then 48 hours post-transfection,
serum-starved for 3 hours before either no treatment or treatment with 50ng/mL EGF
for about 10 minutes. This time was chosen as it had previously been sufficient for
Willin-GFP translocation under live imaging conditions (Gunn-Moore et al., 2005).
As seen in Figure 4.10, Willin-GFP localises to DRM fractions regardless of growth
factor stimulation. Interestingly, no significant difference was seen between treated
and untreated cells in terms of membrane localisation, but more Willin does seem to
appear in the nuclear fraction.
1 2 3 4 5 6 7 8
Figure 4.10. PC12 cells were transfected with pWillin-GFP and either treated with50ng/mL EGF (even-numbered lanes) or left untreated (odd-numbered lanes). Nosignificant difference is seen between the samples in the cytoplasmic (Lanes 3 and 4),detergent-soluble membrane (Lanes 5 and 6) or DRM (Lanes 7 and 8) fractions, butEGF stimulation may cause a shift of Willin-GFP into the nucleus (Lanes 1 and 2).
4.5.2.4. Willin-GFP floats to a lipid raft fraction of an Optiprep gradient
To further characterise the localisation of Willin to lipid rafts, an Optiprep
gradient centrifugation was performed as described in 2.3.13. HEK-293 cells were
lysed and centrifuged for at least 16 hours at 100,000xg at 4oC in a continuous
Optiprep gradient ranging from 0% to 40% Optiprep. 800L fractions representing
0%, 20%, 25%, 30%, 35% and 40% were then taken and run on SDS-PAGE for
Western blotting. Merlin1-GFP has been found to float to 20% and 25% fractions
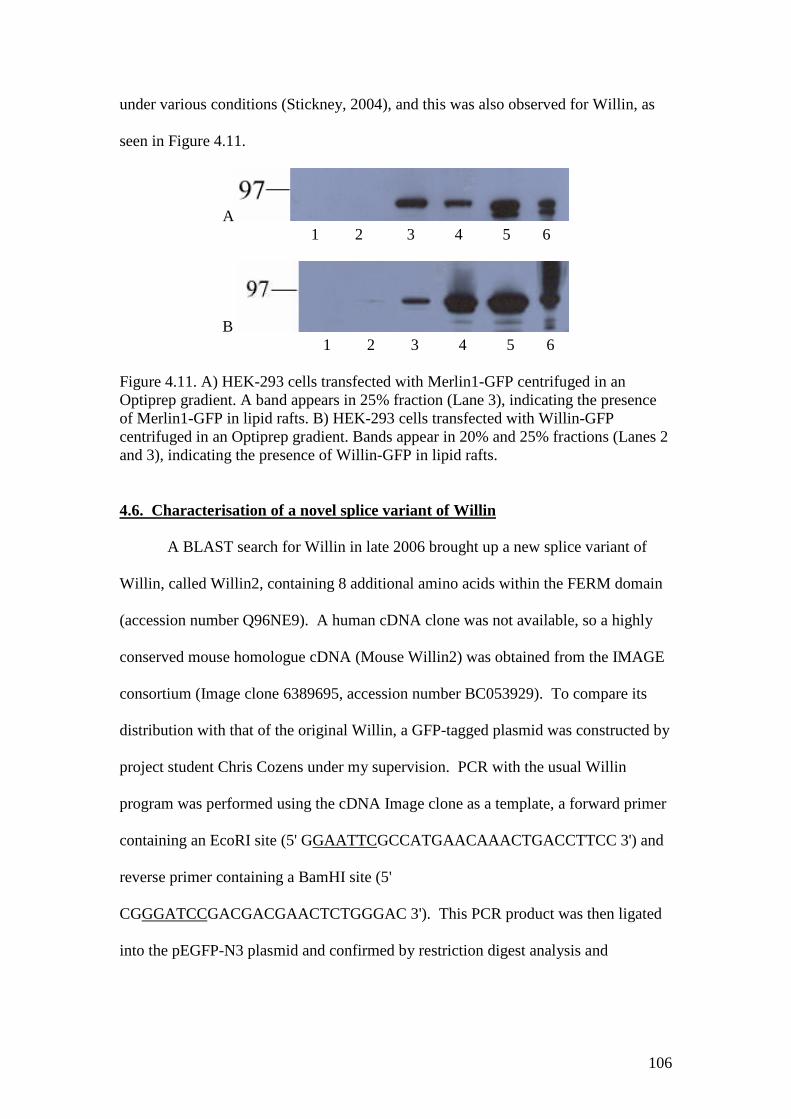
106
under various conditions (Stickney, 2004), and this was also observed for Willin, as
seen in Figure 4.11.
A1 2 3 4 5 6
B1 2 3 4 5 6
Figure 4.11. A) HEK-293 cells transfected with Merlin1-GFP centrifuged in anOptiprep gradient. A band appears in 25% fraction (Lane 3), indicating the presenceof Merlin1-GFP in lipid rafts. B) HEK-293 cells transfected with Willin-GFPcentrifuged in an Optiprep gradient. Bands appear in 20% and 25% fractions (Lanes 2and 3), indicating the presence of Willin-GFP in lipid rafts.
4.6. Characterisation of a novel splice variant of Willin
A BLAST search for Willin in late 2006 brought up a new splice variant of
Willin, called Willin2, containing 8 additional amino acids within the FERM domain
(accession number Q96NE9). A human cDNA clone was not available, so a highly
conserved mouse homologue cDNA (Mouse Willin2) was obtained from the IMAGE
consortium (Image clone 6389695, accession number BC053929). To compare its
distribution with that of the original Willin, a GFP-tagged plasmid was constructed by
project student Chris Cozens under my supervision. PCR with the usual Willin
program was performed using the cDNA Image clone as a template, a forward primer
containing an EcoRI site (5' GGAATTCGCCATGAACAAACTGACCTTCC 3') and
reverse primer containing a BamHI site (5'
CGGGATCCGACGACGAACTCTGGGAC 3'). This PCR product was then ligated
into the pEGFP-N3 plasmid and confirmed by restriction digest analysis and
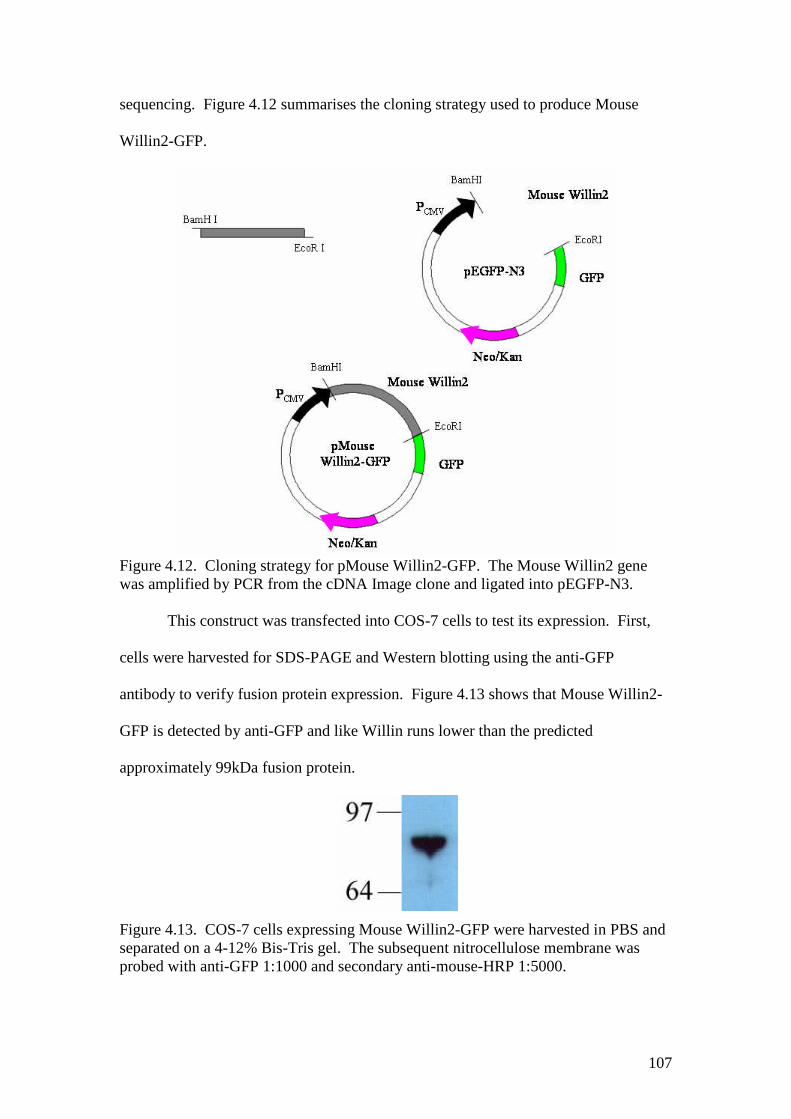
107
sequencing. Figure 4.12 summarises the cloning strategy used to produce Mouse
Willin2-GFP.
Figure 4.12. Cloning strategy for pMouse Willin2-GFP. The Mouse Willin2 genewas amplified by PCR from the cDNA Image clone and ligated into pEGFP-N3.
This construct was transfected into COS-7 cells to test its expression. First,
cells were harvested for SDS-PAGE and Western blotting using the anti-GFP
antibody to verify fusion protein expression. Figure 4.13 shows that Mouse Willin2-
GFP is detected by anti-GFP and like Willin runs lower than the predicted
approximately 99kDa fusion protein.
Figure 4.13. COS-7 cells expressing Mouse Willin2-GFP were harvested in PBS andseparated on a 4-12% Bis-Tris gel. The subsequent nitrocellulose membrane wasprobed with anti-GFP 1:1000 and secondary anti-mouse-HRP 1:5000.

108
Cells grown on coverslips were also transfected and fixed for confocal
microscopy. Figure 4.14 shows the expression of Mouse Willin2-GFP, which is
strikingly different from Willin. Cytoplasmic distribution is more evenly spread, and
there is heavy nuclear staining, while little to no membrane staining is observed.
A
B
Figure 4.14. A) COS-7 cell expressing Mouse Willin2-GFP. Maximum projection of14 optical sections acquired with a Leica TCS4D confocal microscope, assembledusing LCS Lite V2.5 Build 1347 and cropped with Adobe Photoshop 7.0 (no otherpost-processing). B) COS-7 cell expressing Willin-GFP. Maximum projection of 10optical sections acquired as above.

109
4.7. Discussion
4.7.1. The effect of Willin on cultured cells
In this laboratory, it had been anecdotally observed that overexpression of
Willin-GFP seemed to cause a high level of cell death after 48 hours compared to
controls with transfection reagent only. A large tag such as GFP also raises concerns
that the protein will not be properly targeted, a concern compounded by the problems
of overexpression. To address some of these questions and to have an additional tool
for the characterisation of Willin, a pWillin-FLAG construct was produced as
described in section 4.2. This fusion protein, with only a very small tag, displays a
comparable intracellular distribution to that of Willin-GFP (Figure 4.3), and again,
casual observation of transfected cells more than 48 hours post-transfection seemed to
show increased levels of cell death compared to control. This data eased fears about
the effect of the GFP tag alone, but did not answer questions about overexpression,
and thus an attempt was made to produce stable cell lines expressing both Willin-GFP
and Willin-FLAG (section 4.3). Unfortunately, these cell lines were unsuccessful,
with low transfection rates, slow recovery and most G-418-resistant cells expressing
little or no detectable protein 1-2 months post-transfection. This suggests that
cultured cells are not able to tolerate long-term expression of Willin, adding further
evidence that Willin may be a growth suppressor. Indeed, attempts to create stable
cell lines with Merlin1 have had similar outcomes due to the growth suppressive
functions of that protein (Wally Ip, personal communication).
While this circumstantial evidence of Willin's function was interesting, it was
necessary to quantify the effect. To that end, cell counts were performed comparing
Willin-GFP with 2 related proteins: Merlin1-GFP, a known growth suppressor, and
GFP-Moesin, a known growth promoter. COS-7 cells were transfected with one of
110
the three proteins and blind cell counts performed. Though the sample numbers are
still small, these initial counts indicate a real effect of Willin overexpression
increasing the rate of apoptosis in cultured cells (Figure 4.6). Further counts must be
done to achieve statistical validity of these results, and a more objective test for
apoptosis, such as the TUNEL assay, performed as well. It would also be worthwhile
including GFP alone in the cell counts, in order to establish baseline toxicity of the tag
and provide a better idea of whether Merlin1 and Willin are causing increased cell
death compared to GFP; this will also address whether Moesin might have a
protective role compared to GFP. It is also worth noting that an initial cell viability
test using the MTT assay was performed by Jessica Davis, and showed reduced
viability in cells expressing Willin-GFP compared to cells expressing Merlin1-GFP or
GFP alone. Again this would need to be repeated with all proper controls in place,
but provides more circumstantial evidence to support the hypothesis that Willin
expression can increase levels of cell death.
4.7.2. Willin-DsRed2
A Willin construct with a red fluorescent tag was desireable for co-localisation
studies with other proteins, such as Merlin1 and Ezrin, for which we have GFP-tagged
versions. Such co-localisation experiments have been done for DMerlin and
expanded using antibodies (McCartney et al., 2000), but as strong antibodies are not
available in this case, fluorescent tags provide the most straightforward possibilities.
Unfortunately, DsRed2 was not found to be an appropriate tag for this purpose, but
subsequently a pWillin-mCherry construct has been produced by Andrew Robertson,
and this looks more promising for co-expression experiments.
111
4.7.3. Willin interaction with lipid rafts
Three different methods (RIPA extraction, DRM subfractionation and
Optiprep subfractionation) have shown that Willin can localise to detergent resistant
membranes. Further experiments with antibodies against lipid raft-specific and
caveolae-specific proteins are required to determine which DRM subtype contains
Willin. The issue of overexpression must also be addressed, as it cannot be ruled out
that this DRM localisation is an overexpression artifact until native protein has been
tested in the same way. The lack of a strong antibody precludes this at the moment,
though the weakly expressing stable cell lines may be suitable for this purpose if used
at an early enough passage number. It is interesting that neurofascin155 has been
found in lipid rafts, both by other groups (see section 1.2.4.2) and in our hands (data
not shown), as this could provide a physiological location for the interaction of
neurofascin155 and Willin.
PI(4,5)P2 has also been found in cholesterol-enriched domains (Epand et al.,
2004), providing another possible lipid raft binding partner for Willin; GST-Willin
had previously been shown to interact with phospholipids (Gunn-Moore et al., 2005),
but it is not known how this interaction takes place. Barret et al. (2000) determined
that a conserved motif in the ERMs, identified as KK(X)nK/RK, was responsible for
PI(4,5)P2 binding. A comparable site was identified in Willin at residues 327-336:
RKLEENEEKK. To determine whether this sequence was involved in lipid binding,
three sequentially truncated constructs were cloned, with the digits indicating number
of amino acids present: pGST-Willin239, containing only the FERM domain of
Willin; pGST-Willin322, truncated just before the putative site; and pGST-
Willin356, truncated shortly after the putative site. Figure 4.15 shows the cloning
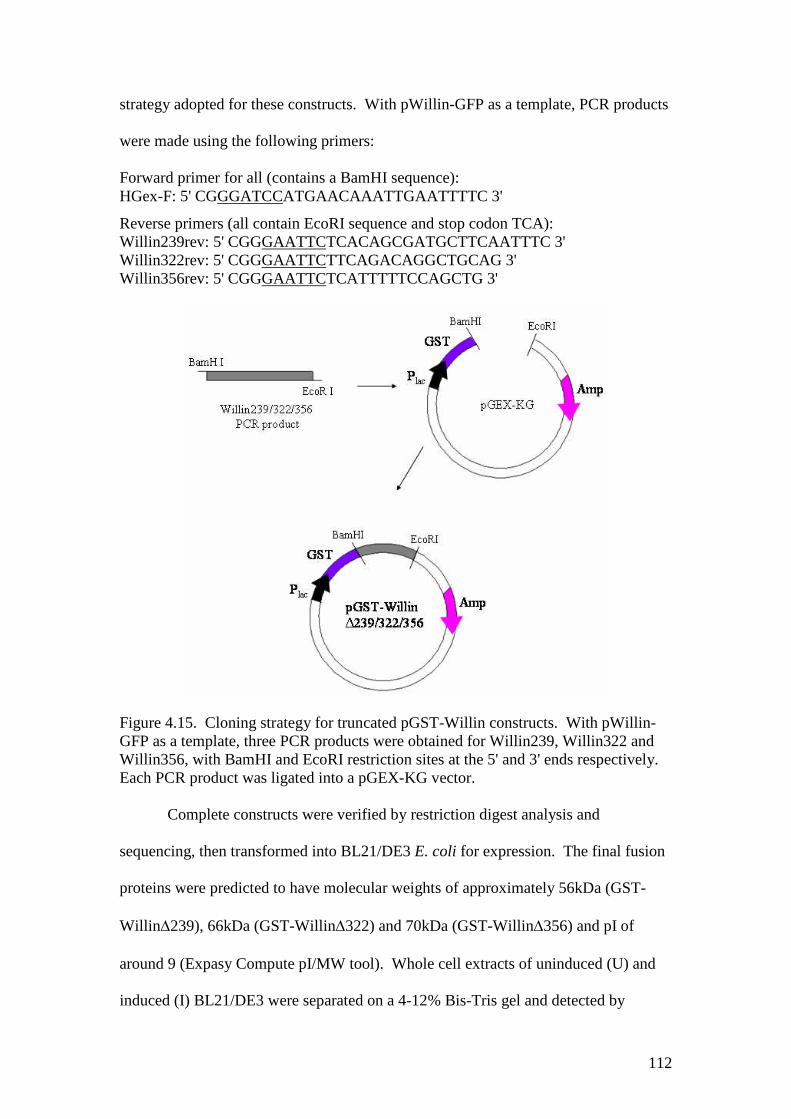
112
strategy adopted for these constructs. With pWillin-GFP as a template, PCR products
were made using the following primers:
Forward primer for all (contains a BamHI sequence):HGex-F: 5' CGGGATCCATGAACAAATTGAATTTTC 3'
Reverse primers (all contain EcoRI sequence and stop codon TCA):Willin239rev: 5' CGGGAATTCTCACAGCGATGCTTCAATTTC 3'Willin322rev: 5' CGGGAATTCTTCAGACAGGCTGCAG 3'Willin356rev: 5' CGGGAATTCTCATTTTTCCAGCTG 3'
Figure 4.15. Cloning strategy for truncated pGST-Willin constructs. With pWillin-GFP as a template, three PCR products were obtained for Willin239, Willin322 andWillin356, with BamHI and EcoRI restriction sites at the 5' and 3' ends respectively.Each PCR product was ligated into a pGEX-KG vector.
Complete constructs were verified by restriction digest analysis and
sequencing, then transformed into BL21/DE3 E. coli for expression. The final fusion
proteins were predicted to have molecular weights of approximately 56kDa (GST-
Willin239), 66kDa (GST-Willin322) and 70kDa (GST-Willin356) and pI of
around 9 (Expasy Compute pI/MW tool). Whole cell extracts of uninduced (U) and
induced (I) BL21/DE3 were separated on a 4-12% Bis-Tris gel and detected by

113
Western blot as usual with the pAP9134 antibody. Figure 4.16 shows that all three
proteins (indicated by arrows) are expressed, though as with other Willin fusion
proteins, have a lower observed molecular weight than predicted.
U I U I U I
1 2 3 4 5 6
Figure 4.16. Whole cell extract from IPTG induced BL21/DE3 pGST-Willin cellswas separated on a 4-12% Bis-Tris SDS-PAGE gel. The subsequent nitrocellulosemembrane was probed with pAP9143 1:1000 and secondary anti-rabbit-HRP 1:2000(Santa Cruz). GST-Willin239 (Lanes 1 and 2), GST-Willin322 (Lanes 3 and 4) andGST-Willin356 (Lanes 5 and 6) samples show high expression levels when inducedby IPTG.
Although the three proteins were successfully expressed, purification and
storage have been more problematic, and due to time constraints, lipid binding assays
have not yet been performed. However, these constructs can be used in fat blot assays
(Gunn-Moore et al., 2005) and, if successful, similar constructs could be produced for
use in mammalian systems to see if lipid raft association changes.
It should be noted that the lipid raft hypothesis is not without controversy due
to its inconsistency of application; the localisation of some proteins to lipid rafts has
been controversial because some methods have placed them within rafts while others
have placed them elsewhere, there is no standard for detergent:lipid ratios or even
necessarily which detergents are best suited for raft extraction, and some data even
suggest that detergent extraction itself creates separate lipid domains that are not
natively present (Edidin, 2003). Detergent-free methods (Macdonald and Pike, 2005)
are available, howevever, so further investigations should also include such a method.

114
4.7.4. Initial characterisation of Willin2
The identification of a novel splice variant of Willin was intriguing,
particularly as the octapeptide (VRQYEVTW) difference between the human forms
of the two proteins is situated part way through the sequence to which the antibodies
9143 and WR were designed (see section 3.5.1). Unfortunately a human Image
clone was not available, so a mouse clone was obtained instead. Though there are
some substitutions in individual amino acids throughout the sequences, the mouse
version is highly conserved compared to the human sequence (see Appendix 1),
particularly in the region around the octapeptide insert. It was therefore hoped that
the mouse version could give some idea as to how the octapeptide addition might
affect the behaviour and distribution of the protein. Initial imaging shows that this
version may have a stronger nuclear localisation than the 614 amino acid form,
though why this might be the case is unknown. Quantitative analysis of cells
expressing both versions must be performed to see if the localisation difference is
statistically signficant. Short sequences can be very important to protein localisation,
for example the RSLE motif in L1 (see section 1.2.1) found only in neurons; it is
possible that in certain cell types this motif is expressed, which could explain why
9143 and WR have been largely unsuccessful in detecting native proteins.
Difference in localisation and behaviour between human and mouse forms of Willin2
cannot be ruled out, however, so it will be desireable to obtain a human clone when
one becomes available.

115
4.8. Conclusion
The continued study of Willin localisation and behaviour in cells has identified
several interesting possibilities for further investigation. Due to technical challenges
and time constraints, only initial experiments have been performed for these lines of
inquiry, but with the tools produced during the course of this project it is hoped that
future work will elucidate the mechanisms of action only partially revealed so far.

116
CHAPTER 5: INVESTIGATIONS INTO THE
BINDING PARTNERS OF WILLIN

117
Chapter 5: Investigations into binding partners of Willin
5.1 Introduction
Proteins do not work alone to produce their effects, but are part of signalling
cascades and protein complexes that are constantly adjusting to stimuli to affect
cellular processes. Elucidating binding partners of a novel protein can provide clues
to its function and behaviour. In the case of Willin there were two goals: first, to
confirm three putative binding partners: neurofascin 155, actin and Merlin; and
second, to screen for novel binding partners. As Willin was first discovered in a yeast
two-hybrid screen of neurofascin 155, it was desired to confirm this reaction. Also,
Willin co-localises with actin in cultured cells and the ERM proteins are known to
bind actin, so this also seemed a likely interaction to study. Finally, the Drosophila
homologue of Merlin interacts with Expanded, the putative Drosophila homologue of
Willin; thus, it may be expected that the mammalian versions could also interact.
Several biochemical methods were used to investigate these interactions, including
tandem affinity purification (TAP) and co-immunoprecipitation. To screen for novel
partners, two methods were to be attempted, namely yeast two-hybrid and TAP.
5.2 Confirmation of L1 family binding using the yeast two-hybrid method
The yeast two-hybrid method of detecting protein-protein interactions in yeast
nucleus was first developed in 1989 by Fields and Song as an in vivo alternative to
biochemical methods. The yeast Saccharomyces cerevisiae uses the transcriptional
activator Gal4 to regulate expression of enzymes involved in galactose utilisation; Gal4
has two separate functional domains, one that recognises and binds to the promoter and
another that activates transcription. These components, however, do not need to be
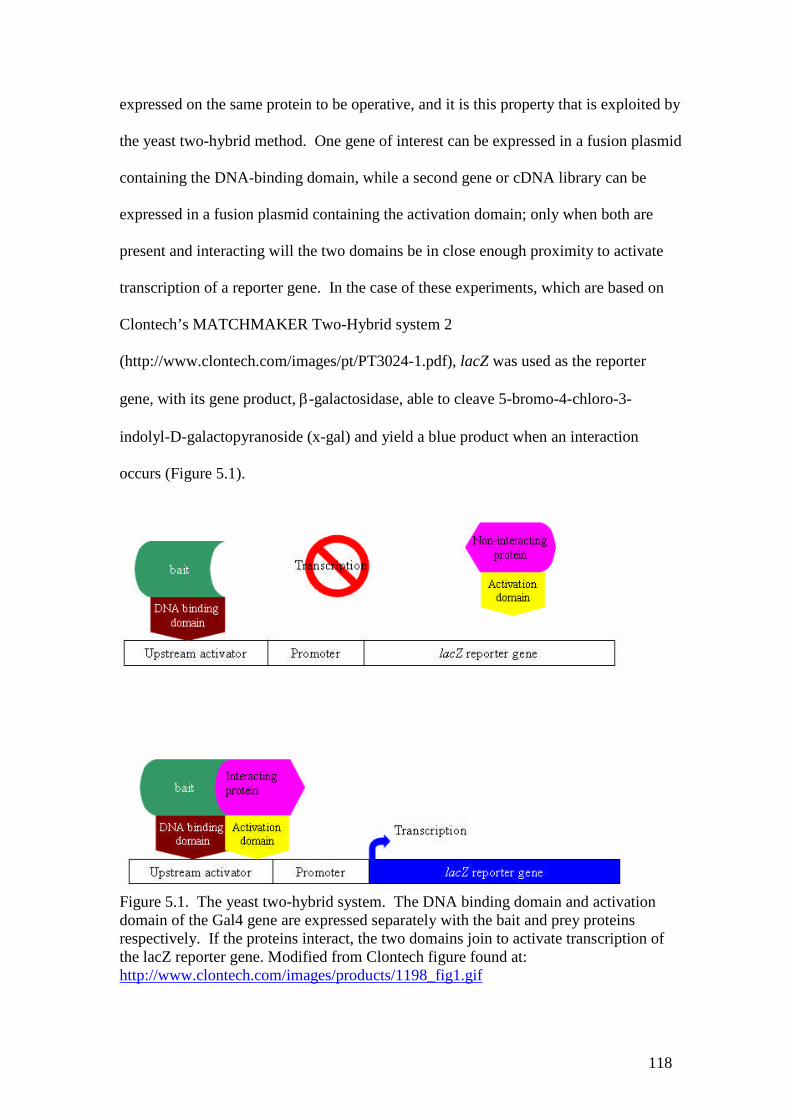
118
expressed on the same protein to be operative, and it is this property that is exploited by
the yeast two-hybrid method. One gene of interest can be expressed in a fusion plasmid
containing the DNA-binding domain, while a second gene or cDNA library can be
expressed in a fusion plasmid containing the activation domain; only when both are
present and interacting will the two domains be in close enough proximity to activate
transcription of a reporter gene. In the case of these experiments, which are based on
Clontech’s MATCHMAKER Two-Hybrid system 2
(http://www.clontech.com/images/pt/PT3024-1.pdf), lacZ was used as the reporter
gene, with its gene product, -galactosidase, able to cleave 5-bromo-4-chloro-3-
indolyl-D-galactopyranoside (x-gal) and yield a blue product when an interaction
occurs (Figure 5.1).
Figure 5.1. The yeast two-hybrid system. The DNA binding domain and activationdomain of the Gal4 gene are expressed separately with the bait and prey proteinsrespectively. If the proteins interact, the two domains join to activate transcription ofthe lacZ reporter gene. Modified from Clontech figure found at:http://www.clontech.com/images/products/1198_fig1.gif
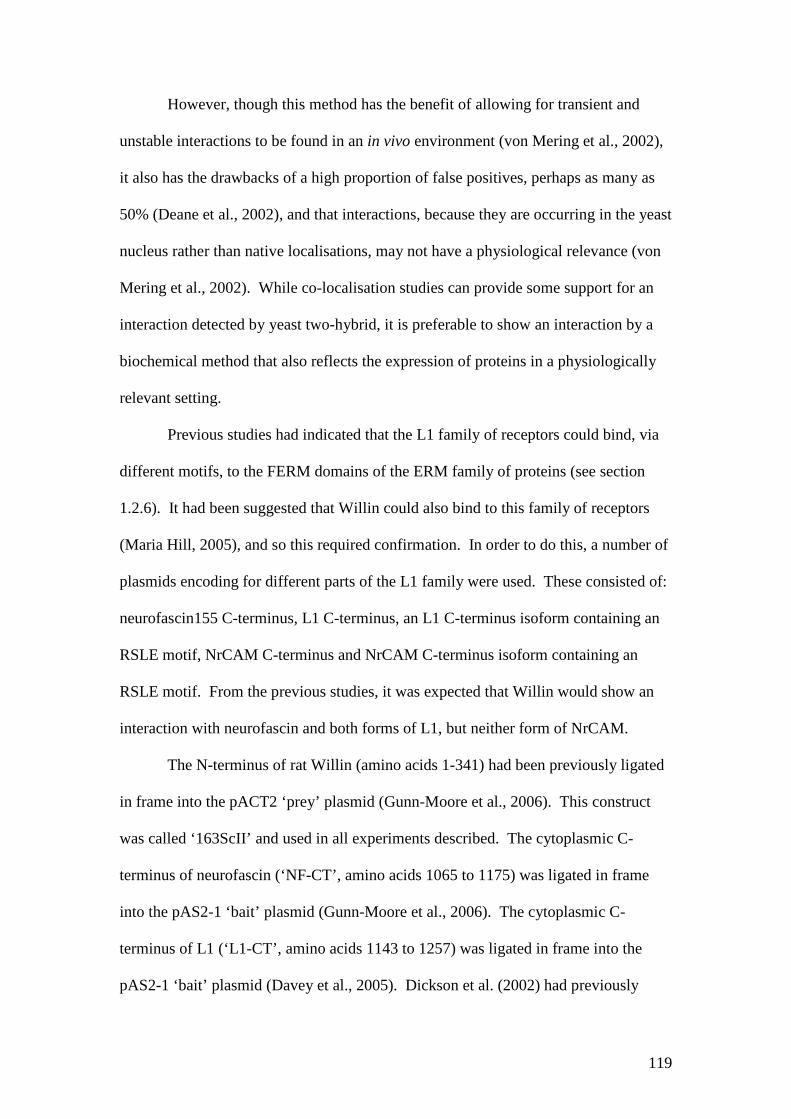
119
However, though this method has the benefit of allowing for transient and
unstable interactions to be found in an in vivo environment (von Mering et al., 2002),
it also has the drawbacks of a high proportion of false positives, perhaps as many as
50% (Deane et al., 2002), and that interactions, because they are occurring in the yeast
nucleus rather than native localisations, may not have a physiological relevance (von
Mering et al., 2002). While co-localisation studies can provide some support for an
interaction detected by yeast two-hybrid, it is preferable to show an interaction by a
biochemical method that also reflects the expression of proteins in a physiologically
relevant setting.
Previous studies had indicated that the L1 family of receptors could bind, via
different motifs, to the FERM domains of the ERM family of proteins (see section
1.2.6). It had been suggested that Willin could also bind to this family of receptors
(Maria Hill, 2005), and so this required confirmation. In order to do this, a number of
plasmids encoding for different parts of the L1 family were used. These consisted of:
neurofascin155 C-terminus, L1 C-terminus, an L1 C-terminus isoform containing an
RSLE motif, NrCAM C-terminus and NrCAM C-terminus isoform containing an
RSLE motif. From the previous studies, it was expected that Willin would show an
interaction with neurofascin and both forms of L1, but neither form of NrCAM.
The N-terminus of rat Willin (amino acids 1-341) had been previously ligated
in frame into the pACT2 ‘prey’ plasmid (Gunn-Moore et al., 2006). This construct
was called ‘163ScII’ and used in all experiments described. The cytoplasmic C-
terminus of neurofascin (‘NF-CT’, amino acids 1065 to 1175) was ligated in frame
into the pAS2-1 ‘bait’ plasmid (Gunn-Moore et al., 2006). The cytoplasmic C-
terminus of L1 (‘L1-CT’, amino acids 1143 to 1257) was ligated in frame into the
pAS2-1 ‘bait’ plasmid (Davey et al., 2005). Dickson et al. (2002) had previously

120
shown that the presence of an RSLE motif in the C-terminus of L1 allowed for Ezrin
binding; this motif is spliced out of L1 in non-neuronal cells, but a naturally occurring
isoform including RSLE exists and is differentially sorted to the growth cones of
neurons (Kamiguchi et al., 1998). It was thought that the RSLE motif might cause a
stronger interaction between L1 and Willin. A pAS2-1 ‘bait’ plasmid encoding the
L1 C-terminus with RSLE motif (‘L1-RSLE’, amino acids 1146-1259) was previously
produced by Maria Hill. NrCAM had been found not to bind Ezrin, contrary to
expectations based on co-localisation studies. This is thought to be due to an amino
acid substitution in the potential FERM binding site of NrCAM, which introduces a
proline and thus a cyclic pyrrolidine side group that causes a ‘kink’ in the structure of
the protein (Hill, 2005). However, to establish whether Willin was similarly affected,
the experiment was repeated using a pAS2-1 ‘bait’ plasmid encoding the NrCAM C-
terminus (‘NrCAM-CT’, amino acids 1102-1215), produced by Maria Hill. Like L1,
NrCAM also has naturally occuring isoforms with an RSLE motif present; this exon is
also usually spliced out (Dry et al., 2001), but the chick version of NrCAM preserves
the RSLE motif, and was thus used to clone into a pAS2-1 ‘bait’ plasmid by Maria
Hill (‘NrCAM-RSLE’, amino acids 1166-1260). The C-terminus of NrCAM in
pAS2-1, described above, co-transformed with full-length (amino acids 1-835)
SAP102 subcloned into the pACT2 vector, was used as a positive control, as these are
known interactants (Davey et al., 2005). A summary of the constructs is shown in
Figure 5.2.
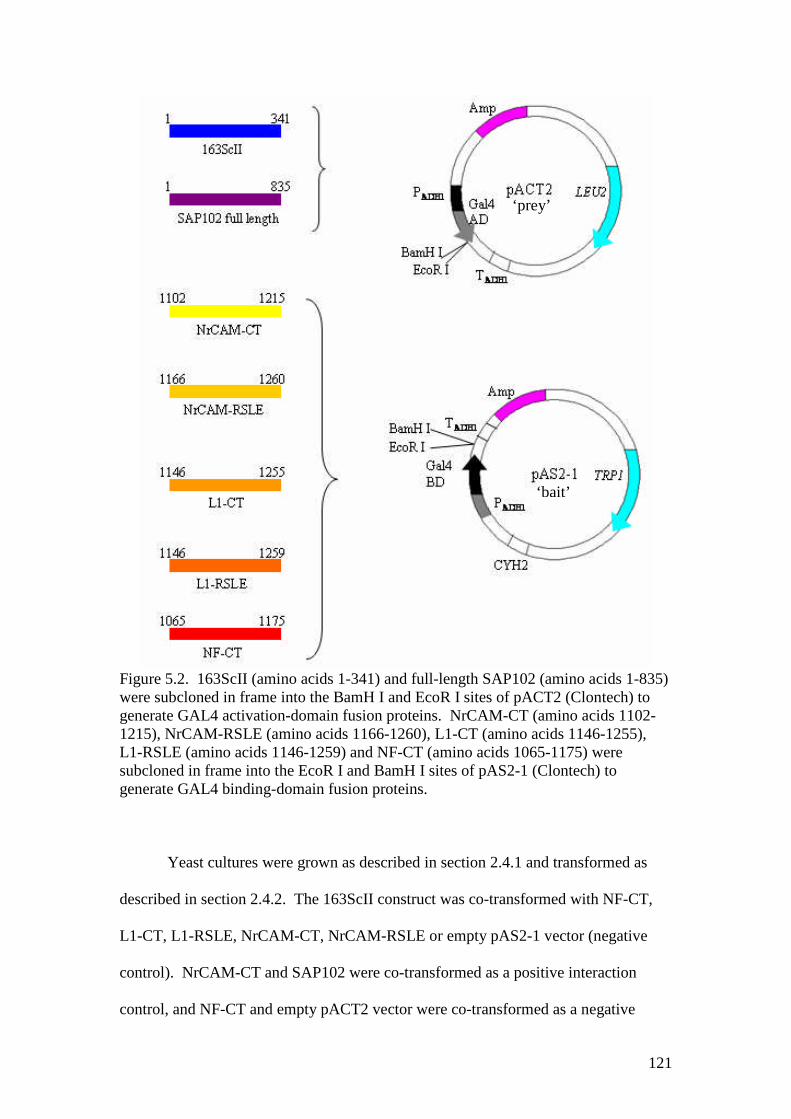
Figure 5.2. 163ScII (amino acids 1-341) and full-length SAP10were subcloned in frame into the BamH I and EcoR I sites of pAgenerate GAL4 activation-domain fusion proteins. NrCAM-CT1215), NrCAM-RSLE (amino acids 1166-1260), L1-CT (aminoL1-RSLE (amino acids 1146-1259) and NF-CT (amino acids 10subcloned in frame into the EcoR I and BamH I sites of pAS2-1generate GAL4 binding-domain fusion proteins.
Yeast cultures were grown as described in section 2.4.1 a
described in section 2.4.2. The 163ScII construct was co-transfo
L1-CT, L1-RSLE, NrCAM-CT, NrCAM-RSLE or empty pAS2
control). NrCAM-CT and SAP102 were co-transformed as a po
control, and NF-CT and empty pACT2 vector were co-transform
‘prey’
121
2 (amino acids 1-835)CT2 (Clontech) to(amino acids 1102-acids 1146-1255),65-1175) were(Clontech) to
nd transformed as
rmed with NF-CT,
-1 vector (negative
sitive interaction
ed as a negative
‘bait’

122
control. Transformed yeast were grown on Trp-Leu- agar plates and left to grow for
2-5 days at 30oC; a filter lift assay positive control was also plated to ensure the X-gal
was active. Once colonies were present, the filter lift assay was performed (section
2.4.3). Plates were checked at 30 minutes, 1 hour, then each subsequent hour up to 6
hours, and the appearance of blue colour noted at each time point. Table 5.1 shows a
summary of the results of these experiments. The scoring system represents the time
taken for the development of blue colonies in a -galactosidase filter lift assay; ++++,
< 30 min; +++, 30–60 min, ++, 1–2 h, +, 2–6 h, – > 6 h. 163ScII was found to
interact strongly with NF-CT and weakly with both forms of L1. This is in contrast to
Ezrin, which required the RSLE motif to bind L1, indicating that Willin probably
binds to a different FERM binding motif of L1 (Cheng et al., 2005). Like Ezrin,
Willin did not interact with NrCAM. Negative controls did not show colour change,
but the NrCAM-SAP102 positive control showed the same level of interaction as
previously reported (Davey et al., 2005).
NF-CT L1-CT L1-RSLE NrCAM-CTNrCAMRSLE pAS2-1
(1065-1175)
(1146-1255)
(1146-1259) (1102-1215) (1166-1260)
163ScII ++++ ++ ++ - - -
pACT-2 -
SAP102 ++
Table 5.1. The interaction of rat N-terminal Willin with C-terminal fragments ofdifferent members of the L1 family, based on colour change in a -galactosidase filterlift assay. ++++, < 30 min; +++, 30–60 min, ++, 1–2 h, +, 2–6 h, – > 6 h

123
5.3 Confirmation of neurofascin 155 binding using the TAP method
With promising yeast two-hybrid data in hand, it was determined that further
interaction studies were desirable, with two goals in mind: first, to confirm the
positive interaction between Willin and neurofascin using biochemical studies in
mammalian cells and co-localisation studies with fluorescent tags and
immunocytochemistry; and second, potentially to screen for new binding partners.
The TAP method was first developed by Rigaut, et. al. (1999) as a method of rapidly
purifying protein complexes under physiological conditions as close to the native
level of protein expression as possible. These complexes could then be analysed by
mass spectroscopy to determine complex partners. The system began in yeast, but the
principle has since been applied to mammalian cells as well (Knuesel et al., 2003;
Forler et al., 2002). Unlike yeast two-hybrid, which only shows one interaction at a
time, with TAP whole complexes can be identified by mass spectrometry. It was
hoped that using this method, binding partners for Willin could be discovered and
putative binding partners confirmed. With the TAP method a screen could occur in
mammalian cell lines in a physiologically relevant setting and, if stable cell lines
could be produced, an expression level closer to native than a transient transfection
would allow. This method, if successful, takes less time than a yeast two-hybrid
screen as well. Finally, it was hoped that by co-transfecting a TAP-tagged Willin
with neurofascin 155, a pulldown experiment that was not dependant on antibodies
could be performed.
5.3.1 Construction of the Willin-pIRESpuro2 CBP/TEV protein A plasmid
The pIRESpuro2 CBP/TEV protein A TAP vector was a kind gift from
Professor Ron Hay. This vector has two affinity tags for purification: protein A,

124
which binds to IgG beads for the first purification step, followed by a tobacco etch
virus (TEV) protease cleavage site to release the protein complex and then a
calmodulin binding protein (CBP) sequence for the second purification (Figure 5.3).
A C-terminal tag was selected to avoid any potential masking of the FERM domain,
and the success of a C-terminal tag had already been shown with Willin-GFP.
Figure 5.3. The tandem affinity purification method. Tagged bait protein is expressedin cells and the binding complex is purified in two steps; first, by Protein A binding toIgG beads, followed by TEV protease cleavage and second purification by calmodulinbinding peptide binding to calmodulin beads.
To produce this DNA construct, a cloning strategy was developed and is
outlined in Figure 5.4. PCR was done as described in section 2.1.1 with forward
primer 5’ACCATGGACAAATTGAATTTTCATAAC 3’ and reverse primer
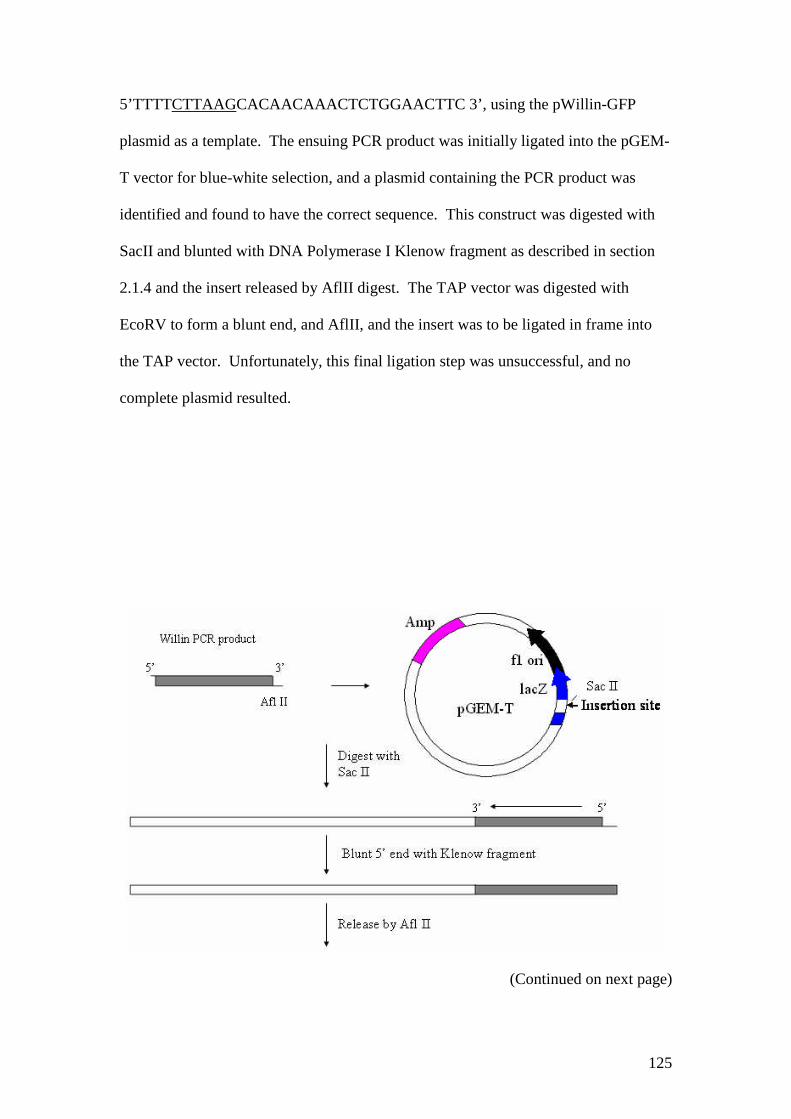
125
5’TTTTCTTAAGCACAACAAACTCTGGAACTTC 3’, using the pWillin-GFP
plasmid as a template. The ensuing PCR product was initially ligated into the pGEM-
T vector for blue-white selection, and a plasmid containing the PCR product was
identified and found to have the correct sequence. This construct was digested with
SacII and blunted with DNA Polymerase I Klenow fragment as described in section
2.1.4 and the insert released by AflII digest. The TAP vector was digested with
EcoRV to form a blunt end, and AflII, and the insert was to be ligated in frame into
the TAP vector. Unfortunately, this final ligation step was unsuccessful, and no
complete plasmid resulted.
(Continued on next page)

126
Figure 5.4. The initial cloning strategy for Willin-pIRESpuro2 CBP/TEV protein A.PCR was performed with pWillin-GFP as a template, and the ensuing PCR productwas initially subcloned into the pGEM-T vector for blue-white selection. Once aplasmid was identified and found to have the correct sequence, it was digested withSacII restriction enzyme and the 5’ end blunted with the DNA Polymerase I Klenowfragment. The insert was released from the plasmid by AflII digestion, and was to beligated into the pIRESpuro2 CBP/TEV protein A TAP vector, which had beendigested with EcoRV to produce a matching blunt end and AflII to produce amatching sticky end. However, this final ligation was unsuccessful.
Therefore, a new cloning strategy was developed and is outlined in Figure 5.5.
Primers were designed to allow cloning with ClaI (5’
CCATCGATATGGACAAATTGAATTTTCATA 3’) and NheI (5’
CACTCGATCGCACAACAAACTCTGGAACTT 3’). ClaI is sensitive to Dam
methylation, so to use this restriction site the TAP vector had to be transformed into
the dam-/dcm- strain of E. coli (New England Biolabs) and then digested with ClaI

127
and NheI. It was hoped that this insert could be ligated directly into the TAP vector,
but again, despite several attempts, no complete plasmid was produced.
Figure 5.5. The second cloning strategy for Willin-pIRESpuro2 CBP/TEV protein A.The full-length Willin gene was to be ligated into the pIRESpuro2 CBP/TEV proteinA TAP vector using the ClaI and NheI restriction sites, but the ligation wasunsuccessful.
5.3.2 Construction of the Willin Stratagene CTAP A plasmid
Fortunately at this time a commercial TAP vector became available from
Stratagene; this system had a more convenient multiple cloning site, allowing for
easier cloning than before, and used streptavidin binding protein (SBP) and
calmodulin binding protein (CBP) as the ~8kDa affinity purification tags, making a
smaller tag without a cleavage step to reduce protein loss (Figure 5.6).

128
Figure 5.6. The Stratagene tandem affinity purification method. Tagged bait protein isexpressed in cells and the binding complex is purified in two steps; first, byStreptavidin binding peptide binding to streptavidin beads, then by calmodulinbinding peptide binding to calmodulin beads.
The multiple cloning site and frame for the pCTAP A vector is identical to that
of the pCMV Tag4A vector used previously to make the pWillin-FLAG construct (see
section 4.2.1); therefore the same inserts could be used to make a fusion protein with
the SBP/CBP tag on the C-terminus of Willin without the need of performing PCR.
First, pWillin-FLAG was digested with SacI and BamHI to release two fragments of
the Willin gene. The shorter C-terminal fragment of the Willin gene was ligated into
the pCTAP A vector, which had been digested with SacI and BamHI, and this partial
plasmid was confirmed by restriction digest analysis. The vector was then digested
again with only SacI and the longer N-terminal fragment of Willin was ligated into it.

129
Restriction digest analysis was used to confirm the presence of both fragments in the
correct orientation, and the plasmid was also sequenced. This cloning strategy is
described in Figure 5.7.
(Continued on next page)
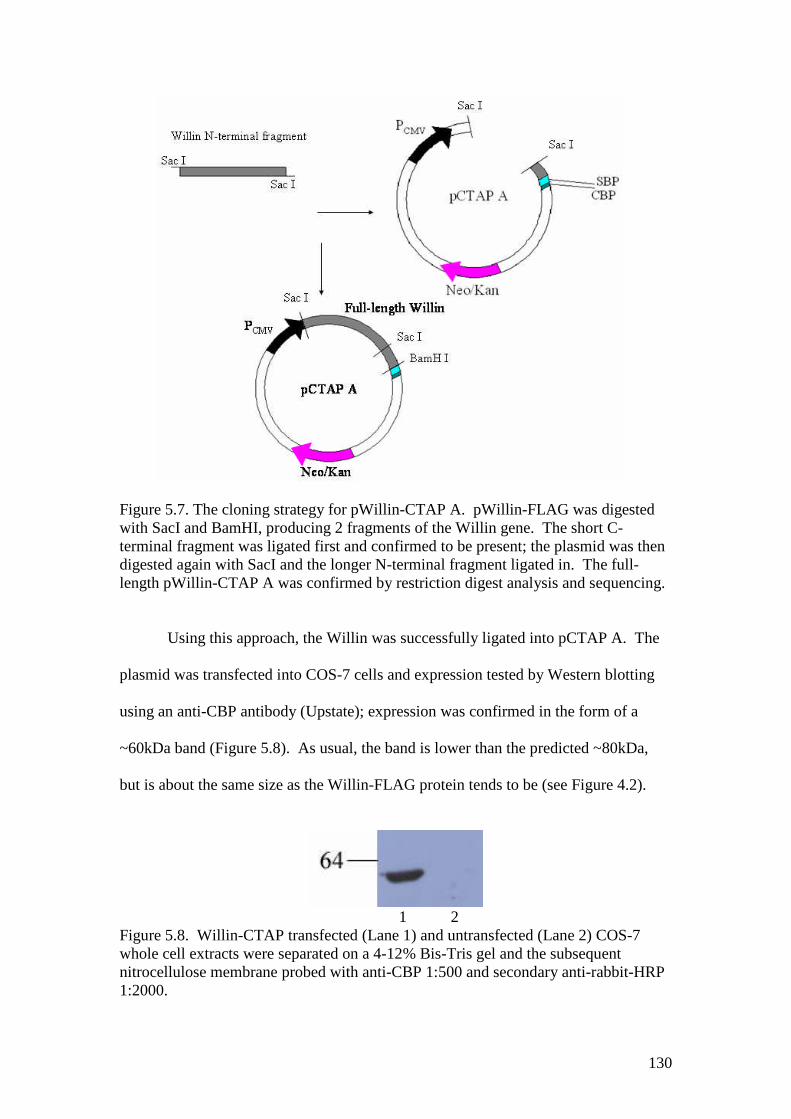
130
Figure 5.7. The cloning strategy for pWillin-CTAP A. pWillin-FLAG was digestedwith SacI and BamHI, producing 2 fragments of the Willin gene. The short C-terminal fragment was ligated first and confirmed to be present; the plasmid was thendigested again with SacI and the longer N-terminal fragment ligated in. The full-length pWillin-CTAP A was confirmed by restriction digest analysis and sequencing.
Using this approach, the Willin was successfully ligated into pCTAP A. The
plasmid was transfected into COS-7 cells and expression tested by Western blotting
using an anti-CBP antibody (Upstate); expression was confirmed in the form of a
~60kDa band (Figure 5.8). As usual, the band is lower than the predicted ~80kDa,
but is about the same size as the Willin-FLAG protein tends to be (see Figure 4.2).
1 2Figure 5.8. Willin-CTAP transfected (Lane 1) and untransfected (Lane 2) COS-7whole cell extracts were separated on a 4-12% Bis-Tris gel and the subsequentnitrocellulose membrane probed with anti-CBP 1:500 and secondary anti-rabbit-HRP1:2000.

131
With expression thus confirmed, a small-scale purification was then performed
to test that the protein could be purified and detected by Western blot. Purification
was carried out as described in section 2.3.15, with samples taken of the input lysate
(A), the insoluble cell debris pellet (B), the streptavidin-unbound lysate (C), the
streptavidin-purified lysate (D), the calmodulin-unbound lysate (E), the calmodulin-
purified lysate (F) and the boiled calmodulin resin (G). As can be seen in Figure 5.9,
expressed protein was detected in both the soluble lysate and insoluble pellet, and in
the streptavidin-unbound lysate. Unfortunately, no protein was detected in any of the
subsequent purification steps, implying that the protein did not bind to the streptavidin
resin. Repeated attempts to bind the protein to the resin failed, and this construct was
abandoned.
A B C D E F G
Figure 5.9. Samples A-G as described of the TAP purification were separated a 4-12% Bis-Tris gel and the subsequent nitrocellulose membrane was probed with anti-CBP 1:500 and secondary anti-rabbit-HRP 1:2000.
5.3.3 Construction of the Willin239 Stratagene NTAP A plasmid
It was speculated that perhaps the majority of the Willin-CTAPA protein was
insoluble, which left too little protein to carry through a full purification; that some
unknown property of the full-length protein was somehow masking the SBP binding
site; or that the C-terminal fusion tag was causing a problem. In the meantime,
several truncated versions of Willin tagged with GST had been cloned (see section
4.6) and the truncated version found to be more soluble than the full-length version.
Therefore a new construct was made to take advantage of this property, using a 239
amino acid truncated version of Willin that contained the complete FERM domain of

132
Willin. An insert already existed from the pGST-Willin239 construct (see section
4.6) that could be ligated into the N-terminal fusion tag version of the Stratagene TAP
system, thus avoiding PCR and allowing us to test whether the location of the tag
made a difference. Therefore a cloning strategy was performed as described in Figure
5.10.
Figure 5.10. The cloning strategy for pWillin239-NTAP A. Willin239 was digestedfrom pGST-Willin239 with BamHI and EcoRI and ligated directly into pNTAP A.
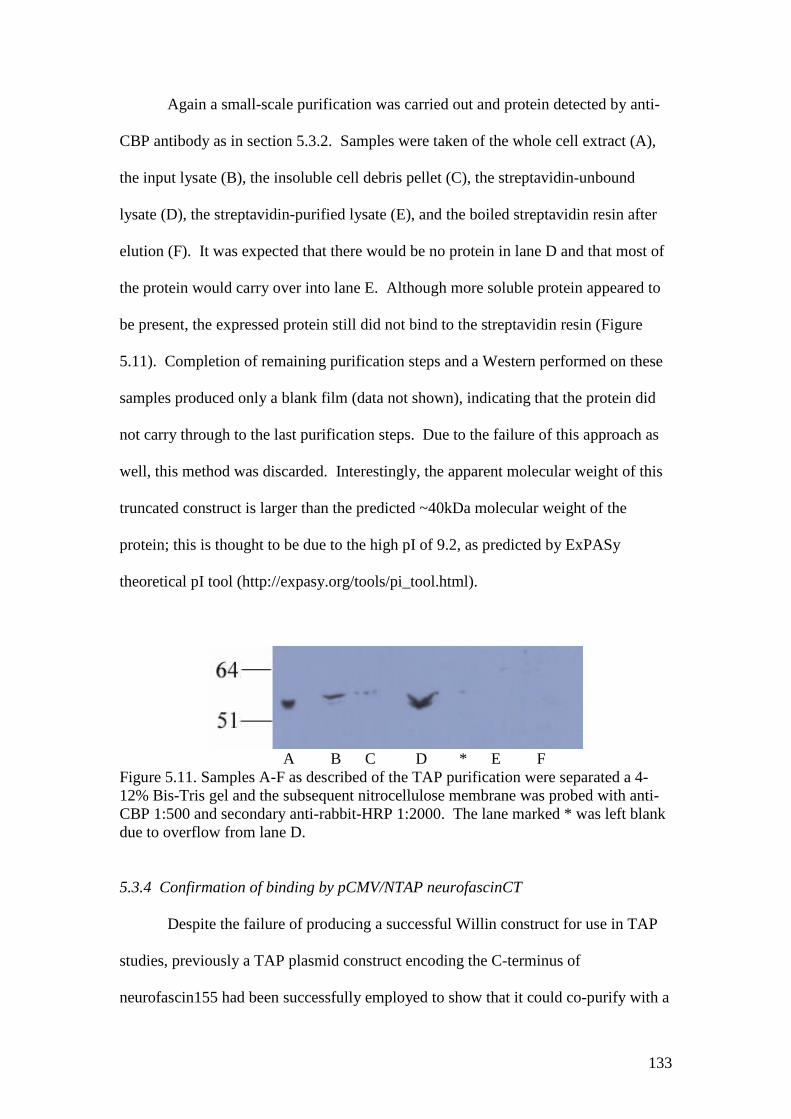
133
Again a small-scale purification was carried out and protein detected by anti-
CBP antibody as in section 5.3.2. Samples were taken of the whole cell extract (A),
the input lysate (B), the insoluble cell debris pellet (C), the streptavidin-unbound
lysate (D), the streptavidin-purified lysate (E), and the boiled streptavidin resin after
elution (F). It was expected that there would be no protein in lane D and that most of
the protein would carry over into lane E. Although more soluble protein appeared to
be present, the expressed protein still did not bind to the streptavidin resin (Figure
5.11). Completion of remaining purification steps and a Western performed on these
samples produced only a blank film (data not shown), indicating that the protein did
not carry through to the last purification steps. Due to the failure of this approach as
well, this method was discarded. Interestingly, the apparent molecular weight of this
truncated construct is larger than the predicted ~40kDa molecular weight of the
protein; this is thought to be due to the high pI of 9.2, as predicted by ExPASy
theoretical pI tool (http://expasy.org/tools/pi_tool.html).
A B C D * E FFigure 5.11. Samples A-F as described of the TAP purification were separated a 4-12% Bis-Tris gel and the subsequent nitrocellulose membrane was probed with anti-CBP 1:500 and secondary anti-rabbit-HRP 1:2000. The lane marked * was left blankdue to overflow from lane D.
5.3.4 Confirmation of binding by pCMV/NTAP neurofascinCT
Despite the failure of producing a successful Willin construct for use in TAP
studies, previously a TAP plasmid construct encoding the C-terminus of
neurofascin155 had been successfully employed to show that it could co-purify with a
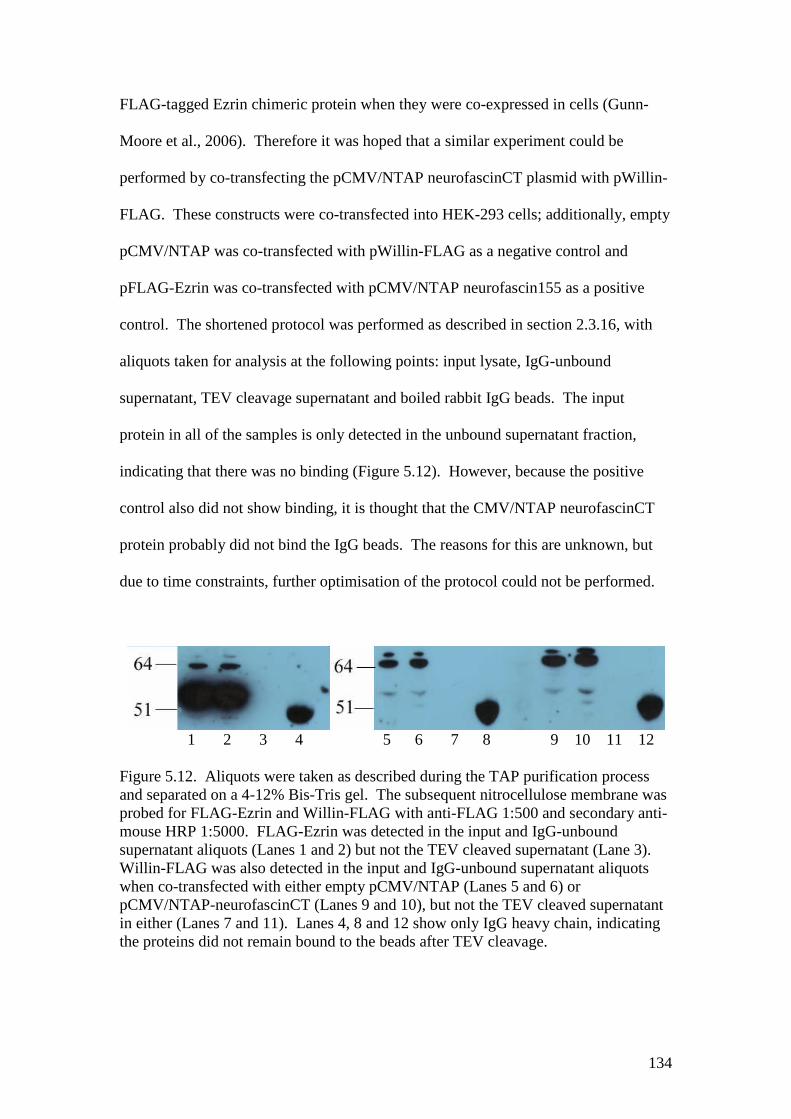
134
FLAG-tagged Ezrin chimeric protein when they were co-expressed in cells (Gunn-
Moore et al., 2006). Therefore it was hoped that a similar experiment could be
performed by co-transfecting the pCMV/NTAP neurofascinCT plasmid with pWillin-
FLAG. These constructs were co-transfected into HEK-293 cells; additionally, empty
pCMV/NTAP was co-transfected with pWillin-FLAG as a negative control and
pFLAG-Ezrin was co-transfected with pCMV/NTAP neurofascin155 as a positive
control. The shortened protocol was performed as described in section 2.3.16, with
aliquots taken for analysis at the following points: input lysate, IgG-unbound
supernatant, TEV cleavage supernatant and boiled rabbit IgG beads. The input
protein in all of the samples is only detected in the unbound supernatant fraction,
indicating that there was no binding (Figure 5.12). However, because the positive
control also did not show binding, it is thought that the CMV/NTAP neurofascinCT
protein probably did not bind the IgG beads. The reasons for this are unknown, but
due to time constraints, further optimisation of the protocol could not be performed.
1 2 3 4 5 6 7 8 9 10 11 12
Figure 5.12. Aliquots were taken as described during the TAP purification processand separated on a 4-12% Bis-Tris gel. The subsequent nitrocellulose membrane wasprobed for FLAG-Ezrin and Willin-FLAG with anti-FLAG 1:500 and secondary anti-mouse HRP 1:5000. FLAG-Ezrin was detected in the input and IgG-unboundsupernatant aliquots (Lanes 1 and 2) but not the TEV cleaved supernatant (Lane 3).Willin-FLAG was also detected in the input and IgG-unbound supernatant aliquotswhen co-transfected with either empty pCMV/NTAP (Lanes 5 and 6) orpCMV/NTAP-neurofascinCT (Lanes 9 and 10), but not the TEV cleaved supernatantin either (Lanes 7 and 11). Lanes 4, 8 and 12 show only IgG heavy chain, indicatingthe proteins did not remain bound to the beads after TEV cleavage.

135
5.4 Confirmation of neurofascin 155 binding by FLAG co-immunoprecipitation
As the TAP experiments were unsuccessful, another in vivo method was
attempted. HEK-293 cells were co-transfected with pcDNA3 neurofascin155 and
either pWillin-FLAG or empty pCMVTag4A vector. FLAG co-immunoprecipitation
was carried out as described in section 2.3.18. Briefly, Protein A from
Staphylococcus aureus immobilised on polyacrylic beads was conjugated with FLAG
M2 monoclonal antibody (Sigma) and tumbled with the cell lysate at room
temperature for 2 hours. The beads were then washed 2 or 3 times in 1M NaCl IP
buffer (50mM NaF, 50mM TrisHCl, 1mM NaPPi, 1mM EDTA, 1mM EGTA, pH 6.8;
1mM DTT and protease inhibitors added just before use) and again 2 or 3 times in
150mM NaCl IP buffer without disturbing the pellet. The entire bead-protein
complex was then resuspended in IP buffer and protein sample buffer and heated at
70oC for 10 minutes, then treated as usual for SDS-PAGE and Western blotting (see
sections 2.3.7, 2.3.9 and 2.3.10). The subsequent nitrocellulose membrane was then
probed for neurofascin155 with the anti-neurofascin antibody.
As can be seen in Figure 5.13, when neurofascin155 and Willin-FLAG were
co-expressed, they were co-immunoprecipitated. However, neurofascin155 did not
co-purify with the empty FLAG vector.
1 2 3 4 5 6Figure 5.13. HEK-293 cells were transfected with neurofascin 155 and Willin-FLAGor neurofascin 155 and empty FLAG vector. Input lysate for neurofascin/Willin-FLAG (Lane 1) and neurofascin/FLAG (Lane 2) and co-immunoprecipitated productfor neurofascin/Willin-FLAG (Lanes 3 and 5) and neurofascin/FLAG (Lanes 4 and 6)were separated on a 4-12% Bis-Tris gel. The subsequent nitrocellulose membraneswere probed with anti-neurofascin 1:5000 and Santa Cruz secondary anti-rabbit-HRP1:10,000 (A and C) or Pierce secondary anti-rabbit-HRP 1:10,000 (B).
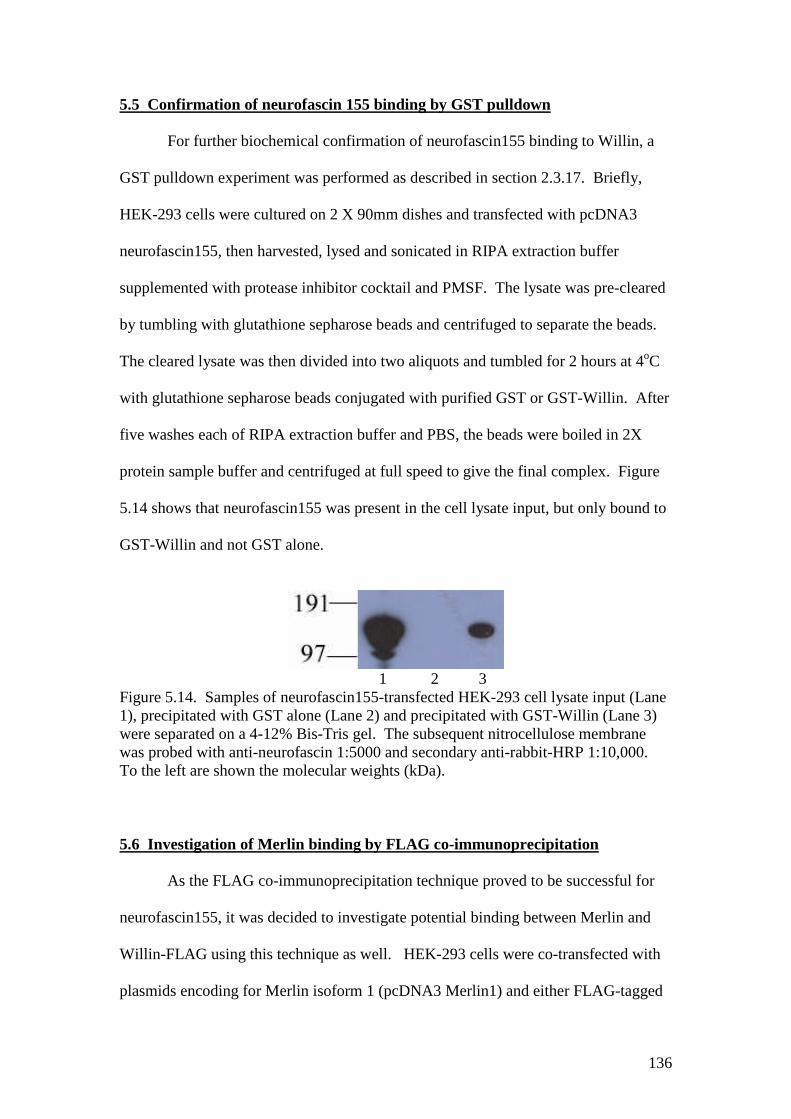
136
5.5 Confirmation of neurofascin 155 binding by GST pulldown
For further biochemical confirmation of neurofascin155 binding to Willin, a
GST pulldown experiment was performed as described in section 2.3.17. Briefly,
HEK-293 cells were cultured on 2 X 90mm dishes and transfected with pcDNA3
neurofascin155, then harvested, lysed and sonicated in RIPA extraction buffer
supplemented with protease inhibitor cocktail and PMSF. The lysate was pre-cleared
by tumbling with glutathione sepharose beads and centrifuged to separate the beads.
The cleared lysate was then divided into two aliquots and tumbled for 2 hours at 4oC
with glutathione sepharose beads conjugated with purified GST or GST-Willin. After
five washes each of RIPA extraction buffer and PBS, the beads were boiled in 2X
protein sample buffer and centrifuged at full speed to give the final complex. Figure
5.14 shows that neurofascin155 was present in the cell lysate input, but only bound to
GST-Willin and not GST alone.
1 2 3Figure 5.14. Samples of neurofascin155-transfected HEK-293 cell lysate input (Lane1), precipitated with GST alone (Lane 2) and precipitated with GST-Willin (Lane 3)were separated on a 4-12% Bis-Tris gel. The subsequent nitrocellulose membranewas probed with anti-neurofascin 1:5000 and secondary anti-rabbit-HRP 1:10,000.To the left are shown the molecular weights (kDa).
5.6 Investigation of Merlin binding by FLAG co-immunoprecipitation
As the FLAG co-immunoprecipitation technique proved to be successful for
neurofascin155, it was decided to investigate potential binding between Merlin and
Willin-FLAG using this technique as well. HEK-293 cells were co-transfected with
plasmids encoding for Merlin isoform 1 (pcDNA3 Merlin1) and either FLAG-tagged
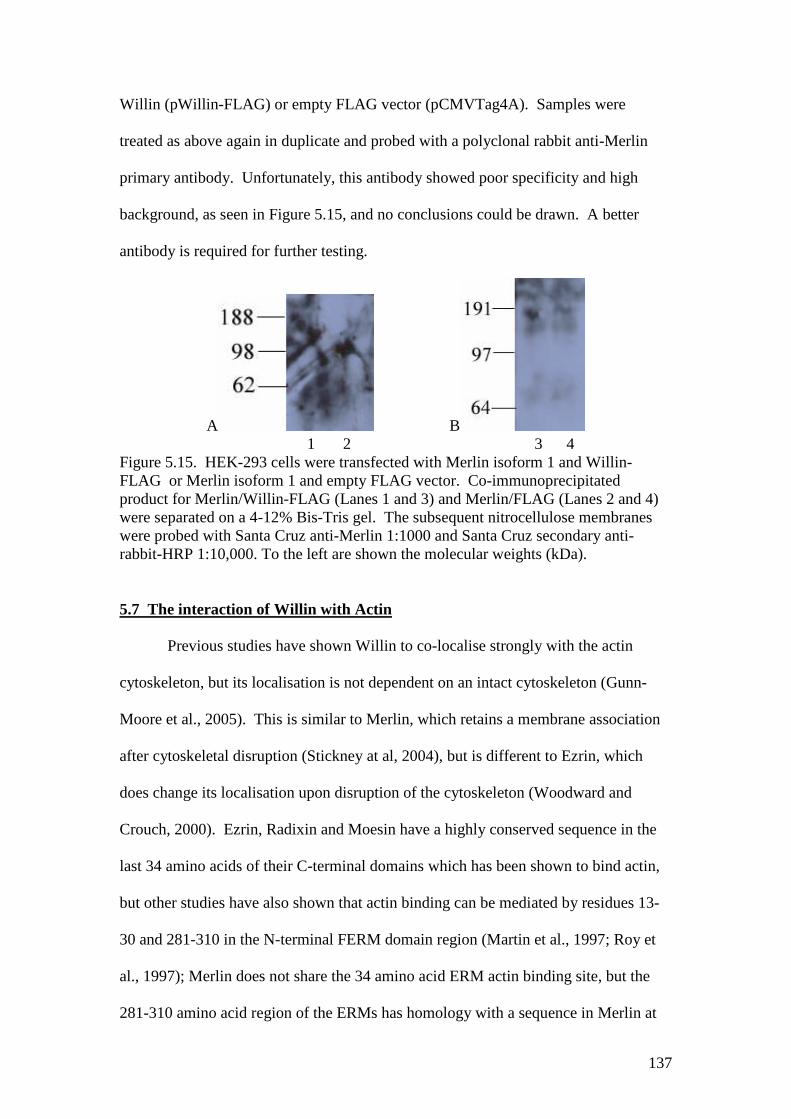
137
Willin (pWillin-FLAG) or empty FLAG vector (pCMVTag4A). Samples were
treated as above again in duplicate and probed with a polyclonal rabbit anti-Merlin
primary antibody. Unfortunately, this antibody showed poor specificity and high
background, as seen in Figure 5.15, and no conclusions could be drawn. A better
antibody is required for further testing.
A B1 2 3 4
Figure 5.15. HEK-293 cells were transfected with Merlin isoform 1 and Willin-FLAG or Merlin isoform 1 and empty FLAG vector. Co-immunoprecipitatedproduct for Merlin/Willin-FLAG (Lanes 1 and 3) and Merlin/FLAG (Lanes 2 and 4)were separated on a 4-12% Bis-Tris gel. The subsequent nitrocellulose membraneswere probed with Santa Cruz anti-Merlin 1:1000 and Santa Cruz secondary anti-rabbit-HRP 1:10,000. To the left are shown the molecular weights (kDa).
5.7 The interaction of Willin with Actin
Previous studies have shown Willin to co-localise strongly with the actin
cytoskeleton, but its localisation is not dependent on an intact cytoskeleton (Gunn-
Moore et al., 2005). This is similar to Merlin, which retains a membrane association
after cytoskeletal disruption (Stickney at al, 2004), but is different to Ezrin, which
does change its localisation upon disruption of the cytoskeleton (Woodward and
Crouch, 2000). Ezrin, Radixin and Moesin have a highly conserved sequence in the
last 34 amino acids of their C-terminal domains which has been shown to bind actin,
but other studies have also shown that actin binding can be mediated by residues 13-
30 and 281-310 in the N-terminal FERM domain region (Martin et al., 1997; Roy et
al., 1997); Merlin does not share the 34 amino acid ERM actin binding site, but the
281-310 amino acid region of the ERMs has homology with a sequence in Merlin at

138
residues 298-318, and this region has shown an actin-binding ability (Xu and
Gutmann, 1998; James et al., 2001). A homologous region is not found in Willin, and
the ERM C-terminal actin-binding site is also absent. Therefore, while Willin co-
localises frequently with actin, it is not known whether there is a direct binding
reaction in vivo, nor how this reaction might occur if it exists.
In order to determine whether Willin is capable of bind actin, the Actin
binding protein spin-down assay for non-muscle actin by Cytoskeleton Inc. (Denver,
Colorado, USA) was used as described in section 2.3.14. This kit allowed for a
straightforward assay using purified GST-Willin (see sections 2.3.1-3) and
interpretation by Coomassie-stained SDS-PAGE gel (see sections 2.3.7-8). Purified
GST-Willin, purified GST and -actinin were each incubated with F-actin; -actinin
is a known actin-binding protein and acted as a positive control, while GST acted as a
negative control. GST-Willin was also incubated with buffer alone as another
negative control. After a 1.5 hour centrifugation at 150,000g, the supernatants and
pellets were separated and loaded onto a 4-12% Bis-Tris gel which was subsequently
Coomassie stained (Figure 5.16A). Lanes B and F show GST-Willin with buffer
alone; no actin was present in this mixture, and thus no protein has sedimented into
the pellet fraction. Lanes C and G show GST-Willin with F-actin, lanes D and H
show -actinin with F-actin, and lanes E and I show GST with F-actin. Lane I, the
negative control lane, shows a larger amount of actin (indicated by the arrowhead) in
the pellet fraction than G, the GST-Willin lane. In addition GST, as indicated by the
block arrows, is present in the supernatant but not the pellet, while what was thought
to be GST-Willin, as indicated by arrows, is present in both the supernatant and pellet
fractions. According to the interpretation instructions provided by the manufacturer,
this combined evidence indicates that GST-Willin is binding to F-actin and causing
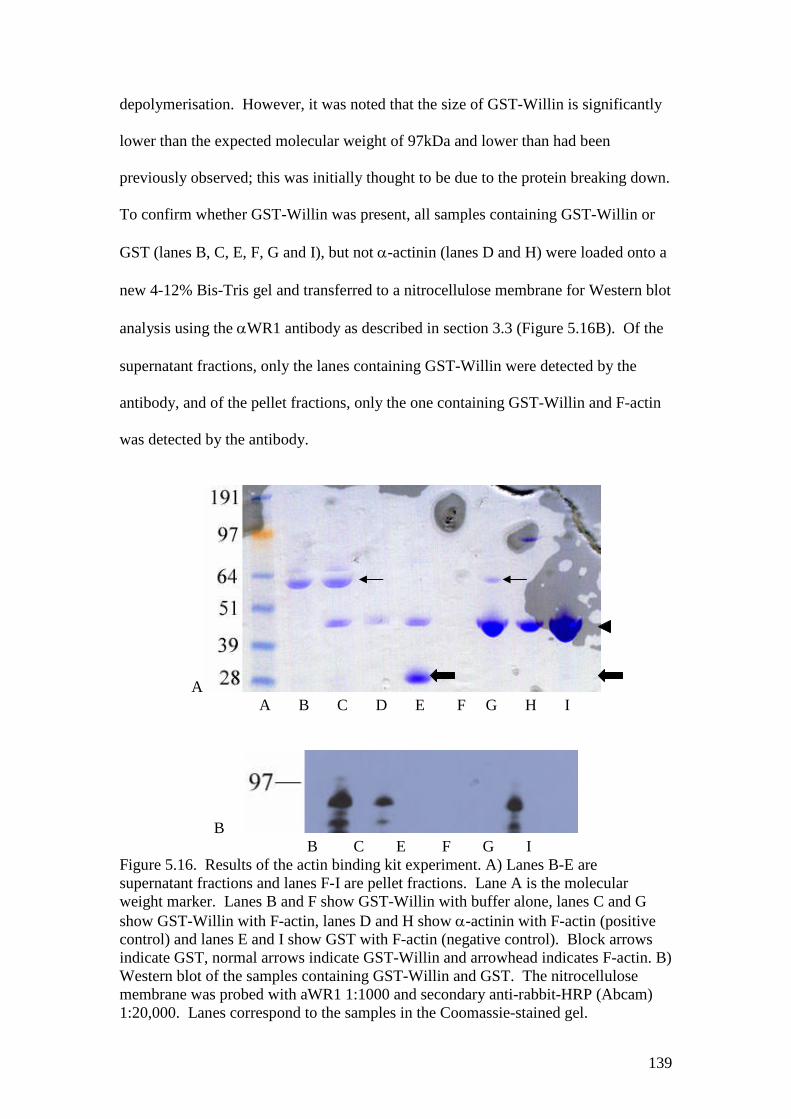
139
depolymerisation. However, it was noted that the size of GST-Willin is significantly
lower than the expected molecular weight of 97kDa and lower than had been
previously observed; this was initially thought to be due to the protein breaking down.
To confirm whether GST-Willin was present, all samples containing GST-Willin or
GST (lanes B, C, E, F, G and I), but not -actinin (lanes D and H) were loaded onto a
new 4-12% Bis-Tris gel and transferred to a nitrocellulose membrane for Western blot
analysis using the WR1 antibody as described in section 3.3 (Figure 5.16B). Of the
supernatant fractions, only the lanes containing GST-Willin were detected by the
antibody, and of the pellet fractions, only the one containing GST-Willin and F-actin
was detected by the antibody.
AA B C D E F G H I
BB C E F G I
Figure 5.16. Results of the actin binding kit experiment. A) Lanes B-E aresupernatant fractions and lanes F-I are pellet fractions. Lane A is the molecularweight marker. Lanes B and F show GST-Willin with buffer alone, lanes C and Gshow GST-Willin with F-actin, lanes D and H show -actinin with F-actin (positivecontrol) and lanes E and I show GST with F-actin (negative control). Block arrowsindicate GST, normal arrows indicate GST-Willin and arrowhead indicates F-actin. B)Western blot of the samples containing GST-Willin and GST. The nitrocellulosemembrane was probed with aWR1 1:1000 and secondary anti-rabbit-HRP (Abcam)1:20,000. Lanes correspond to the samples in the Coomassie-stained gel.
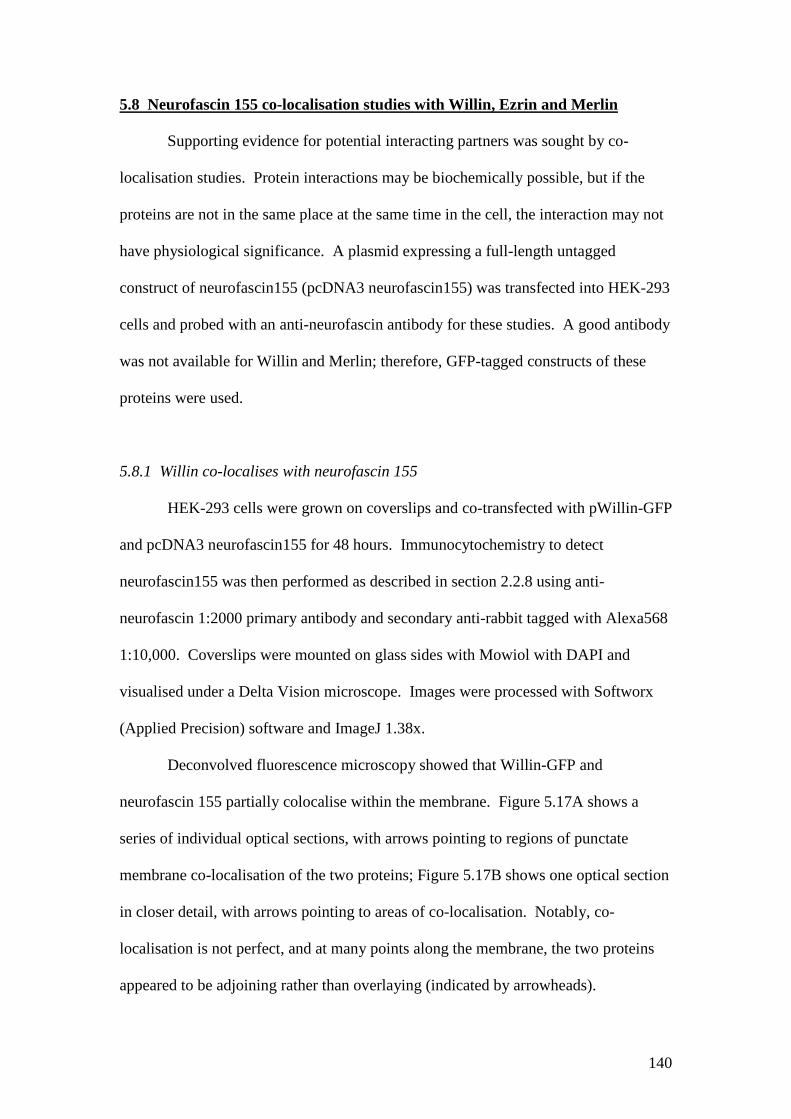
140
5.8 Neurofascin 155 co-localisation studies with Willin, Ezrin and Merlin
Supporting evidence for potential interacting partners was sought by co-
localisation studies. Protein interactions may be biochemically possible, but if the
proteins are not in the same place at the same time in the cell, the interaction may not
have physiological significance. A plasmid expressing a full-length untagged
construct of neurofascin155 (pcDNA3 neurofascin155) was transfected into HEK-293
cells and probed with an anti-neurofascin antibody for these studies. A good antibody
was not available for Willin and Merlin; therefore, GFP-tagged constructs of these
proteins were used.
5.8.1 Willin co-localises with neurofascin 155
HEK-293 cells were grown on coverslips and co-transfected with pWillin-GFP
and pcDNA3 neurofascin155 for 48 hours. Immunocytochemistry to detect
neurofascin155 was then performed as described in section 2.2.8 using anti-
neurofascin 1:2000 primary antibody and secondary anti-rabbit tagged with Alexa568
1:10,000. Coverslips were mounted on glass sides with Mowiol with DAPI and
visualised under a Delta Vision microscope. Images were processed with Softworx
(Applied Precision) software and ImageJ 1.38x.
Deconvolved fluorescence microscopy showed that Willin-GFP and
neurofascin 155 partially colocalise within the membrane. Figure 5.17A shows a
series of individual optical sections, with arrows pointing to regions of punctate
membrane co-localisation of the two proteins; Figure 5.17B shows one optical section
in closer detail, with arrows pointing to areas of co-localisation. Notably, co-
localisation is not perfect, and at many points along the membrane, the two proteins
appeared to be adjoining rather than overlaying (indicated by arrowheads).
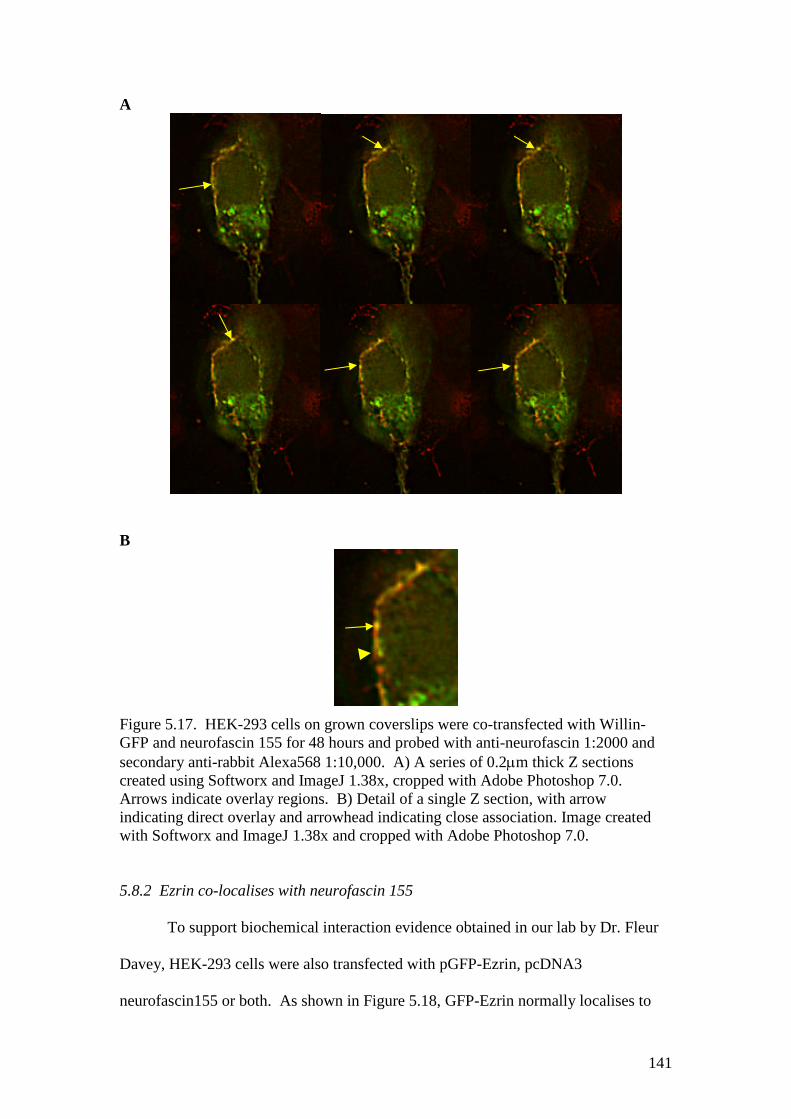
141
A
B
Figure 5.17. HEK-293 cells on grown coverslips were co-transfected with Willin-GFP and neurofascin 155 for 48 hours and probed with anti-neurofascin 1:2000 andsecondary anti-rabbit Alexa568 1:10,000. A) A series of 0.2m thick Z sectionscreated using Softworx and ImageJ 1.38x, cropped with Adobe Photoshop 7.0.Arrows indicate overlay regions. B) Detail of a single Z section, with arrowindicating direct overlay and arrowhead indicating close association. Image createdwith Softworx and ImageJ 1.38x and cropped with Adobe Photoshop 7.0.
5.8.2 Ezrin co-localises with neurofascin 155
To support biochemical interaction evidence obtained in our lab by Dr. Fleur
Davey, HEK-293 cells were also transfected with pGFP-Ezrin, pcDNA3
neurofascin155 or both. As shown in Figure 5.18, GFP-Ezrin normally localises to

the cytoplasm (A), while neurofascin155 localises to the membrane (B); however,
when co-transfected, both proteins show localisation to the membrane, especially at
sites of cell-cell contact (C). Images A and B were obtained with a Leica TCS4D
confocal microscope (Gunn-Moore et al., 2006), but to avoid bleed-through problems
associated with strong neurofascin155 expression, the co-transfected cells (C) were
observed on the Delta Vision system.
ForTFps
GFP-Ezrin neurofascin
C
C
igure 5.18. HEK293 cells were transfecter both (C) for 48 hours and probed with anabbit Alexa568 1:10,000. For A and B, a sCS4D confocal microscope are shown. (Mor C, images are single Z sections obtainerocessed with Softworx, ImageJ 1.38x andites of co-localisation.
A
B142
d with (A) GFP-Ezrin, (B) neurofascin155ti-neurofascin 1:2000 and secondary anti-ingle Z section acquired on a Leicaodified from Gunn-Moore et al., 2006)
d on the Delta Vision system andAdobe Photoshop 7.0. Arrows indicate

143
5.8.3 Merlin co-localises with neurofascin 155
Previous work from other groups indicated that both Merlin and neurofascin
155 localise to paranodes of Schwann cells and to lipid rafts (Chang et al., 2000;
Schafer et al., 2004; Scherer and Gutmann, 1996; Stickney et al., 2004), and our
group had previously shown that neurofascin155 can bind to FERM containing
proteins. Merlin-mutant Schwann cells show abnormal myelination; are unable to
redifferentiate to myelinating cells in culture; and express developmental molecules
such as L1 rather than pro-myelination proteins (Hung et al., 2002). Additionally, at
least some of the prototypic Merlin mutations in NF2 patients have been shown to be
soluble in Triton X-100 (Deguen et al., 1998), indicating that raft localisation is an
important physiological aspect of its function (Stickney et al., 2004). Neurofascin
155, meanwhile, is essential to paranode formation prior to myelination (Sherman et
al., 2005), and loss of lipid raft association causes disassembly of the paranodal
junction in multiple sclerosis (Maier et al., 2007). Therefore, it seems possible that
Merlin and neurofascin could interact, and that this interaction may have ramifications
for paranodal development, myelination and schwannoma oncogenesis.
To study this potential interation, HEK-293 cells were transfected with
pMerlin1-GFP and pcDNA3 neurofascin155. Anti-neurofascin and secondary anti-
rabbit Alexa568 were used to probe for neurofascin. The proteins show co-
localisation at several punctate membrane points (figure 5.19A), particularly at
membrane projections (5.19B).
144
A
B
Figure 5.19. HEK-293 cells on grown coverslips were co-transfected with Merlin1-GFP and neurofascin 155 for 48 hours and probed with anti-neurofascin 1:2000 andsecondary anti-rabbit Alexa568 1:10,000. A) A series of 0.2m thick Z sectionsshowing punctate membrane localisation of Merlin1-GFP and neurofascin155. B) Aseries of 0.2m thick Z sections showing localisation of Merlin1-GFP andneurofascin155 to membrane projections. Arrows indicate points of co-localisation.Images acquired on the Delta Vision system and processed with Softworx and AdobePhotoshop 7.0.

145
Further characterisation of this potential interaction was outwith the scope of
this project; however, it is worth noting that Willin has also been observed in lipid
rafts (see section 4.5.2.4, Figure 4.10), providing added support to its interaction with
neurofascin 155 and potential interaction with Merlin.
146
5.9 Discussion
The identification of binding partners is a key step in the characterisation of a
novel protein. In the case of Willin, several potential binding partners were identified
based on how the protein was discovered, its relationship to other members of the
FERM protein family and its localisation as determined in previous studies. In
addition to confirming or refuting these putative interactions, it was also desirable to
screen for new potential partners that might give further insight into the function of
Willin. To these ends, several techniques were attempted with mixed success, and the
results obtained have raised interesting new possibilities for future work.
5.9.1 Yeast two-hybrid studies
The yeast two-hybrid results discussed in section 5.2 confirmed the previous
observations of the ability of Willin to interact with L1 members of the L1 family.
Like Ezrin, Willin does not seem capable of binding NrCAM, regardless of whether
an RSLE motif is present, though the two proteins do co-localise (Maria Hill, Ph.D.
thesis). It is interesting that Willin seems able to bind L1 regardless of the RSLE
motif, unlike Ezrin which seems only to bind via the RSLE motif. It is possible that
the relative weakness of the Willin-L1 interaction indicates a false positive, but if it is
a true interaction, it indicates a different mechanism to that which Ezrin employs to
bind L1, leading to the conclusion that different physiological roles are assigned to
these interactions. Ezrin is important in L1-mediated branching of neurites (Cheng et
al., 2005); could Willin counter this action to control how much branching occurs,
possibly even binding at the same time as Ezrin to a different FERM-binding site?
Further work must be done to verify this interaction and its physiological impact.
Ideally, a screen of a cDNA library using Willin as ‘bait’ would have been
desirable; however, previously constructed plasmids with Willin cloned in frame in
147
the pAS2-1 ‘bait’ plasmid showed both low expression and auto-activation
(Brannigan, 2006). Cloning of new yeast two-hybrid constructs and the subsequent
screening procedures were outwith the scope of this project.
5.9.2. Tandem affinity purification
Unfortunately, the various TAP methods attempted were unsuccessful. In the
case of the Willin-TAP systems, cloning difficulties gave way to insolubility issues,
leading to insufficient protein being available for the purification steps. Using a
sonicated whole cell lysate, where insoluble proteins are kept, may yield better results.
It is also possible that the protein did not bind to the purification resins, though why
this is the case is unknown.
It is not known why the TAP- neurofascin155 system was unsuccessful. It is
possible that full-length neurofascin is required for interaction with Willin in
mammalian cells, perhaps due to their localisation to lipid rafts. Even if this is not the
case, the method is techinically challenging, and the TAP protein was not tested
directly to confirm its expression levels in this study. Further optimisation may be
required and can be performed at a later date.
5.9.3 Co-immunoprecipitation assays
Thankfully, the FLAG co-immunoprecipitation method did provide a
successful means of confirming the Willin-neurofascin155 interaction. This time the
full-length neurofascin protein was expressed instead of only the C-terminus, which
may have improved the chance of interaction. Also, sonicated whole cell lysates were
used, preventing any loss of insoluble proteins. The method needs to be repeated for
Willin-Merlin due to the poor quality of the Merlin antibody.

148
The GST pulldown experiment with GST-Willin and neurofascin155 was also
successful, as again a sonicated whole cell lysate was used. As will be discussed in
section 5.9.4, however, the GST-Willin protein was contaminated by a bacterial
chaperone protein, and so this experiment should be repeated to ensure that it is not a
false positive.
5.9.4. The actin binding assay
The interaction of Willin and actin is still unconfirmed, though preliminary
data is promising. Without any of the conserved actin-binding regions of the other
ERM proteins present in Willin, it is difficult to predict how this interaction might
take place. The difficulties of producing and purifying GST-Willin, and the
impossibility of preventing its apparent breakdown, make the actin-binding
experiment challenging; the results presented here should be seen only as an initial
step in confirming this reaction, and an assay more comparable with those performed
on other ERM proteins should be the next step in this investigation.
If the interpretation provided by the manufacturer of the protocol is accurate,
i.e., Willin depolymerises F-actin, this would prove to be quite different from Merlin,
which has been shown to stabilise F-actin filaments and slow disassembly (James et
al., 2001); the ERMs have also been shown to promote filamentation (Defacque et al.,
2000). The significance of this is unclear, but F-actin disruption can be a trigger for
apoptosis (White et al., 2001), and could thus be a mechanism for how Willin kills
cells.
It would be premature, however, to ascribe such a function before a Willin-
actin interaction can be confirmed, and unfortunately, the result shown in section 5.7
is likely not be that straightforward. The approximately 60kDa band present in the
purified GST-Willin lanes may not be a breakdown product. A previous GST-Willin
149
preparation had produced a large amount of a protein of this size, and upon mass
spectrometry analysis, this band was shown to be the bacterial chaperone protein
GroEL. GroEL and its partner GroES direct ATP-dependant folding of proteins in
prokaryotes (Hartl, 1996). GroEL is not always present in GST-Willin purifications,
but it does appear to be present in this sample. This is problematic because GroEL is
known to bind actin, having an important role in its correct folding in bacteria
(Siegers et al., 1999). Although GST-Willin is also present, this confounding factor
cannot be ignored, and so this result cannot be trusted. Fortunately, it is possible to
remove GroEL from the GST-Willin preparation; as GroEL is ATP-dependant, a
high-volume ATP wash can be used to separate it (Thain et al., 1996). Also,
denatured bacterial proteins can be added to the GST-Willin lysates to compete for
GroEL binding (Rohman and Harrison-Lavoie, 2000). These methods will need to be
tested for their usefulness with the GST-Willin preparation, and used to in future to
ensure a pure product for the actin binding experiment.
This contamination is not thought to be a problem for the pulldown data
presented in section 5.5, as there is no reason to believe that GroEL will bind
neurofascin. Of course the experiment should be repeated with a decontaminated
GST-Willin sample, but as the FLAG pulldown experiment gave the same result
without any confounding factors involved, the level of confidence in that experiment
is significantly higher than for the actin binding assay..
5.9.5. Co-localisation studies
The Delta Vision deconvolved fluorescence microscopy of cells expressing
neurofascin155 and either Willin-GFP, Merlin1-GFP or GFP-Ezrin shows punctate
co-localisation of the FERM-containing proteins with the receptor. In the case of

150
Willin and Ezrin, this supports biochemical data, and in the case of Merlin, provides
further impetus to investigate the potential interaction biochemically. It will now be
important to determine the physiological significance of these interactions; the use of
transgenic animals will be essential for this, especially in the case of Willin where
nothing is known about its native physiological action.
Figure 5.20 summarises the findings of this chapter. Willin has been
confirmed to bind neurofascin155 by several methods and two splice variants of L1
by yeast two-hybrid, but it is unable to bind either variant of NrCAM, while
interactions with Merlin and actin are still inconclusive.
Figure 5.20. A summary of results for putative Willin binding partners. Willin hasshown the ability to bind neurofascin, L1 and L1-RSLE, but not NrCAM or NrCAMRSLE, and its ability to bind actin and Merlin is still inconclusive.

151
CHAPTER 6: DISCUSSION

152
Chapter 6: Discussion
The overall aim of this project was to increase the body of knowledge of the
novel FERM-containing protein Willin, with a specific interest in binding partners
and subcellular localisation. As with other FERM-containing proteins, the study of
Willin is fraught with technical challenges, some of which have not yet been
overcome, and which have slowed the progress of these aims. However,
neurofascin155 has been confirmed as a binding partner by yeast two-hybrid and two
biochemical methods in addition to co-localisation under fluorescence microscopy
(Chapter 5), and a potential cellular location, the lipid raft, proposed for this
interaction (Chapter 4). Several tagged constructs with different versions of Willin
have been produced for use in various assays (Chapters 4 and 5), and both custom and
commercial antibodies tested (and unfortunately largely ruled out) for suitability
(Chapter 3). A potential relationship with the tumour suppressor Merlin is being
investigated, as well as the hypothesis that Willin may be a homologue of Drosophila
expanded (Chapters 4 and 5). From this new knowledge, some speculation can be
made about a possible physiological role for Willin.
6.1. Junctions, FERM proteins and the L1 family
Yeast two-hybrid, biochemical and co-localisation experiments show that
Willin is able to bind neurofascin 155. Previous work in this laboratory has shown
that Ezrin and neurofascin 155 interact (Gunn-Moore et al., 2006), and work is
ongoing to determine whether Merlin interacts with neurofascin 155. In addition, it is
known that Merlin and Ezrin interact (Nguyen et al., 2001), and the Drosophila
homologues of Merlin and Willin interact (McCartney et al., 2000). The added
153
knowledge that all of these proteins are found in Schwann cells, with all but (thus far)
Willin confirmed to be at the paranode (Scherer et al., 2001; Tait et al., 2000), leads to
the tantalising idea of a regulatory signalling complex guiding Schwann cell
differentiation, growth and myelination activity. This possibility is bolstered by what
is known of Drosophila homologues of these proteins and the parallel nature of the
invertebrate septate junction (SJ) and the paranodal septate-like junction (PSJ).
As discussed in sections 4.3 and 4.4, Willin has been observed to slow growth
and cause cell death when overexpressed in cell lines. This correlates with the
function of its proposed Drosophila homologue, expanded, which regulates growth
and apoptosis in disc development (Boedigheimer and Laughon, 1993; Blaumueller
and Mlodzik, 2000). The L1 family also has a Drosophila homologue, neuroglian
(Hortsch, 1996), and the ERM proteins are represented only by Moesin (McCartney
and Fehon, 1996). All are present at epithelial membranes, but from there the
situation becomes murkier.
The literature is unclear about the exact locations of these proteins. Luque and
Milán (2007) refer to neuroglian as being a component of adherens junctions, while
others place it at the septate junctions (Genova and Fehon, 2003). Expanded,
meanwhile, is said to be ‘at or very near’ adherens junctions (Boedigheimer et al.,
1997); interestingly, a later paper states simply that expanded is found at adherens
junctions (Blaumueller and Mlodzik, 2000), apparently based on this reference.
Hamaratoglu et al. (2006) mention Merlin and expanded together as being at adherens
junctions in Drosophila epithelium, and three references are cited for this. However,
the first paper was concerned with mammalian cells, not Drosophila (Lallemand et al.,
2003); the second (McCartney et al., 2000) refers to an older publication that stated
‘at least part [emphasis added] of the detected DMerlin … protein was associated
154
with the adherens junction’, but the data was not shown (McCartney and Fehon,
1996); and the third, refering to expanded, stated ‘Ex protein is close to or in adherens
junctions’ (Boedigheimer et al., 1997). Other papers are more cautious and state that
Merlin and/or expanded are adjacent to adherens junctions without stating whether
they are apical or basal to them (Edgar, 2006) or avoid specificity altogether, referring
only to ‘apical junctions’ as the localisation of Merlin and expanded (Maitra et al.,
2006). Another FERM containing protein, coracle, is found at septate junctions, and
appears to be required for SJ integrity as well as embryonic and larval development
(Ward et al., 2001).
It is apparent that much clarification is required in this field. However, some
information can be gleaned from the chaos. In Drosophila, neuroglian, moesin,
merlin, expanded and another FERM protein, coracle, are all found at signalling
junctions of the epithelium, potentially at structures that are homologous to
mammalian paranodes, where neurofascin 155, Ezrin, and Merlin are found. Willin
has also been seen in Schwann cells (Figure 4.6), and thus may also turn out to
localise at the paranode. It is not yet known what role the FERM proteins may play at
the paranode, but neurofascin is required for its formation and proper recruitment of
many of its proteins (Sherman et al., 2005). It is also known that merlin defects can
lead to abnormal myelination (Giovannini et al., 2000) and to dedifferentiation of
Schwann cells from a myelinating stage to a growth stage (Hung et al., 2002). Of
course, merlin defects are also the chief cause of Schwann cell tumours (Giovannini et
al., 2000). Clearly, proliferative and developmental processes are at work, and the
nature of these proteins makes it likely that they are being put together in a molecular
architecture that allows for the complex signalling required of such a tightly-regulated
system as myelination. One model for explaining the potential interactions and
155
physiological functions of this complex arrangement is shown in Figure 6.1 and is as
follows: in development of the peripheral nervous system, neurofascin 155 and Ezrin
interact to promote growth and axoglial contact. Merlin and Willin then join the
complex, perhaps by one binding to Ezrin to oppose its action, while the other binds
to neurofascin 155 to stabilise the paranode. A loss of Merlin leads to a loss of
compact myelin and, possibly by the continued action of Ezrin, Schwann cells
develop into schwannomas. The action of Willin alone may be enough to slow, but
not prevent, proliferation, leading to the known slow growth phenotype of these
tumours (Propp et al., 2006). It is certain that this is far too simplistic an explanation;
it does not explain how Caspr, a known interactant of merlin (Denisenko-Nehrbass et
al., 2003) and neurofascin (Charles et al., 2002), nor how the various potential
signalling pathways known to affect and be affected by the ERMs, merlin and
neurofascin are involved. However, it does provide a basic set of interactions for
future study, able to be done in either Drosophila or mammalian systems, which may
lead to greater insights into this complex field.
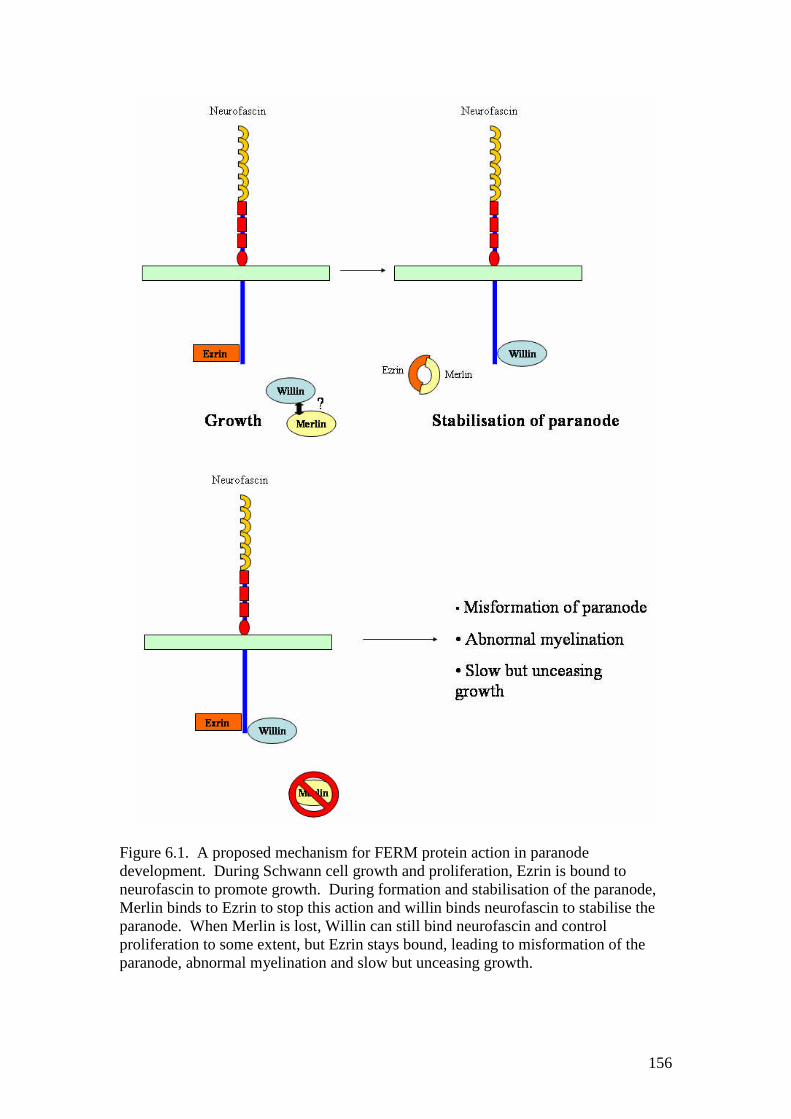
156
Figure 6.1. A proposed mechanism for FERM protein action in paranodedevelopment. During Schwann cell growth and proliferation, Ezrin is bound toneurofascin to promote growth. During formation and stabilisation of the paranode,Merlin binds to Ezrin to stop this action and willin binds neurofascin to stabilise theparanode. When Merlin is lost, Willin can still bind neurofascin and controlproliferation to some extent, but Ezrin stays bound, leading to misformation of theparanode, abnormal myelination and slow but unceasing growth.
157
6.2. Future work
There is still a great deal to be discovered about Willin. Which signalling
pathways are involved in the Willin translocation observed in PC12 cells stimulated
by growth factors? Does Willin bind the cytoskeleton and phospholipids in vivo?
Does Willin associate with the ERMs and Merlin, other L1 family members and other
receptors? Does Willin self-associate like the ERMs and Merlin, and does it exist in
both active and inactive forms; if so, what triggers the change between these two
forms? Are the two splice variants of Willin significantly different from each other in
their behaviour and distribution? Perhaps most importantly, what role does Willin
play in the body?
It will be essential in the future, particularly to answer the final question, to
knock out Willin expression and observe the effects. In cell culture, this can be done
with RNA interference (RNAi), in which short fragments, known as short interference
RNA (siRNA), bind to mRNA and knock down expression of a gene (Bass, 2000).
Specific siRNAs to Willin have been designed, and will first be tested against cells
expressing Willin-GFP to ensure that the GFP signal is reduced. As the lack of a
strong antibody would make it difficult to detect native protein expression levels,
Northern blots to detect mRNA may be the best alternative for monitoring gene
expression. The second avenue, which would follow successful RNAi experiments,
would be to produce a transgenic Willin knockout animal. This should preferably be
an inducible, conditional knockout that can be 'switched on' in specific tissues of
interest in order to avoid problems such as embryonic lethals and potentially
confounding problems from other tissues. An inducible Cre-lox recombination
system (Brocard et al., 1997) would be ideal for this, and an obvious place to start
would be in Schwann cells. One could predict that deleting Willin in Schwann cells
158
could lead to defects in myelination and overgrowth, and perhaps disruption of
paranodes and neurofascin155 localisation. Structural defects could be monitored by
electron microscopy, and to overcome antibody issues, a GFP or lacZ labelled system
with Northern blot confirmation could be used to monitor gene expression and
subsequent gene silencing. However, it is also important to produce a good antibody
able to detect both splice variants so the native protein, whatever it may be, can be
studied, thus eliminating concerns about overexpression and the effect of tags. This
would also allow for closer study within tissues and better information for interpreting
function.
Efforts should also be continued to confirm putative and discover novel
binding partners for Willin. Once technical challenges are overcome, a screen should
be performed for potential new partners. More evidence is also required to support or
disprove the hypothesis that Willin a potential homologue of Expanded, possibly by
testing whether Willin expression can rescue Expanded mutants. This could be done
by expressing a human Willin gene in a Drosophila system, as has been performed
successfully with human Merlin and lethal Drosophila Merlin mutants (LaJeunesse et
al., 1998). The pWillin-mCherry construct that has been recently produced can be
used to study the potential interaction between Willin and Merlin as well, as these two
proteins could be expected to behave similarly to their Drosophila counterparts if
indeed Willin is expanded. Co-localisation studies with Merlin1-GFP should be
performed in future.
As a FERM protein, it is likely that Willin is involved in a multitude of
signalling pathways, and certainly this possibility is strengthened by its suggested
localisation to lipid rafts and translocation under growth factor stimulation. Expanded
is also involved in signalling, most clearly through the Hippo pathway, where it

159
interacts with Merlin and regulates transcriptions factors such as Cyclin E (Edgar,
2006). Cyclins, and indeed most of the Hippo pathway proteins, have mammalian
homologues (Xiao et al., 2005; Chan et al., 2005; Tamaskovic et al., 2003), and could
thus be a good starting point for investigation of Willin's role in signalling. Cyclin D,
which is affected by human Merlin (Xiao et al., 2005) and Cyclin E are studied by
Prof. CS Herrington, our collaborator in the Bute Medical School, and would thus be
ideal markers to observe in knockdown and knockout experiments as well. If Willin
acts like expanded, the observed levels of at least one of the Cyclins could be
expected to increase concomitant cell proliferation (Edgar, 2006), and this could be
detected by Cyclin staining and cell counting without the need for a Willin antibody.
In addition, the role of Rho family small GTPases should also be investigated as
potential effectors of Willin translocation as observed in PC12 cells.

160
References
Ahronowitz, I., Xin, W., Kiely, R., Sims, K., MacCollin, M., and Nunes, F. P. (2007).Mutational spectrum of the NF2 gene: A meta-analyslis of 12 years of research anddiagnostic laboratory findings. Human Mutation 28, 1-12.
Amieva, M. R., Wilgenbus, K. K., and Furthmayr, H. (1994). Radixin Is a Componentof Hepatocyte Microvilli in-Situ. Experimental Cell Research 210, 140-144.
Amieva, M. R., and Furthmayr, H. (1995). Subcellular-Localization of Moesin inDynamic Filopodia, Retraction Fibers, and Other Structures Involved in SubstrateExploration, Attachment, and Cell-Cell Contacts. Experimental Cell Research 219,180-196.
Ashburner, M., and Bergman, C. M. (2005). Drosophila melanogaster: A case studyof a model genomic sequence and its consequences. Genome Research 15, 1661-1667.
Auvinen, E., Kivi, N., and Vaheri, A. (2007). Regulation of ezrin localization by Rac1and PIPK in human epithelial cells. Experimental Cell Research 313, 824-833.
Banerjee, S., Pillai, A. M., Paik, R., Li, J. J., and Bhat, M. A. (2006). Axonalensheathment and septate junction formation in the peripheral nervous system ofDrosophila. Journal of Neuroscience 26, 3319-3329.
Barret, C., Roy, C., Montcourrier, P., Mangeat, P., and Niggli, V. (2000). Mutagenesisof the phosphatidylinositol 4,5-bisphosphate (PIP2) binding site in the NH2-terminaldomain of ezrin correlates with its altered cellular distribution. Journal of CellBiology 151, 1067-1079.
Bashour, A. M., Meng, J. J., Ip, W., MacCollin, M., and Ratner, N. (2002). TheNeurofibromatosis Type 2 Gene Product, merlin, Reverses the F-Actin CytoskeletalDefects in Primary Human Schwannoma Cells. Molecular and Cellular Biology 22,1150-1157.
Bass, B. L. (2000). Double-stranded RNA as a template for gene silencing. Cell 101,235-238.
Baumgartner, S., Littleton, J. T., Broadie, K., Bhat, M. A., Harbecke, R., Lengyel, J.A., ChiquetEhrismann, R., Prokop, A., and Bellen, H. J. (1996). A Drosophilaneurexin is required for septate junction and blood-nerve barrier formation andfunction. Cell 87, 1059-1068.
Berryman, M., Franck, Z., and Bretscher, A. (1993). Ezrin Is Concentrated in theApical Microvilli of a Wide Variety of Epithelial-Cells Whereas Moesin Is FoundPrimarily in Endothelial-Cells. Journal of Cell Science 105, 1025-1043.
161
Blaumueller, C. M., Mlodzik, Marek (2000). The Drosophila tumor suppressorexpanded regulates growth, apoptosis, and patterning during development.Mechanisms of Development 92, 251-262.
Boedigheimer, M., and Laughon, A. (1993). Expanded - a Gene Involved in theControl of Cell-Proliferation in Imaginal Disks. Development 118, 1291-1301.
Boedigheimer, M. J., Nguyen, K. P., and Bryant, P. J. (1997). expanded functions inthe apical cell domain to regulate the growth rate of imaginal discs. DevelopmentalGenetics 20, 103-110.
Bonilha, V. L., Finnemann, S. C., and Rodriguez-Boulan, E. (1999). Ezrin promotesmorphogenesis of apical microvilli and basal infoldings in retinal pigment epithelium.Journal of Cell Biology 147, 1533-1547.
Brault, E., Gautreau, A., Lamarine, M., Callebaut, I., Thomas, G., and Goutebroze, L.(2001). Normal membrane localization and actin association of the NF2 tumorsuppressor protein are dependent on folding of its N-terminal domain. J Cell Sci 114,1901-1912.
Bretscher, A., Reczek, D., and Berryman, M. (1997). Ezrin: a protein requiringconformational activation to link microfilaments to the plasma membrane in theassembly of cell surface structures. Journal of Cell Science 110, 3011-3018.
Bretscher, A., Chambers, D., Nguyen, R., and Reczek, D. (2000). ERM-Merlin andEBP50 protein families in plasma membrane organization and function. Annu RevCell Dev Biol 16, 113-143.
Bretscher, A., Edwards, K., and Fehon, R. G. (2002). ERM proteins and merlin:integrators at the cell cortex. Nat Rev Mol Cell Biol 3, 586-599.
Brocard, J., Warot, X., Wendling, O., Messaddeq, N., Vonesch, J. L., Chambon, P.,and Metzger, D. (1997). Spatio-temporally controlled site-specific somaticmutagenesis in the mouse. Proceedings of the National Academy of Sciences of theUnited States of America 94, 14559-14563.
Buhusi, M., Midkiff, B. R., Gates, A. M., Richter, M., Schachner, M., and Maness, P.F. (2003). Close homolog of L1 is an enhancer of integrin-mediated cell migration.Journal of Biological Chemistry 278, 25024-25031.
Cao, T. T., Deacon, H. W., Reczek, D., Bretscher, A., and von Zastrow, M. (1999). Akinase-regulated PDZ-domain interaction controls endocytic sorting of the beta 2-adrenergic receptor. Nature 401, 286-290.
Chan, E. H., Nousiainen, M., Chalamalasetty, R. B., Schafer, A., Nigg, E. A., andSillie, H. H. (2005). The Ste20-like kinase Mst2 activates the human large tumorsuppressor kinase Lats1. Oncogene 24, 2076-2086.
Chang, B. J., Cho, I. J., and Brophy, P. J. (2000). A study on the immunocytochemicallocalization of neurofascin in rat sciatic nerve. J Vet Sci 1, 67-71.
162
Charles, P., Tait, S., Faivre-Sarrailh, C., Barbin, G., Gunn-Moore, F., Denisenko-Nehrbass, N., Guennoc, A. M., Girault, J. A., Brophy, P. J., and Lubetzki, C. (2002).Neurofascin is a glial receptor for the paranodin/Caspr-contactin axonal complex atthe axoglial junction. Current Biology 12, 217-220.
Chen, J., and Mandel, L. J. (1997). Unopposed phosphatase action initiates ezrindysfunction: a potential mechanism for anoxic injury. American Journal ofPhysiology-Cell Physiology 42, C710-C716.
Chen, S., Mantei, N., Dong, L., and Schachner, M. (1999). Prevention of neuronal celldeath by neural adhesion molecules L1 and CHL1. Journal of Neurobiology 38, 428-439.
Cheng, L., Itoh, K., and Lemmon, V. (2005). L1-mediated branching is regulated bytwo ezrin-radixin-moesin (ERM)-binding sites, the RSLE region and a noveljuxtamembrane ERM-binding region. J Neurosci 25, 395-403.
Chishti, A. H., Kim, A. C., Marfatia, S. M., Lutchman, M., Hanspal, M., Jindal, H.,Liu, S. C., Low, P. S., Rouleau, G. A., Mohandas, N., et al. (1998). The FERMdomain: a unique module involved in the linkage of cytoplasmic proteins to themembrane. Trends Biochem Sci 23, 281-282.
Cho, E., Feng, Y., Rauskolb, C., Maitra, S., Fehon, R., and Irvine, K. D. (2006).Delineation of a Fat tumor suppressor pathway. Nat Genet.
Conacci-Sorrell, M. E., Ben-Yedidia, T., Shtutman, M., Feinstein, E., Einat, P., andBen-Ze'ev, A. (2002). Nr-CAM is a target gene of the beta-catenin/LEF-1 inmelanoma and colon cancer and its expression enhances motility and conferstumorigenesis. Genes & Development 16, 2058-2072.
Conboy, J. G. (1986). Molecular-Cloning and Characterization of the Gene Codingfor Red-Cell Membrane Skeletal Protein-4.1. Biorheology 23, 218-218.
Correas, I. (1991). Characterization of Isoforms of Protein-4.1 Present in the Nucleus.Biochemical Journal 279, 581-585.
Crawford, R. M., Treharne, K. J., Best, O. G., Muimo, R., Riemen, C. E., and Mehta,A. (2005). A novel physical and functional association between nucleosidediphosphate kinase A and AMP-activated protein kinase alpha1 in liver and lung.Biochem J 392, 201-209.
Crepaldi, T., Gautreau, A., Comoglio, P. M., Louvard, D., and Arpin, M. (1997).Ezrin is an effector of hepatocyte growth factor-mediated migration andmorphogenesis in epithelial cells. Journal of Cell Biology 138, 423-434.Curto, M., and McClatchey, A. I. (2004). Ezrin...a metastatic detERMinant? CancerCell 5, 113-114.
163
Davey, F., Hill, M., Falk, J., Sans, N., and Gunn-Moore, F. J. (2005). Synapseassociated protein 102 is a novel binding partner to the cytoplasmic terminus ofneurone-glial related cell adhesion molecule. Journal of Neurochemistry 94, 1243-1253.
Davis, J. Q., Mclaughlin, T., and Bennett, V. (1993). Ankyrin-Binding ProteinsRelated to Nervous-System Cell-Adhesion Molecules - Candidates to ProvideTransmembrane and Intercellular Connections in Adult Brain. Journal of Cell Biology121, 121-133.
Davis, J. Q., and Bennett, V. (1994). Ankyrin Binding-Activity Shared by theNeurofascin/L1/Nrcam Family of Nervous-System Cell-Adhesion Molecules. Journalof Biological Chemistry 269, 27163-27166.
Davis, J. Q., Lambert, S., and Bennett, V. (1996). Molecular composition of the nodeof Ranvier: Identification of ankyrin-binding cell adhesion molecules neurofascin(Mucin+ third FNIII domain-) and NrCAM at nodal axon segments. Journal of CellBiology 135, 1355-1367.
Decker, L., and ffrench-Constant, C. (2004). Lipid rafts and integrin activationregulate oligodendrocyte survival. Journal of Neuroscience 24, 3816-3825.
Defacque, H., Egeberg, M., Habermann, A., Diakonova, M., Roy, C., Mangeat, P.,Voelter, W., Marriott, G., Pfannstiel, J., Faulstich, H., and Griffiths, G. (2000).Involvement of ezrin/moesin in de novo actin assembly on phagosomal membranes.Embo Journal 19, 199-212.
Deguen, B., Merel, P., Goutebroze, L., Giovannini, M., Reggio, H., Arpin, M., andThomas, G. (1998). Impaired interaction of naturally occurring mutant NF2 proteinwith actin-based cytoskeleton and membrane. Hum Mol Genet 7, 217-226.
Demyanenko, G. P., Tsai, A. Y., and Maness, P. F. (1999). Abnormalities in neuronalprocess extension, hippocampal development, and the ventricular system of L1knockout mice. Journal of Neuroscience 19, 4907-4920.
Denisenko-Nehrbass, N., Goutebroze, L., Galvez, T., Bonnon, C., Stankoff, B., Ezan,P., Giovannini, M., Faivre-Sarrailh, C., and Girault, J. A. (2003). Association ofCaspr/paranodin with tumour suppressor schwannomin/merlin and beta1 integrin inthe central nervous system. J Neurochem 84, 209-221.
Dhodapkar, K. M., Friedlander, D., Scholes, J., and Grumet, M. (2001). Differentialexpression of the cell-adhesion molecule Nr-CAM in hyperplastic and neoplastichuman pancreatic tissue. Human Pathology 32, 396-400.Dichamp, C., Taillibert, S., Aguirre-Cruz, L., Lejeune, J., Marie, Y., Kujas, M. E.,Delattre, J. Y., Hoang-Xuan, K., and Sanson, M. (2004). Loss of 14q chromosome inoligodendroglial and astrocytic tumors. Journal of Neuro-Oncology 67, 281-285.
Dickson, T. C., Mintz, C. D., Benson, D. L., and Salton, S. R. (2002). Functionalbinding interaction identified between the axonal CAM L1 and members of the ERMfamily. J Cell Biol 157, 1105-1112.

164
Dihne, M., Bernreuther, C., Sibbe, M., Paulus, W., and Schachner, M. (2003). A newrole for the cell adhesion molecule L1 in neural precursor cell proliferation,differentiation, and transmitter-specific subtype generation. Journal of Neuroscience23, 6638-6650.
Dirks, P., Thomas, U., and Montag, D. (2006). The cytoplasmic domain of NrCAMbinds to PDZ domains of synapse-associated proteins SAP90/PSD95 and SAP97.European Journal of Neuroscience 24, 25-31.
Doi, Y., Itoh, M., Yonemura, S., Ishihara, S., Takano, H., Noda, T., Tsukita, S., andTsukita, S. (1999). Normal development of mice and unimpaired cell adhesion cellmotility actin-based cytoskeleton without compensatory up-regulation of ezrin orradixin in moesin gene knockout. Journal of Biological Chemistry 274, 2315-2321.
Dubreuil, R. R., MacVicar, G., Dissanayake, S., Liu, C. H., Homer, D., and Hortsch,M. (1996). Neuroglian-mediated cell adhesion induces assembly of the membraneskeleton at cell contact sites. Journal of Cell Biology 133, 647-655.
Edgar, B. A. (2006). From cell structure to transcription: Hippo forges a new path.Cell 124, 267-273.
Edidin, M. (2003). The state of lipid rafts: from model membranes to cells. Annu RevBiophys Biomol Struct 32, 257-283.
Einheber, S., Zanazzi, G., Ching, W., Scherer, S., Milner, T. A., Peles, E., and Salzer,J. L. (1997). The axonal membrane protein Caspr, a homologue of neurexin IV, is acomponent of the septate-like paranodal junctions that assemble during myelination.Journal of Cell Biology 139, 1495-1506.
Evans, D. G. R., Huson, S. M., Donnai, D., Neary, W., Blair, V., Newton, V., andHarris, R. (1992). A Clinical-Study of Type-2 Neurofibromatosis. Quarterly Journalof Medicine 84, 603-618.
Faivre-Sarrailh, C., Banerjee, S., Li, J. J., Hortsch, M., Laval, M., and Bhat, M. A.(2004). Drosophila contactin, a homolog of vertebrate contactin, is required forseptate junction organization and paracellular barrier function. Development 131,4931-4942.
Fehon, R. G., Dawson, I. A., and Artavanistsakonas, S. (1994). A DrosophilaHomolog of Membrane-Skeleton Protein-4.1 Is Associated with Septate Junctions andIs Encoded by the Coracle Gene. Development 120, 545-557.
Franck, Z., Gary, R., and Bretscher, A. (1993). Moesin, Like Ezrin, Colocalizes withActin in the Cortical Cytoskeleton in Cultured-Cells, but Its Expression Is MoreVariable. Journal of Cell Science 105, 219-231.

165
Fukasawa, T., Chono, J. M., Sakurai, S., Koshiishi, N., Ikeno, R., Tanaka, A.,Matsumoto, Y., Hayashi, Y., Koike, M., and Fukayama, M. (2000). Allelic loss of 14qand 22q, NF2 mutation, and genetic instability occur independently of c-kit mutationin gastrointestinal stromal tumor. Japanese Journal of Cancer Research 91, 1241-1249.
Garcia-Alonso, L., Romani, S., and Jimenez, F. (2000). The EGF and FGF receptorsmediate neuroglian function to control growth cone decisions during sensory axonguidance in Drosophila. Neuron 28, 741-752.
Gatto, C. L., Walker, B. J., and Lambert, S. (2003). Local ERM activation anddynamic growth cones at Schwann cell tips implicated in efficient formation of nodesof Ranvier. J Cell Biol 162, 489-498.
Gautreau, A., Poullet, P. R., Louvard, D., and Arpin, M. (1999). Ezrin, a plasmamembrane-microfilament linker, signals cell survival through the phosphatidylinositol3-kinase/Akt pathway. Proceedings of the National Academy of Sciences of theUnited States of America 96, 7300-7305.
Gautreau, A., Louvard, D., and Arpin, M. (2002). ERM proteins and NF2 tumorsuppressor: the Yin and Yang of cortical actin organization and cell growth signaling.Curr Opin Cell Biol 14, 104-109.
Genova, J. L., and Fehon, R. G. (2003). Neuroglian, Gliotactin, and the Na+/K+ATPase are essential for septate junction function in Drosophila. Journal of CellBiology 161, 979-989.
Giovannini, M., Robanus-Maandag, E., van der Valk, M., Niwa-Kawakita, M.,Abramowski, V., Goutebroze, L., Woodruff, J. M., Berns, A., and Thomas, G. (2000).Conditional biallelic Nf2 mutation in the mouse promotes manifestations of humanneurofibromatosis type 2. Genes & Development 14, 1617-1630.
Gronholm, M., Sainio, M., Zhao, F., Heiska, L., Vaheri, A., and Carpen, O. (1999).Homotypic and heterotypic interaction of the neurofibromatosis 2 tumor suppressorprotein merlin and the ERM protein ezrin. J Cell Sci 112 ( Pt 6), 895-904.
Gronholm, M., Muranen, T., Toby, G. G., Utermark, T., Hanemann, C. O., Golemis,E. A., and Carpen, O. (2006). A functional association between merlin and HEI10, acell cycle regulator. Oncogene 25, 4389-4398.
Gunn-Moore, F. J., Welsh, G. I., Herron, L. R., Brannigan, F., Venkateswarlu, K.,Gillespie, S., Brandwein-Gensler, M., Madan, R., Tavare, J. M., Brophy, P. J., et al.(2005). A novel 4.1 ezrin radixin moesin (FERM)-containing protein, 'Willin'. FEBSLett 579, 5089-5094.
Gunn-Moore, F. J., Hill, M., Davey, F., Herron, L. R., Tait, S., Sherman, D., andBrophy, P. J. (2006). A functional FERM domain binding motif in neurofascin.Molecular and Cellular Neuroscience 33, 441-446.
166
Gutmann, D. H. (2001). The neurofibromatoses: when less is more. Hum Mol Genet10, 747-755.
Haas, M. A., Vickers, J. C., and Dickson, T. C. (2004). Binding partners L1 celladhesion molecule and the ezrin-radixin-moesin (ERM) proteins are involved indevelopment and the regenerative response to injury of hippocampal and corticalneurons. Eur J Neurosci 20, 1436-1444.
Haas, M. A., Vickers, J. C., and Dickson, T. C. (2007). Rho kinase activates ezrin-radixin-moesin (ERM) proteins and mediates their function in cortical neuron growth,morphology and motility in vitro. Journal of Neuroscience Research 85, 34-46.
Hall, S. G., and Bieber, A. J. (1997). Mutations in the Drosophila neuroglian celladhesion molecule affect motor neuron pathfinding and peripheral nervous systempatterning. Journal of Neurobiology 32, 325-340.
Hamada, K., Shimizu, T., Matsui, T., Tsukita, S., and Hakoshima, T. (2000).Structural basis of the membrane-targeting and unmasking mechanisms of the radixinFERM domain. Embo J 19, 4449-4462.
Hamada, K., Shimizu, T., Yonemura, S., Tsukita, S., and Hakoshima, T. (2003).Structural basis of adhesion-molecule recognition by ERM proteins revealed by thecrystal structure of the radixin-ICAM-2 complex. Embo J 22, 502-514.
Hamaratoglu, F., Willecke, M., Kango-Singh, M., Nolo, R., Hyun, E., Tao, C., Jafar-Nejad, H., and Halder, G. (2006). The tumour-suppressor genes NF2/Merlin andExpanded act through Hippo signalling to regulate cell proliferation and apoptosis.Nat Cell Biol 8, 27-36.
Harrison, G. M., Davies, G., Martin, T. A., Jiang, W. G., and Mason, M. D. (2002).Distribution and expression of CD44 isoforms and Ezrin during prostate cancer-endothelium interaction. International Journal of Oncology 21, 935-940.
Hassel, B., Rathjen, F. G., and Volkmer, H. (1997). Organization of the neurofascingene and analysis of developmentally regulated alternative splicing. Journal ofBiological Chemistry 272, 28742-28749.
Hemming, N. J., Anstee, D. J., Mawby, W. J., Reid, M. E., and Tanner, M. J. A.(1994). Localization of the Protein 4.1-Binding Site on Human ErythrocyteGlycophorin-C and Glycophorin-D. Biochemical Journal 299, 191-196.
Henry, M. D., Agosti, C. G., and Solomon, F. (1995). Molecular Dissection ofRadixin - Distinct and Interdependent Functions of the Amino-Terminal and Carboxy-Terminal Domains. Journal of Cell Biology 129, 1007-1022.
Hillenbrand, R., Molthagen, M., Montag, D., and Schachner, M. (1999). The closehomologue of the neural adhesion molecule L1 (CHL1): patterns of expression andpromotion of neurite outgrowth by heterophilic interactions. European Journal ofNeuroscience 11, 813-826.

167
Hortsch, M. (2000). Structural and functional evolution of the L1 family: Are fouradhesion molecules better than one? Molecular and Cellular Neuroscience 15, 1-10.
Howell, O. W., Palser, A., Polito, A., Melrose, S., Zonta, B., Scheiermann, C., Vora,A. J., Brophy, P. J., and Reynolds, R. (2006). Disruption of neurofascin localizationreveals early changes preceding demyelination and remyelination in multiplesclerosis. Brain 129, 3173-3185.
Huang, J. B., Wu, S., Barrera, J., Matthews, K., and Pan, D. J. (2005). The Hipposignaling pathway coordinately regulates cell proliferation and apoptosis byinactivating Yorkie, the Drosophila homolog of YAP. Cell 122, 421-434.
Hung, G., Colton, J., Fisher, L., Oppenheimer, M., Faudoa, R., Slattery, W., andLinthicum, F. (2002). Immunohistochemistry study of human vestibular nerveschwannoma differentiation. Glia 38, 363-370.
Ishibashi, T., Dupree, J. L., Ikenaka, K., Hirahara, Y., Honke, K., Peles, E., Popko, B.,Suzuki, K., Nishino, H., and Baba, H. (2002). A myelin galactolipid, sulfatide, isessential for maintenance of ion channels on myelinated axon but not essential forinitial cluster formation. Journal of Neuroscience 22, 6507-6514.
Ishiguro, H., Liu, Q. R., Gong, J. P., Hall, F. S., Ujike, H., Morales, M., Sakurai, T.,Grumet, M., and Uhl, G. R. (2006). NrCAM in addiction vulnerability: Positionalcloning, drug-regulation, haplotype-specific expression, and altered drug reward inknockout mice. Neuropsychopharmacology 31, 572-584.
Itoh, K., Fushiki, S., Kamiguchi, H., Arnold, B., Altevogt, P., and Lemmon, V.(2005). Disrupted Schwann cell-axon interactions in peripheral nerves of mice withaltered L1-integrin interactions. Molecular and Cellular Neuroscience 30, 131-136.
Kahya, N., Brown, D. A., and Schwille, P. (2005). Raft partitioning and dynamicbehavior of human placental alkaline phosphatase in giant unilamellar vesicles.Biochemistry 44, 7479-7489.Kamiguchi, H., and Lemmon, V. (1998). A neuronal form of the cell adhesionmolecule L1 contains a tyrosine-based signal required for sorting to the axonal growthcone. Journal of Neuroscience 18, 3749-3756.
Kaul, S. C., Mitsui, Y., Komatsu, Y., Reddel, R. R., and Wadhwa, R. (1996). A highlyexpressed 81 kDa protein in immortalized mouse fibroblasts: Its proliferative functionand identity with ezrin. Oncogene 13, 1231-1237.
Kissil, J. L., Wilker, E. W., Johnson, K. C., Eckman, M. S., Yaffe, M. B., and Jacks,T. (2003). Merlin, the product of the Nf2 tumor suppressor gene, is an inhibitor of thep21-activated kinase, Pak1. Mol Cell 12, 841-849.
Krieg, J., and Hunter, T. (1992). Identification of the 2 Major Epidermal GrowthFactor-Induced Tyrosine Phosphorylation Sites in the Microvillar Core Protein Ezrin.Journal of Biological Chemistry 267, 19258-19265.
168
LaJeunesse, D. R., McCartney, B. M., and Fehon, R. G. (1998). Structural analysis ofDrosophila merlin reveals functional domains important for growth control andsubcellular localization. J Cell Biol 141, 1589-1599.
Lallemand, D., Curto, M., Saotome, I., Giovannini, M., and McClatchey, A. I. (2003).NF2 deficiency promotes tumorigenesis and metastasis by destabilizing adherensjunctions. Genes Dev 17, 1090-1100.
Lamb, R. F., Ozanne, B. W., Roy, C., McGarry, L., Stipp, C., Mangeat, P., and Jay,D. G. (1997). Essential functions of ezrin in maintenance of cell shape andlamellipodial extension in normal and transformed fibroblasts. Current Biology 7,682-688.
Lamb, R. S., Ward, R. E., Schweizer, L., and Fehon, R. G. (1998). Drosophilacoracle, a member of the protein 4.1 superfamily, has essential structural functions inthe septate junctions and developmental functions in embryonic and adult epithelialcells. Molecular Biology of the Cell 9, 3505-3519.
Lane, R. P., Chen, X. N., Yamakawa, K., Vielmetter, J., Korenberg, J. R., and Dreyer,W. J. (1996). Characterization of a highly conserved human homolog to the chickenneural cell surface protein Bravo/Nr-CAM that maps to chromosome band 7q31.Genomics 35, 456-465.
Lankes, W., Griesmacher, A., Grunwald, J., Schwartzalbiez, R., and Keller, R. (1988).A Heparin-Binding Protein Involved in Inhibition of Smooth-Muscle Cell-Proliferation. Biochemical Journal 251, 831-842.
Lankes, W. T., and Furthmayr, H. (1991). Moesin - a Member of the Protein-4.1 TalinEzrin Family of Proteins. Proceedings of the National Academy of Sciences of theUnited States of America 88, 8297-8301.
Leone, P. E., Bello, M. J., de Campos, J. M., Vaquero, J., Sarasa, J. L., Pestana, A.,and Rey, J. A. (1999). NF2 gene mutations and allelic status of 1p, 14q and 22q insporadic meningiomas. Oncogene 18, 2231-2239.
Levy, B., Mukherjee, T., and Hirschhorn, K. (2000). Molecular cytogenetic analysisof uterine leiomyoma and leiomyosarcoma by comparative genomic hybridization.Cancer Genetics and Cytogenetics 121, 1-8.
Li, Q. Z., Nance, M. R., Kulikauskas, R., Nyberg, K., Fehon, R., Karplus, P. A.,Bretscher, A., and Tesmer, J. J. G. (2007). Self-masking in an intact ERM-merlinprotein: An active role for the central alpha-helical domain. Journal of MolecularBiology 365, 1446-1459.
Li, W., and Crouch, D. H. (2000). Cloning and expression profile of chicken radixin.Biochimica Et Biophysica Acta-Gene Structure and Expression 1491, 327-332.
Liu, H. S., Jan, M. S., Chou, C. K., Chen, P. H., and Ke, N. J. (1999). Is greenfluorescent protein toxic to the living cells? Biochemical and Biophysical ResearchCommunications 260, 712-717.
169
Luque, C. M., and Milan, M. (2007). Growth control in the proliferative region of theDrosophila eye-head primordium: the elbow-noc gene complex. Dev Biol 301, 327-339.
Macdonald, J. L., and Pike, L. J. (2005). A simplified method for the preparation ofdetergent-free lipid rafts. J Lipid Res 46, 1061-1067.
Madan, R., Brandwein-Gensler, M., Schlecht, N. F., Elias, K., Gorbovitsky, E.,Belbin, T. J., Mahmood, R., Breining, D., Qian, H., Childs, G., et al. (2006).Differential tissue and subcellular expression of ERM proteins in normal andmalignant tissues: Cytoplasmic ezrin expression has prognostic signficance for headand neck squamous cell carcinoma. Head and Neck-Journal for the Sciences andSpecialties of the Head and Neck 28, 1018-1027.
Maddala, R., Reddy, V. N., Epstein, D. L., and Rao, V. (2003). Growth factor inducedactivation of Rho and Rac GTPases and actin cytoskeletal reorganization in humanlens epithelial cells. Molecular Vision 9, 329-336.
Maier, O., Baron, W., and Hoekstra, D. (2007). Reduced raft-association of NF155 inactive MS-lesions is accompanied by the disruption of the paranodal junction. Glia55, 885-895.
Maitra, S., Kulikauskas, R. M., Gavilan, H., and Fehon, R. G. (2006). The tumorsuppressors Merlin and Expanded function cooperatively to modulate receptorendocytosis and signaling. Curr Biol 16, 702-709.
Mangeat, P., Roy, C., and Martin, M. (1999). ERM proteins in cell adhesion andmembrane dynamics. Trends Cell Biol 9, 187-192.
Marshall, C. J. (1995). Specificity of Receptor Tyrosine Kinase Signaling - TransientVersus Sustained Extracellular Signal-Regulated Kinase Activation. Cell 80, 179-185.
Martin, M., Andreoli, C., Sahuquet, A., Montcourrier, P., Algrain, M., and Mangeat,P. (1995). Ezrin Nh2-Terminal Domain Inhibits the Cell Extension Activity of theCooh-Terminal Domain. Journal of Cell Biology 128, 1081-1093.
Martin, M., Roy, C., Montcourrier, P., Sahuquet, A., and Mangeat, P. (1997). Threedeterminants in ezrin are responsible for cell extension activity. Molecular Biology ofthe Cell 8, 1543-1557.
McCartney, B. M., and Fehon, R. G. (1996). Distinct cellular and subcellular patternsof expression imply distinct functions for the Drosophila homologues of moesin andthe neurofibromatosis 2 tumor suppressor, merlin. J Cell Biol 133, 843-852.
McCartney, B. M., Kulikauskas, R. M., LaJeunesse, D. R., and Fehon, R. G. (2000).The neurofibromatosis-2 homologue, Merlin, and the tumor suppressor expandedfunction together in Drosophila to regulate cell proliferation and differentiation.Development 127, 1315-1324.
170
McClatchey, A. I., and Giovannini, M. (2005). Membrane organization andtumorigenesis--the NF2 tumor suppressor, Merlin. Genes Dev 19, 2265-2277.
McLaughlin, M. E., Kruger, G. M., Slocum, K. L., Crowley, D., Michaud, N. A.,Huang, J., Magendantz, M., and Jacks, T. (2007). The Nf2 tumor suppressor reulatescell-cell adhesion during tissue fusion. Proceedings of the National Academy ofSciences of the United States of America 104, 3261-3266.
Menegoz, M., Gaspar, P., LeBert, M., Galvez, T., Burgaya, F., Palfrey, C., Ezan, P.,Amos, F., and Girault, J. A. (1997). Paranodin, a glycoprotein of neuronal paranodalmembranes. Neuron 19, 319-331.
Meng, J. J., Lowrie, D. J., Sun, H., Dorsey, E., Pelton, P. D., Bashour, A. M., Groden,J., Ratner, N., and Ip, W. (2000). Interaction Between Two Isoforms of the NF2Tumor Suppressor Protein, Merlin, and Between Merlin and Ezrin, SuggestsModulation of ERM Proteins by Merlin. Journal of Neuroscience Research 62, 491-502.
Muranen, T., Gronholm, M., Renkema, G. H., and Carpen, O. (2005). Cell cycle-dependent nucleocytoplasmic shuttling of the neurofibromatosis 2 tumour suppressormerlin. Oncogene 24, 1150-1158.
Ng, T., Parsons, M., Hughes, W. E., Monypenny, J., Zicha, D., Gautreau, A., Arpin,M., Gschmeissner, S., Verveer, P. J., Bastiaens, P. I. H., and Parker, P. J. (2001).Ezrin is a downstream effector of trafficking PKC-integrin complexes involved in thecontrol of cell motility. Embo Journal 20, 2723-2741.
Nguyen, R., Reczek, D., and Bretscher, A. (2001). Hierarchy of merlin and ezrin N-and C-terminal domain interactions in homo- and heterotypic associations and theirrelationship to binding of scaffolding proteins EBP50 and E3KARP. J Biol Chem276, 7621-7629.
Niggli, V., Andreoli, C., Roy, C., and Mangeat, P. (1995). Identification of aPhosphatidylinositol-4,5-Bisphosphate-Binding Domain in the N-Terminal Region ofEzrin. Febs Letters 376, 172-176.
Obremski, V. J., Hall, A. M., and Fernandez-Valle, C. (1998). Merlin, theneurofibromatosis type 2 gene product, and beta1 integrin associate in isolated anddifferentiating Schwann cells. J Neurobiol 37, 487-501.
Okada, T., Lopez-Lago, M., and Giancotti, F. G. (2005). Merlin/NF-2 mediatescontact inhibition of growth by suppressing recruitment of Rac to the plasmamembrane. J Cell Biol 171, 361-371.
Pasternack, G. R., Anderson, R. A., Leto, T. L., and Marchesi, V. T. (1985).Interactions between Protein-4.1 and Band-3 - an Alternative Binding-Site for anElement of the Membrane Skeleton. Journal of Biological Chemistry 260, 3676-3683.
171
Pearson, M. A., Reczek, D., Bretscher, A., and Karplus, P. A. (2000). Structure of theERM protein moesin reveals the FERM domain fold masked by an extended actinbinding tail domain. Cell 101, 259-270.
Pellock, B. J., Buff, E., White, K., and Hariharan, I. K. (2007). The Drosophila tumorsuppressors Expanded and Merlin differentially regulate cell cycle exit, apoptosis, andWingless signaling. Developmental Biology 304, 102-115.
Pelton, P. D., Sherman, L. S., Rizvi, T. A., Marchionni, M. A., Wood, P., Friedman,R. A., and Ratner, N. (1998). Ruffling membrane, stress fiber, cell spreading andproliferation abnormalities in human Schwannoma cells. Oncogene 17, 2195-2209.
Pietromonaco, S. F., Simons, P. C., Altman, A., and Elias, L. (1998). Protein kinaseC-theta phosphorylation of moesin in the actin-binding sequence. Journal ofBiological Chemistry 273, 7594-7603.
Polesello, C., and Payre, F. (2004). Small is beautiful: what flies tell us about ERMprotein function in development. Trends Cell Biol 14, 294-302.
Pujuguet, P., Del Maestro, L., Gautreau, A., Louvard, D., and Arpin, M. (2003). Ezrinregulates E-cadherin-dependent adherens junction assembly through Rac1 activation.Molecular Biology of the Cell 14, 2181-2191.
Rathjen, F. G., and Schachner, M. (1984). Immunocytological and Biochemical-Characterization of a New Neuronal Cell-Surface Component (L1-Antigen) Which IsInvolved in Cell-Adhesion. Embo Journal 3, 1-10.
Reed, J. A., Lin, Q. H., Chen, D. H., Mian, I. S., and Medrano, E. E. (2005). SKIpathways inducing progression of human melanoma. Cancer and Metastasis Reviews24, 265-272.
Richardson, H., Okeefe, L. V., Marty, T., and Saint, R. (1995). Ectopic Cyclin-EExpression Induces Premature Entry into S Phase and Disrupts Pattern-Formation inthe Drosophila Eye Imaginal Disc. Development 121, 3371-3379.
Roy, C., Martin, M., and Mangeat, P. (1997). A dual involvement of the amino-terminal domain of ezrin in F- and G-actin binding. Journal of Biological Chemistry272, 20088-20095.
Sakurai, T., Ramoz, N., Reichert, J. G., Corwin, T. E., Kryzak, L., Smith, C. J.,Silverman, J. M., Hollander, E., and Buxbaum, J. D. (2006). Association analysis ofthe NrCAM gene in autism and in subsets of families with severe obsessive-compulsive or self-stimulatory behaviors. Psychiatric Genetics 16, 251-257.
Sato, N., Yonemura, S., Obinata, T., Tsukita, S., and Tsukita, S. (1991). Radixin, aBarbed End-Capping Actin-Modulating Protein, Is Concentrated at the CleavageFurrow During Cytokinesis. Journal of Cell Biology 113, 321-330.

172
Sato, N., Funayama, N., Nagafuchi, A., Yonemura, S., Tsukita, S., and Tsukita, S.(1992). A Gene Family Consisting of Ezrin, Radixin and Moesin - Its SpecificLocalization at Actin Filament Plasma-Membrane Association Sites. Journal of CellScience 103, 131-143.
Schafer, D. P., Bansal, R., Hedstrom, K. L., Pfeiffer, S. E., and Rasband, M. N.(2004). Does paranode formation and maintenance require partitioning of neurofascin155 into lipid rafts? Journal of Neuroscience 24, 3176-3185.
Scherer, S. S., and Gutmann, D. H. (1996). Expression of the neurofibromatosis 2tumor suppressor gene product, merlin, in Schwann cells. J Neurosci Res 46, 595-605.
Shaw, R. J., Henry, M., Solomon, F., and Jacks, T. (1998a). RhoA-dependentphosphorylation and relocalization of ERM proteins into apical membrane/actinprotrusions in fibroblasts. Mol Biol Cell 9, 403-419.
Shaw, R. J., McClatchey, A. I., and Jacks, T. (1998b). Localization and functionaldomains of the neurofibromatosis type II tumor suppressor, merlin. Cell GrowthDiffer 9, 287-296.
Shaw, R. J., Paez, J. G., Curto, M., Yaktine, A., Pruitt, W. M., Saotome, I., O'Bryan,J. P., Gupta, V., Ratner, N., Der, C. J., et al. (2001). The Nf2 tumor suppressor,merlin, functions in Rac-dependent signaling. Dev Cell 1, 63-72.
Sherman, D. L., Tait, S., Melrose, S., Johnson, R., Zonta, B., Court, F. A., Macklin,W. B., Meek, S., Smith, A. J. H., Cottrell, D. F., and Brophy, P. J. (2005).Neurofascins are required to establish axonal domains for saltatory conduction.Neuron 48, 737-742.
Sherman, L., Xu, H. M., Geist, R. T., Saporito-Irwin, S., Howells, N., Ponta, H.,Herrlich, P., and Gutmann, D. H. (1997). Interdomain binding mediates tumor growthsuppression by the NF2 gene product. Oncogene 15, 2505-2509.
Silva, E., Tsatskis, Y., Gardano, L., Tapon, N., and McNeill, H. (2006). The Tumor-Suppressor Gene fat Controls Tissue Growth Upstream of Expanded in the HippoSignaling Pathway. Curr Biol.
Simons, K., and Ehehalt, R. (2002). Cholesterol, lipid rafts, and disease. Journal ofClinical Investigation 110, 597-603.
Smith, W. J., Nassar, N., Bretscher, A., Cerione, R. A., and Karplus, P. A. (2003).Structure of the active N-terminal domain of Ezrin. Conformational and mobilitychanges identify keystone interactions. J Biol Chem 278, 4949-4956.
Speck, O., Hughes, S. C., Noren, N. K., Kulikauskas, R. M., and Fehon, R. G. (2003).Moesin functions antagonistically to the Rho pathway to maintain epithelial integrity.Nature 421, 83-87.
173
Stickney, J. T., Bacon, W. C., Rojas, M., Ratner, N., and Ip, W. (2004). Activation ofthe tumor suppressor merlin modulates its interaction with lipid rafts. Cancer Res 64,2717-2724.
Stokowski, R. P., and Cox, D. R. (2000). Functional analysis of the neurofibromatosistype 2 protein by means of disease-causing point mutations. Am J Hum Genet 66,873-891.
Sun, C. X., Robb, V. A., and Gutmann, D. H. (2002). Protein 4.1 tumor suppressors:getting a FERM grip on growth regulation. J Cell Sci 115, 3991-4000.
Tait, S., Gunn-Moore, F., Collinson, J. M., Huang, J., Lubetzki, C., Pedraza, L.,Sherman, D. L., Colman, D. R., and Brophy, P. J. (2000). An oligodendrocyte celladhesion molecule at the site of assembly of the paranodal axo-glial junction. Journalof Cell Biology 150, 657-666.
Takahashi, K., Sasaki, T., Mammoto, A., Takaishi, K., Kameyama, T., Tsukita, S.,Tsukita, S., and Takai, Y. (1997). Direct interaction of the Rho GDP dissociationinhibitor with ezrin/radixin/moesin initiates the activation of the Rho small G protein.Journal of Biological Chemistry 272, 23371-23375.
Takahashi, K., Sasaki, T., Mammoto, A., Hotta, I., Takaishi, K., Imamura, H.,Nakano, K., Kodama, A., and Takai, Y. (1998). Interaction of radixin with Rho smallG protein GDP/GTP exchange protein Dbl. Oncogene 16, 3279-3284.
Takeuchi, K., Kawashima, A., Nagafuchi, A., and Tsukita, S. (1994a). Structuraldiversity of band 4.1 superfamily members. J Cell Sci 107 ( Pt 7), 1921-1928.
Takeuchi, K., Sato, N., Kasahara, H., Funayama, N., Nagafuchi, A., Yonemura, S.,and Tsukita, S. (1994b). Perturbation of cell adhesion and microvilli formation byantisense oligonucleotides to ERM family members. J Cell Biol 125, 1371-1384.
Tamaskovic, R., Bichsel, S. J., and Hemmings, B. A. (2003). NDR family of AGCkinases - essential regulators of the cell cycle and morphogenesis. Febs Letters 546,73-80.
Tepass, U., and Tanentzapf, G. (2001). Epithelial cell polarity and cell junctions inDrosophila. Annual Review of Genetics 35, 747-784.
Terawaki, S., Maesaki, R., and Hakoshima, T. (2006). Structural basis for NHERFrecognition by ERM proteins. Structure 14, 777-789.
Theobald, M., Christiansen, H., Schmidt, A., Melekian, B., Wolkewitz, N.,Christiansen, N. M., Brinkschmidt, C., Berthold, F., and Lampert, F. (1999).Sublocalization of putative tumor suppressor gene loci on chromosome arm 14q inneuroblastoma. Genes Chromosomes & Cancer 26, 40-46.
Trofatter, J. A., Maccollin, M. M., Rutter, J. L., Murrell, J. R., Duyao, M. P., Parry, D.M., Eldridge, R., Kley, N., Menon, A. G., Pulaski, K., et al. (1993). A Novel Moesin-

174
Like, Ezrin-Like, Radixin-Like Gene Is a Candidate for the Neurofibromatosis-2Tumor Suppressor. Cell 72, 791-800.
Tse, J. Y. M., Ng, H. K., Lau, K. M., Lo, K. W., Poon, W. S., and Huang, D. P.(1997). Loss of heterozygosity of chromosome 14q in low- and high-grademeningiomas. Human Pathology 28, 779-785.
Tsukita, S., Hieda, Y., and Tsukita, S. (1989). A New 82-Kd Barbed End-CappingProtein (Radixin) Localized in the Cell-to-Cell Adherens Junction - Purification andCharacterization. Journal of Cell Biology 108, 2369-2382.
Tsukita, S., Oishi, K., Sato, N., Sagara, J., and Kawai, A. (1994). ERM familymembers as molecular linkers between the cell surface glycoprotein CD44 and actin-based cytoskeletons. J Cell Biol 126, 391-401.
Turunen, O., Sainio, M., Jaaskelainen, J., Carpen, O., and Vaheri, A. (1998).Structure-function relationships in the ezrin family and the effect of tumor-associatedpoint mutations in neurofibromatosis 2 protein. Biochim Biophys Acta 1387, 1-16.
Turunen, O., Wahlstrom, T., and Vaheri, A. (1994). Ezrin has a COOH-terminalactin-binding site that is conserved in the ezrin protein family. J Cell Biol 126, 1445-1453.
Ussar, S., Wang, H. V., Linder, S., Fassler, R., and Moser, M. (2006). The Kindlins:Subcellular localization and expression during murine development. ExperimentalCell Research 312, 3142-3151.
Venkateswarlu, K., Gunn-Moore, F., Tavare, J. M., and Cullen, P. J. (1999). EGF-and NGF-stimulated translocation of cytohesin-1 to the plasma membrane of PC12cells requires PI 3-kinase activation and a functional cytohesin-1 PH domain. Journalof Cell Science 112, 1957-1965.
Volkmer, H., Hassel, B., Wolff, J. M., Frank, R., and Rathjen, F. G. (1992). Structureof the Axonal Surface Recognition Molecule Neurofascin and Its Relationship to aNeural Subgroup of the Immunoglobulin Superfamily. Journal of Cell Biology 118,149-161.
Walensky, L. D., Shi, Z. T., Blackshaw, S., DeVries, A. C., Demas, G. E., Gascard,P., Nelson, R. J., Conboy, J. G., Rubin, E. M., Snyder, S. H., and Mohandas, N.(1998). Neurobehavioral deficits in mice lacking the erythrocyte membranecytoskeletal protein 4.1. Current Biology 8, 1269-1272.
Wang, S. L., Hawkins, C. J., Yoo, S. J., Muller, H. A. J., and Hay, B. A. (1999). TheDrosophila caspase inhibitor DIAP1 is essential for cell survival and is negativelyregulated by HID. Cell 98, 453-463.
Ward, R. E. t., Schweizer, L., Lamb, R. S., and Fehon, R. G. (2001). The protein 4.1,ezrin, radixin, moesin (FERM) domain of Drosophila Coracle, a cytoplasmiccomponent of the septate junction, provides functions essential for embryonicdevelopment and imaginal cell proliferation. Genetics 159, 219-228.

175
Wei, J., Hortsch, M., and Goode, S. (2004). Neuroglian stabilizes epithelial structureduring Drosophila oogenesis. Developmental Dynamics 230, 800-808.
Wick, W., Grimmel, C., Wild-Bode, C., Platten, M., Arpin, M., and Weller, M.(2001). Ezrin-dependent promotion of glioma cell clonogenicity, motility, andinvasion mediated by BCL-2 and transforming growth factor-beta 2. Journal ofNeuroscience 21, 3360-3368.
Wu, K. L., Khan, S., Lakhe-Reddy, S., Jarad, G., Mukherjee, A., Obejero-Paz, C. A.,Konieczkowski, M., Sedor, J. R., and Schelling, J. R. (2004). The NHE1 Na+/H+exchanger recruits ezrin/radixin/moesin proteins to regulate Akt-dependent cellsurvival. Journal of Biological Chemistry 279, 26280-26286.
Xiao, G. H., Gallagher, R., Shetler, J., Skele, K., Altomare, D. A., Pestell, R. G.,Jhanwar, S., and Testa, J. R. (2005). The NF2 tumor suppressor gene product, merlin,inhibits cell proliferation and cell cycle progression by repressing cyclin D1expression. Molecular and Cellular Biology 25, 2384-2394.
Xu, H. M., and Gutmann, D. H. (1998). Merlin differentially associates with themicrotubule and actin cytoskeleton. J Neurosci Res 51, 403-415.
Yamasaki, M., Thompson, P., and Lemmon, V. (1997). CRASH syndrome: Mutationsin L1CAM correlate with severity of the disease. Neuropediatrics 28, 175-178.
Yawata, A., Kanzaki, A., Gilsanz, F., Delaunay, J., and Yawata, Y. (1997). Amarkedly disrupted skeletal network with abnormally distributed intramembraneparticles in complete protein 4.1-deficient red blood cells (allele 4.1 Madrid):Implications regarding a critical role of protein 4.1 in maintenance of the integrity ofthe red blood cell membrane. Blood 90, 2471-2481.
Yonemura, S., Hirao, M., Doi, Y., Takahashi, N., Kondo, T., and Tsukita, S. (1998).Ezrin/radixin/moesin (ERM) proteins bind to a positively charged amino acid clusterin the juxta-membrane cytoplasmic domain of CD44, CD43, and ICAM-2. J Cell Biol140, 885-895.
Yonemura, S., and Tsukita, S. (1999). Direct involvement of ezrin/radixin/moesin(ERM)-binding membrane proteins in the organization of microvilli in collaborationwith activated ERM proteins. J Cell Biol 145, 1497-1509.
Yonemura, S., Matsui, T., Tsukita, S., and Tsukita, S. (2002). Rho-dependent and -independent activation mechanisms of ezrin/radixin/moesin proteins: an essential rolefor polyphosphoinositides in vivo. Journal of Cell Science 115, 2569-2580.
Zelina, P., Avci, H. X., Thelen, K., and Pollerberg, G. E. (2005). The cell adhesionmolecule NrCAM is crucial for growth cone behaviour and pathfinding of retinalganglion cell axons. Development 132, 3609-3618.
Zhou, R. H., Zhu, L. X., Kodani, A., Hauser, P., Yao, X. B., and Forte, J. G. (2005).Phosphorylation of ezrin on threonine 567 produces a change in secretory phenotypeand repolarizes the gastric parietal cell. Journal of Cell Science 118, 4381-4391.

Appendix 1: Accession numbers, DNA and Protein sequences
Human Willin DNA sequence, accession number BC020521
ATGAACAAATTGAATTTTCATAACAACAGAGTCATGCAAGACCGCCGCAGTGTGTGCATTTTCCTTCCCAACGATGAATCTCTGAACATCATCATAAATGTTAAGATTCTGTGTCACCAGTTGCTGGTCCAGGTTTGTGACCTGCTCAGGCTAAAGGACTGCCACCTCTTTGGACTCAGTGTTATACAAAATAATGAACATGTGTATATGGAGTTGTCACAAAAGCTTTACAAATATTGTCCAAAAGAATGGAAGAAAGAGGCCAGCAAGGGTATCGACCAATTTGGGCCTCCTATGATCATCCACTTCCGTGTGCAGTACTATGTGGAAAATGGCAGATTGATCAGTGACAGAGCAGCAAGATACTATTATTACTGGCACCTGAGAAAACAAGTTCTTCATTCTCAGTGTGTGCTCCGAGAGGAGGCCTACTTCCTGCTGGCAGCCTTTGCCCTGCAGGCTGATCTTGGGAACTTCAAAAGGAATAAGCACTATGGAAAATACTTCGAGCCAGAGGCTTACTTCCCATCTTGGGTTGTTTCCAAGAGGGGGAAGGACTACATCCTGAAGCACATTCCAAACATGCACAAAGATCAGTTTGCACTAACAGCTTCCGAAGCTCATCTTAAATATATCAAAGAGGCTGTCCGACTGGATGACGTCGCTGTTCATTACTACAGATTGTATAAGGATAAAAGGGAAATTGAAGCATCGCTGACTCTTGGATTGACCATGAGGGGAATACAGATTTTTCAGAATTTAGATGAAGAGAAACAATTACTTTATGATTTCCCCTGGACAAATGTTGGAAAATTGGTGTTTGTGGGTAAGAAATTTGAGATTTTGCCAGATGGCTTGCCTTCTGCCCGGAAGCTCATATACTACACGGGGTGCCCCATGCGCTCCAGACACCTCCTGCAACTTCTGAGCAACAGCCACCGCCTCTATATGAATCTGCAGCCTGTCCTGCGCCATATCCGGAAGCTGGAGGAAAACGAAGAGAAGAAGCAGTACCGGGAATCTTACATCAGTGACAACCTGGACCTCGACATGGACCAGCTGGAAAAACGGTCGCGGGCCAGCGGGAGCAGTGCGGGCAGCATGAAACACAAGCGCCTGTCCCGTCATTCCACCGCCAGCCACAGCAGTTCCCACACCTCGGGCATTGAGGCAGACACCAAGCCCCGGGACACGGGGCCAGAAGACAGCTACTCCAGCAGTGCCATCCACCGCAAGCTGAAAACCTGCAGCTCAATGACCAGTCATGGCAGCTCCCACACCTCAGGGGTGGAGAGTGGCGGCAAAGACCGGCTGGAAGAGGACTTACAGGACGATGAAATAGAGATGTTGGTTGATGACCCCCGGGATCTGGAGCAGATGAATGAAGAGTCTCTGGAAGTCAGCCCAGACATGTGCATCTACATCACAGAGGACATGCTCATGTCGCGGAAGCTGAATGGACACTCTGGGTTGATTGTGAAAGAAATTGGGTCTTCCACCTCGAGCTCTTCAGAAACAGTTGTTAAGCTTCGTGGCCAGAGTACTGATTCTCTTCCACAGACTATATGTCGGAAACCAAAGACCTCCACTGATCGACACAGCTTGAGCCTCGATGACATCAGACTTTACCAGAAAGACTTCCTGCGCATTGCAGGTCTGTGTCAGGACACTGCTCAGAGTTACACCTTTGGATGTGGCCATGAACTGGATGAGGAAGGCCTCTATTGCAACAGTTGCTTGGCCCAGCAGTGCATCAACATCCAAGATGCTTTTCCAGTCAAAAGAACCAGCAAATACTTTTCTCTGGATCTCACTCATGATGAAGTTCCAGAGTTTGTTGTGTAA
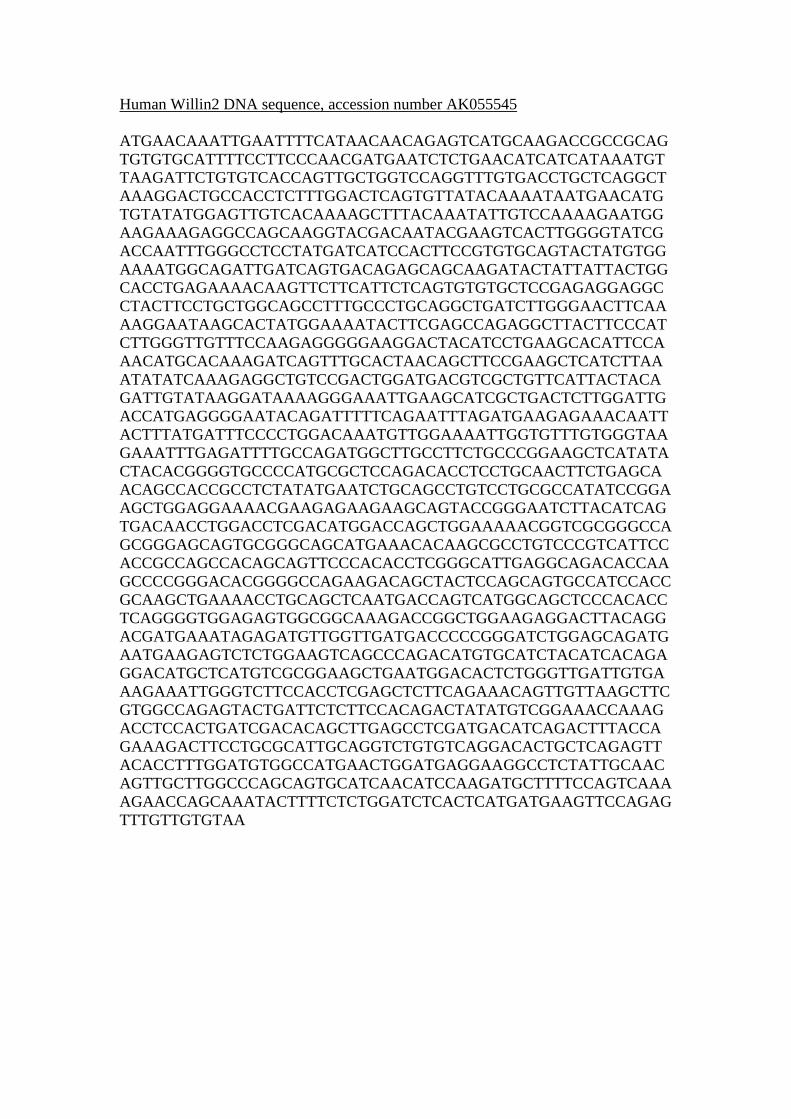
Human Willin2 DNA sequence, accession number AK055545
ATGAACAAATTGAATTTTCATAACAACAGAGTCATGCAAGACCGCCGCAGTGTGTGCATTTTCCTTCCCAACGATGAATCTCTGAACATCATCATAAATGTTAAGATTCTGTGTCACCAGTTGCTGGTCCAGGTTTGTGACCTGCTCAGGCTAAAGGACTGCCACCTCTTTGGACTCAGTGTTATACAAAATAATGAACATGTGTATATGGAGTTGTCACAAAAGCTTTACAAATATTGTCCAAAAGAATGGAAGAAAGAGGCCAGCAAGGTACGACAATACGAAGTCACTTGGGGTATCGACCAATTTGGGCCTCCTATGATCATCCACTTCCGTGTGCAGTACTATGTGGAAAATGGCAGATTGATCAGTGACAGAGCAGCAAGATACTATTATTACTGGCACCTGAGAAAACAAGTTCTTCATTCTCAGTGTGTGCTCCGAGAGGAGGCCTACTTCCTGCTGGCAGCCTTTGCCCTGCAGGCTGATCTTGGGAACTTCAAAAGGAATAAGCACTATGGAAAATACTTCGAGCCAGAGGCTTACTTCCCATCTTGGGTTGTTTCCAAGAGGGGGAAGGACTACATCCTGAAGCACATTCCAAACATGCACAAAGATCAGTTTGCACTAACAGCTTCCGAAGCTCATCTTAAATATATCAAAGAGGCTGTCCGACTGGATGACGTCGCTGTTCATTACTACAGATTGTATAAGGATAAAAGGGAAATTGAAGCATCGCTGACTCTTGGATTGACCATGAGGGGAATACAGATTTTTCAGAATTTAGATGAAGAGAAACAATTACTTTATGATTTCCCCTGGACAAATGTTGGAAAATTGGTGTTTGTGGGTAAGAAATTTGAGATTTTGCCAGATGGCTTGCCTTCTGCCCGGAAGCTCATATACTACACGGGGTGCCCCATGCGCTCCAGACACCTCCTGCAACTTCTGAGCAACAGCCACCGCCTCTATATGAATCTGCAGCCTGTCCTGCGCCATATCCGGAAGCTGGAGGAAAACGAAGAGAAGAAGCAGTACCGGGAATCTTACATCAGTGACAACCTGGACCTCGACATGGACCAGCTGGAAAAACGGTCGCGGGCCAGCGGGAGCAGTGCGGGCAGCATGAAACACAAGCGCCTGTCCCGTCATTCCACCGCCAGCCACAGCAGTTCCCACACCTCGGGCATTGAGGCAGACACCAAGCCCCGGGACACGGGGCCAGAAGACAGCTACTCCAGCAGTGCCATCCACCGCAAGCTGAAAACCTGCAGCTCAATGACCAGTCATGGCAGCTCCCACACCTCAGGGGTGGAGAGTGGCGGCAAAGACCGGCTGGAAGAGGACTTACAGGACGATGAAATAGAGATGTTGGTTGATGACCCCCGGGATCTGGAGCAGATGAATGAAGAGTCTCTGGAAGTCAGCCCAGACATGTGCATCTACATCACAGAGGACATGCTCATGTCGCGGAAGCTGAATGGACACTCTGGGTTGATTGTGAAAGAAATTGGGTCTTCCACCTCGAGCTCTTCAGAAACAGTTGTTAAGCTTCGTGGCCAGAGTACTGATTCTCTTCCACAGACTATATGTCGGAAACCAAAGACCTCCACTGATCGACACAGCTTGAGCCTCGATGACATCAGACTTTACCAGAAAGACTTCCTGCGCATTGCAGGTCTGTGTCAGGACACTGCTCAGAGTTACACCTTTGGATGTGGCCATGAACTGGATGAGGAAGGCCTCTATTGCAACAGTTGCTTGGCCCAGCAGTGCATCAACATCCAAGATGCTTTTCCAGTCAAAAGAACCAGCAAATACTTTTCTCTGGATCTCACTCATGATGAAGTTCCAGAGTTTGTTGTGTAA

Mouse Willin2 DNA sequence, accession number BC053929
ATGAACAAACTGACCTTCCATAACAACAAAGCCATGCAGGACCGTCGCAGAGTGTGTATTTTCCTCCCCAATGACAAGTCCGTGAGCATCATCATAAATGTTAAAATTCTGTGTCACCAGTTGCTGGTCCAGGTGTGTGACCTGCTCAGGTTAAAGGACAGTCACCTCTTTGGTCTCAGTGTTATACAAAATAATGAACATGTATATATGGAATTGTCACAAAAGCTTTATAAGTATTGTCCAAAAGAATGGAAAAAGGAGGCCAGCAAGGTACGGCAATACGAAGTCACTTGGGGCATCGACCAGTTTGGGCCCCCCATGATCATCCACTTCCGGGTGCAGTACTACGTGGAGAATGGGAAGCTGATCAGTGACCGAATTGCAAGATACTATTATTACTGGCACCTACGGAAACAGGTGCTGCACTCCCAGTGTGTGCTCAGAGAGGAGGCCTACTTCCTGCTGGCAGCCTTTGCACTGCAAGCTGACCTCGGCAACTTCAAAAGGAAACTGCACCACGGAGACTACTTTGAGCCAGAGGCTTACTTCCCGGCATGGGTTGTTTCCAAGCGGGGGAAGGACTACATCCTGAAACACATCCCAAACATGCACAAGGACCAGTTTGCCCTGACGGCCTCCGAGGCCTACCTAAAGTACATCAAAGAAGCCGTCCGACTGGACGACGTCGCCATCCATTACTACAGACTGTACAAGGATAAAAGGGAGGCTGAAGGCTCACTGACCCTAGGACTGACCATGCGAGGAATACAGATTTTTCAGAATCTAGAAGAAGAGAAACAATTGCTCTATGATTTCCCCTGGACAAATGTTGGGAAGTTGGTGTTTGTGGGCAAGAAGTTTGAGATTTTGCCAGATGGCCTTCCCTCCGCCAGGAAGCTGGTCTACTACACAGGGTGTCCCACGCGCTCCCGGCATCTCCTGCAGCTCCTGAGCAACAGCCACCGCCTCTACATGAACCTGCAGCCCGTCCTGCGCCACCTCCGCAAGCAGGAGGAGAATGAAGAGAAAAAGCAGTACCGGGAATCCTACATCAGCGACAACCTGGACCTTGACATGGACCCGCTGGAAAAGCGGTCCCGAGCCAGTGGGAGCAGCGCTGGCAGCGTGAAGCATAAGCGCCTGTCCCGCCACTCCACGGCCAGCCACAGCAGCTCCCACACCTCCGGCATCGAGGCAGACACCAAGCCCCGGGACCCAGGGCCGGAAGACAGCTGTTCAGGCAGCGCCATGCACCGGAAGCTGAAGACCTGCAGCTCCATGACCAGCCACGGCAGCTCCCACACCTCTGGGGTTGAGAGTGGAGGCAAAGACCGCCTGGAAGAGGACTCGCAAGATGAGGAAATCGAGATGCTGGTGGATGACCCCAGGGACCTGGAGCCGATGCCTGAAGAGTCGCTGGAAGTCAGCCCAGAGATGTGTATCTACATCACGGAAGATATGCTCCTGTCGAGGAAGCTGAACGGACACTCAGGGTTAATTGTGAAAGAAATCGGCTCCTCCACCTCCAGCTCTTCGGAAACGGTTGTCAGGCTGCGTGGACAGAGCACCGACTCCCTTCCACAGACGATATGTCGAAAACCAAAGACTTCCACCGATCGCCATAGCCTGAGCCTTGACGACATCAGACTGTACCAGAAAGACTTCCTGCGCATCGCGGGCCTGTGTCAGGACACTGCTCAGAGCTACACGTTTGGGTGTGGCCATGAACTGGATGAGAGCGGTCTCTACTGCAACAGCTGCCTGGCTCAGCAGTGTGTCAACATACAGGACGCATTCCCAGTGAAAAGAGCCAGCAAGTACTTTTCTCTGGACCTTACTCACGACGAAGTCCCAGAGTTCGTCGTCTGA
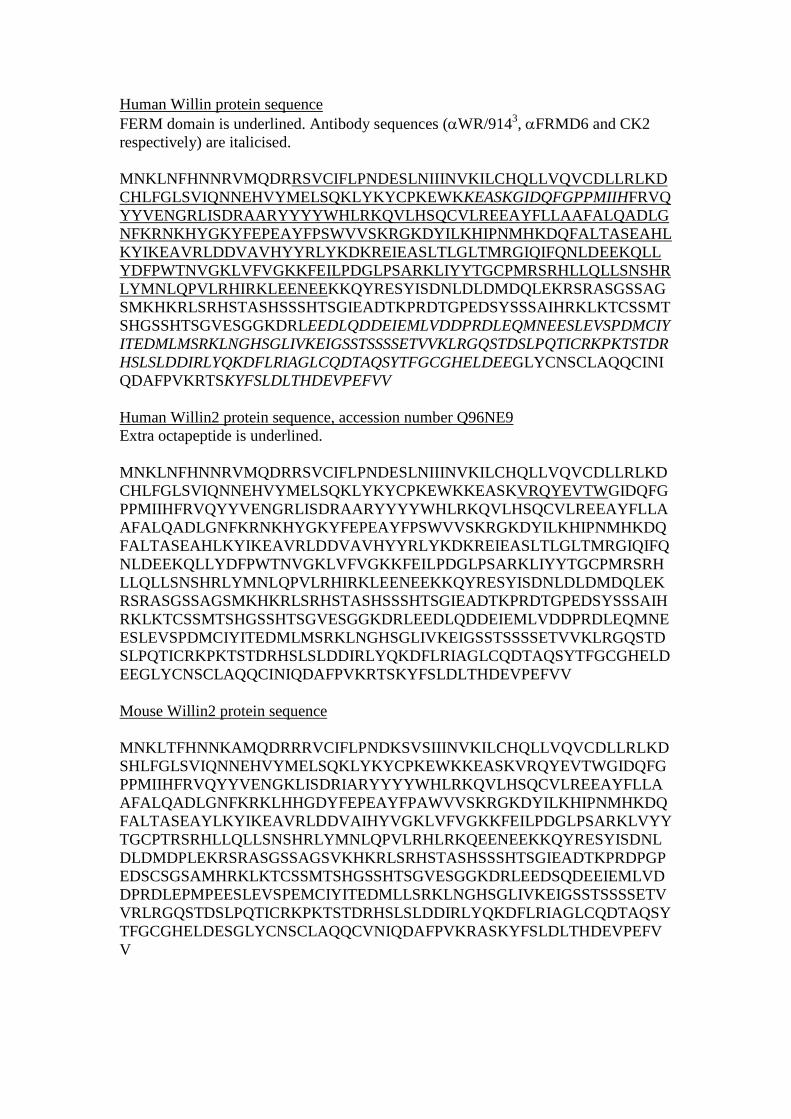
Human Willin protein sequenceFERM domain is underlined. Antibody sequences (WR/9143, FRMD6 and CK2respectively) are italicised.
MNKLNFHNNRVMQDRRSVCIFLPNDESLNIIINVKILCHQLLVQVCDLLRLKDCHLFGLSVIQNNEHVYMELSQKLYKYCPKEWKKEASKGIDQFGPPMIIHFRVQYYVENGRLISDRAARYYYYWHLRKQVLHSQCVLREEAYFLLAAFALQADLGNFKRNKHYGKYFEPEAYFPSWVVSKRGKDYILKHIPNMHKDQFALTASEAHLKYIKEAVRLDDVAVHYYRLYKDKREIEASLTLGLTMRGIQIFQNLDEEKQLLYDFPWTNVGKLVFVGKKFEILPDGLPSARKLIYYTGCPMRSRHLLQLLSNSHRLYMNLQPVLRHIRKLEENEEKKQYRESYISDNLDLDMDQLEKRSRASGSSAGSMKHKRLSRHSTASHSSSHTSGIEADTKPRDTGPEDSYSSSAIHRKLKTCSSMTSHGSSHTSGVESGGKDRLEEDLQDDEIEMLVDDPRDLEQMNEESLEVSPDMCIYITEDMLMSRKLNGHSGLIVKEIGSSTSSSSETVVKLRGQSTDSLPQTICRKPKTSTDRHSLSLDDIRLYQKDFLRIAGLCQDTAQSYTFGCGHELDEEGLYCNSCLAQQCINIQDAFPVKRTSKYFSLDLTHDEVPEFVV
Human Willin2 protein sequence, accession number Q96NE9Extra octapeptide is underlined.
MNKLNFHNNRVMQDRRSVCIFLPNDESLNIIINVKILCHQLLVQVCDLLRLKDCHLFGLSVIQNNEHVYMELSQKLYKYCPKEWKKEASKVRQYEVTWGIDQFGPPMIIHFRVQYYVENGRLISDRAARYYYYWHLRKQVLHSQCVLREEAYFLLAAFALQADLGNFKRNKHYGKYFEPEAYFPSWVVSKRGKDYILKHIPNMHKDQFALTASEAHLKYIKEAVRLDDVAVHYYRLYKDKREIEASLTLGLTMRGIQIFQNLDEEKQLLYDFPWTNVGKLVFVGKKFEILPDGLPSARKLIYYTGCPMRSRHLLQLLSNSHRLYMNLQPVLRHIRKLEENEEKKQYRESYISDNLDLDMDQLEKRSRASGSSAGSMKHKRLSRHSTASHSSSHTSGIEADTKPRDTGPEDSYSSSAIHRKLKTCSSMTSHGSSHTSGVESGGKDRLEEDLQDDEIEMLVDDPRDLEQMNEESLEVSPDMCIYITEDMLMSRKLNGHSGLIVKEIGSSTSSSSETVVKLRGQSTDSLPQTICRKPKTSTDRHSLSLDDIRLYQKDFLRIAGLCQDTAQSYTFGCGHELDEEGLYCNSCLAQQCINIQDAFPVKRTSKYFSLDLTHDEVPEFVV
Mouse Willin2 protein sequence
MNKLTFHNNKAMQDRRRVCIFLPNDKSVSIIINVKILCHQLLVQVCDLLRLKDSHLFGLSVIQNNEHVYMELSQKLYKYCPKEWKKEASKVRQYEVTWGIDQFGPPMIIHFRVQYYVENGKLISDRIARYYYYWHLRKQVLHSQCVLREEAYFLLAAFALQADLGNFKRKLHHGDYFEPEAYFPAWVVSKRGKDYILKHIPNMHKDQFALTASEAYLKYIKEAVRLDDVAIHYVGKLVFVGKKFEILPDGLPSARKLVYYTGCPTRSRHLLQLLSNSHRLYMNLQPVLRHLRKQEENEEKKQYRESYISDNLDLDMDPLEKRSRASGSSAGSVKHKRLSRHSTASHSSSHTSGIEADTKPRDPGPEDSCSGSAMHRKLKTCSSMTSHGSSHTSGVESGGKDRLEEDSQDEEIEMLVDDPRDLEPMPEESLEVSPEMCIYITEDMLLSRKLNGHSGLIVKEIGSSTSSSSETVVRLRGQSTDSLPQTICRKPKTSTDRHSLSLDDIRLYQKDFLRIAGLCQDTAQSYTFGCGHELDESGLYCNSCLAQQCVNIQDAFPVKRASKYFSLDLTHDEVPEFVV

Appendix 2: Sequences of primers used
All primers are written 5' to 3', with restriction digest sequences underlined
Primer name Primer sequence Restrictionsite
WFLAGforward
CCACCTCGAGCTCTTCAG SacI
WFLAGreverse
CGGGATCCCACAACAAACTCTGGAAC BamHI
HGex F CGGGATCCATGAACAAATTGAATTTTC BamHIWillin239rev CGGGAATTCTCACAGCGATGCTTCAATTTC EcoRIWillin322rev CGGGAATTCTTCAGACAGGCTGCAG EcoRIWillin356rev CGGGAATTCTCATTTTTCCAGCTG EcoRIWillinCTAPF ACCATGGACAAATTGAATTTTCATAAC noneWillinCTAPR TTTTCTTAAGCACAACAAACTCTGGAACTTC AflIIWillinClaI CCATCGATATGGACAAATTGAATTTTCATA ClaIWillinNheI CACTCGATCGCACAACAAACTCTGGAACTT NheIWillin2forward GGAATTCGCCATGAACAAACTGACCTTCC EcoRIWillin2reverse CGGGATCCGACGACGAACTCTGGGAC BamHI
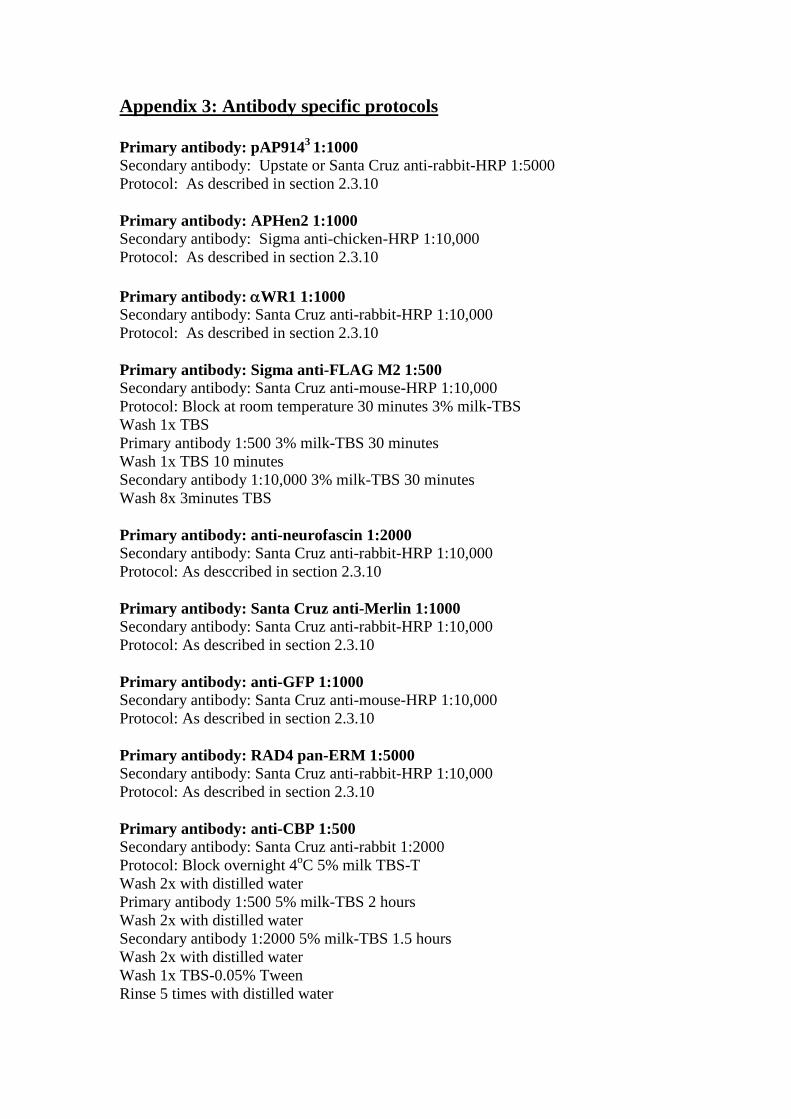
Appendix 3: Antibody specific protocols
Primary antibody: pAP9143 1:1000Secondary antibody: Upstate or Santa Cruz anti-rabbit-HRP 1:5000Protocol: As described in section 2.3.10
Primary antibody: APHen2 1:1000Secondary antibody: Sigma anti-chicken-HRP 1:10,000Protocol: As described in section 2.3.10Primary antibody: WR1 1:1000Secondary antibody: Santa Cruz anti-rabbit-HRP 1:10,000Protocol: As described in section 2.3.10
Primary antibody: Sigma anti-FLAG M2 1:500Secondary antibody: Santa Cruz anti-mouse-HRP 1:10,000Protocol: Block at room temperature 30 minutes 3% milk-TBSWash 1x TBSPrimary antibody 1:500 3% milk-TBS 30 minutesWash 1x TBS 10 minutesSecondary antibody 1:10,000 3% milk-TBS 30 minutesWash 8x 3minutes TBS
Primary antibody: anti-neurofascin 1:2000Secondary antibody: Santa Cruz anti-rabbit-HRP 1:10,000Protocol: As desccribed in section 2.3.10
Primary antibody: Santa Cruz anti-Merlin 1:1000Secondary antibody: Santa Cruz anti-rabbit-HRP 1:10,000Protocol: As described in section 2.3.10
Primary antibody: anti-GFP 1:1000Secondary antibody: Santa Cruz anti-mouse-HRP 1:10,000Protocol: As described in section 2.3.10
Primary antibody: RAD4 pan-ERM 1:5000Secondary antibody: Santa Cruz anti-rabbit-HRP 1:10,000Protocol: As described in section 2.3.10
Primary antibody: anti-CBP 1:500Secondary antibody: Santa Cruz anti-rabbit 1:2000Protocol: Block overnight 4oC 5% milk TBS-TWash 2x with distilled waterPrimary antibody 1:500 5% milk-TBS 2 hoursWash 2x with distilled waterSecondary antibody 1:2000 5% milk-TBS 1.5 hoursWash 2x with distilled waterWash 1x TBS-0.05% TweenRinse 5 times with distilled water
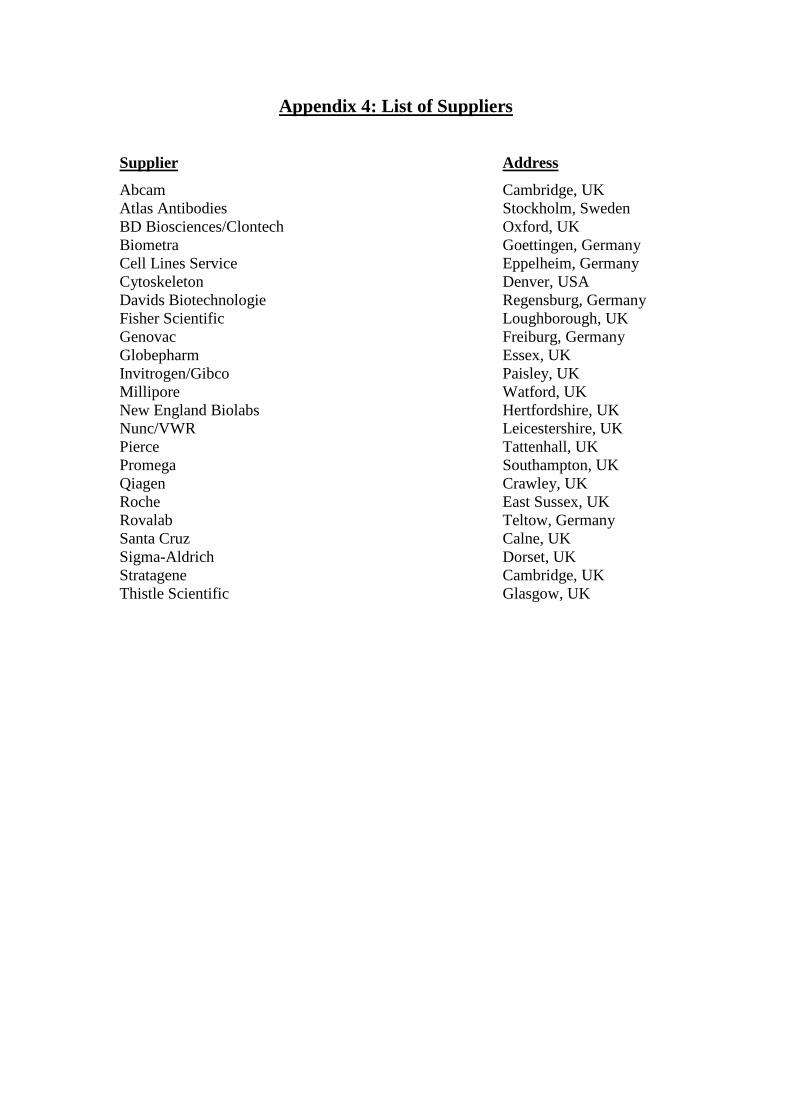
Appendix 4: List of Suppliers
Supplier Address
Abcam Cambridge, UKAtlas Antibodies Stockholm, SwedenBD Biosciences/Clontech Oxford, UKBiometra Goettingen, GermanyCell Lines Service Eppelheim, GermanyCytoskeleton Denver, USADavids Biotechnologie Regensburg, GermanyFisher Scientific Loughborough, UKGenovac Freiburg, GermanyGlobepharm Essex, UKInvitrogen/Gibco Paisley, UKMillipore Watford, UKNew England Biolabs Hertfordshire, UKNunc/VWR Leicestershire, UKPierce Tattenhall, UKPromega Southampton, UKQiagen Crawley, UKRoche East Sussex, UKRovalab Teltow, GermanySanta Cruz Calne, UKSigma-Aldrich Dorset, UKStratagene Cambridge, UKThistle Scientific Glasgow, UK