a study of influencing factors of advertising, brand
TRANSCRIPT
A Study of Influencing Factors of Advertising, Brand Awareness, Perceived Quality and Brand Association on Repurchase Intention towards Selected Beverage Brand in
Bangkok, Thailand
Mr. Arusha Assavasoth
A Thesis Submitted in Partial Fulfillment of the Requirements for the Degree of Master of Business Administration in Marketing
Graduate School of Business Assumption University Academic Year 201 7
Copyright of Assumption University

A Study of Influencing factors of Advertising, Brand Awareness, Perceived Quality
and Brand Association on Repurchase Intention towards Selected Beverage Brand
in Bangkok, Thailand
By
Arusha Assavasoth
A thesis submitted in partial fulfillment
of the requirements for the degree of
Master of Business Administration in Marketing
Examination Committee:
1. Asst. Prof. Dr. Sirion Chaipoopirutana (Advisor) …………………………….
2. Dr. Apichart Intravisit (Chairman) …………………………….
3. Dr.Vorapot Ruckthum (Member) ………………………….…
4. Dr. Ioan Voicu (Member) …………………………….
Graduate School of Business
Assumption University
Bangkok, Thailand
June, 2016
r
Thesis Title
By
Major Thesis Advisor Academic Year
A Study oflnfluencing Factors of Advertising, Brand Awareness, Perceived Quality and Brand Association on Repurchase Intention towards Selected Beverage Brand in Bangkok, Thailand Mr. Arusha Assavasoth Marketing
Assistant Professor Sirion Chaipoopirutana, Ph.D. 2017
The Graduate School of Business, Assumption University, has approved this thesis as a partial fulfillment of the requirements for the Degree of Master of Business Administration in Marketing.
Dean of the Graduate ~~~~~~~~~~~~-
School of Business
(Kitti Phothikitti, Ph.D.)
THESIS EXAMINATION COMMCTTEE
,.. ' ~ I -. I r 1
i - I
I , 1 ,tr\.11.._'1\/1 ~, · I· J C · , ' l \/\ 1 Chairman (External)
(Associate Professor Thanachai Y omj inda)
Thesis Advisor
(Assistant Professor Sirion Chaipoopirutana, Ph.D.)
~ A·-;/--= 7 Member
;::art lntravisit, Ph.D.)
(Vorapot Ruckthum, Ph.D.)
_ ______.U__,,~~~--A~l~ __ Mernber (loan Voicu, Ph.D.)

I
Abstract
The trend of non-alcohol beverages in RTD (ready-to-drink) beverage industry has gained more
and more popularity due to health consciousness of Thai people which in-turn increased competition
in the industry. As per the industry data the demand of healthy beverages has been continuously
increasing every year. As this is a very lucrative market, healthy RTD beverages has become more
competitive and challenging; therefore, it is very necessary for the marketers and managers who work
for a brand which sells its beverages to find new ways to win customers’ retention, brand awareness,
perceived quality, brand association and repurchase intentions in order to achieve sales volume and
the profitability of the business by acknowledging and understanding the potential factors leading to
behavioral intentions repurchase.
The purpose of this research is to investigate factors influencing to repurchase towards the
Ichitan brand in Thailand by emphasizing on seven potential factors, including brand awareness,
brand association, perceived quality, TV advertising, web advertising, print advertising and intensity
of distribution. The researcher applied descriptive analysis, along with the non-probability sampling
method: judgment and convenience sampling procedures. The data were collected by utilizing a self-
administered questionnaire, and distributing to 400 Thai customers who have had already drink
Ichitan branded drink in Bangkok location.
The results from multiple linear regression analysis indicated that TV advertising, print
advertising and the intensity of distribution have a significant influence on brand awareness. The
results also indicated that print advertising has a significant influence on perceived quality. In
addition, the researcher found that print advertising and intensity of distribution significantly
influenced brand association. Moreover, the researcher discovered that brand awareness, and brand
association are significantly influenced on repurchase intension; however, perceived quality is
surprisingly not significant influenced on repurchase intention towards the Ichitan brand in Thailand.

II
Acknowledgements
Firstly, I would like to express my thankfulness to my thesis advisor, Asst. Prof. Dr.Sirion
Chaipoopirutana, who supported me to complete this thesis with patience and valuable advices as I
am the one of her advisees who took very long time to conducting the task until finished and guided
me to keep on track during the time of study. Also, I am very grateful to Mr. Adrian Brian Terrell, the
editor, for grammar checking and correcting. And to the thesis committees, Dr. Apichart Intravisit,
Dr.Vorapot Ruckthum and Dr. Ioan Voicu for generous suggestions. Additionally, I am thankful to all
of the respondents who spent their valuable time to participate in the survey as well.
Finally, I must express my very profound gratitude to my beloved parents and friends for
providing me with unfailing support and continuous encouragement throughout my years of study
and through the process of researching and writing this thesis. This accomplishment would not have
been possible without their great support.
Arusha Assavasoth
17 November, 2016
III
TABLE OF CONTENTS
Contents Pages
Abstract……………………………………………………………………………………….………... I
Acknowledgements……………………………………………………………………..……………... II
Table of Contents………………………………………………………………………………….…. III
List of Tables…………………………………………………………………………………………
VII
List of Figures……………………………………………………………………………………..…. IX
Chapter 1 - GENERALITIES OF THE STUDY……………………………….…...………………...
1
1.1 Introduction of Study………………………………………………………………………………
1
1.2 Research Objectives…………….…………………………………………………….…………... 14
1.3 Statement of Problems……………………………………………………………………..…….... 15
1.4 Scope of the Research………………………………………………………………………….… 16
1.5 Limitations of the Research…………………………………….………………………...…..…… 17
1.6 Significance of the Study…………………………………………………….…………………..…
17
1.7 Definition of Terms…………………………………………………….………………………… 18
Chapter 2 - LITERATURE REVIEW…………..……………………………………………….… 20
2.1 Literature Review………………………………………………………………...…………..…… 20
IV
2.1.1 Web Advertising………………………………………………………………………….…. 20
2.1.2 Print Advertising………………………………………………………………………….….
21
2.1.3 TV Advertising……………………………………………………………………………… 22
2.1.4 Intensity of Distribution…………………………………………………………….………...
23
2.1.5 Brand Awareness…………………………………………………………………….………
23
2.1.6 Perceived Quality…………………………………………………………………………… 24
2.1.7 Brand Association…………………………………………………………………….…..…...
25
2.1.8 Repurchase Intention…………………………………………………………….……..….….
25
2.2 Related Literature Review………………………………………………………………………….
26
2.2.1 The Related Literature Review of Web advertising, Print Advertising, TV Advertising,
Intensity of distribution, and Perceived Quality…………………………………………….……...
26
2.2.2 The Related Literature Review of Web advertising, Print Advertising, TV Advertising and
Brand awareness………………………………………………………………………………..…. 27
2.2.3 The Related Literature Review of Web advertising, Print Advertising, TV Advertising,
Intensity of distribution and Brand Association…………………………………………………....
28

V
2.2.4 The Related Literature Review of Brand Awareness, Perceived Quality, Brand association
and Repurchase
intention…………………………………………………………………………..…... 28
2.3 Previous Studies……………………………………………………………………………….…. 29
Chapter 3 - RESEARCH FRAMEWORKS………………………………………………….……. 33
3.1 Theoretical Framework……………………………………………………….………………..…. 33
3.2 Conceptual Framework………………………………………………………………………….... 38
3.3 Research Hypotheses……………………………………………………………………….….…. 40
3.4 Operationalization of the Variables……………………………………………………….………
41
Chapter 4 - RESEARCH METHODOLOGY………………………………………………..….….
46
4.1 Methods of Research Used………………………………………………………………….……. 46
4.2 Respondents and Sampling Procedures…………………………………………….……......……...
47
4.2.1 Target Population…………………………………………………………………………… 47
4.2.2 Sampling Unit……………………………………………………………………….…….….
50
4.2.3 Sample Size………………………………………………………………………….………. 51
4.2.4 Sampling Procedure………………………………………………………………………….
51

VI
4.3 Research Instrument/ Questionnaire……………………………….………………………..……...
55
4.4 Pretest…………………………………………………………………………………….………. 58
4.5 Collection of Data/ Gathering Procedures………………………………………………..………...
60
4.6 Statistical Treatment of Data…………………………………………………………….………...
61
4.6.1 Descriptive Analysis………………………………………………………………..…….…...
62
4.6.2 Multiple Linear Regression Analysis (MLR)………………………………………...………. 62
4.7 Summary of Statistical Tools Used in Testing Hypotheses………………………..…......….….…. 68
Chapter 5 - PRESENTATION OF DATA AND CRITICAL DISCUSSION OF RESULTS
…………………………………………………………………………………………….……….…. 69
5.1 Descriptive Analysis…………………………………………………………………………..…...
69
5.1.1 Frequency of Demographic characteristics…………………………………………….……. 70
5.1.2 Descriptive Analysis of Independent Variable………………………………………………
76
5.2 Reliability Test……………………………………………………………………….……..……...
84
5.3 Inferential Analysis………………………………………………………………………….…….
85

VII
5.3.1 The Results of Hypotheses Testing…………………………………………………………..
85
Chapter 6 - SUMMARY, IMPLICATIONS, RECOMMENDATION, AND CONCLUSIONS
………………………………………….….………………………………………………………….. 96
6.1.1 Summary of Demographic Factors…………………………………………………………….. 96
6.1.2 Summary of Hypotheses Testing……………………………………………………………….. 97
6.2 Discussion and Implications……………………………………………………………………... 98
6.3 Conclusion……………………………………………………………………………………… 103
6.4 Recommendations…………………………………………………………………….…………
104
6.5 Further Research……………………………………………………………………………..…...
107
BIBLIOGRAPHY…………………...………………………………....……………………................. 109
INTERNET REFERENCES……………….………………………………...………….……........... 117
Appendix A………………………………………………………………………..……….....….…... 118
Appendix B…………………………………………………………………………………………
125
Appendix C……………………………………………………………………..………...…..….…... 131
Appendix D…………………………………………………………………...……………....….…... 135
VIII
LIST OF TABLES
Tables Pages
Table 1.1 Total sales volume of non-alcoholic beverages by sector, 2014-2015…………………..…... 5
Table 1.2 Net income of the Ichitan Company………………………………………………….…….
13
Table 3.1 Operationalization of the Variables……………………………………………….……..….
41
Table 4.1 The 8 selected largest shopping malls ranked by gross leasable area (GLA)
In Bangkok…………………………………………………………………………….…... 53
Table 4.2 Allocation of Questionnaires among Eight Shopping Malls……………………………….
54
Table 4.3 Summary of Number of Questions in each Part……………………………………………
58
Table 4.4 The Value of Reliability Analysis…………………………………………………………....
60
Table 4.6 The formula of ANOVA table for Regression Line……………………………………….. 65
Table 4.7 The formula of ANOVA table for Regression Line……………………………………….. 65
Table 4.8 The Summary of Statistical Techniques Used in Each Hypothesis………………………...
63
Table 5.1 The analysis of gender levels using frequency and percentage ………………..………........ 70
Table 5.2 The analysis of marital status using frequency and percentage…………………………….
71
Table 5.3 The analysis of age category using frequency and percentage…………………………….. 72

IX
Table 5.4 The analysis of personal income using frequency and percentage…………………………
73
Table 5.5 The analysis of education level using frequency and percentage………………………….. 74
Table 5.6 Summary of demographic factors by using frequency and percentage…………………….
75
Table 5.7 The analysis of Web advertising by using mean and standard deviation………………….. 76
Table 5.8 The analysis of TV advertising by using mean and standard deviation……………………..
77
Table 5.9 The analysis of Print advertising by using mean and standard deviation……………..……
78
Table 5.10 The analysis of intensity of distribution by using mean and standard deviation………….
79
Table 5.11 The analysis of brand awareness by using mean and standard deviation…………………
80
Table 5.12 The analysis of perceived quality by using mean and standard deviation……….………...
81
Table 5.13 The analysis of brand association by using mean and standard deviation……….……….. 82
Table 5.14 The analysis of repurchase intention by using mean and standard deviation…………….. 83
Table 5.15 Reliability test for variables……………………………………………………………… 84
Table 5.16 ANOVA results for intensity of distribution, web advertising, print adverting,
TV advertising and perceived quality……………………………………………………... 85
Table 5.17 Regression model summary of hypothesis one…………………………………….……... 86
Table 5.18 Multiple regression coefficients of perceived quality……………………………………. 87
Table 5.19 ANOVA results for web advertising, TV advertising, print advertising

X
and brand awareness……………………………………………………………………… 88
Table 5.20 Regression summary of hypothesis two…………………………………………………...
88
Table 5.21 Multiple regression coefficient table of brand awareness…………………………………
89
Table 5.22 ANOVA results for the intensity of distribution, TV advertising, print advertising, web
advertising and brand association………………………………………………………….
90
Table 5.23 Regression summary of hypothesis three………………………………………………….
91
Table 5.24 Multiple linear regression table for brand association…………………………………….
91
Table 5.25 ANOVA results for Perceived quality, brand awareness, brand association and repurchase
intention……………………………………………………………………………...……. 92
Table 5.26 Regression summary of hypothesis four…………………………………………………..
93
Table 5.27 Multiple linear regression table for repurchase intention…………………………………
93
Table 5.28 Summary of Hypotheses…………………………………………………………….…….
94
Table 6.1 Summary of demographic factors analysis…………………………………………………
96
XI
LIST OF FIGURES
Figures Pages
Figure 1.1 RTD-green tea market players in Thailand…………………………………………...…..… 2
Figure 1.2 Revenue of Ichitan as per product segment…………………………………………….…... 7
Figure 1.3 Logo of Ichitan brand…………………………...………………………………………..…. 8
Figure 1.4 Ready-to-drink green tea beverages branded as “Ichitan Green Tea” flavors….….……..… 9
Figure 1.5 Ready-to-drink black tea “Ichitan Dragon Black Tea” flavors………...………….……..…. 10
Figure 1.6 The herbal drink “Yen Yen by Ichitan” flavors………………………………………..…...
11
Figure 1.7 Non-carbonated juice drinks. Under the name “Bireley’s” flavors……………….……..…...
11
Figure 1.8 Retail and Distribution channels of the Ichitan brand in Thailand………...…………...…... 13
Figure 3.1 A research model of “A study on the effect of selected marketing mix elements
on brand equity with mediating role of brand equity in ETKA chain stores-
-golestan province”…………………………………………………………….…….…….. 35
Figure 3.2 The research model of ‘Creating brand equity in the Chinese clothing market
: The effect of selected marketing activities on brand equity dimensions’………………... 36
Figure 3.3 The research model of ‘Factors affecting purchase intention of an Auto mobile’…….…...
37
Figure 3.4 Modified Conceptual Framework of factors influencing repurchase intention
of Ichitan brand in Bangkok………………………………………………………………. 40

XII
Figure 4.1 Location of Bangkok in Thailand………………………………………………………….
48
Figure 4.2 Locations of selected (8) Largest shopping malls in Bangkok…………………………........
49
Figure 5.1 The analysis of gender levels using frequency and percentage………………………….….
70
Figure 5.2 The analysis of marital levels using frequency and percentage……………………...……..
71
Figure 5.3 The analysis of age levels using frequency and percentage……………………………….
72
Figure 5.4 The analysis of income/allowance from parents using frequency and percentage……..…..
73
Figure 5.5 The analysis of education level using frequency and percentage…………………………
74
Figure 6.1 Summary of the results of hypotheses testing……………………………………………..
98
Figure 6.2 Distribution channels of Ichitan………………………………………………….………...
99
Figure 6.3 Print advertising of Ichitan……………………………………………………….……….
101

1
Chapter 1
GENERALITIES OF THE STUDY
1.1 Introduction to the study
Growing health concerns have caused a decline in carbonated beverages, while also opening
doors to many more new entrants in the ready-to-drink non-alcoholic beverage industry. Thailand is no
exception in this change; augmented health consciousness among Thai consumers has opened doors
and created demand for healthy beverages such as fruits and vegetables juice, cereals based drink,
green tea and less carbonated beverages consumption in Thailand.
Zenith (2014) defined that ready-to-drink tea is tea-based or tea-flavoured beverage in a ready-
to-drink format. It can come in different flavour variants, such as black, green, red, oolong, jasmine,
and fruit among others. The report includes still and sparkling variants.
The fastest two growing sectors in the health beverage industry are milk beverage and green
tea beverage. Due to broader exposure to Thailand’s prevalent tea culture, sales of RTD tea have been
boosted at 2015. The product variants which are offered by the players and the health benefits of tea
supported the growth in demand for RTD tea and the sale volume reached to 15.9 billion Thai Baht in
2015. The performance of the RTD tea in Thailand is estimated to get positive over the forecast
period since the health awareness will continue to support the consumption and the performance of
RTD tea in Thailand is expected to be promising. Sales are likely to reach a value of 33.9 billion baht
in 2019 following a double-digit constant value CAGR of 12%. (www.fas.usda.gov, accessed on
4/06/2016)
Nowadays, the ready to drink tea category is increasing diversely and which is moving away
from the typical blended black tea and green tea all around the world. That category is enriched by
using new texture, flavors, and packaging, functional enhancements eg. weight management,
relaxation and broadening the appeal of ready to drink tea to a broader consumer base.
2
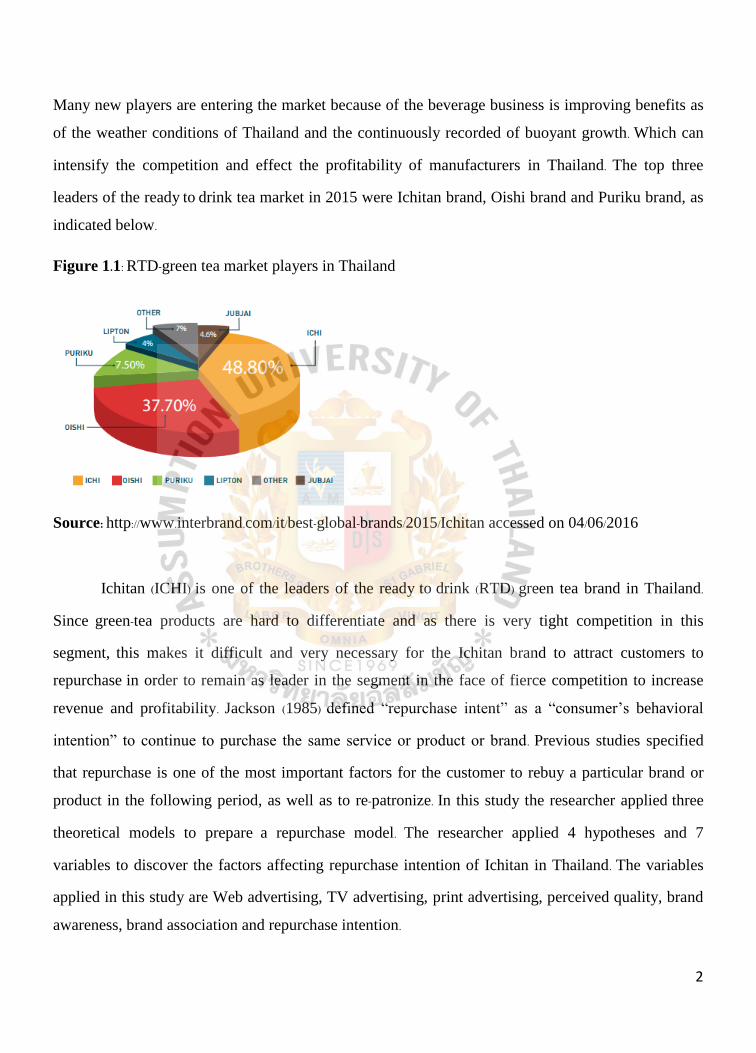
Many new players are entering the market because of the beverage business is improving benefits as
of the weather conditions of Thailand and the continuously recorded of buoyant growth. Which can
intensify the competition and effect the profitability of manufacturers in Thailand. The top three
leaders of the ready to drink tea market in 2015 were Ichitan brand, Oishi brand and Puriku brand, as
indicated below.
Figure 1.1: RTD-green tea market players in Thailand
Source: http://www.interbrand.com/it/best-global-brands/2015/Ichitan accessed on 04/06/2016
Ichitan (ICHI) is one of the leaders of the ready to drink (RTD) green tea brand in Thailand.
Since green-tea products are hard to differentiate and as there is very tight competition in this
segment, this makes it difficult and very necessary for the Ichitan brand to attract customers to
repurchase in order to remain as leader in the segment in the face of fierce competition to increase
revenue and profitability. Jackson (1985) defined “repurchase intent” as a “consumer’s behavioral
intention” to continue to purchase the same service or product or brand. Previous studies specified
that repurchase is one of the most important factors for the customer to rebuy a particular brand or
product in the following period, as well as to re-patronize. In this study the researcher applied three
theoretical models to prepare a repurchase model. The researcher applied 4 hypotheses and 7
variables to discover the factors affecting repurchase intention of Ichitan in Thailand. The variables
applied in this study are Web advertising, TV advertising, print advertising, perceived quality, brand
awareness, brand association and repurchase intention.

3
Tong and Hawley (2009) found that TV advertising, print advertising and web advertising are
positively related to brand awareness, perceived quality, and brand association. Aaker (1991) defined
brand awareness as strength of trace of a brand in the memory of the customer, and reflected by the
ability of a customer to identify a brand under different conditions.
Aakar (1991) mentioned brand association is anything which is included the company
reputation, the characteristics of product or services and its attributes of the services or products
which are linked starting from memory to the brand. Zeithaml (1988) also stated that perceived quality
is the perception of the customers towards the superiority or quality of the products or services. Aaker
(1991, 1996) and Baker et al. (2010) also defined that perceived quality is the evaluation of the current
consumption experience of consumers for the overall excellence of the products. Alizade et al. (2014)
found that the intensity of distribution is positively related with brand awareness and brand
association. Reibstein and Farris (1995) defined the intensity of distribution as the number of
intermediates that by manufacturer are used in the trade area. Jalilvand et al. (2011) found that brand
awareness, perceived quality and brand association are positively related with repurchase intention.
Fornell (1992) stated repurchase intention as the likelihood of continuing to purchase from the same a
service or product or brand from the provider again in the future.
Ichitan brand is the leader in the RTD-green tea market in Thailand with sustainable growth in
revenue even in the most competitive industry. It is very interesting to study how Ichitan’s revenue is
growing sustainably. The major influencer to generate revenue is due to repurchasing the product.
Hence it is also very interesting to study about the repurchase intention of Ichitan and also other
elements like TV advertising, web advertising, print advertising, intensity of distribution, brand
awareness, perceived quality and brand association. The Ichitan brand has a very good distribution
channel and it always spends money on all advertising activities like celebrity endorsements, event
sponsorships, web advertising, TV advertising, print advertising, bill board advertisings, etc. Aaker
(1991) mentioned that the marketing strategy is considered the essential factor for creating brand
loyalty. Marketing strategies such as sales force, the expenses for advertising, public relationship,
slogans, packages, event marketing and symbols are proposed to be factors which are contributing to
4
the perceived quality, brand awareness and brand associations. Therefore, advertising is the most
significant factor to build brand awareness, brand association and perceived quality which in a way
influences repurchase intention.
The researcher will collect primary data to investigate factors affecting repurchase intention
of Ichitan from the 8 biggest shopping malls in Bangkok city. Bangkok is the capital city of Thailand
which is often referred to as the City of Angels and it is the most populous metropolis in Thailand
with a population of about 14 million. The researcher selected shopping malls to collect data because
they are the largest shopping malls in Bangkok and perfectly resemble the target population. The
following are the 8 shopping centers in Bangkok, such as Central World, Siam Paragon, Central
Plaza Grand Rama 9, refers to the Seacon Square, Central Plaza Rama II, Central Plaza
Chaengwattana, Central Plaza Bangna (http://www.bangkok-city.com/shop/mall.html accessed on
02/02/2016).
Non-Alcoholic beverages:
Non-alcoholic beverage is the non-intoxicating drink or soft drink, which even doesn’t include
a small amount of liquor. The followings are the principal activities and products in the Soft drink
industry;
Aerated waters
Carbonated beverages
RTD Tea
RTD Coffee
Functional drink
Fruit & vegetable drinks
Non-Alcoholic beverage industry in Thailand:
The total non-alcoholic beverage market value reached over American Dollar 1.6 Billion at
2015 which growth rate is 5% more than 2014. Almost 42 percent of this is derivation from the

5
carbonated drink segment. In the meantime, the sales volume is estimated to extent over 3.8 billion
liters. The growth of nonalcoholic beverage industry in 2015 shows the result of rising health
awareness issues among Thai customers. The popularity improvement of RTD green tea, fruits and
vegetables juices is related to the level of the disposable income of customers and which can make
important advancements in the cold chain through Thailand. It is expected to be high potential for the
growth of that industry as the positive trend of growing customers’ demand for some types of product
especially healthy drinks. But per capita consumption level of the whole Thailand is only around 60
liters and which is still at lower level. (www.fas.usda.gov, accessed on 4/06/2016)
Prospects of Market by Sector
The examination of nonalcoholic beverages by each sector is mentioned with following;
Table 1.1: The total Sales Volume of Nonalcoholic Beverages arranged by Sector, Year 2014-2015
Source: www.fas.usda.gov accessed on 04/06/2015
In recent times, nonalcoholic beverage suppliers are spending larger number of budgets for
advertising and promotional activities expected to get greater market shares and improve sales
performances. Moreover, the rapid enlargement of the modernized retailing sectors, for example
department stores, hypermarkets and convenience stores are also one of the sources of the growth of
the nonalcoholic beverages’ market. The affective distribution strategy is the most important thing for
market players to encourage the sales performance and market shares.
6
RTD-Green tea market:
In Thailand, the performance of RTD tea is anticipated to be promising during the forecast
period. Sales are likely to reach a value of Bt33.9 billion in 2019 following a double-digit constant
value CAGR of 12%. While health awareness will remain to support consumption and the product
innovation will lead to greater variation and could be counted as a significant factor driving growth.
The general environment will be stimulated, resulting in greater competition. Leading players are
anticipated to implement attractive marketing activities and programs to maintain their positions,
with newcomers also interested in entering into this category.
The Leading players in RTD-Green tea market in Thailand:
Ichithan
Oishi
Puriku
Ichitan is the major player in this market which accounts for more than 48% of market share,
followed by Oishi with 37% of market share.
Ichitan Group
In 2015, Ichitan Group is leading brand for RTD tea and off trade shares in volume terms is
48.80%. The primary source of Company income is the ready to drink tea business and which is 96.2%
of the total revenue in 2015, while non-carbonated drinks and fruit juice account for 3.8%.

7
Figure 1.2: Revenue of Ichitan as per product segment
Source: http://investor-th.ichitangroup.com/ accessed on 04/06/2016
History of Ichitan:
Ichitan Group Public Company Limited was formerly called as “Mai Tan Company Limited”
and was established at 3rd, September 2010 with a registered capital amount of 500 Million Thai
Baht to operate the Japanese style fresh chocolate, beverage and steak and food restaurants
businesses. Though, the Company divested restaurant business in January, 2013 to merely focus the
beverage business to be leader of green tea business in Thailand.
The first 2 flavors of Ichitan double drink were commercially distributed at January 2011 and
the 3 different flavors was introduced to Thailand market at May 2011. Currently Ichitan is producing
800 million bottles and 200 million boxes for each year. (http://investor-th.ichitangroup.com/ accessed
on 05/06/2016)
96.20%
3.80%
Revenue
RTD tea
Fruit Juice&Non-Carbonated

8
Figure 1.3: Logo of Ichitan brand
Source: http://www.ichitangroup.com/ accessed on 05/06/2016
Ichitan’s Vision Statement:
Ichitan Group is building innovation to develop along with the quality of life in society and
targeting to be the leader of quality drink.
To be a Leader: Constantly searching the modernized innovation to progress efficiency in the
production
To be a High Quality: Making experiment, research and explore till they meet excellent
product quality and good health for consumer
To be Greater: Moving forward all together, including consumers, partners, workers and
farmers for the continuous growth of society
Mission of Ichitan:
The company mission is to present and improve the products. Company is managing well for
the perfect turnover and development of society and life quality instantaneously. Then the profit will
be sustainably and efficiently return to the society.
For the Consumers: Company will manufacture and improve the quality drink for to meet
with the health of customers, and also prepare up to date presentation to exploit the
satisfaction of consumers.

9
For the Shareholders: Company will create the business innovation to progress the
management incessantly and always looking for the development of new channels and the
extension to the highest turnover.
For the Society: Company will be an ideal responsible organization and gave back to the
development of Thai society sustainably.
Product range of Ichitan Brand:
Ichitan Brand has 19 different flavors and which can be separated into 4 categories as below;
(a). Ready to drink green tea, brand name Ichitan Green Tea has below 9 selections:
Original flavour, Honey Lemon flavour, Kikucha (Chrysanthemum) flavour, Genmai flavour,
Sugar-Free flavour, Berry flavour, Apple-Kiwi flavour, Sugar-Free OoLong Tea flavor and
Lychee flavor.
Figure 1.4: Ready to drink green tea beverages brand Ichitan Green Tea falvour
Source: http://www.ichitangroup.com/brands-ichitan-greentea-uht.php accessed on 05/06/2016
(b). Ready to drink black tea also called Ichitan Dragon Black Tea has 2 flavors: Lemon
and Mulberry.
Product Description:
The history of black tea has over 1,000 years. The best black tea originated from the high
valley of hills looked like dragon in the past and containing most caffeine and it is tastier than any

10
other kinds of tea. Moreover, black tea also can maintain its sense over many years. In the 19th
century, some parts of Asia used black tea as money along with the document and that must be
managed specially to generate a premium drink. Perfect black tea is needed to leave to be mature and
aggravate by softly massage then the leaves able to obtain air and issue its aroma. Later the tea will be
fully processed baked and which will change them to become premium black tea with rich flavor and
a welcoming smell.
Figure 1.5: Flavor of ready to drink black tea, known as Ichitan Dragon Black Tea
Source: http://www.ichitangroup.com/brands-ichitan-greentea-uht.php accessed on 05/06/2016
(c). The herbal drink which is known as Yen Yen by Ichitan and which offers 2 kinds of
flavor: Yen-Yen honey-mixed chrysanthemum and Yen-Yen cool herbal green tea.
Product Description:
This is using as herbal juice in China and which is well-known for over all of Thailand. The
drink is a mixture of Thai and Chinese herbs to convert hot and cold drinks. The advantages of the
drinks are to prevent and relief canker sores especially relief from the unbalanced symptoms eg.
eating fried food, sleeplessness, pain in the digesting system, lack of water, sore throat, lesions or
pellicles in the mouth or tongue, hoarse, thirsty, bitter throat, eye burns and cough. Combination of
the seven selected Chinese herbs with ancient method is the secret of a cool aroma, mellow taste and
which is very good for daily drinking. That drink can improve the freshness and can reduce the hot
taste from spicy food. Yen Yen will cool down to you and disappear your thirst and it is promoted as
fighting sweat with deep and freeze inside in all over the country.
11
Figure 1.6: The herbal drink “Yen Yen by Ichitan” flavors
Source: http://www.ichitangroup.com/brands-ichitan-greentea-uht.php accessed on 05/06/2016
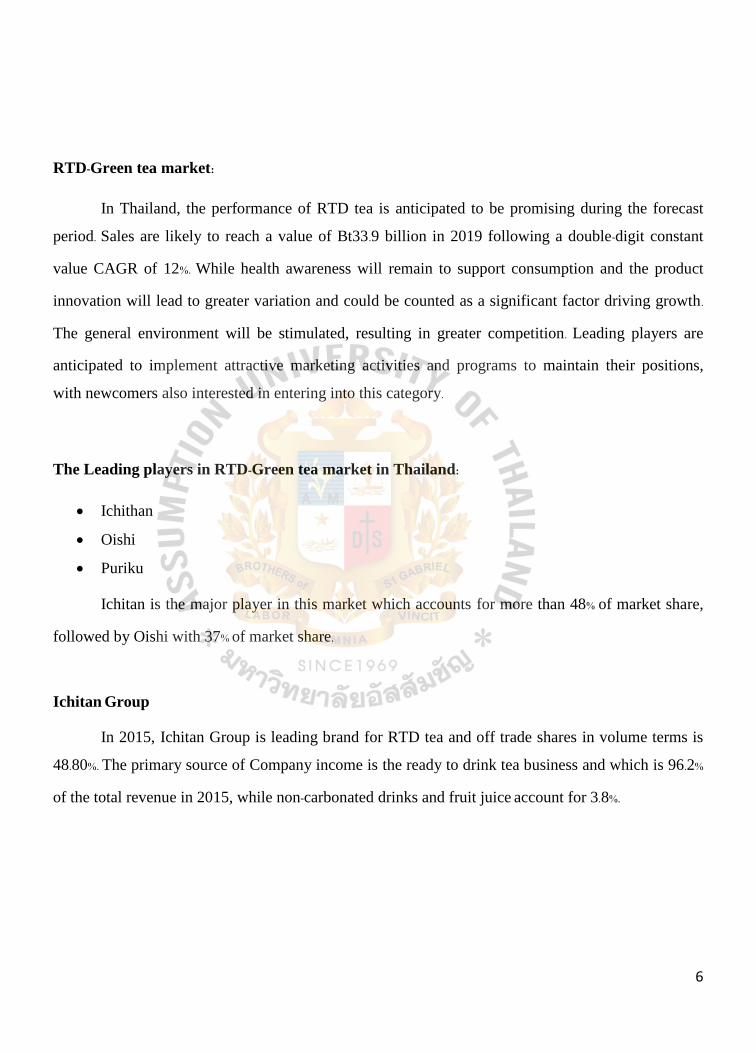
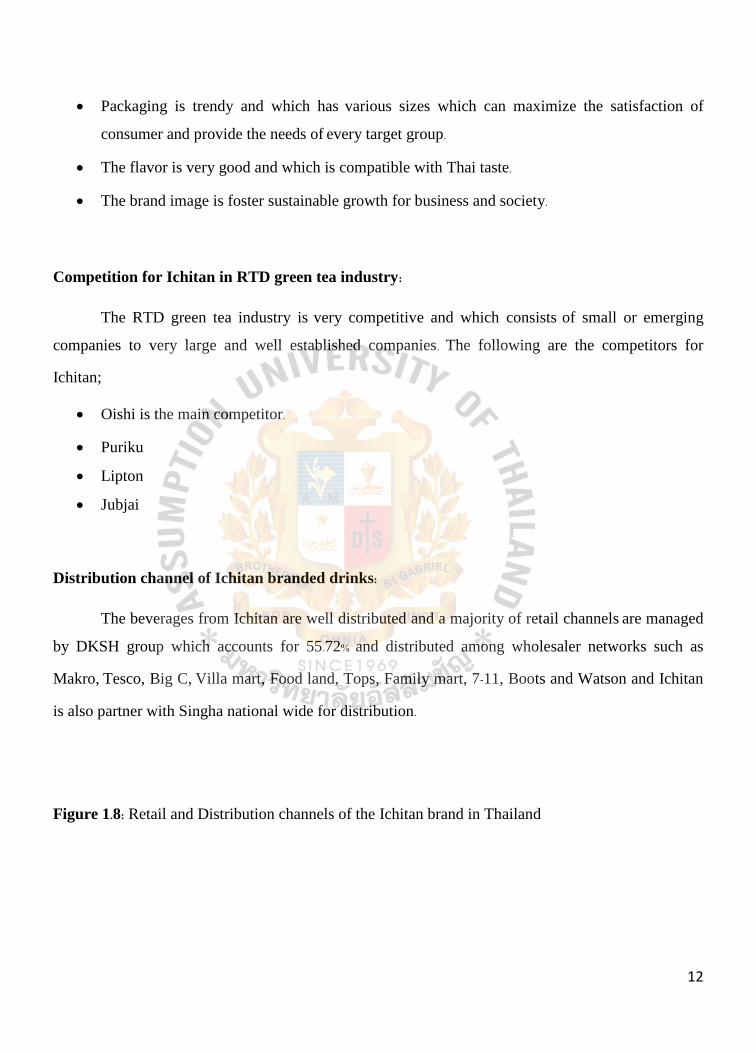
(d). Non-carbonated juice drinks. Under the name “Bireley’s” offers 4 flavors: Orange
Juice, Red Grape Juice, Lychee Juice, and Apple Juice.
Product Description:
This brand offers natural fruit juices.
Figure 1.7: Non-carbonated juice drinks. Under the name “Bireley’s” flavors
Source: http://www.ichitangroup.com/brands-ichitan-greentea-uht.php accessed on 05/06/2016
Strengths of Ichitan
The quality is high.
Healthy drinks which is made up of organic green tea leaves and also certified by the
Agriculture Department of under Ministry of Agriculture and Cooperatives.
12
Packaging is trendy and which has various sizes which can maximize the satisfaction of
consumer and provide the needs of every target group.
The flavor is very good and which is compatible with Thai taste.
The brand image is foster sustainable growth for business and society.
Competition for Ichitan in RTD green tea industry:
The RTD green tea industry is very competitive and which consists of small or emerging
companies to very large and well established companies. The following are the competitors for
Ichitan;
Oishi is the main competitor.
Puriku
Lipton
Jubjai
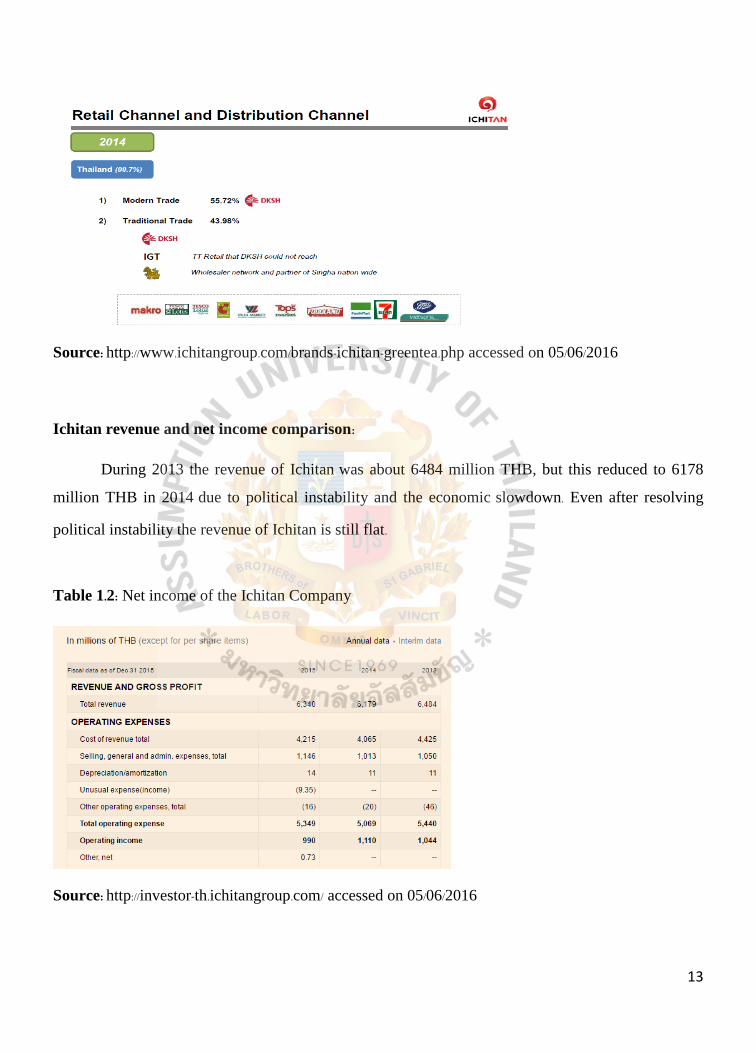
Distribution channel of Ichitan branded drinks:
The beverages from Ichitan are well distributed and a majority of retail channels are managed
by DKSH group which accounts for 55.72% and distributed among wholesaler networks such as
Makro, Tesco, Big C, Villa mart, Food land, Tops, Family mart, 7-11, Boots and Watson and Ichitan
is also partner with Singha national wide for distribution.
Figure 1.8: Retail and Distribution channels of the Ichitan brand in Thailand
13
Source: http://www.ichitangroup.com/brands-ichitan-greentea.php accessed on 05/06/2016
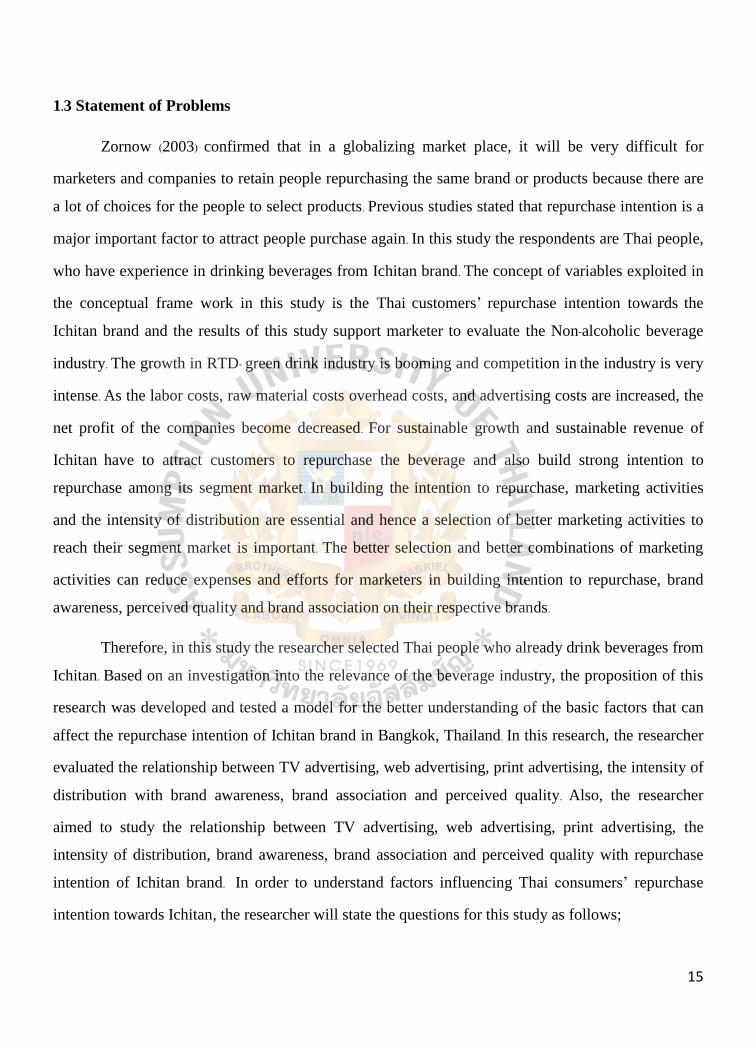
Ichitan revenue and net income comparison:
During 2013 the revenue of Ichitan was about 6484 million THB, but this reduced to 6178
million THB in 2014 due to political instability and the economic slowdown. Even after resolving
political instability the revenue of Ichitan is still flat.
Table 1.2: Net income of the Ichitan Company
Source: http://investor-th.ichitangroup.com/ accessed on 05/06/2016

14
In the year 2015, the net income of Ichitan Group PCL is declined 24.66 % from 1.08bn to
812.74m in spite of relatively flat revenues as the ready-to-drink tea market remains fiercely
competitive and due to the slowing down of the domestic economy. The main factors are increasing
cost of goods sold, selling, general and administrative expenses and interest paid (all as a percent of
sales). The major expenses are advertisement expenditures and administration expenses.
1.2 Research Objectives
The main purpose of this research is to understand and scrutinize the factors which are
affecting repurchase intention of Ichitan brand drinks in Thailand. The researcher applied (8) variables
and (4) hypotheses in this study to examine repurchase intention as of the time limitation.
These are repurchase intention and its seven related factors; TV advertising, web advertising,
print advertising, intensity of distribution, brand awareness, perceived quality and brand association.
The researcher anticipated that these factors are major important factors to examine the repurchase
intention of Thai people towards Ichitan branded green tea and the result will support the marketers,
advertisers, supply chain managers who work for the Ichitan brand. Consequently, a set of research
objectives was proposed as follows:
To test the influence of Web advertising, TV advertising, print advertising, intensity of
distribution towards brand awareness of Ichitan.
To test the influence of Web advertising, TV advertising, print advertising towards perceived
quality on Ichitan.
To test the influence of Web advertising, TV advertising, print advertising, intensity of
distribution towards brand association on Ichitan.
To test the influence of Brand awareness, brand association and perceived towards repurchase
intention on Ichitan.
15
1.3 Statement of Problems
Zornow (2003) confirmed that in a globalizing market place, it will be very difficult for
marketers and companies to retain people repurchasing the same brand or products because there are
a lot of choices for the people to select products. Previous studies stated that repurchase intention is a
major important factor to attract people purchase again. In this study the respondents are Thai people,
who have experience in drinking beverages from Ichitan brand. The concept of variables exploited in
the conceptual frame work in this study is the Thai customers’ repurchase intention towards the
Ichitan brand and the results of this study support marketer to evaluate the Non-alcoholic beverage
industry. The growth in RTD- green drink industry is booming and competition in the industry is very
intense. As the labor costs, raw material costs overhead costs, and advertising costs are increased, the
net profit of the companies become decreased. For sustainable growth and sustainable revenue of
Ichitan have to attract customers to repurchase the beverage and also build strong intention to
repurchase among its segment market. In building the intention to repurchase, marketing activities
and the intensity of distribution are essential and hence a selection of better marketing activities to
reach their segment market is important. The better selection and better combinations of marketing
activities can reduce expenses and efforts for marketers in building intention to repurchase, brand
awareness, perceived quality and brand association on their respective brands.
Therefore, in this study the researcher selected Thai people who already drink beverages from
Ichitan. Based on an investigation into the relevance of the beverage industry, the proposition of this
research was developed and tested a model for the better understanding of the basic factors that can
affect the repurchase intention of Ichitan brand in Bangkok, Thailand. In this research, the researcher
evaluated the relationship between TV advertising, web advertising, print advertising, the intensity of
distribution with brand awareness, brand association and perceived quality. Also, the researcher
aimed to study the relationship between TV advertising, web advertising, print advertising, the
intensity of distribution, brand awareness, brand association and perceived quality with repurchase
intention of Ichitan brand. In order to understand factors influencing Thai consumers’ repurchase
intention towards Ichitan, the researcher will state the questions for this study as follows;
16
Are there any influences of Web advertising, TV advertising, print advertising, intensity of
distribution on brand awareness of Ichitan?
Are there any influences of Web advertising, TV advertising, print advertising on perceived
quality of Ichitan?
Are there any influences of Web advertising, TV advertising, print advertising, intensity of
distribution on brand association of Ichitan?
Are there any influences of Brand awareness, brand association and perceived on repurchase
intention of Ichitan?
1.4 Scope of Research
This research was emphasized upon the factors affecting the repurchase intention of Thai
consumers towards Ichitan brand. In this study, the researcher primarily focused on several main
factors that can affect repurchase intention. In the conceptual framework of this research, the
independent variables are TV advertising, web advertising, print advertising, intensity of distribution,
brand awareness, perceived quality, brand association and the dependent variable is repurchase
intention.
The target population of this study is both males and females who already had tried Icithan
branded beverages before. The main aim of this study is to investigate repurchase intention towards
the Ichitan brand. The researcher will collect 400 questionnaires from the eight biggest shopping
malls in Bangkok: Central World, Siam Paragon, Central Plaza Grand Rama 9, Seacon Square,
Central Plaza Rama II, Central Plaza Chaengwattana, Union Mall and Central Plaza Bangna.
The questionnaires that are applied in this study were modified from several previous studies
and there are three main parts; the first part is the screening question for customers, whether they
drank Ichitan brand beverages before or not; the second part is the five points Likert scale questions
for each variable and the last part is the demographic factors of respondents. There are totally 33
questions in the questionnaire part of this study.

17
1.5 Limitations of the Research
Firstly, the results may represent only the findings based on the Ichitan brand in Thailand; the
findings cannot be generalized to other beverage brands in Thailand or the Ichitan brand in other
countries. The results of this study will or will not change even if more data are collected from
different places other than utilized places in this study.
Secondly, Primary data are collected by the researcher from the respondents who have drunk
Ichitan before; therefore, the findings can’t apply for exploring purchase intention of the customers
who have never drunk Ichitan branded drinks before. Because of the time constraint, the researcher
was not able to apply other independent variables other than the 8 from the conceptual frame work;
such as TV advertising, print advertising, web advertising, advertising spending, perceived quality,
brand awareness, brand association and could not cover the entire field link to the dependent
variables which are ‘celebrity endorsement’, ‘Event sponsorship’, ‘customer satisfaction’ are studied
as antecedents with repurchase intention of Thai consumers towards the Ichitan brand.
The researcher collected primary data in May and June of 2016 and the findings may not be
generalized to all of the times and it may cover just only for 2016.
1.6 Significance of Study
In spite of the limitations in the research, the researcher trusts that the results from this study
could take valuable insights to some researchers, manufacturers, marketers and investors. The results
of this study are expected to explain the relationship among all the variables, namely Print
advertising, TV advertising, web advertising, Intensity of distribution brand awareness, brand
association, perceived quality and repurchase intention towards the Ichitan brand in Thailand. The
result of this study can assist marketers to understand the effects of marketing activities and the
intensity of distribution towards brand awareness, perceived quality, brand association and
repurchase intention.

18
The results from this research may provide valuable information to domestic and foreign
Beverage brands who invest money in advertising and marketing activities, expecting people to
repurchase the product. The results from this research may also provide information about the
selection of a better marketing activity to reach their segment market with lesser expenses for
advertising or marketing activities and still can build brand awareness, perceived quality and brand
association and attract customer to repurchase the respective brands.
Finally, this research may provide key reference for further studies regarding the Intensity of
distribution, TV advertising, web advertising, print advertising, brand awareness, perceived quality,
brand association which affect repurchase intention.
1.7 Definition of Terms
Brand Awareness: Aaker (1991) stated brand awareness is the strength of the trace of a brand
in the memory of consumers, and reflected by the ability of a consumer to categorize a brand
under different conditions.
Brand association: Aakar (1991) mentioned brand association is anything which includes the
reputation of company, the characteristics of service or product and attributes of service or
product which are related from memory to brand.
Intensity of distribution: Yoo et al. (2000) mentioned that the level of the availability of a
product in the market is designated by marketers. The level of distribution intensity also
known the marketer chooses is often dependent on the factors such as pricing and promotion
and production capacity, the size of the target market, and the service of the product which
will be needed after purchasing.
Perceived Quality: Baker et al. (2010) defined that perceived quality is the evaluation of
current consumption experience of customers on the overall excellence of the products.
Print Advertising: Wang et al. (2004) explored print advertising is a conventional method of
advertising which is elated by print media such as newspapers and magazines.

19
Repurchase intentions: Jackson (1985) defined “repurchase intent” as a “consumer
behavioral intention” to continue to purchase the same service or product or brand intention
and it also refers to the likelihood of continuing to purchase from the same service or product
or brand from the provider again in the future
TV Advertising: Janoschka (2003) stated television advertisements is a visualized advertising
message of animated pictures which is able to motivate the audience by using the combination
of visual, audio and animated message components.
Web Advertising: Roberts (2006) mentioned web advertising is paid or unpaid form of
communication by using internet to encourage and make cognizance of a product or a brand.

20
Chapter 2
REVIEW OF RELATED LITERATURE
In this chapter, the researcher will clarify the related concept and theories of this research.
This chapter includes three main parts. The first part is a literature review, the second part is a related
literature review and the last part is previous studies and a summary of previous studies. Also, the
literature review which contains the definitions of all variables; web advertising, print advertising,
TV advertising, intensity of distribution, brand awareness, perceived quality, brand association and
repurchase intension, and these are created according to the conceptual framework of this research.
The second part explains the relationship between each particular variable and these are in
accordance with the hypotheses of this study. The last part is previous studies and a summary of all
previous studies, and the researcher analyzed seven related previous empirical studies in this section.
2.1 Literature Review
2.1.1 Web Advertising
Roberts (2006) defined about web advertising as a format of advertising which paid or unpaid
communicated with consumers to build awareness or promote a product or a brand through internet.
Roberts (2006) stated that mostly, the internet users are adults and in their perspective, internet is the
new media for multinational brands. Milgrom and Robert (1986) indicated that advertising is the most
important extrinsic cue which signifies the quality of products. Armstrong (2001) mentioned that web
advertising is a paid or unpaid form of a promotional communication through the internet and it is
used to increase the amount of sales of the advertised products and awareness of the products.
Janoschka (2003) explained about online advertising that, it can be available for a whole day or even
for a whole year and more while the cost is low amount to be paid when compared to traditional
media communication and information can be delivered to internet users by information itself or
combined with animations, illustrations, pictures etc.

21
According to Armstrong (2001), web advertising is stated as one of advertising format that
brought the marketing messages or promotion about product or service through internet to consumers.
One of the most advantage about web advertising is time. It can publish the messages while freely
from geographic or time constraints which mean the marketing messages or information about a
product or brand can be delivered to consumers anytime and anywhere. Web advertising includes
search engine marketing (SEM), email marketing, many types of display advertising (including web
banner advertising), social media marketing, and mobile advertising. Janoschka (2003) defined web
advertising as one of the marketing strategy which aim to obtain and analyze the website traffic and
target to communicate with the right consumers by using the Internet as a media. According to
Roberts (2006), stated that, advertisers who use web advertising can analyze and customize the
marketing tools to get more efficient and precise result for consumer targeting.
2.1.2 Print Advertising
Wang et al. (2004) stated that the print advertising is one of the advertising methods which
normally include text and graphics and communicate to consumers by print media such as
newspapers and magazines and can be called as a static mode of presenting advertisements. Hair et al.
(1996) stated that advertising is most useful for creating knowledge and awareness of goods or
services and it can build up a long-term image of a product. Liu (2002) mentioned that print
advertising particularly in magazines, is an efficient promotional media for products and most of the
young generation spends time to read or absorb new materials from magazines.
Hair et al. (1996) claim that, since print advertising define as a marketing messages printed on
paper, therefore newspapers, magazines, newsletters, booklets, flyers, direct mail, or anything else
that would be considered a portable printed media could be called as print advertising as well. And
none of the newspapers or journals can survive without advertising revenue. Until the present days,
print media advertising is one of the most popular forms with revenue derived through mass
advertising. Also, it has been progressively increasing year after year.
22
Liu (2002) mentioned that each media has their own characteristic. For example; newspapers
and magazines have lesser limited exposure than television or radio which advertising time is quite
scheduled and can be considered as an annoyance to audience because of programming interrupted
when print media, the audience can decide when they want to view the advertise and it means an
interruption eliminates. This is the advantage between print advertising and others.
2.1.3 TV Advertising
Janoschka (2003) defined television advertisement as a visualized marketing message of
animated pictures by association of visual, audio and animated message components which using for
arouse the audience. Liu (2002) mentioned that television is the most powerful and popular medium
for information and advertising media and it has penetrated the majority of households. Blythe (2000)
defined that television advertising is delivering commercial messages during the television programs.
A television advertisement usually produced and paid for the purpose of company’s marketing
strategy plan to promote a product, service or brand through television programming.
Russell and Lane (1993) stated that TV advertising offers unlimited creative flexibility media
to arrangement for advertisers through sound, sight and motion which able to reach the customer’s
awareness with highly chance. Kleppner (1979) indicated that advertising is a method of delivering
messages from a sponsor throughout an impersonal media to many people. Wells et al. (1992)
explained that television is a combination of sound, color, motion, drama and sight; therefore, it
allows a great deal of creative flexibility. Russell and Lane (1993) stated that, when compare to local
media such as newspaper or radio, television can reach a larger amount of audience since it
considered as a mass media which efficiency to attract attention or create awareness due to short
period of time and also establish preference for company’s brand and its products or services. It
conveys the message with visual, sound, and motion, which can give business, products, or services
instant credibility. Blythe (2000) commented that TV ads is a form of text, images, sound and motion
combined together which the quality and efficiency depend on significant planning, creativity,
experience and professional in production to develop an appealing multi-sensory TV spot to generate

23
value to the specific product or service and its brand. And it is an efficiency tool for many advertisers
as well.
2.1.4 Intensity of Distribution
Yoo et al. (2000) defined that the distribution intensity is the level of a product's availability in
a market which selected by the marketer and it is often depend on factors such as the size of the
target market, pricing and promotion and production capacity. According to Reibstein and Farris
(1995) the intensity of distribution is the way to spread products or services widely which generates a
chance to succeed the customer’s satisfaction and usually used as the marketing strategy by the
manufacturer in the trade area. The expansion of distribution channels can increase brand awareness
of customers which also help to create brand recognition as well
Hanssens et a., (2001) stated that the intensity of distribution is usually use for increase the
availability of the new product to customers which mean the more outlets the product placed in, the
higher chance of customers to recognize them and considered as location convenience that
became one of the most potent marketing contributors to sales and market share. This will eventually
reduce searching in the stores and moving from one store to another creating convenience for
customers. Therefore, if the intense of distribution increasing, it will increase the benefit customers
may get from the products or services as well.
2.1.5 Brand Awareness
Aaker (1991) stated brand awareness as an ability to recognize or identify the brand in the
memory of customers indicate by the strength of trace in various conditions. According to Keller
(2003), brand awareness is stated as making customers aware of the brand. Aaker (1996) indicated that
brand awareness is the first step in creating brand equity and it refers to either customers can
recognize or recall a brand and it is also related to the strength of the presence of a brand in the
customers’ minds. Aaker (1991) explained that customers will first be aware of brand and then later
they will have a set of associations of that brand. Keller (1993) stated that the structure and strength of

24
brand association can be influenced by brand awareness. But Mackay (2001) revealed that brand
awareness is an important factor but it is not a sufficient factor to create value.
Aaker (1991) indicated that creating brand awareness is the first step for building brand equity
and brand awareness can support brand equity in three different ways; provide a sense of familiarity
of the brand in the consumers’ mind, create brand name in the consumers’ memory, and act as a
single brand to be trusted. Mackay (2001) mentioned that brand awareness can become a secondary
factor when the customers are already aware of the main brand in the market. Aaker (1991) defined
that brand awareness is the ability of a potential customer to recognize or recall a brand name. Alba
and Hutchinson (1987) stated that brand awareness is the result of customers’ experience towards a
brand.
2.1.6 Perceived Quality
Zeithaml (1988) stated that perceived quality is a superiority of a product, service or even
brand itself in perception of the customers. Aaker (1991, 1996) and Baker et al. (2010) defined that
perceived quality is the value evaluate process of consumers’ mind towards the overall excellence of
products according to their experience. Zeithaml (1988) stated that product quality is the customer’s
expectations and judgments for the performance of the products. Aaker (1991) indicated that perceived
quality is the perception towards the superiority or overall quality of a product or brand with respect
to its intended purpose in customer’s mind. Yoo et al. (2000) mentioned that the perceived quality is
consumers’ subjective judgment about the brand’s overall excellence. Keller (2003) mentioned that
the perceived quality is a perception of the superiority, otherwise the overall quality of a product.
Zimmer and Linda (1999) described that perceived quality can affect the consumers’ needs for
uniqueness of products.
Deng et al. (2010) explained that if consumers can attain a specific purpose by using a specific
brand; they will positively think about the perceived quality of that brand and can become more loyal
to this brand. Keller and Lehamnn (2003) indicated that perceived quality represents an antecedent
25
step that is leading to loyalty to a brand or product. Aaker (1991, 1996) stated that the level of
perceived quality is able to increase customers’ positive valuations towards a specific brand and it
can indicate consumers’ repurchase behavior as well. Farquhar (1989) revealed that perceived quality
is an essential factor for developing a positive evaluation of a brand in the customer’s memory.
2.1.7 Brand Association
Aakar (1991) mentioned that brand association is normally including the fame of a company,
the characteristics of a service or product and its attribution that create a relative from consumer’s
memory towards brand. Keller (1993) stated that brand awareness can affect the formation and
strength of brand association. Keller and Lehmann (2003) mentioned that perceived quality and brand
associations are the initially process which directed towards brand loyalty. Aaker (1991) explained
that customers will first be aware of a brand and then later the set of brand associations. Aaker (1991)
defined that brand association is anything which is linked in the memory towards a brand and it
represents the meaning of that brand for the customers.
Keller (2003) indicated that brand association has to be strong, unique and favorable to get a
positive effect on brand equity. Alba (2000) revealed that positive brand association can block
customers’ exploration of other types of information for purchase decision. Aaker (1991) stated that
brand association relied on the establishment of brand awareness and high quality products that
enable customers to recognize the distinctiveness and superiority of its brand. Keller and Lehmann
(2006) mentioned that brand association is a concept that has a link with brand name in the
consumer’s memory and it is a key dimension of brand equity.
2.1.8 Repurchase Intention
Jackson (1985) defined “repurchase intent” as a “consumer behavioral intention” to continue
to purchase the same service or product or brand. According to Fornell (1992), repurchase intention
refers to the likelihood of continuing to purchase from the same service or product or brand from the

26
provider again in the future. Normally, the measures of repurchase intention are obtained from
surveys which focus on the customers who purchase the same brand, same product or service, from
the same company. Cronin et al., (2000) has considered "behavioral intentions" and "repurchase
intention" as the same. Ranaweera and Prabhu (2003) defined "future behavioral intentions" as
customer’s intent to continue or to stay with their service provider of the specific product or service
in the future, while Zeithaml (1981) described the definition of this constructure as "customer
retention".
According to Jones and Sasser (1995), repurchase intention is a customer’s desire to purchase
the specific product or service after purchased at least once. Customer repeat purchase or retention is
the most important mission in marketing strategy and can be indicate the successful rate of company
as well. Rosenberg and Czepiel (1984) commented that to making new customers, it will cost six times
approximately more than keeping old customers. And it causes the company’s strategy to refocusing
on keeping existing customers and making them repurchase which better than focusing entirely on
generating new customers.
2.2 Related Literature Review
2.2.1 The Related Literature Review of Web advertising, Print Advertising, TV Advertising,
Intensity of distribution, and Perceived Quality.
Janoschka (2003) defined television advertisement as a visualized marketing message of
animated pictures by association of visual, audio and animated message components which using for
arouse the audience. Tong and Hawley (2009) investigated that TV advertising is positively related
with perceived quality. Wang et al. (2004) stated that print advertising is a tool to transport marketing
messages to consumers in form of print media such as magazines, brochures, newspapers and else as
one of advertising method. Tong and Hawley (2009) explained that print advertising is positively
related with perceived quality. Roberts (2006) mentioned web advertising as one of advertising format
which communicate through internet either paid or unpaid for create an awareness in consumer’s

27
mind towards product or brand and also stated that major internet users are adults which internet is a
new media for multinational brands in their perception. Tong and Hawley (2009) found that web
advertising is positively related with perceived quality. The analysis in that study showed that there
were positive relationships between distribution and perceived quality. Nguyen, et al. (2000) studied
brand loyalty in the cosmetics market in Thailand and Vietnam and studied the relationship between
distribution systems and perceived quality in both countries.
2.2.2 The Related Literature Review of Web advertising, Print Advertising, TV Advertising
and Brand awareness
Aaker (1991) stated brand awareness as an ability to recognize or identify the brand in the
memory of customers indicates by the strength of trace in various conditions. Tong and Hawley
(2009) studied about the brand equity of the Chinese clothing market and the researcher found that
web advertising, print advertising, and TV advertising is positively related with brand awareness.
Janoschka (2003) explained that TV advertisement is a visualized message for marketing purpose
through the media which created by combine images, sounds components with animation process in
to the video format to stimulate the audience. Chattopadhyay et al. (2010) studied about marketing
elements affecting brand equity in the Indian passenger car market and the researchers investigated
that TV advertising is positively related with brand awareness. Print advertisements normally include
written languages and graphics and it is a static mode of presenting an advertisement. Chattopadhyay
et al. (2010) explained that print advertising is positively related with brand awareness.
Roberts (2006) explained that web advertising is an either paid or unpaid form of marketing
messages through the internet to offer a promotion or create an awareness of product or a brand to
consumers. Roberts (2006) stated that internet is the new media which its users mainly are adults or
children and efficient for multinational brands. Chattopadhyay et al. (2010) found that web advertising
28
is positively related with brand awareness. Huang and Sarigöllü (2012) evaluated the relationship of
brand awareness with brand equity and marketing mix elements.
2.2.3 The Related Literature Review of Web advertising, Print Advertising, TV Advertising,
Intensity of distribution and Brand Association
Baker et al. (2010) defined that anything which can remind a brand name are interrelated as an
integrated network of brand knowledge. Tong and Hawley (2009) studied about the brand equity of
the Chinese clothing market and the researcher found that web advertising, print advertising, and TV
advertising are positively related with brand association. Tong and Hawley (2009) claimed that TV
advertising is positively related with brand association. Roberts (2006) stated that major internet users
are young people and for them, internet is a new media for multinational brands. Tong and Hawley
(2009) found that web advertising is positively related with brand association. Rostami and Kashkooli
(2012), Yoo et al., (2000), and Roj (2000) found out that the intensity of distribution positively affects
brand association. Yoo et al. (2000) investigated that “distribution is intensive when products are
placed in a large number of stores to cover the market.” and also stated that brand association can be
increase by distribution intensity. Srinivasan et al. (2005) stated that brand awareness and distribution
intensity possibly increased relate to each other which means product availability would shape
consumer satisfaction. Huang and Sarigöllü (2012) found that distribution intensity positively
develops brand association.
2.2.4 The Related Literature Review of Brand Awareness, Perceived Quality, Brand
Association and Repurchase Intention
Jackson (1985) defined “repurchase intent” as a “consumer behavioral intention” to continue
to purchase the same service or product or brand. According to Fornell (1992), repurchase intention
refers to the likelihood of continuing to purchase from the same company a service or product or
brand from the provider again in the future. Chi et al. (2009) stated that brand awareness plays an

29
important influence in making purchase decision and consumers tend to purchase products that are
familiar and favorable for them. Keller (2013) also stated that consumers have favorable past
experience with the product. Pradhita (2014) studied about the influence of brand awareness on
repurchase intention of drinking coffee toward customers in Malang and the researcher investigated
that brand awareness influences the repurchase intention of RTD coffee.
Yoo et al. (2000) studied selected marketing mix elements and brand equity, and the
researchers found that the relationship between perceived quality and purchase intention is positive.
Wiguna (2013) studied to investigate the influence of brand awareness, brand association, celebrity
endorsement and brand personality towards repurchase intention of Isotonic drink of Pocari Sweat
and found that celebrity athlete endorser, brand awareness, brand association, and brand personality
simultaneously (together) have an influence on repurchase intention. Grewal et al. (1998) showed that
purchase intention is the degree of consumers’ intention to buy products. Wiguna (2013) studied about
the repurchase intention of an Isotonic drink of Pocari sweat among universities in Ciputat city in
Indonesia; the researchers found that brand awareness, and brand association positively affected
repurchase intention. Aaker (2008) stated that customers can associate the brand with a person,
product, organization and symbol and brand association is the strength of benefits offered by the
brand.
2.3 Previous Studies
This section is about the previous empirical studies which were collected, and applied as
secondary data in this study. In this section, the researcher will explain about the repurchase intention
of various brands in various places and the relationships between web advertising, print advertising,
TV advertising, intensity of distribution, brand awareness, perceived quality, brand association and
repurchase intension. The researcher will apply five previous studies in this section.
Idoko et al., (2014) studied about the repurchase intention of alcoholic beverages and explored
about the effects of intrinsic and extrinsic product cues on consumers’ repurchase intentions. In this
research the researcher used 8 independent variables such as advertising, perceived product quality,
30
brand name, alcohol level, packaging, price, seal of approval and corporate name. To investigate the
factors affecting repurchase intention the researcher collected 300 sets of questionnaires at Enugu
metropolis in Nigeria. Researcher’s used the ‘‘cluster’’ sampling method to collect the responses. The
researchers implemented multiple linear regressions modeling using statistical software to test the
hypotheses. This study investigated the relation which influences both intrinsic and extrinsic product
cues on consumers’ repurchase intention towards alcoholic beverages. After the study, the result
showed that most alcoholic beverage consumers in Enugu metropolis are largely influenced by
extrinsic product cues represented by price, company name, seal of approval and advertising while an
intrinsic cue such as alcohol was found to be significant as well. In addition, the study also revealed
that quality, packaging and brand name were not the main factors which affect consumers’
repurchase intention.
Pradhita (2014) investigated the influence of brand awareness, brand loyalty, and perceived
quality towards repurchase intention of Ready to Drink (RTD) coffee customers in Malang city in
Indonesia. Brand loyalty and perceived quality were used as the intervening variables of the
relationship between brand awareness and repurchase intention. The study was conducted by
distributing 133 questionnaires to customers of RTD coffee in Malang. Regression analysis and
mediating test were conducted to examine the hypotheses. Based on the researcher’s results, it was
found that brand awareness has a positive influence on perceived quality and repurchase intention,
but has a negative influence on brand loyalty. Perceived quality has a positive influence on
repurchase intention, but has a negative influence on brand loyalty. It was also found that brand
loyalty has a negative influence on repurchase intention of RTD coffee customers. The mediating
tests shows that both brand loyalty and perceived quality do not intervene in the relationship between
brand awareness and repurchase intention.
Wiguna (2013) investigated the influence of celebrity endorsement, brand awareness, brand
association, brand personality towards repurchase intention of Isotonic drink of Pocari Sweat. The
researcher collected 100 samples from universities in Ciputat city, Indonesia and the researcher
implemented multiple linear regressions to understand the relationship between the hypotheses. Based

31
on the research’s result it was found that celebrity athlete endorsement, brand awareness, brand
association, and brand personality simultaneously (together) have an influence on repurchase
intention.
Porral et al, (2013) investigated the influences of perceived quality, brand awareness, brand
association, brand loyalty and brand equity towards purchase intention of Heineken beer in Spain.
The researcher was conducted online questionnaire during the month of March 2012 and collected
346 valid samples in Spain. Structural equation modeling was conducted to examine the hypotheses.
The research’s result reveals that the brand association of beer is the most important dimension for
beer’s brand equity. In addition, it also influences purchase intention proved by empirical support and
found a significant positive on brand awareness, perceived quality and loyalty.
Tong and Hawley (2009) studied about the marketing factors affecting brand equity
dimensions which included TV advertising, print advertising and web advertising as sub-variables
and the purpose of this study is to investigate the effective marketing activities for creating brand
equity in the Chinese clothing market. The researchers collected the completed surveys and returned
623 questionnaires from six shopping centers in Beijing and Shanghai and analyzed the data by using
the structural equation model (SEM). The analysis of the data showed that celebrity endorsement,
event sponsorship, TV advertising, print advertising and web advertising are positively related with
perceived quality. Then, celebrity endorsement, event sponsorship, TV advertising, print advertising
and web advertising are positively related with brand awareness. The researchers also found that
celebrity endorsement, event sponsorship, TV advertising and web advertising are positively related
with brand association. Subsequently, the researchers explored that event sponsorship and print
advertising are positively related with perceived quality.
Jalilvand et al, (2011) “The effect of brand equity dimensions on re-purchase intention: An
Application of Aakers model in Auto mobile industry”. In this research the researchers used four
independent variables which are brand awareness, brand association, perceived quality and brand
loyalty influencing the dependent variable which is purchase intention. This research paper aimed to
investigate the effect of brand equity dimensions on the purchase intention of automobiles. To
32
investigate the factors affecting purchase intention the researchers collected 242 samples of
questionnaires using the ‘‘cluster’’ sampling method. The samples were collected at Iran Khodro’s
agencies in Isfahan during the month of November 2010. The researchers implemented structural
equation modeling using AMOS structural equation program to test the hypotheses. The result of the
research revealed that brand awareness, brand association, brand loyalty, and perceived quality had a
significant and positive influence on purchase intention. From the result, it is understandable that if a
customer perceives the quality to be good, if he is aware of the brand and if he is loyal to the brand
then he will have a higher repurchase intention towards that automobile brand.

33
Chapter 3
RESEARCH FRAMEWORKS
The researcher explains about the theoretical framework, the conceptual framework,
hypotheses, and operationalization of the dependent and independent variables in this chapter. The
theoretical framework is derived from the ideas and theories of the 3 selected research articles which
be revealed in this chapter. The researcher drew the conceptual framework by applying the concepts
and basis of the theory. After developing the conceptual framework, the researcher prepared the
hypotheses which are related to this study. This study is designed to find out the influential factors
affecting repurchase intention towards the Ichitan brand in Bangkok.
3.1 Theoretical Framework
The theoretical framework is exploring the relationship between each variable in a logical
pattern. The researcher reformed the conceptual framework based upon 4 major research models to
modify the conceptual frame work as follows:
The first model is about the factors which influence brand equity of Etka stores in Iran, which
was developed by Alizade et al. (2014). This study investigates the impact of price promotion,
intensity of distribution, cost of advertisements, image of store and price, brand loyalty, brand
association on brand equity of Iraian customers’. The researchers applied nineteen hypotheses and
nine variables in this study. The findings of this study revealed that Intensity of distribution also had a
positive significant influence on perceived quality, brand association and brand loyalty of Ekta brand
and the brand equity is significantly influenced by brand association, perceived quality and brand
loyalty.
The second research is about the building brand equity the clothing market at China (the
influence of selected marketing activities upon brand equity dimension) and which was developed by
Tong and Hawley (2009). This study is conducted to understand the influences of web advertising,

34
store image, print advertising, celebrity endorsement, event sponsorship, TV advertising, price
promotion, perceived quality, non- price promotion, brand association, brand awareness towards
brand loyalty.
The researchers constructed 34 hypotheses to understand the relationship between the
independent, dependent and moderate variables. The researchers investigated that brand awareness is
the elementary foundation in generating brand equity. Brand loyalty is driven by marketing strategies
such as brand association, brand awareness and perceived quality. Quality is the most important part
for an enduring brand association. The result of this study also revealed that event sponsorship,
celebrity endorsement, non-price promotions, store image and web advertising positively influences
upon perceived quality, brand awareness and brand association at China.
The last research model is the effect of brand equity upon purchase intention (the application
of model of Aakers at Auto mobile industry) and which is established by Jalilvand et al., (2011). The
researcher found out the influence of brand association, brand awareness, brand loyalty and perceived
quality towards purchase intention in this research. The researchers used 4 hypotheses in this study
and the result exposed that brand association, brand awareness, perceived quality and brand loyalty
have a significant and positive influence on purchase intention.
The comprehensive explanation for that 3 research models are as following;

35
Figure 3.1: The model of study on the consequence of selected marketing mix elements upon brand
equity with intermediating the role of brand equity in ETKA chain stores golestan province.
Source: Alizade, R., Mehrani, D. H. and Didekhani, D. H. (2014). Study on the consequence of selected
marketing mix elements upon brand equity with intermediating the role of brand equity in ETKA
chain stores golestan province. Kuwait Chapter of Arabian Journal of Business and Management
Review, 3 (11a), 184-193.
The First theoretical model which the researcher used to build the conceptual frame work is
Studyin on the consequence of selected marketing mix elements upon brand equity with
intermediating the role of brand equity in ETKA chain stores golestan province and which was
developed by Alizade et al. (2014). This researcher used 8 independent variables such as price
promotion, cost of advertisements, intensity of distribution, image of store and price, brand loyalty,
brand association to study the influences on brand equity of Ekta brand. The main intention to
conduct this study was to understand the effects of selected marketing mix elements in the opinion of
customer upon brand equity. The researcher was collected 384 questionnaires from the customers of

36
Etka chain stores located at Golestan province in Iran. The samples were tested with t-test, factor
analysis and path analysis to study the relationships between the variables.
The results of this research revealed that the brand equity of Etka brand is greatly influenced
by intensity of distribution. Intensity of distribution also has a positive, significant influence upon
perceived quality, brand association and brand loyalty of Ekta brand. The result also revealed that the
Image of store influence brand association and perceived quality but it has no influence on creating
brand equality but Cost of advertisement significantly influences perceived quality, brand equity,
brand loyalty and brand association. The researcher found that brand equity is significantly dominated
by perceived quality, brand association and brand loyalty.
Figure 3.2: The model of Generating brand equity in the clothing market at China; The influence of
selected marketing activities upon the dimensions of brand equity.
Source: Tong, X., and Hawley, M. J. (2009); Generating brand equity in the clothing market at China;
The influence of selected marketing activities upon the dimensions of brand equity. Journal of
Fashion Marketing and Management, 13(4), 566-581

37
The Second theoretical model which the researcher used to build the conceptual frame work
is Generating brand equity in the clothing market at China; The influence of selected marketing
activities upon the dimensions of brand equity and which was developed by Tong and Hawley (2009).
This study is conducted to understand the influences of marketing activities on brand equity
dimensions. The researchers applied a total of number of 12 variables, which includes 8 independent
variables, 3 moderate variables and 1 dependent variable, which are: web advertising, store image,
print advertising, celebrity endorsement, event sponsorship, TV advertising, price promotions,
perceived quality, non- price promotion, brand association, brand awareness and brand loyalty. The
researchers constructed 34 hypotheses to understand the relationship between independent, dependent
and moderate variables.
To investigate the factors affecting brand loyalty the researchers collected 623 samples from 6
shopping centers at Beijing and Shanghai (3 in each city). Majority of respondents are between 18 to
39 years old.
The researchers implemented structural equation model by using AMOS structural equation
program to test the hypotheses. The result of this study revealed that for the creating brand equity,
brand awareness is the basic foundation. Brand loyalty is driven by marketing strategies such as brand
association, brand awareness and perceived quality. Advanced quality is a very important part for an
enduring brand association. The result of this study also revealed that event sponsorship, celebrity
endorsement, non-price promotions, store image and web advertising have a positive influences
affecting brand awareness, perceived quality and brand association in China.
Figure 3.3: The research model of ‘Factors affecting purchase intention of an Auto mobile’.

38
Source: Jalilvand, M. R., Samiei, N. and Mahdavinia, S. H. (2011); The consequence of brand equity
dimensions upon purchase intention; the application of the model of Aakers at Auto mobile industry.
Journal of International Business and Management 2(2), 149-158.
The third theoretical model which the researcher used to build the conceptual frame work is
“The consequence of brand equity dimensions upon purchase intention: The application of the model
of Aakers at Auto mobile industry”. In this study, the researchers applied 4 independent variables,
such as brand association, brand awareness, brand loyalty and perceived quality and these are
influencing the dependent variable, purchase intention.
This research paper was aimed to examine the influence of brand equity dimensions upon the
purchase intention of automobiles. To investigate the factors affecting purchase intention the
researchers collected 242 samples of questionnaires using the ‘‘cluster’’ sampling method. The
samples were collected at the agencies of Iran Khodro at Isfahan during November, 2010.
The researchers implemented the structural equation model by using AMOS structural
equation program to examine the hypotheses. The outcome of the research exposed that brand
association, brand awareness, perceived quality and brand loyalty have a significant and positive
influence on purchase intention. From the results, it is understandable that if a customer perceives the
quality to be good, if he is aware of the brand and if he is loyal to the brand then he will have a higher
purchase intention towards that automobile brand.
3.2 Conceptual Framework

39
The conceptual framework is the own model of researcher and it clarifies the relationship
between the dependent and independent. Chen (2009) stated that the independent variables are the
things that affect upon the dependent variables with a positive way or negative way and the
dependent variables are the variables of primary interest to the researcher. According to the
theoretical fundamentals from Figures 3.1 to 3.3 of the theoretical framework, there are many factors
that lead to repurchase intention via brand association, brand awareness and perceived quality.
Though, the researcher will apply only seven variables, which are web advertising, print advertising,
TV advertising, intensity of distribution, perceived quality, brand awareness and brand association.
This study is designed to understand the model of repurchase intention of the Ichitan brand
which is one of the most popular soft drinks in Thailand. The researcher intentionally selects the
above frameworks by gathering and examining the perilous information to outline his own
conceptual framework. In evolving the conceptual model, this article initiates with a discussion of
selected variables that subsidize to repurchase intention. And this framework explains how those
variables may directly effect to each other. Showing in Figure 3.4, repurchase intention is the
dependent variable and web advertising, print advertising, TV advertising, intensity of distribution,
brand awareness, perceived quality and brand association towards repurchase intention of Ichiatan
brand are independent variables.
The researcher applied three variables (intensity of distribution, perceived quality and brand
association) from the first theoretical framework. Alizade, Mehrani and Didekhani (2014) argued that
intensity of distribution is the antecedent of perceived quality and brand association. Roj (2002) stated
that brands which have a higher intensity of distribution are likely to be perceived to be high in
quality.
The researcher applied six variables (print advertising, web advertising, TV advertising, brand
awareness, perceived quality and brand association) from the second theoretical framework.
According to Yoo et al. (2000), advertising is the major contributor of building brand equity
dimensions; example brand awareness, perceived quality and brand association.

40
The researcher utilized four variables (brand awareness, brand association, repurchase
intention and perceived quality) from the theoretical framework. Regarding to Ashil and Sinha (2004),
if the customer is aware of the brand, if he have a good image on the brand about the quality then the
customer has a higher intention to repurchase.
Therefore, the researcher modified the assessment of repurchase intention and related factors
to develop a conceptual framework for this study. According to Sekaran (1992), a hypothesis is a
guess or an assumption that the researcher builds about some characteristics of the population in his
study. Regarding the statement of the problem and objective of the study, 4 hypotheses are developed
and the Hypotheses are tested with Multiple Linear regression. The details of the hypotheses are as
follows
Figure 3.4: Modified Conceptual Framework of factors influencing repurchase intention of Ichitan
brand in Bangkok
3.3 Research Hypotheses
41
H1o: Web advertising, TV advertising, print advertising, and intensity of distribution do not
have a statistically significant influence on perceived quality of Ichitan.
H1a: Web advertising, TV advertising, print advertising, and intensity of distribution have a
statistically significant influence on perceived quality of Ichitan.
H2o: Web advertising, TV advertising, and print advertising do not have a statistically
significant influence on brand awareness of Ichitan.
H2a: Web advertising, TV advertising, and print advertising have a statistically significant
influence on brand awareness of Ichitan.
H3o: Web advertising, TV advertising, print advertising and intensity of distribution do not
have a statistically significant influence on brand association of Ichitan.
H3a: Web advertising, TV advertising, print advertising, and intensity of distribution have a
statistically significant influence on brand association of Ichitan.
H4o: Perceived quality, brand awareness and brand association do not have a statistically
significant influence on repurchase intention of Ichitan.
H4a: Perceived quality, brand awareness and brand association have a statistically significant
influence on repurchase intention of Ichitan.
3.4 Operationalization of the Variables
Operational definition provides the concept of necessary activities and operations for getting
beneficial measurements (Zikumud, 2003). Table 3.1 of operationalization points out the independent
and dependent variables as follows:
Table 3.1: Operationalization of the Variables
Variables Concepts of Variables Operational Components Measurement
Scale

42
Repurchase
intention
Jackson (1985) demarcated
repurchase intention is the
consumers’ behavioral intention to
continue to purchase the same
service or product or brand
intention and it also refers to the
likelihood of continuing to
purchase from the same company
a service or product or brand from
the provider again in the future
-I would feel pleasure about
my purchase, if I buy an
Ichitan branded drink again
-The Ichitan brand drink
satisfied me and I would
like to buy it again in the
future
-I am always interested in
new products from Ichitan
brand and would like to try
them in the future
Interval Scale
Brand
awareness
Aaker (1991) define brand
awareness as the strength of trace
of the brand in the memory of
consumers and it is replicated by
the ability of consumers to classify
the brand under dissimilar
conditions.
-I have good knowledge of
Ichitan, more than the other
brands on the market.
-When it comes to
beverages, the Ichitan brand
stands out in my mind.
-I know what the Ichitan
brand looks like.
-I can recognize Ichitan
brand easily among other
brands.
Interval Scale
Perceived
Quality
Roberts (2006) demarcated web
advertising is the paid or unpaid
form of communication
throughout the internet to
-The Ichitan brand is
associated with very high
quality products.

43
encourage and make awareness of
the product or brand.
-The Ichitan brand offer
products of consistent
quality.
-I trust the quality of
products from the Ichitan
brand.
Brand
association
Aakar (1991) mentioned brand
association is the thing which
includes the reputation of the
company, the characteristics of the
products and service and attributes
of the products and services which
are connected from the memory to
the brand.
-Some characteristics of the
Ichitan brand come to my
mind quickly.
-I can quickly recall the
symbol or logo of the
Ichitan brand.
-Ichitan is different from its
competing brands.
TV
Advertising
Janoschka (2003) mentioned TV
advertising is a visualized
advertising messages of animated
pictures which are capable to
motivate the audiences through
the combination of audio, visual
and animated messages
components.
-TV advertising for Ichitan
brand is seen frequently.
-Ichitan brand is intensively
advertised on TV.
-TV advertisements for
Ichitan brand looks more
expensive compared to
other competing brands.
-TV advertisements of
Ichitan brand is exciting and
Interval Scale

44
innovative.
Advertising
Wang et al. (2004) explored print
advertising is the conventional
method of advertising which is
supported by print media example
magazines and newspapers. It is a
static mode of presenting
advertisements. Print
advertisements normally include
written languages and graphics.
-Ichitan’s brand is
intensively advertised in
magazines, newspapers and
pamphlets.
-The print advertising for
Ichitan brand in magazines,
newspapers and pamphlets
seem very expensive
compared with other
competing brands.
-The print advertising of
Ichitan brand in magazines,
newspapers and pamphlets
are seen very frequently.
-Ichitan brand spends a great
amount of money on print
advertising.
Interval Scale
Web
Advertising
Roberts (2006) mentioned web
advertising is paid or unpaid forms
of communication throughout the
internet to promote and create the
awareness of brand or product.
-Ichitan brand is intensively
advertised at social
networking websites.
-The web advertising for
Ichitan’s brands are seen
frequently.
-Ichitan brand spends a great
amount of money on web
Interval Scale

45
advertising.
Intensity of
Distribution
Yoo et al. (2000) defined this as the
level of the availability of
products at the market which is
selected by the marketer. The level
of distribution intensity which the
marketers select is frequently
dependent on the factors such as
pricing, the size of the target
market, production capacity and
promotion in the addition to the
number of products or services
which will require after
purchasing
-It is very easy to find and
buy Ichitan brand drinks.
-Ichitan has very good
distribution channel. (Such
as; direct sales team, sell
through dealers, whole sale
distributor.)
-Consumers can find Ichitan
brand drinks in any store.
Interval Scale
46
Chapter 4
RESEARCH METHODOLOGY
This chapter provides a panoramic view of all the methodologies used in this study. An
appropriate research design is one of most important criteria for collecting the data so as to realize the
objectives of research. This chapter is composed of seven major sections.
The first section in this chapter deals with explaining the methods used in this research and
the researcher’s explanations about the selection of methods used for this study to evaluate the
factors, which influence repurchase intention towards the Ichitan brand. The second section explains
about the respondents and sampling procedures, which are used in this research. A detailed
clarification about the sampling unit, target population, and sampling procedures and sample size.
The third section is about the research instruments and it is about the questionnaires that are using in
this study with their scaling methods. The fourth section is a pretest and the fifth section is the
gathering of data. The researcher applied both primary data and secondary data in this research. The
sixth section is about the statistical treatment of data and the last section is a summary of the
statistical tools that are using for the testing of hypotheses.
4.1 Methods of Research Used
The researcher used descriptive research to develop this study. Descriptive research describes
the characteristics of a population in this study. According to Churchill (1999), descriptive research is
smeared to calculate the proportion of the people in a particular population who perform in a certain
way. Zikmund (2003) indicated about the descriptive research that it is the characteristics of a
population which also pursues to decide the answers to who, what, when, where and how questions.
The researcher also applied the survey method in order to collect questionnaires from the
respondents. McDaniel and Gates (1998) stated that a survey is a research technique in which the
researcher applied a questionnaire to get opinions, facts and attitudes of the respondents. Aaker et al.
47
(1997) also stated that doing a survey is collecting the primary data by communication with the target
population’s respective sample and also a research technique.
According to Zikmund (2003), the survey technique affords an inexpensive, quick, accurate
and efficient means of obtaining information about a population. The researcher disseminated the
questionnaire among Thai people who are convenient to answer the questions to observe repurchase
intention towards the Ichitan brand. For the convenience of the respondents the questionnaires were
translated from English to Thai.
4.2 Respondents and Sampling Procedures
For this study, the respondents are Thai consumers who have had an experience in drinking
Ichitan branded drink. The data was collected in Bangkok, Thailand and the research procedure is as
follows;
4.2.1 Target Population
According to Anderson, Sweeney and Williams (2002), the target population is the population
from the sample drawn for inferences. According to Blackwell (1999), the target population is a
cluster of people who are sharing a common behavior which are of concern to the researchers.
Malhotra (2000) identified that the target population is the collection of objective elements that
possess the information that is seeking by the researchers. Zikmund (2003) also demarcated that the
meaning of target population is the widespread group of the elements of precise population which is
appropriate to the research project. The primary objective of this study is to study and understand the
repurchase intention of Ichitan branded drink among Thai customers. Therefore, the target population
selected in this research is male and female consumers who have had an experience in drinking
Ichitan branded drinks before. The research will be conducted in the following shopping malls in
Bangkok which are: Central World, Siam Paragon, Central Plaza Grand Rama 9, Seacon Square,
Central Plaza Rama II, Central Plaza Chaengwattana, Union Mall and Central Plaza Bangna which
are largest shopping malls in Bangkok (http://www.bangkok-city.com/shop/mall.html accessed on
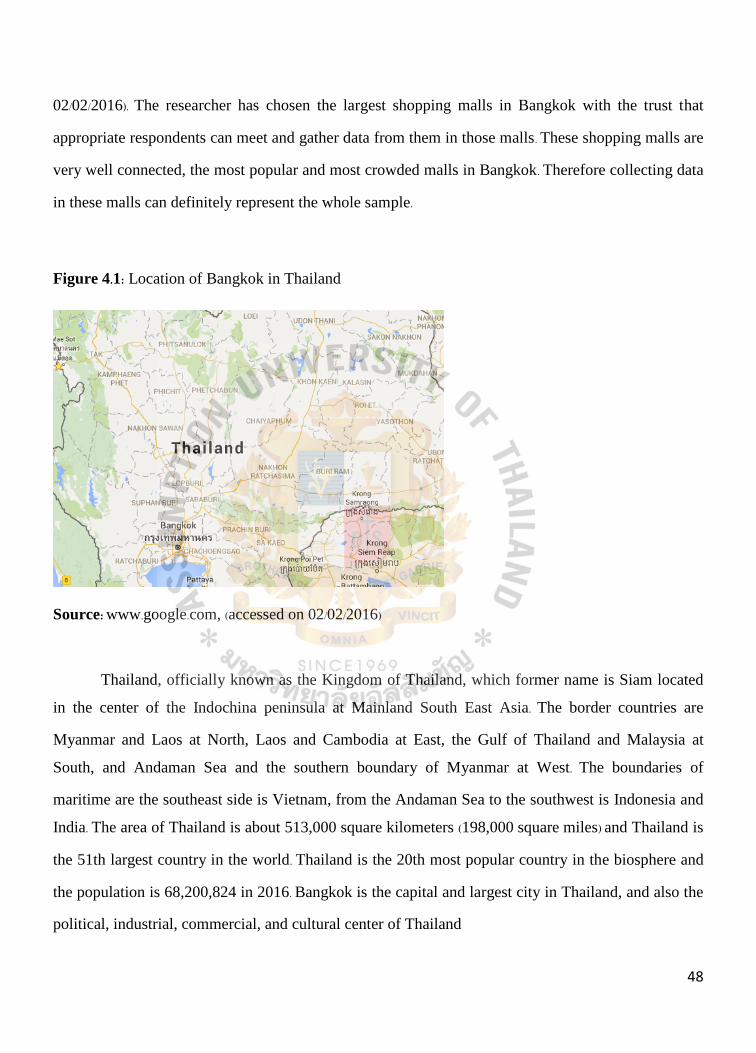
48
02/02/2016). The researcher has chosen the largest shopping malls in Bangkok with the trust that
appropriate respondents can meet and gather data from them in those malls. These shopping malls are
very well connected, the most popular and most crowded malls in Bangkok. Therefore collecting data
in these malls can definitely represent the whole sample.
Figure 4.1: Location of Bangkok in Thailand
Source: www.google.com, (accessed on 02/02/2016)
Thailand, officially known as the Kingdom of Thailand, which former name is Siam located
in the center of the Indochina peninsula at Mainland South East Asia. The border countries are
Myanmar and Laos at North, Laos and Cambodia at East, the Gulf of Thailand and Malaysia at
South, and Andaman Sea and the southern boundary of Myanmar at West. The boundaries of
maritime are the southeast side is Vietnam, from the Andaman Sea to the southwest is Indonesia and
India. The area of Thailand is about 513,000 square kilometers (198,000 square miles) and Thailand is
the 51th largest country in the world. Thailand is the 20th most popular country in the biosphere and
the population is 68,200,824 in 2016. Bangkok is the capital and largest city in Thailand, and also the
political, industrial, commercial, and cultural center of Thailand
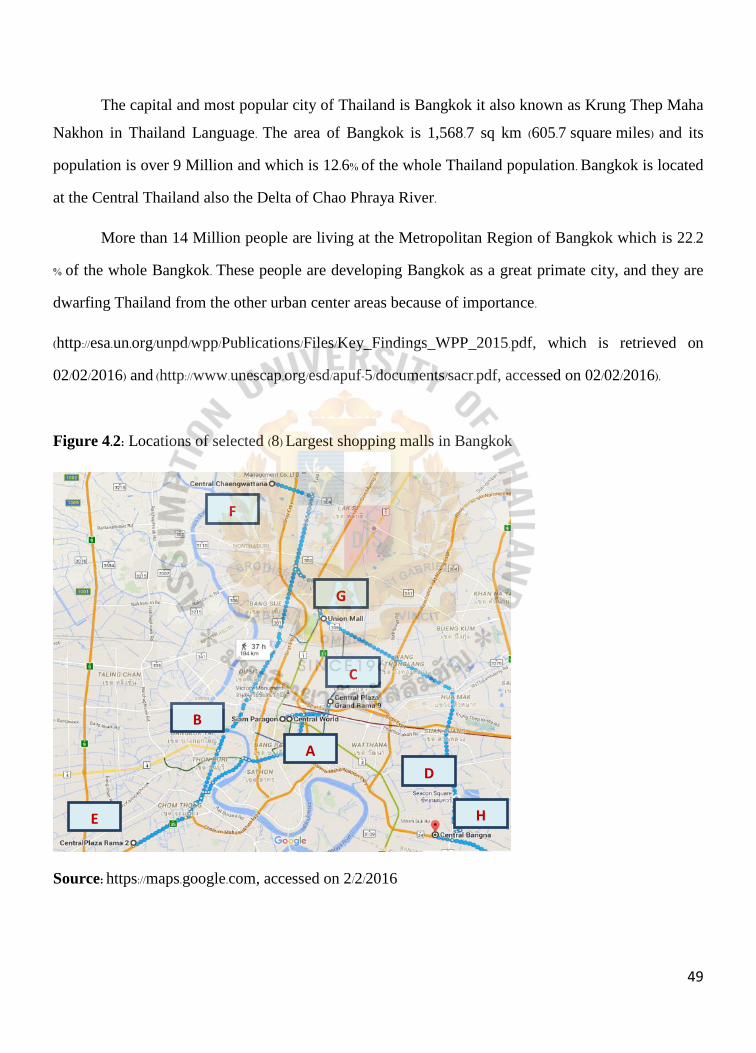
49
The capital and most popular city of Thailand is Bangkok it also known as Krung Thep Maha
Nakhon in Thailand Language. The area of Bangkok is 1,568.7 sq km (605.7 square miles) and its
population is over 9 Million and which is 12.6% of the whole Thailand population. Bangkok is located
at the Central Thailand also the Delta of Chao Phraya River.
More than 14 Million people are living at the Metropolitan Region of Bangkok which is 22.2
% of the whole Bangkok. These people are developing Bangkok as a great primate city, and they are
dwarfing Thailand from the other urban center areas because of importance.
(http://esa.un.org/unpd/wpp/Publications/Files/Key_Findings_WPP_2015.pdf, which is retrieved on
02/02/2016) and (http://www.unescap.org/esd/apuf-5/documents/sacr.pdf, accessed on 02/02/2016).
Figure 4.2: Locations of selected (8) Largest shopping malls in Bangkok
Source: https://maps.google.com, accessed on 2/2/2016
F
E
D
C
B
A
H
G

50
Note;
A= Central World
B= Siam Paragon
C= Central Plaza Grand Rama 9
D= Seacon Square
E= Central Plaza Rama II
F= Central Plaza Chaengwattana
G=Union Mall
H= Central Plaza Bangna
Figure (4.2) designated the selected eight largest shopping malls at Bangkok. The researcher
will gather the primary data from the shopping malls which are, A refers to the Central World, B
refers to the Siam Paragon, C refers to the Central Plaza Grand Rama 9, D refers to the Seacon
Square, E refers to the Central Plaza Rama II, F refers to the Central Plaza Chaengwattana, G refers
to the Union Mall and H refers to the Central Plaza Bangna and their location in Bangkok.
4.2.2 Sampling Unit
The sampling unit selected for the purpose of this research is people from Bangkok who have
had an experience in having Ichitan brand drinks. As the number of customers who have experience
in having Ichitan at Bangkok is not known, the researcher decided to govern the sample size by using
the population proportion method. According to Hair et al. (2000), people who are studying upon the
research project are known as the population and the sample is designated from the population.
Zikmund (2003) indicated that the sampling unit is a single or group of element(s) which are subjected
to select inside the sample. Individuals from the overhead selected shopping malls at Bangkok,
Thailand are distributed the questionnaires.

51
4.2.3 Sample Size
Malhotra and Birks (2000) itemized the sample size as the number of elements to be included
in the study. In this study, the researcher selects the sample size by determining the population. In the
city of Bangkok, the total number of Ichitan customers is unpredicted. Thus, the exact population of
this study is unknown. Therefore, the researcher should estimate how many target respondents were
in this study.
McClave et al. (2004) defined that in order to ensure the analytical data to be more reliable and
decrease the deviations, the research findings should round the value upwards. Malhotra and Birks
(2004) mentioned that the sample size is taking reference from the sample size from what related to
the study. Thus, the sample size was designed by using references from previous studies’ sample
sizes. Tong and Hawley (2009) collected 623 defendants as his sample to identify the relationship
between web advertising, store images, print advertising, celebrity endorsement, event sponsorship,
TV advertising, perceived quality, price promotion, non- price promotion, brand association, brand
loyalty and brand awareness.
The researchers constructed 34 hypotheses to understand the affiliation of the independent
variables. Alizade et al. (2014) applied 320 respondents as the sample of their research to identify the
relationship between price promotions, cost of advertisements, intensity of distribution, image of
store and price, brand association, brand loyalty and brand equity. Jalilvand et al. (2011) applied 242
respondents as sample to identify the relationship between brand association, brand awareness, brand
loyalty perceived quality and purchase intention. Keisidou et al. (2013) identified that the size of
sample must be enormous enough to represent the whole population to generate valid results. The
more questionnaires are distributed, the result will be more reliable and accurate (Zikmund, 2014).
Therefore, the researcher will distribute 400 questionnaires to respondents as the sample size.
52
4.2.4 Sampling Procedure
Zikmund (2003) defined sampling that it is a technique to choose a part of a representative
sample from the research population and in line with that part of a sample to suppose the general
situation. In many cases, it is very hard to do research upon the whole population but parts of it can be
applicable. The selection of this part is essential to depend on sampling to complete and save costs
and time of the study.
According to Zikmund (2003), there are two different sampling forms; which are Non-
probability and Probability. In this research, the researcher applied simple random sampling for
probability sampling technique and quota and convenience sampling for the non-probability sampling
technique.
Morgan et al. (2005) stated that probability sampling is a technique and all units of the
population are known. Zikmund (2003) stated that simple random sampling is a sampling process that
declares each element in the population has an equivalent of being comprised in the sample.
According to Zikmund (2003), non-probability sampling is a technique in which every unit of
the sample is selected upon the basis of personal or convenience judgment. Urdan (2005) stated that
quota sampling is under non-probability sampling technique and which is used the same proportion to
choose the sample upon the target population. Zikmund (2003) explained the convenience sampling
technique is a technique which is selected the people or the target population whose are appropriately
accessible.
Step 1: Judgment Sampling
Malhotra (2002) described that judgment sampling is a sampling technique and which is one
kind of technique from non-probability sampling technique and respondents are selected along with
the experience of the researcher’s belief that they will meet the requirements of this research. Hair et
al. (2000) stated that judgment sampling is a technique where the researcher selects a sample based on

53
his judgment and judgment of samples are all based on the characteristics that are required for the
sample members.
Based upon the data of the biggest and most popular eight shopping malls, the researcher will
choose the top eight biggest shopping malls in Bangkok (www.bangkok-city.com) with the trust that
appropriate respondents can be encountered and gather data from them in these malls. These shopping
malls are very well connected, the most popular and most crowded malls in Bangkok. Therefore,
collecting data in these malls can definitely represent the whole sample.
Table 4.1: The 8 selected largest shopping malls which are ranked by gross leasable area in Bangkok
No. Name of Shopping Malls District Area in Square meter
1. Central World Prathum wan 429,500
2. Siam Paragon Prathum wan 300,000
3. Central Plaza Grand Rama 9 Din Daeng 214,000
4. Seacon Square Prawet 180,000
5. Central Plaza Rama II Bang Khunthian 161,500
6. Central Plaza Chaengwattana Pakkret 160,000
7. Union Mall Chatuchak 150,000
8. Central Plaza Bangna Bangna 113,000
Source: http://www.bangkok-city.com/shop/mall.html accessed on 02/02/2016
Step 2: Quota Sampling
According to Sekaran (1992), quota sampling is one method under non-probability sampling
method, and which is used to represent the subgroups of the selected population. Zikmund (2003)
stated that quota sampling is one method under non-probability sampling procedure, and which is

54
ensured that certain features of a population sample will be epitomized to the strict extent that the
investigator desires. Babbie (2001) described that the researcher purposes to represent the main
characteristics of the population by sampling the proportional amount of each in a quota sampling.
The researcher applied the technique to make sure the sample size of each sub group for assembling
data from the respondents. In this research, a total of 400 questionnaires were equally divided and
distributed among (8) largest shopping malls in Bangkok, Thailand. In the Table 4.2 the distribution of
all questionnaires among eight largest shopping malls are displayed.
Table 4.2: Eight Selected Largest Shopping malls in Bangkok
Shopping Malls Amount (respondents)
Central World 50
Siam Paragon 50
Central Plaza Grand Rama 9 50
Seacon Square 50
Central Plaza Rama II 50
Central Plaza Chaengwattana 50
Union Mall 50
Central Plaza Bangna 50
Total Samples collected 400
Step 3: Convenience Sampling
Convenience sampling is a method of sampling method which is applied to collect
information from people whose are most conveniently available, often regarded as haphazard
sampling or accidental and. Davis and Hair et al. (2000) commented that convenience sampling is
applied in exploratory research and descriptive research and time and money are critical constraints.

55
Zikmund (2003) commented that, convenience sampling is the most beneficial to get a large number
of completed questionnaires by means of quickly and economically. In this research, the researcher
will allocate questionnaires to 400 respondents from the selected eight largest shopping malls in
Bangkok.
4.3 Research Instrument/Questionnaires
In this research, questionnaires are being applied as a research instrument to understand the
model of repurchase intention of Ichitan brand. The questions are mounted on the basis of previous
studies and theoretical frameworks. In this study, questionnaires are separated into ten parts,
including the screening question, web advertising, print advertising, TV advertising, intensity of
distribution, brand awareness, perceived quality, brand association, repurchase intention and
demographic factors. The total numbers of questions are 33 items and the detailed explanations about
each part are described below;
Part I: Screening Questions
The first part has one screening questions, in order to help choose the correct respondents. The
screening question aims to screen out unqualified or ineligible respondents who live in Bangkok by
using the simple category scale method. The screening question asked the respondents: “Have you
ever drunk Ichitan branded drink before?” the question was aimed to filter the respondents who drank
Ichitan branded drinks before.
In this research, from parts 2-10, the researcher will use the five points Likert scale methods
for all questionnaires. Rensis (1932) stated that the Likert scale is the most popular method for
calculating attitudes and the method is simple to administer.
The design of the five points Likert scales agrees the respondents to allusion how much
strongly they agree or disagree with the statements and which is range from very positive to very
negative to the attitudinal object. The five points Likert scales are used in this study to collect the
56
questionnaire about consumers’ attitudes towards all the variables concerning the repurchase
intention of customers as follows;
1 = strongly disagree
2 = disagree
3 = neither agree nor disagree
4 = agree
5 = strongly agree
Part II: Web Advertising
This part includes three questions to measure the web advertising of the Ichitan branded
drinks and the questionnaires were adapted from Tong and Hawley (2009).
Part III: Print Advertising
This part includes four questions to measure the print advertising of the Ichitan branded
drinks and the questionnaires were adapted from Tong and Hawley (2009).
Part IV: TV Advertising
This part includes four questions to measure the TV advertising of the Ichitan branded drinks
and the questionnaires were adapted from Tong and Hawley (2009).
Part V: Intensity of Distribution
This part includes three questions to measure the intensity of distribution of the Ichitan
branded drinks and the questionnaires were adapted from Alizade et al. (2014).
57
Part VI: Brand Awareness
This part includes four questions to measure the brand awareness of the Ichitan brand towards
customers’ and the questionnaires were adapted from Jalilvand et al. (2011).
Part VII: Perceived Quality
This part includes three questions to measure the perceived quality of the Ichitan brand
towards customers’ and the questionnaires were adapted from Jalilvand et al. (2011).
Part VIII: Brand Association
This part includes three questions to measure the brand association of the Ichitan brand
towards customers’ and the questionnaires were adapted from Jalilvand et al. (2011).
Part IX: Repurchase Intention
This part contains the dependent variables and there are three questions in this part to measure
the repurchase intention of Ichitan branded drinks among Thai customers and the questionnaires were
adapted from Jalilvand et al. (2011).
Part X: Demographic Factors
To measure the demographic information of the respondents, the researcher has selected the
category scale. According to Malhotra and Birks (2003), the category scale is the attitude
measurement, which contains various categories to afford the respondents with a number of different
ratings. This part contains 5 questions such as the age, gender, income per month, marital status and
educational level.
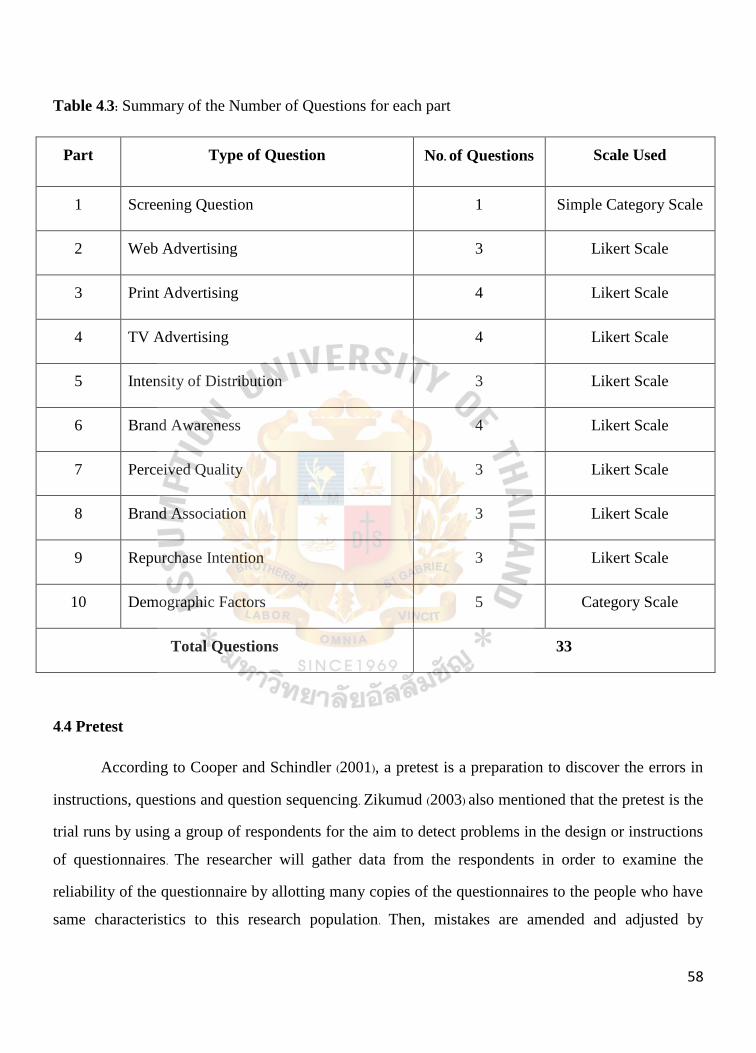
58
Table 4.3: Summary of the Number of Questions for each part
Part Type of Question No. of Questions Scale Used
1 Screening Question 1 Simple Category Scale
2 Web Advertising 3 Likert Scale
3 Print Advertising 4 Likert Scale
4 TV Advertising 4 Likert Scale
5 Intensity of Distribution 3 Likert Scale
6 Brand Awareness 4 Likert Scale
7 Perceived Quality 3 Likert Scale
8 Brand Association 3 Likert Scale
9 Repurchase Intention 3 Likert Scale
10 Demographic Factors 5 Category Scale
Total Questions 33
4.4 Pretest
According to Cooper and Schindler (2001), a pretest is a preparation to discover the errors in
instructions, questions and question sequencing. Zikumud (2003) also mentioned that the pretest is the
trial runs by using a group of respondents for the aim to detect problems in the design or instructions
of questionnaires. The researcher will gather data from the respondents in order to examine the
reliability of the questionnaire by allotting many copies of the questionnaires to the people who have
same characteristics to this research population. Then, mistakes are amended and adjusted by

59
wording, sequencing and structure. Then, the communication between the researcher and the
respondents will not be biased.
Sekaran and Bougie (2009) stated that questions from all variables were required to examine
the reliability, which will use Cronbach’s coefficient Alpha scale.
The responses to the questions in the questionnaire were handled in the statistical program by
using Cronbach’s Alpha test. Vanschbancha (2007) identified that the number of respondents will be
around 20-100 for conducting a pretest. Churchill (1999) indicated that reliability is applied to
calculate the consistency of the instrument. If an instrument provides a consistent measurement of
values, the instrument is reliable in this research. The researcher will gather the data from 80
respondents from the 8 largest shopping malls in Bangkok on a random basis to test the
questionnaire’s reliability. The 80 samples of questionnaires were distributed during January and
February, 2016 at Central World (Prathum wan district), Siam Paragon (Prathum wan district), Central
Plaza Grand Rama 9 (Din Daeng district), Seacon Square (Prawet district), Central Plaza Rama II
(Bang Khunthian district), Central Plaza Chaengwattana (Pakkret district), Union Mall (Chatuchak
district) and Central Plaza Bangna (Bangna district); in each shopping 10 questionnaire samples were
distributed.
The reliability of testing was tested by using eight variables, which are TV advertising, web
advertising, print advertising, intensity of distribution, brand association, brand awareness,
repurchase intention and perceived quality. Sekaran (1992) mentioned that if the reliability value for
every variable is higher than 0.60, all of the questionnaires are consistent and reliable to be applied as
the research instruments in this study. The detailed information of reliability analysis (alpha value) for
every variable is as follows;
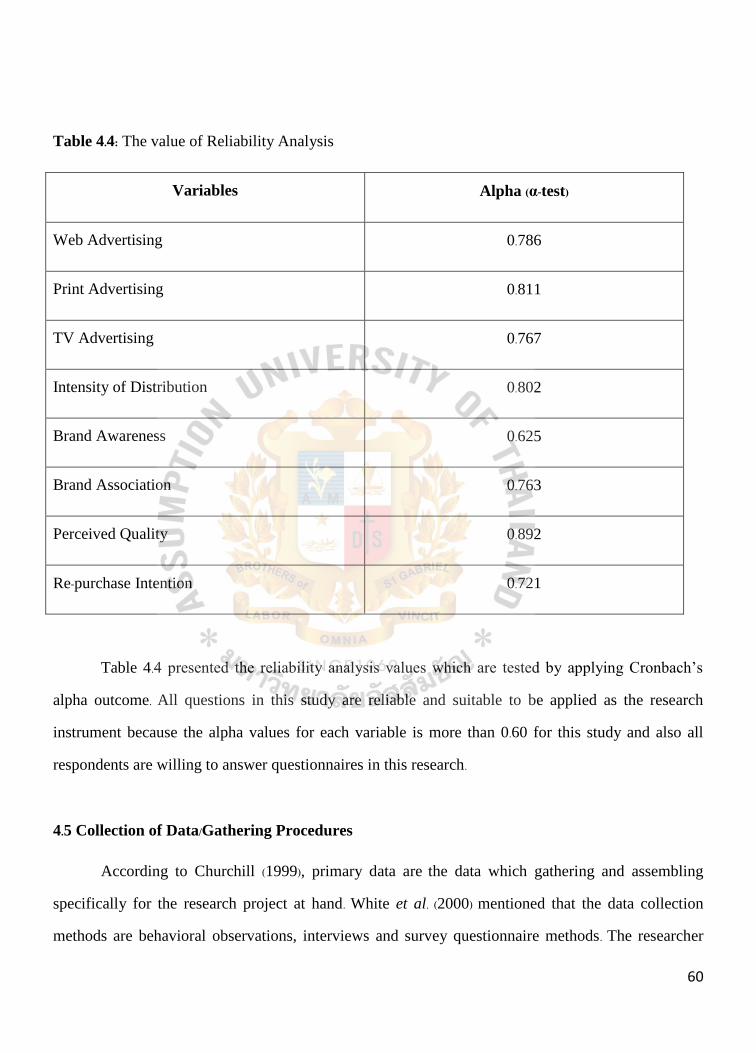
60
Table 4.4: The value of Reliability Analysis
Variables Alpha (α-test)
Web Advertising 0.786
Print Advertising 0.811
TV Advertising 0.767
Intensity of Distribution 0.802
Brand Awareness 0.625
Brand Association 0.763
Perceived Quality 0.892
Re-purchase Intention 0.721
Table 4.4 presented the reliability analysis values which are tested by applying Cronbach’s
alpha outcome. All questions in this study are reliable and suitable to be applied as the research
instrument because the alpha values for each variable is more than 0.60 for this study and also all
respondents are willing to answer questionnaires in this research.
4.5 Collection of Data/Gathering Procedures
According to Churchill (1999), primary data are the data which gathering and assembling
specifically for the research project at hand. White et al. (2000) mentioned that the data collection
methods are behavioral observations, interviews and survey questionnaire methods. The researcher

61
used both primary and secondary data to attain the objective of this study. The researcher used the
survey technique for gathering primary data. Even though the dispersed numbers of questionnaires
are 400 copies, the questionnaires were disseminated to respondents by applying face to face method
and the researcher explained the questions to each respondent to help them understand.
Before allocating the questionnaires, the respondents will be asked one prescreening question
to specify whether the respondents drank Ichitan branded drink before. The questionnaires were hand
distributed from Monday to Friday at 11.00 AM to 5.00 PM and from Saturday and Sunday at 10.00
AM to 5.00 PM at the selected eight shopping malls in Bangkok. The questionnaires are dispersed
until the prerequisite sample size is completed. The data were gathered during the specified time
within January and February, 2016.
The researcher will use secondary data to concept the structure of this research with
theoretically and systematically within the framework of the analysis, literature, conclusions and
recommendations. The researcher unruffled the data from journals, academic textbooks, research
articles, internet and magazines which are related to this study. Zikmund (2000) mentioned that
secondary data are one kind of data which poised from journals, books, research articles etc. rather
than the one at hand.
4.6 Statistical Treatment of Data
After collecting the necessary data, the researcher coded the returned and completed
questionnaires (400) into symbolic form by applying statistical software. The appropriate statistical
treatments which are using in this research are Inferential Analysis and Descriptive Analysis in which
the researcher will apply Pearson’s Correlation Analysis (two-tailed test), statistical significance (t
statistic) and Multiple Linear Regression. The statistical procedures that are utilizing in this research
are designated as follows;
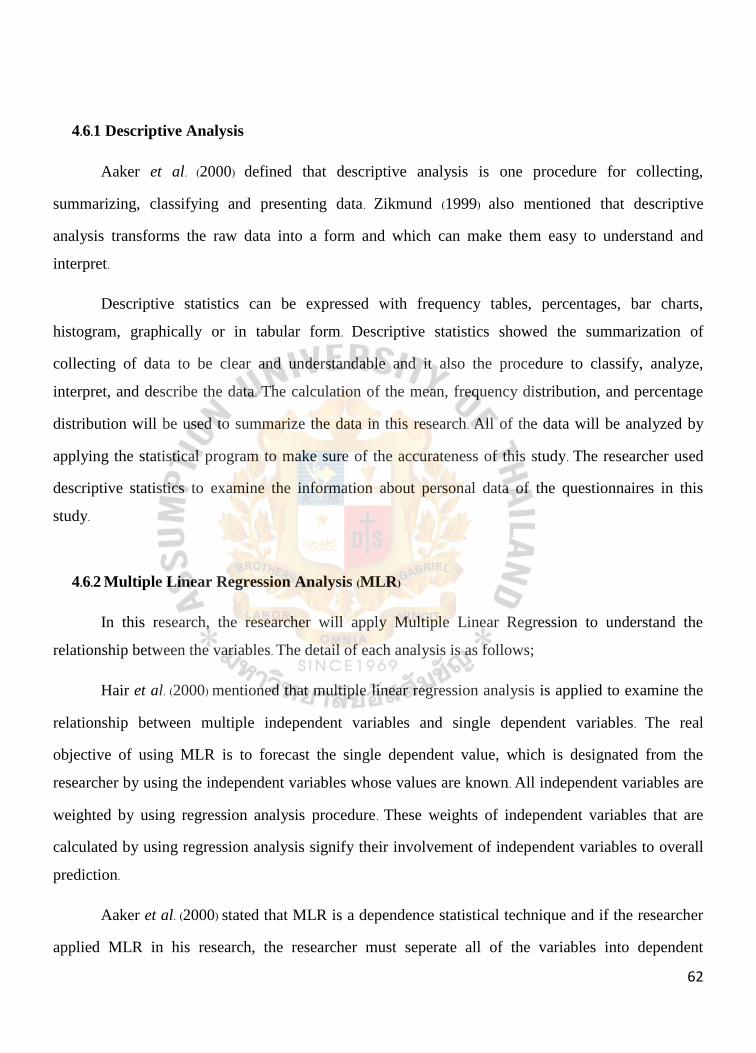
62
4.6.1 Descriptive Analysis
Aaker et al. (2000) defined that descriptive analysis is one procedure for collecting,
summarizing, classifying and presenting data. Zikmund (1999) also mentioned that descriptive
analysis transforms the raw data into a form and which can make them easy to understand and
interpret.
Descriptive statistics can be expressed with frequency tables, percentages, bar charts,
histogram, graphically or in tabular form. Descriptive statistics showed the summarization of
collecting of data to be clear and understandable and it also the procedure to classify, analyze,
interpret, and describe the data. The calculation of the mean, frequency distribution, and percentage
distribution will be used to summarize the data in this research. All of the data will be analyzed by
applying the statistical program to make sure of the accurateness of this study. The researcher used
descriptive statistics to examine the information about personal data of the questionnaires in this
study.
4.6.2 Multiple Linear Regression Analysis (MLR)
In this research, the researcher will apply Multiple Linear Regression to understand the
relationship between the variables. The detail of each analysis is as follows;
Hair et al. (2000) mentioned that multiple linear regression analysis is applied to examine the
relationship between multiple independent variables and single dependent variables. The real
objective of using MLR is to forecast the single dependent value, which is designated from the
researcher by using the independent variables whose values are known. All independent variables are
weighted by using regression analysis procedure. These weights of independent variables that are
calculated by using regression analysis signify their involvement of independent variables to overall
prediction.
Aaker et al. (2000) stated that MLR is a dependence statistical technique and if the researcher
applied MLR in his research, the researcher must seperate all of the variables into dependent

63
variables and independent. MLR is only applied when dependent and independent variables are
metric and the data can be appropriately shifted. The selection of dependent and independent
variables for applying MLR is depended upon the theoretical relationships between them.
The equation of multiple linear regressions is;
Standard Error of the Estimate
Aaker et al. (2000) defined that the standard error of the estimate (se) indicates the
measurement of the accuracy of forecast and also shows how close the actual observations with the
predicted values in the regression line. The following is the formula for standard error of the estimate:
Coefficient of Multiple Determination (R2)
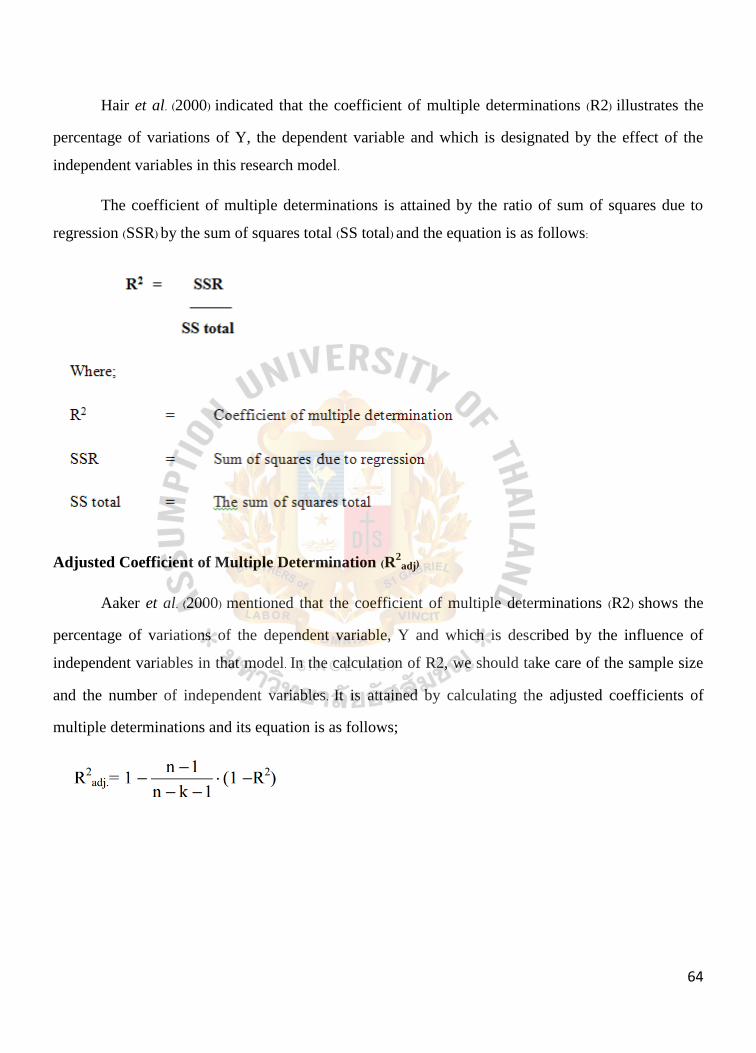
64
Hair et al. (2000) indicated that the coefficient of multiple determinations (R2) illustrates the
percentage of variations of Y, the dependent variable and which is designated by the effect of the
independent variables in this research model.
The coefficient of multiple determinations is attained by the ratio of sum of squares due to
regression (SSR) by the sum of squares total (SS total) and the equation is as follows:
Adjusted Coefficient of Multiple Determination (R2adj)
Aaker et al. (2000) mentioned that the coefficient of multiple determinations (R2) shows the
percentage of variations of the dependent variable, Y and which is described by the influence of
independent variables in that model. In the calculation of R2, we should take care of the sample size
and the number of independent variables. It is attained by calculating the adjusted coefficients of
multiple determinations and its equation is as follows;

65
ANOVA Table for Multiple Regression Analysis
The Analysis of Variance (ANOVA) table can give the researchers the following information:
Actually, summarizing the squares is the sums of the squared deviations about a mean.
ANOVA table has the Total sum of squares (SST), the regression sum of squares (SSR) and the
residual sum of squares (the error sum of squares). The calculations of sums of squares are exposed
below:
Table 4.6: The formula of ANOVA table for Regression Line
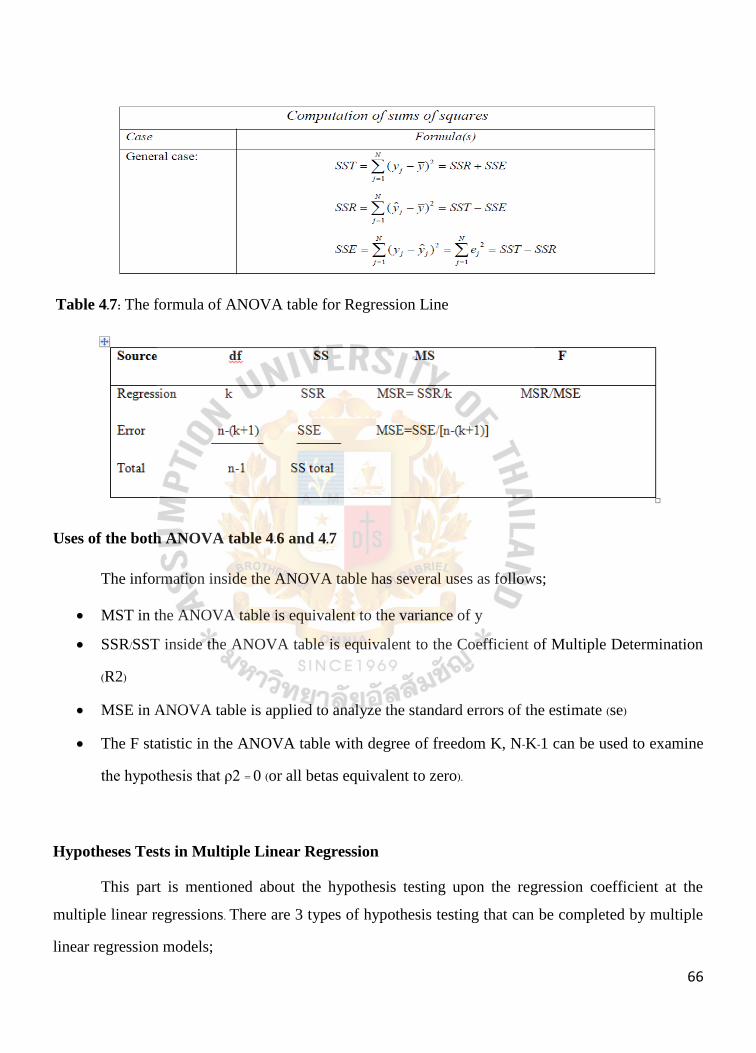
66
Table 4.7: The formula of ANOVA table for Regression Line
Uses of the both ANOVA table 4.6 and 4.7
The information inside the ANOVA table has several uses as follows;
MST in the ANOVA table is equivalent to the variance of y
SSR/SST inside the ANOVA table is equivalent to the Coefficient of Multiple Determination
(R2)
MSE in ANOVA table is applied to analyze the standard errors of the estimate (se)
The F statistic in the ANOVA table with degree of freedom K, N-K-1 can be used to examine
the hypothesis that ρ2 = 0 (or all betas equivalent to zero).
Hypotheses Tests in Multiple Linear Regression
This part is mentioned about the hypothesis testing upon the regression coefficient at the
multiple linear regressions. There are 3 types of hypothesis testing that can be completed by multiple
linear regression models;

67
Testing the significance of regression; which is the checking of the whole regression model’s
significance
t-test: t-test is the checking of the individual regression coefficients’ significance
F test: F test can be applied to examine individual coefficients and to test the number of
regression coefficients’ significance
Testing Models for their Significance (F-test)
Render et al. (2009) mentioned that the statistical hypotheses test is used to define the linear
relation between X and Y. If there is no relationship between X and Y, the value of β will be 0 and
which means the null hypotheses will be accepted. If there is a relationship between X and Y, the β
value will be not equal to 0 and null hypotheses will be rejected. The presence of the linear
relationship can be detected by using F-test and the below is the equation for F-test:
During calculating the F-value, the significance level needs to be determined. The level of
significant to behave for F-test in this research is 0.05. If the significant level of F-test is lower, null
hypothesis is rejected and there is a linear relationship between X and Y. If the significant level for F-
test is greater, the null hypothesis is failed to reject and there is no relationship between X and Y.
Test on Individual Regression Coefficients (t-Test)
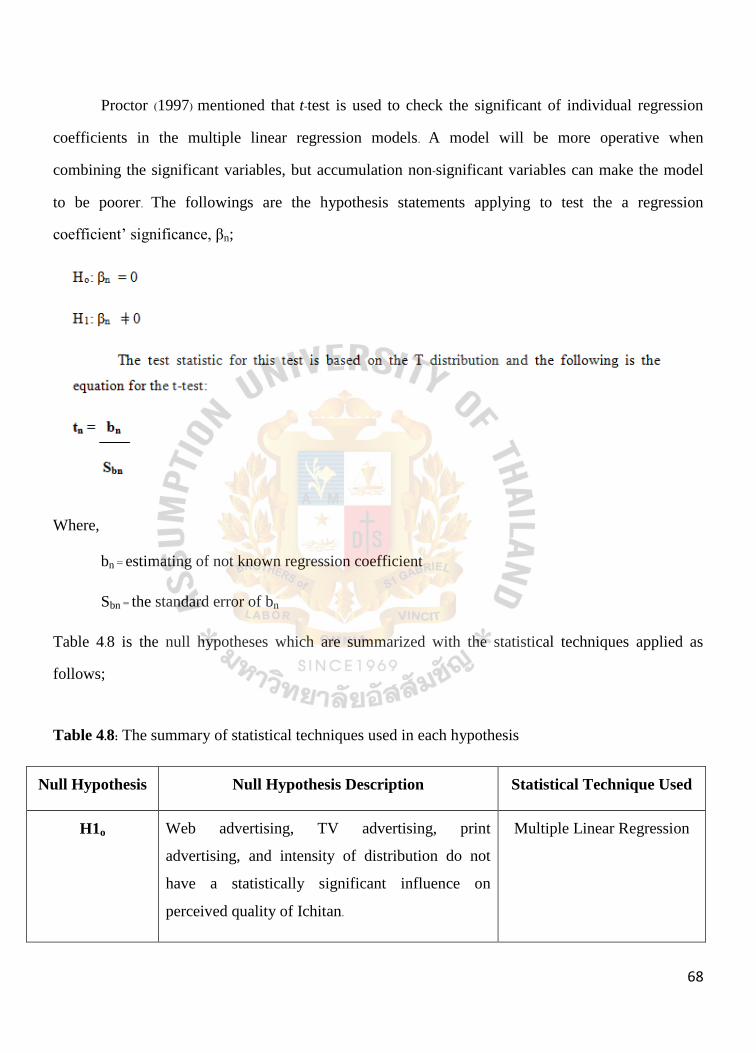
68
Proctor (1997) mentioned that t-test is used to check the significant of individual regression
coefficients in the multiple linear regression models. A model will be more operative when
combining the significant variables, but accumulation non-significant variables can make the model
to be poorer. The followings are the hypothesis statements applying to test the a regression
coefficient’ significance, βn;
Where,
bn = estimating of not known regression coefficient
Sbn = the standard error of bn
Table 4.8 is the null hypotheses which are summarized with the statistical techniques applied as
follows;
Table 4.8: The summary of statistical techniques used in each hypothesis
Null Hypothesis Null Hypothesis Description Statistical Technique Used
H1o
Web advertising, TV advertising, print
advertising, and intensity of distribution do not
have a statistically significant influence on
perceived quality of Ichitan.
Multiple Linear Regression

69
H2o Web advertising, TV advertising, and print
advertising do not have a statistically significant
influence on brand awareness of Ichitan.
Multiple Linear Regression
H3o Web advertising, TV advertising, print advertising
and intensity of distribution do not have a
statistically significant influence on brand
association of Ichitan.
Multiple Linear Regression
H4o Perceived quality, brand awareness and brand
association do not have a statistically significant
influence on repurchase intention of Ichitan.
Multiple Linear Regression

70
Chapter 5
PRESENTATION OF DATA AND CRITICAL DISCUSSION OF RESULTS
This chapter shows the results from data analysis and the interpretation of all gathered data. The
analysis of the collected data uses the statistical software program. This chapter is divided into three
main parts; the first part of this chapter is a descriptive analysis of the general data of the respondents
(gender, marital status, age, personal income and education level) and eight variables that are applied in
this study through the use of descriptive statistics; the second part is the reliability testing of all the
variables and the last part is inferential analysis: hypothesis testing of all hypotheses applied in this
study.
5.1 Descriptive Analysis
In this part, the descriptive statistical method was used to summarize the data in this study.
Berenson and Levine (1996) explained that the collecting, presenting and characterization of a set of
data which are included in the descriptive analysis method was used to illustrate the various features of
the data. Zikmund (2003), stated that to summarize the data normally is the combined form of the
calculation of the average, frequency distribution and percentage distribution.The researcher presented
two sections of descriptive analysis which are descriptive analysis of the demographic factors; gender,
marital status, age, personal income and education level, and the second section is descriptive analysis
of the dependent and independent variables; repurchase intention, brand awareness, perceived quality,
brand association, web advertising, TV advertising, print advertising and the intensity of distribution.

71
5.1.1 Frequency of Demographic characteristics
5.1.1.1 Gender
Table 5.1: The analysis of gender levels using frequency and percentage
Figure 5.1: The analysis of gender levels using frequency and percentage
Table 5.1 and Figure 5.1 demonstrate the frequency and percentage of the respondents’ category
based on gender among 400 respondents in this study which indicated that the highest percentage of the
respondents is females, shown as 50.3% (201 respondents), while the percentage of males is 49.8% (199
respondents).
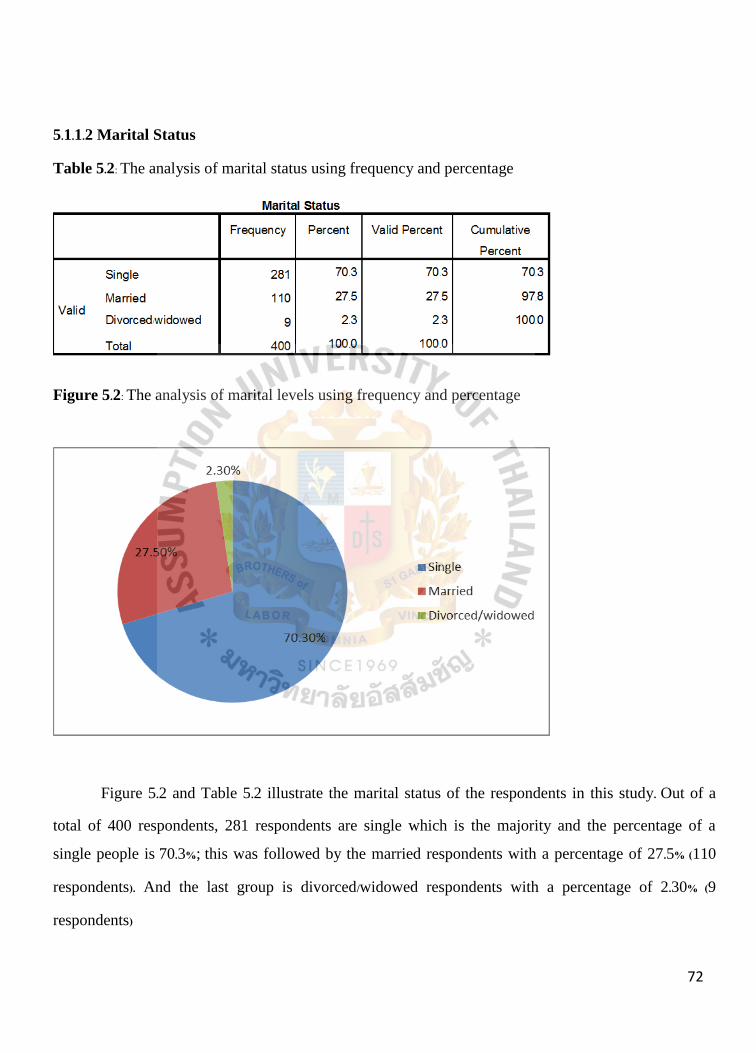
72
5.1.1.2 Marital Status
Table 5.2: The analysis of marital status using frequency and percentage
Figure 5.2: The analysis of marital levels using frequency and percentage
Figure 5.2 and Table 5.2 illustrate the marital status of the respondents in this study. Out of a
total of 400 respondents, 281 respondents are single which is the majority and the percentage of a
single people is 70.3%; this was followed by the married respondents with a percentage of 27.5% (110
respondents). And the last group is divorced/widowed respondents with a percentage of 2.30% (9
respondents)
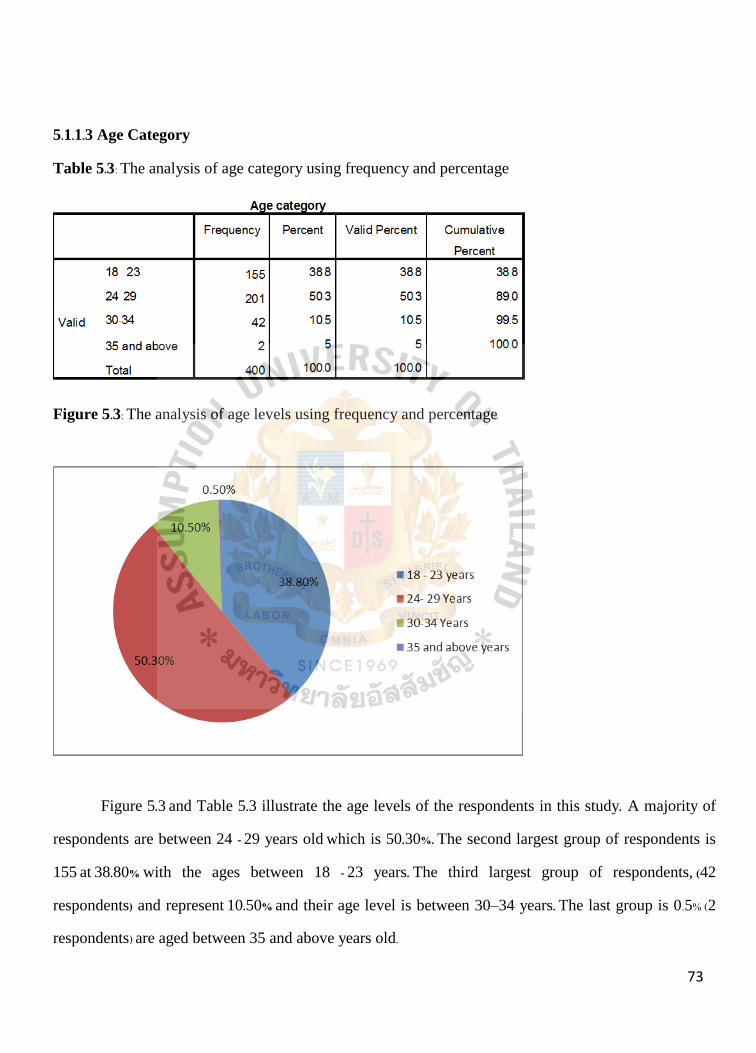
73
5.1.1.3 Age Category
Table 5.3: The analysis of age category using frequency and percentage
Figure 5.3: The analysis of age levels using frequency and percentage
Figure 5.3 and Table 5.3 illustrate the age levels of the respondents in this study. A majority of
respondents are between 24 - 29 years old which is 50.30%. The second largest group of respondents is
155 at 38.80% with the ages between 18 - 23 years. The third largest group of respondents, (42
respondents) and represent 10.50% and their age level is between 30–34 years. The last group is 0.5% (2
respondents) are aged between 35 and above years old.

74
5.1.1.4 Personal Income
Table 5.4: The analysis of personal income using frequency and percentage
Figure 5.4: The analysis of income/allowance from parents using frequency and percentage
From Figure 5.4 and Table 5.4, the highest average monthly income is 10,001-20,000 baht and
the result is from 164 respondents who make up about 41.00% of total 400 respondents’ income level
which is followed by a monthly income 20,001- 30,000 baht with 103 respondents which make up
25.80% and the third majority is monthly income is 10000 baht and less with a percentage of 25.30% at
101 respondents. The next group of people with an income range between 30,001-40,000 baht is 24

75
respondents with 6.00% and the last group of people with an income range from 40,001 baht or more is
8 respondents with 2.00%.
5.1.1.5 Educational Level
Figure 5.5: The analysis of education level using frequency and percentage
Figure 5.5 and Table 5.5 show that a majority of the respondent’s education level is bachelor’s
degree with a total of 189 respondents (47.30%), which is followed by master’s degree education, which
is 105 respondents (26.30%), high school graduates or less education with 79 respondents (19.80%) and
doctor’s degree education level respondents with 27 respondents (6.8%) from 400 respondents.

76
Table 5.6: Summary of demographic factors by using frequency and percentage
Variables Frequency (f) Percentage (%)
Gender
- Male
- Female
199
201
49.80
50.30
Marital Status
- Single
- Married
- Divorced/Widowed
281
110
9
70.30
27.50
2.30
Age Level
- 18-23
- 24-29
- 30 – 34
- 35 and above
155
201
42
2
38.80
50.30
10.50
0.50
Monthly Income Level
- 10,000 or less
- 10,001 - 20,000
- 20,001 - 30,000
- 30,001 - 40,000
- 40,001 or more
101
164
103
24
8
25.30
41.00
25.80
6.00
2.00
High Education Level
- High School Graduate or Less
- Bachelor Degree
79
189
105
19.80
47.30

77
- Master Degree
- Doctor Degree
27 26.30
6.80
Total 400 100
5.1.2 Descriptive Analysis of Independent Variable
The researcher evaluated the data for the independent and dependent variables by applying
mean and standard deviation in this section. The outcomes of each variable will be illustrated in the
tables below.
Table 5.7: The analysis of Web advertising by using mean and standard deviation
From Table 5.7, the highest mean is equal to 3.36 “The web advertisements for Ichitan’s brand
are seen frequently” and the lowest mean is equal to 3.30 “Ichitan’s brand is intensively advertised on
social networking websites”. The highest standard deviation is equal to 0.929 “Ichitan’s brand is
intensively advertised on social networking websites” and the lowest standard deviation is equal to
0.804 “Ichitan’s brand spends a great amount of money in web advertising”.
Descriptive Statistics
Mean Std. Deviation N
Ichitan’s brand is intensively advertised
on social networking websites. 3.30 .929 400
The web advertisements for Ichitan’s
brand are seen frequently. 3.36 .841 400
Ichitan’s brand spends a great amount of
money on web advertising. 3.33 .804 400
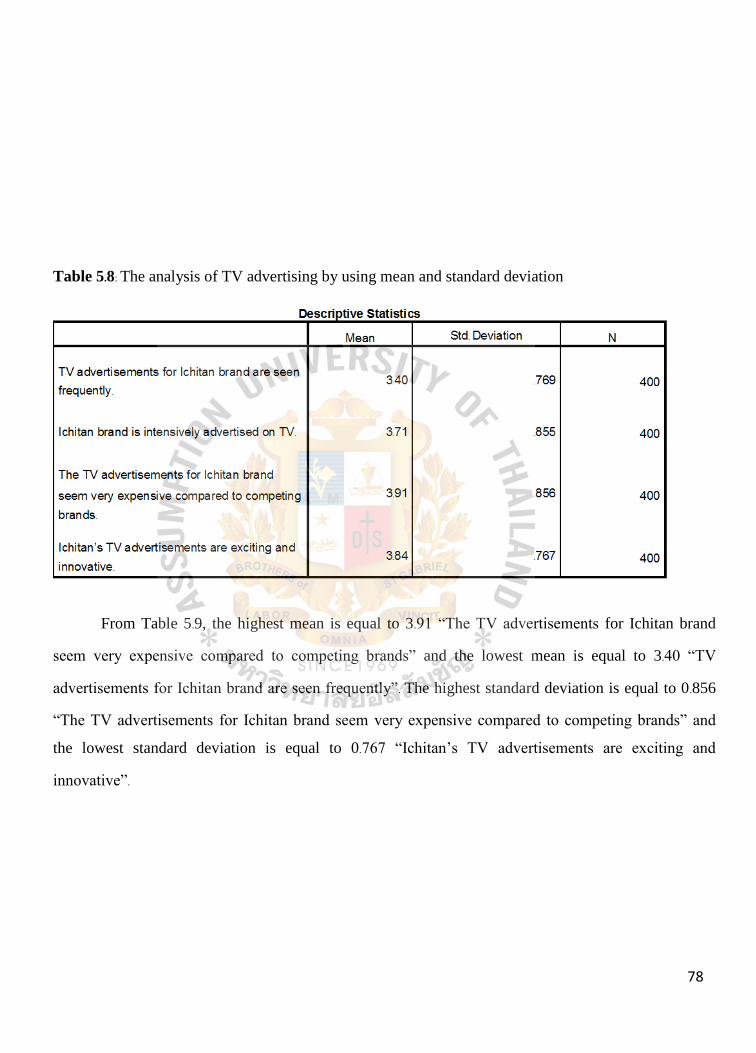
78
Table 5.8: The analysis of TV advertising by using mean and standard deviation
From Table 5.9, the highest mean is equal to 3.91 “The TV advertisements for Ichitan brand
seem very expensive compared to competing brands” and the lowest mean is equal to 3.40 “TV
advertisements for Ichitan brand are seen frequently”. The highest standard deviation is equal to 0.856
“The TV advertisements for Ichitan brand seem very expensive compared to competing brands” and
the lowest standard deviation is equal to 0.767 “Ichitan’s TV advertisements are exciting and
innovative”.
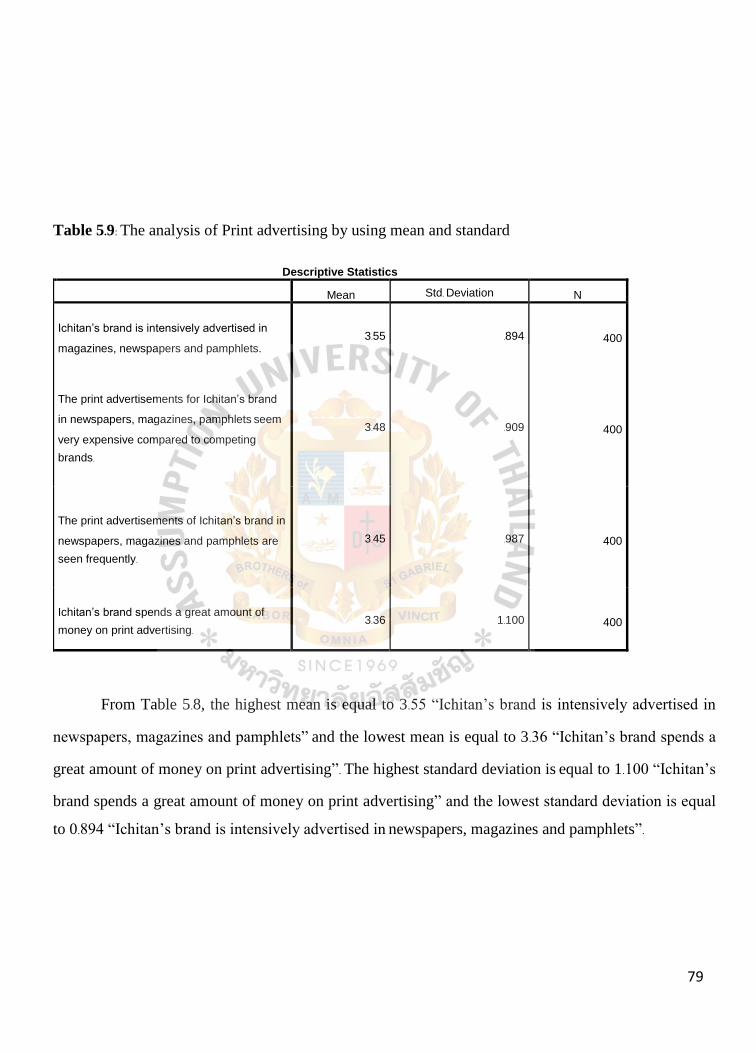
79
Table 5.9: The analysis of Print advertising by using mean and standard
From Table 5.8, the highest mean is equal to 3.55 “Ichitan’s brand is intensively advertised in
newspapers, magazines and pamphlets” and the lowest mean is equal to 3.36 “Ichitan’s brand spends a
great amount of money on print advertising”. The highest standard deviation is equal to 1.100 “Ichitan’s
brand spends a great amount of money on print advertising” and the lowest standard deviation is equal
to 0.894 “Ichitan’s brand is intensively advertised in newspapers, magazines and pamphlets”.
Table 5.8: The analysis of print advertising by using mean and standard deviation
Descriptive Statistics
Mean Std. Deviation N
Ichitan’s brand is intensively advertised in
magazines, newspapers and pamphlets. 3.55 .894 400
The print advertisements for Ichitan’s brand
in newspapers, magazines, pamphlets seem
very expensive compared to competing
brands.
3.48 .909 400
The print advertisements of Ichitan’s brand in
newspapers, magazines and pamphlets are
seen frequently.
3.45 .987 400
Ichitan’s brand spends a great amount of
money on print advertising. 3.36 1.100 400
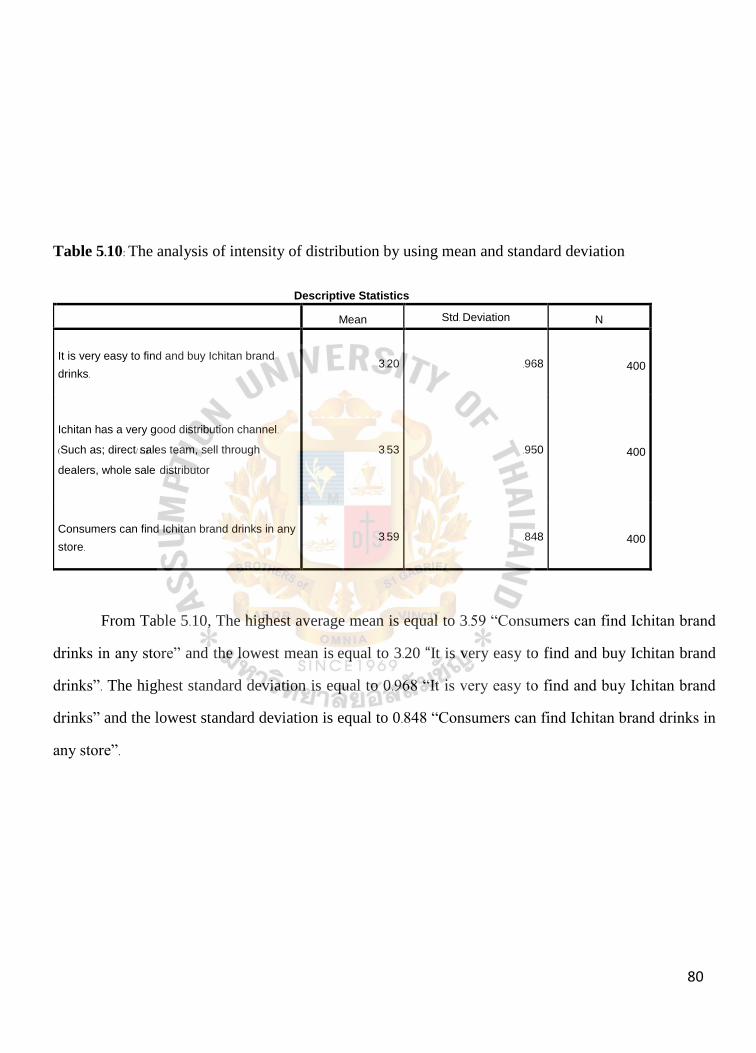
80
Table 5.10: The analysis of intensity of distribution by using mean and standard deviation
From Table 5.10, The highest average mean is equal to 3.59 “Consumers can find Ichitan brand
drinks in any store” and the lowest mean is equal to 3.20 “It is very easy to find and buy Ichitan brand
drinks”. The highest standard deviation is equal to 0.968 “It is very easy to find and buy Ichitan brand
drinks” and the lowest standard deviation is equal to 0.848 “Consumers can find Ichitan brand drinks in
any store”.
Descriptive Statistics
Mean Std. Deviation N
It is very easy to find and buy Ichitan brand
drinks. 3.20 .968 400
Ichitan has a very good distribution channel.
(Such as; direct sales team, sell through
dealers, whole sale distributor
/ / .)
3.53 .950 400
Consumers can find Ichitan brand drinks in any
store. 3.59 .848 400
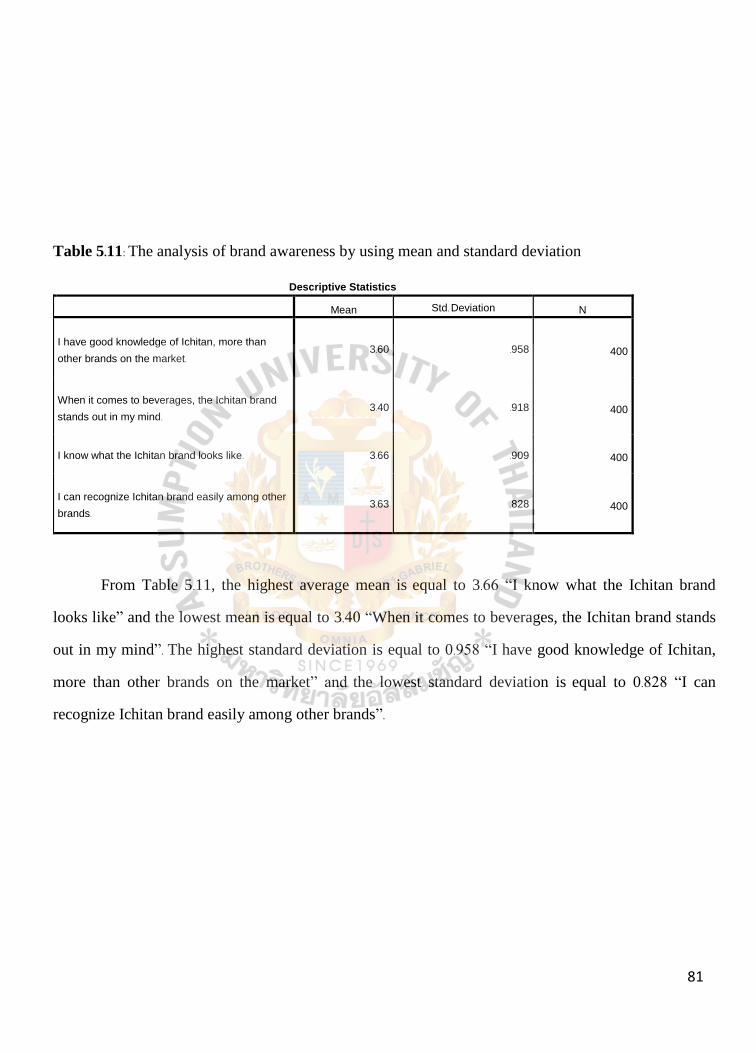
81
Table 5.11: The analysis of brand awareness by using mean and standard deviation
From Table 5.11, the highest average mean is equal to 3.66 “I know what the Ichitan brand
looks like” and the lowest mean is equal to 3.40 “When it comes to beverages, the Ichitan brand stands
out in my mind”. The highest standard deviation is equal to 0.958 “I have good knowledge of Ichitan,
more than other brands on the market” and the lowest standard deviation is equal to 0.828 “I can
recognize Ichitan brand easily among other brands”.
Descriptive Statistics
Mean Std. Deviation N
I have good knowledge of Ichitan, more than
other brands on the market. 3.60 .958 400
When it comes to beverages, the Ichitan brand
stands out in my mind. 3.40 .918 400
I know what the Ichitan brand looks like. 3.66 .909 400
I can recognize Ichitan brand easily among other
brands. 3.63 .828 400

82
Table 5.12: The analysis of perceived quality by using mean and standard deviation
From Table 5.12, the highest mean is equal to 3.23 “The Ichitan brand is associated with very
high quality products” and the lowest mean is equal to 2.79 “I trust the quality of products from the
Ichitan brand”. The highest standard deviation is equal to 1.369 “The Ichitan brand offer product of
consistent quality” and the lowest standard deviation is equal to 1.152 “The Ichitan brand is associated
with very high quality products”.
Descriptive Statistics
Mean Std. Deviation N
The Ichitan brand is associated with very
high quality products. 3.23 1.152 400
The Ichitan brand offer products of
consistent quality. 2.93 1.369 400
I trust the quality of products from the
Ichitan brand. 2.79 1.322 400
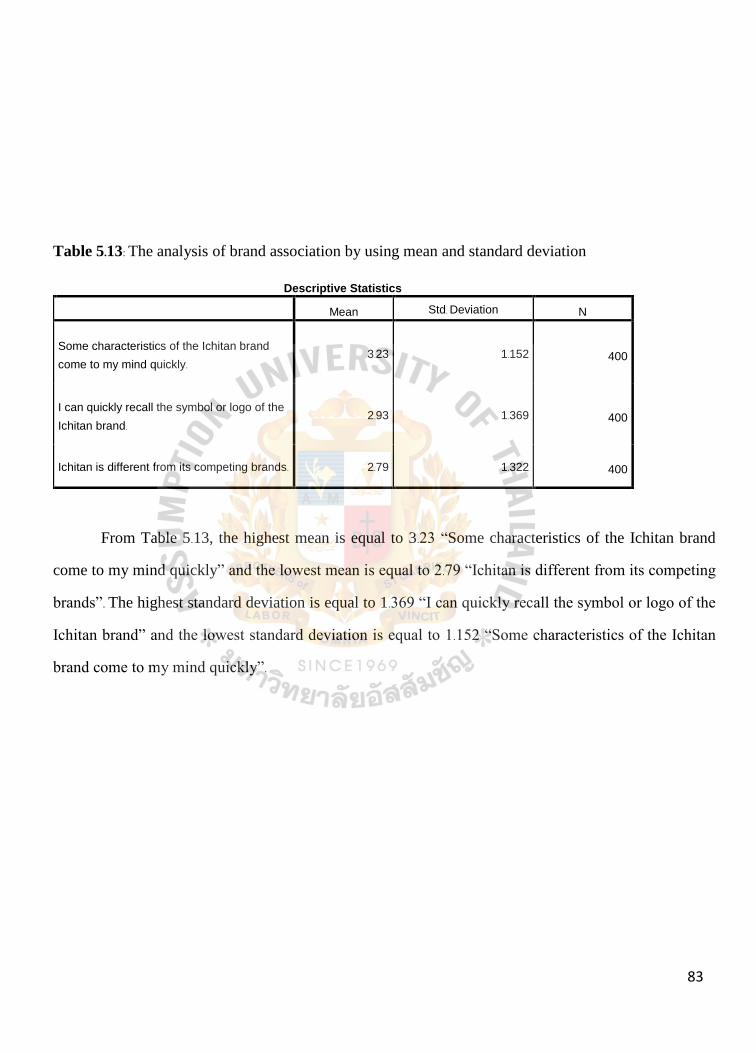
83
Table 5.13: The analysis of brand association by using mean and standard deviation
From Table 5.13, the highest mean is equal to 3.23 “Some characteristics of the Ichitan brand
come to my mind quickly” and the lowest mean is equal to 2.79 “Ichitan is different from its competing
brands”. The highest standard deviation is equal to 1.369 “I can quickly recall the symbol or logo of the
Ichitan brand” and the lowest standard deviation is equal to 1.152 “Some characteristics of the Ichitan
brand come to my mind quickly”.
Descriptive Statistics
Mean Std. Deviation N
Some characteristics of the Ichitan brand
come to my mind quickly. 3.23 1.152 400
I can quickly recall the symbol or logo of the
Ichitan brand. 2.93 1.369 400
Ichitan is different from its competing brands. 2.79 1.322 400

84
Table 5.14: The analysis of repurchase intention by using mean and standard deviation
From Table 5.14, the highest mean is equal to 3.59. “I am always interested in new products
from ichitan brand and would like to try them in the future” and the lowest mean is equal to 3.20. “I
would feel pleasure about my purchase, if I buy an ichitan brand drink again”. The highest standard
deviation is equal to 0.968. “I would feel pleasure about my purchase, if I buy an ichitan brand drink
again” and the lowest standard deviation is equal to 0.848 “I am always interested in new products from
ichitan brand and would like to try them in the future”.
Descriptive Statistics
Mean Std. Deviation N
I would feel pleasure about my purchase, if I
buy an ichitan branded drink again.
3.20 .968 400
The Ichitan brand drink satisfied me and I
would like to buy it again in the future. 3.53 .950 400
I am always interested in new products from
ichitan brand and would like to try them in the
future.
3.59 .848 400
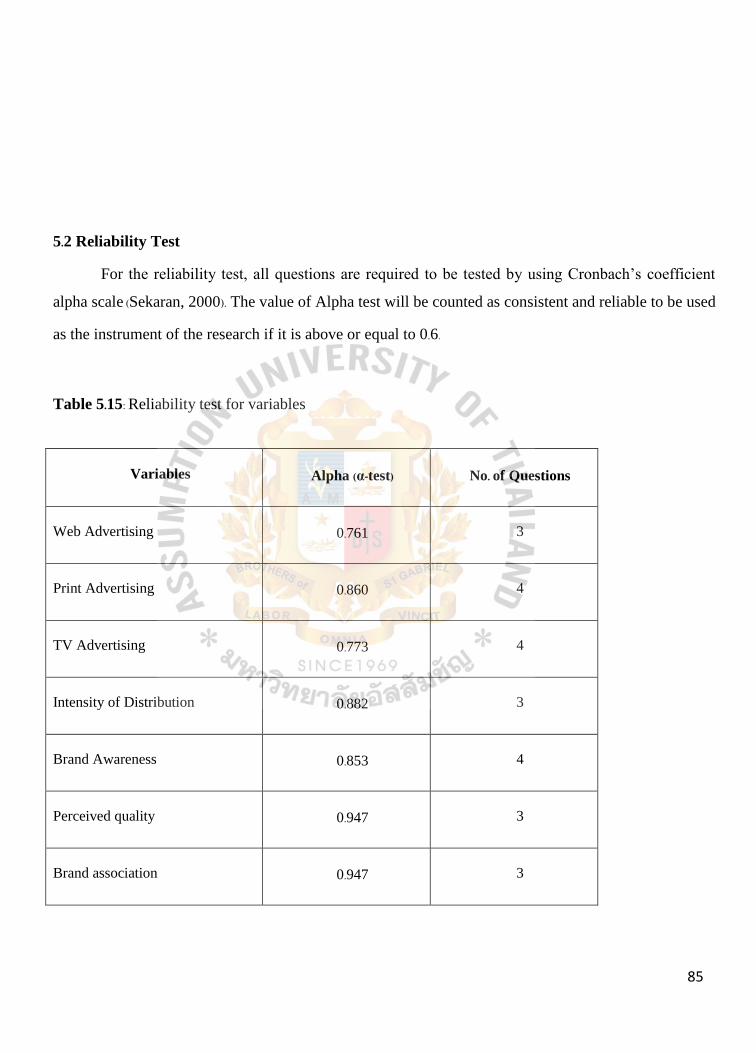
85
5.2 Reliability Test
For the reliability test, all questions are required to be tested by using Cronbach’s coefficient
alpha scale (Sekaran, 2000). The value of Alpha test will be counted as consistent and reliable to be used
as the instrument of the research if it is above or equal to 0.6.
Table 5.15: Reliability test for variables
Variables Alpha (α-test) No. of Questions
Web Advertising 0.761 3
Print Advertising 0.860 4
TV Advertising 0.773 4
Intensity of Distribution 0.882 3
Brand Awareness 0.853 4
Perceived quality 0.947 3
Brand association 0.947 3

86
Repurchase Intention 0.882 3
Total 34
The reliability analysis values in Table 5.15were tested with Cronbach’s coefficient alpha scale
and all showed the higher value than 0.60 which means all questions are reliable and suitable to be used
as the research instrument for this study.
5.3 Inferential Analysis
William (2002) stated that inferential statistics is applied to make a generalization from the
sample to the population and to test the hypothesis. The researcher determined to test the hypotheses by
applying multiple linear regression analysis, to test their statistical significance by using t-statistics, and
f-statistics.
5.3.1 The Results of Hypotheses Testing
Hypothesis 1
H1o: Web advertising, TV advertising, print advertising, and intensity of distribution do not have a
statistically significant influence on perceived quality of Ichitan.
H1a: Web advertising, TV advertising, print advertising, and intensity of distribution have a statistically
significant influence on perceived quality of Ichitan.
The results of Multiple Regression Analysis, which basically were combined with the ANOVA
table, summary of the coefficients and a regression model summary are as follows;
Table 5.16: ANOVA results for intensity of distribution, web advertising, print adverting, TV
advertising and perceived quality
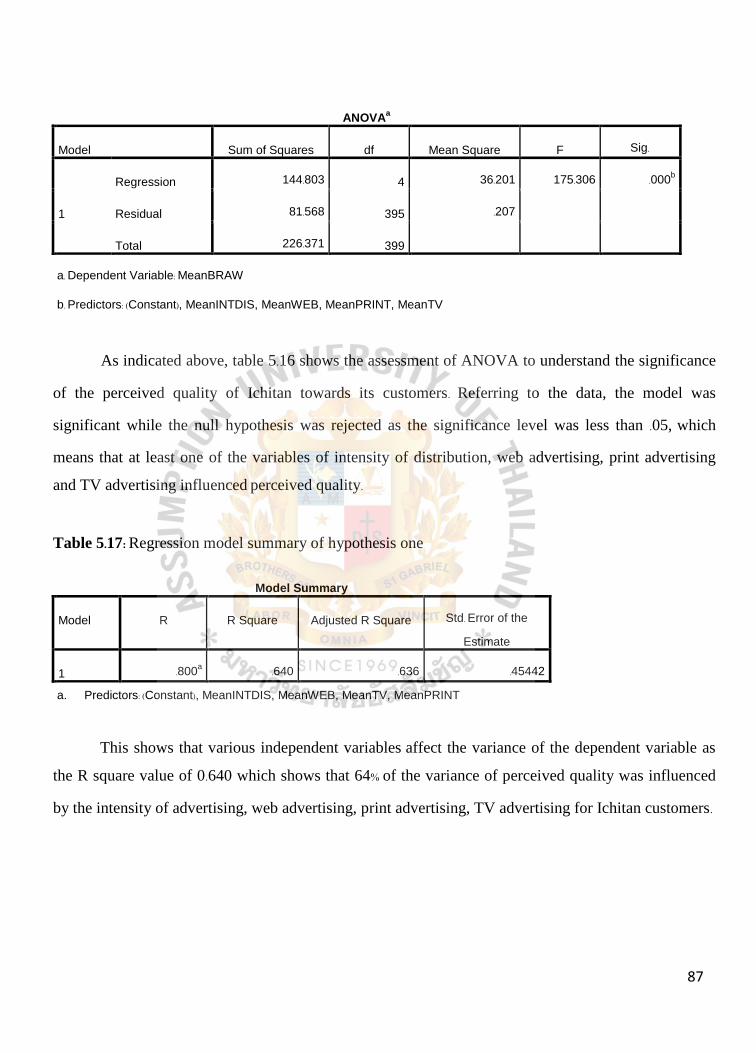
87
ANOVAa
Model Sum of Squares df Mean Square F Sig.
1
Regression 144.803 4 36.201 175.306 .000b
Residual 81.568 395 .207
Total 226.371 399
a. Dependent Variable: MeanBRAW
b. Predictors: (Constant), MeanINTDIS, MeanWEB, MeanPRINT, MeanTV
As indicated above, table 5.16 shows the assessment of ANOVA to understand the significance
of the perceived quality of Ichitan towards its customers. Referring to the data, the model was
significant while the null hypothesis was rejected as the significance level was less than .05, which
means that at least one of the variables of intensity of distribution, web advertising, print advertising
and TV advertising influenced perceived quality.
Table 5.17: Regression model summary of hypothesis one
Model Summary
Model R R Square Adjusted R Square Std. Error of the
Estimate
1 .800a .640 .636 .45442
a. Predictors: (Constant), MeanINTDIS, MeanWEB, MeanTV, MeanPRINT
This shows that various independent variables affect the variance of the dependent variable as
the R square value of 0.640 which shows that 64% of the variance of perceived quality was influenced
by the intensity of advertising, web advertising, print advertising, TV advertising for Ichitan customers.

88
Table 5.18: Multiple regression coefficients of perceived quality.
Coefficientsa
Model Unstandardized Coefficients Standardized
Coefficients
t Sig.
B Std. Error Beta
1
(Constant) .272 .146 1.867 .063
MeanWEB .036 .042 .033 .851 .395
MeanTV .223 .050 .186 4.513 .000
MeanPRINT .178 .035 .194 5.094 .000
MeanINTDIS .505 .033 .556 15.378 .000
a. Dependent Variable: MeanPERQ
The coefficients for TV advertising, print advertising and the intensity of distribution yielded
the same significant levels of .000 which means that the following variables: TV advertising, print
advertising and the intensity of distribution significantly influenced the perceived quality of Ichitan.
However, the coefficients for web advertising yielded a significant level greater than .05(.395>.05)
which did not significantly affect the perceived quality of Ichitan. Also, the beta from the
unstandardized coefficients of TV advertising, print advertising and the intensity of distribution are
equal to .223, .178, .505 and the constant is equal to .272 as shown in the formula below:
ŷ = a + b1x1 + b2x2 +b3x3 …..bnxn
ŷ = .272 + .223x1+.178 x2+.505x3

89
Hypothesis 2
H2o: Web advertising, TV advertising, and print advertising do not have a statistically significant
influence on brand awareness of Ichitan.
H2a: Web advertising, TV advertising, and print advertising have a statistically significant influence on
brand awareness of Ichitan.
Table 5.19: ANOVA results for web advertising, TV advertising, print advertising and brand
awareness
ANOVAa
Model Sum of Squares df Mean Square F Sig.
1
Regression 119.501 3 39.834 33.186 .000b
Residual 475.326 396 1.200
Total 594.826 399
a. Dependent Variable: MeanBRAW
b. Predictors: (Constant), MeanWEB, MeanTV, MeanPRINT
As indicated above in table 5.19 this shows the assessment of ANOVA to understand the
significance of brand awareness of Ichitan towards its customers. The significance level was less than
.05(.000<.05) which shows that the null hypothesis was rejected and at least one variable of print
advertising, web advertising and TV advertising influenced brand awareness.
Table 5.20: Regression summary of hypothesis two
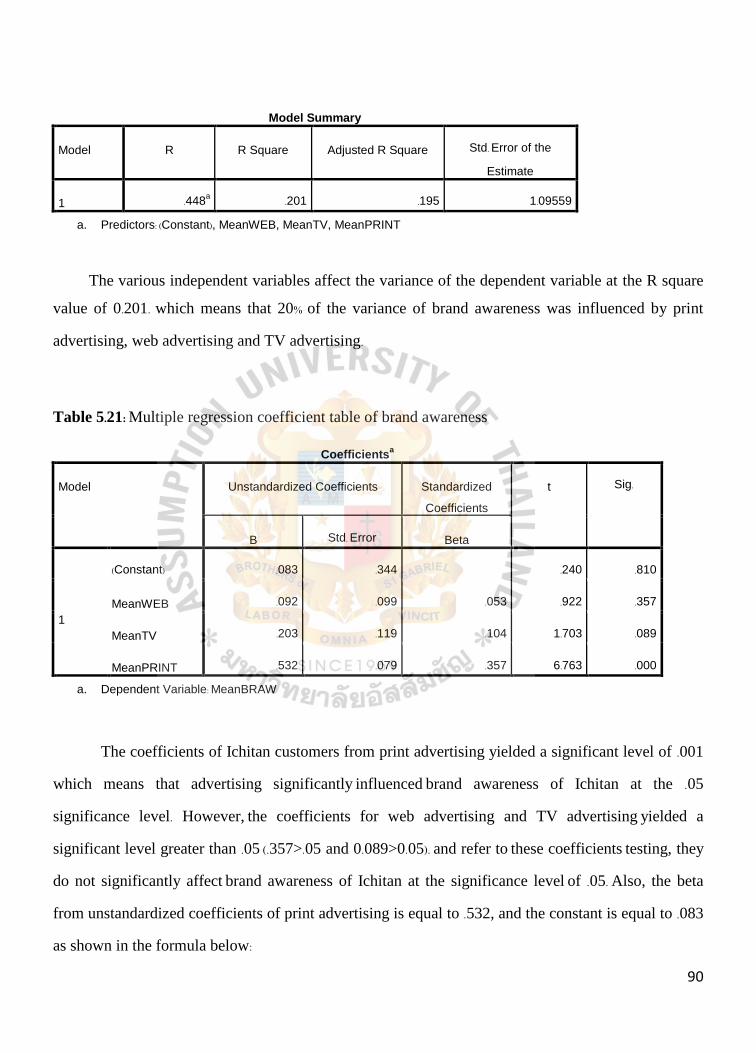
90
Model Summary
Model R R Square Adjusted R Square Std. Error of the
Estimate
1 .448a .201 .195 1.09559
a. Predictors: (Constant), MeanWEB, MeanTV, MeanPRINT
The various independent variables affect the variance of the dependent variable at the R square
value of 0.201. which means that 20% of the variance of brand awareness was influenced by print
advertising, web advertising and TV advertising.
Table 5.21: Multiple regression coefficient table of brand awareness
Coefficientsa
Model Unstandardized Coefficients Standardized
Coefficients
t Sig.
B Std. Error Beta
1
(Constant) .083 .344 .240 .810
MeanWEB .092 .099 .053 .922 .357
MeanTV .203 .119 .104 1.703 .089
MeanPRINT .532 .079 .357 6.763 .000
a. Dependent Variable: MeanBRAW
The coefficients of Ichitan customers from print advertising yielded a significant level of .001
which means that advertising significantly influenced brand awareness of Ichitan at the .05
significance level. However, the coefficients for web advertising and TV advertising yielded a
significant level greater than .05 (.357>.05 and 0.089>0.05). and refer to these coefficients testing, they
do not significantly affect brand awareness of Ichitan at the significance level of .05. Also, the beta
from unstandardized coefficients of print advertising is equal to .532, and the constant is equal to .083
as shown in the formula below:

91
ŷ = a + b1x1 + b2x2 +b3x3 …..bnxn
ŷ = .083 + .532x1
Hypothesis 3
H3o: Web advertising, TV advertising, print advertising and intensity of distribution do not have a
statistically significant influence on brand association of Ichitan.
H3a: Web advertising, TV advertising, print advertising, and intensity of distribution have a
statistically significant influence on brand association of Ichitan.
Table 5.22: ANOVA results for the intensity of distribution, TV advertising, print advertising, web
advertising and brand association
ANOVAa
Model Sum of Squares df Mean Square F Sig.
1
Regression 201.518 4 50.379 50.596 .000b
Residual 393.309 395 .996
Total 594.826 399
a. Dependent Variable: MeanBRAS
b. Predictors: (Constant), MeanINTDIS, MeanWEB, MeanPRINT, MeanTV
As indicated above in table 5.22 this shows that in the assessment of ANOVA to understand
the significance of brand association of Ichitan towards its customers, the null hypothesis was
rejected while the model was significant at the significance level of less than .05. This means that at
least one variable of the intensity of distribution, web advertising, print advertising and TV
advertising influenced brand association.

92
Table 5.23: Regression summary of hypothesis three
Model Summary
Model R R Square Adjusted R Square Std. Error of the
Estimate
1 .582a .339 .332 .99786
a. Predictors: (Constant), MeanINTDIS, MeanWEB, MeanPRINT, MeanTV
The various independent variables affect the variance of the dependent variable at the R
square value of 0.339, which means that 34% of the variance of Brand association was
influenced by the intensity of distribution, web advertising, print advertising and TV
advertising.
Table 5.24: Multiple linear regression table for brand association
Coefficientsa
Model Unstandardized Coefficients Standardized
Coefficients
t Sig.
B Std. Error Beta
1
(Constant) -.508 .320 -1.586 .113
MeanWEB -.046 .092 -.026 -.496 .620
MeanTV .112 .109 .058 1.034 .302
MeanPRINT .281 .077 .189 3.666 .000
MeanINTDIS .654 .072 .445 9.076 .000
a. Dependent Variable: MeanBRAS

93
The coefficient of print advertising and the intensity of distribution yielded a significant level
of .000, which means the variables of print advertising and the intensity of distribution significantly
influenced brand association of Ichitan.However, the coefficients for web advertising and TV
advertising yielded a significant level greater than .05(.620 >.05., 0.302 >0.05.) and therefore these
coefficients do not significantly affect the brand association of Ichitan at the .05 significance
level.Also, the beta from the unstandardized coefficients of print advertising and the intensity of
distribution are equal to .281, .532 and the constant is equal to -.508 as shown in the formula below:
ŷ = a + b1x1 + b2x2 +b3x3 …..bnxn
ŷ = -.508 + .281x1+.654x2
Hypothesis 4
H4o: Perceived quality, brand awareness and brand association do not have a statistically significant
influence on repurchase intention of Ichitan.
H4a: Perceived quality, brand awareness and brand association have a statistically significant
influence on repurchase intention of Ichitan.
Table 5.25: ANOVA results for Perceived quality, brand awareness, brand association and repurchase
intention.
ANOVAa
Model Sum of Squares df Mean Square F Sig.
1
Regression 164.325 3 54.775 159.196 .000b
Residual 136.252 396 .344
Total 300.577 399
a. Dependent Variable: MeanREPI
b. Predictors: (Constant), MeanBRAS, MeanPERQ, MeanBRAW

94
As indicated above in table 5.25, this shows the assessment of ANOVA to understand the
significance of repurchase intention of Ichitan towards its customer. The significance level was less
than .05 (.000<.05) which shows the model was significant and the null hypothesis was rejected. This
means that at least one variable of brand awareness, brand association, perceived quality influenced
repurchase intention.
Table 5.26: Regression summary of hypothesis four
Model Summary
Model R R Square Adjusted R Square Std. Error of the
Estimate
1 .739a .547 .543 .58658
a. Predictors: (Constant), MeanBRAS, MeanPERQ, MeanBRAW
Table 5.27 reveals how the various independent variables affect the variance of
dependent. For Ichitan customers, the R square value is 0.547, which shows that 55% of the
variance of repurchase intention was influenced or explained by perceived quality, brand
awareness and brand association.
Table 5.27: Multiple linear regression table for repurchase intention
Coefficientsa
Model Unstandardized Coefficients Standardized
Coefficients
t Sig.
B Std. Error Beta
1
(Constant) .008 .202 .038 .970
MeanBRAW .808 .067 .618 11.968 .000
MeanPERQ .245 .045 .243 5.456 .000
MeanBRAS -.116 .065 -.085 -1.798 .073
a. Dependent Variable: MeanREPI
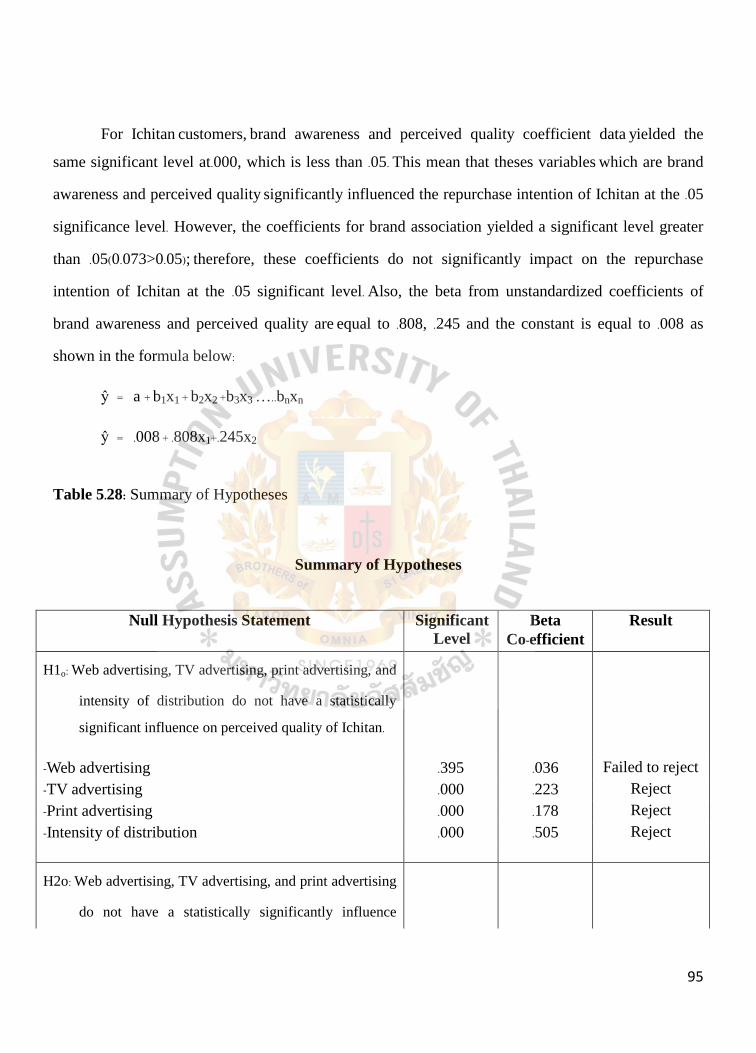
95
For Ichitan customers, brand awareness and perceived quality coefficient data yielded the
same significant level at.000, which is less than .05. This mean that theses variables which are brand
awareness and perceived quality significantly influenced the repurchase intention of Ichitan at the .05
significance level. However, the coefficients for brand association yielded a significant level greater
than .05(0.073>0.05); therefore, these coefficients do not significantly impact on the repurchase
intention of Ichitan at the .05 significant level. Also, the beta from unstandardized coefficients of
brand awareness and perceived quality are equal to .808, .245 and the constant is equal to .008 as
shown in the formula below:
ŷ = a + b1x1 + b2x2 +b3x3 …..bnxn
ŷ = .008 + .808x1+.245x2
Table 5.28: Summary of Hypotheses
Summary of Hypotheses
Null Hypothesis Statement Significant
Level
Beta
Co-efficient
Result
H1o: Web advertising, TV advertising, print advertising, and
intensity of distribution do not have a statistically
significant influence on perceived quality of Ichitan.
-Web advertising .395 .036 Failed to reject
-TV advertising .000 .223 Reject
-Print advertising .000 .178 Reject
-Intensity of distribution .000 .505 Reject
H2o: Web advertising, TV advertising, and print advertising
do not have a statistically significantly influence
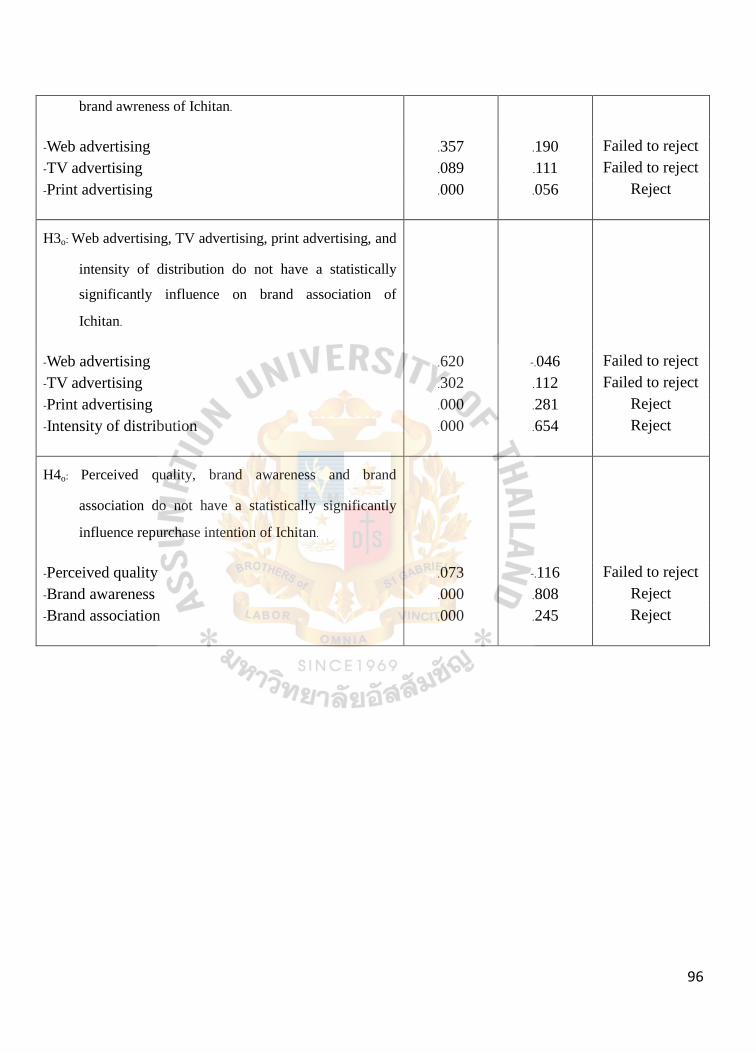
96
brand awreness of Ichitan.
-Web advertising .357 .190 Failed to reject
-TV advertising .089 .111 Failed to reject
-Print advertising .000 .056 Reject
H3o: Web advertising, TV advertising, print advertising, and
intensity of distribution do not have a statistically
significantly influence on brand association of
Ichitan.
-Web advertising .620 -.046 Failed to reject
-TV advertising .302 .112 Failed to reject
-Print advertising .000 .281 Reject
-Intensity of distribution .000 .654 Reject
H4o: Perceived quality, brand awareness and brand
association do not have a statistically significantly
influence repurchase intention of Ichitan.
-Perceived quality .073 -.116 Failed to reject
-Brand awareness .000 .808 Reject
-Brand association .000 .245 Reject

97
Chapter 6
SUMMARY, IMPLICATIONS, RECOMMENDATION, AND CONCLUSIONS
This chapter provides a summary, implications, recommendations and conclusion based on
the results of this study, which contained five main sections by using the primary data from previous
chapters. The first section is a summary of the demographic factors included in the hypotheses testing.
The second section provides the discussion and implications. The third section is the conclusion of
this research followed, by the forth which is recommendations and some suggestions for further
research in the last section. The results of these five sections are presented as follows;
6.1.1 Summary of Demographic Factors
The researcher applied 400 samples of primary data collected from 8shopping malls in
Bangkok, Thailand. The researcher collected these data during September and October of 2016.
According to the results of this study, a majority of the respondents are female at 50.30%, with single
marital status (70.30%), aged between 24 - 29 years old (50.30%) with a monthly income between 10,000
– 20000 baht (41.00%) and most have a bachelor’s degree at 47.30%.
Table 6.1: Summary of demographic factors analysis
Demographics Factors Characteristics Frequency (f) Percentage (%)
Gender Female 201 50.30%
Marital Status Single 281 70.30%
Age 24 – 29 201 50.30%
Monthly income 10,000 - 20000 164 41.00%
Highest Education Level Bachelor Degree 189 47.30%

98
6.1.2 Summary of Hypotheses Testing
According to the research objectives, four hypotheses were developed for testing the
relationship between the variables. In addition, multiple linear regression analysis was used in this
study in order to analyze data. The result of the study shows that all null hypotheses were rejected
because the significant values are .000, which is less than 0.05 at the confidence level of 95 percent.
Therefore, all variables were considered as they had a positive relationship with each other. The
results for all four hypotheses are summarized as follows:
Hypothesis 1: TV advertising, print advertising and intensity of distribution have a statistically
significant influence on perceived quality of Ichitan brand at .000. Except web
advertising, which did not have a statistically significant influence on the perceived
quality of Ichitan brand at .395 of significant level.
Hypothesis 2: Print advertising has a statistically significant influence on brand awareness of Ichitan
brand at .000. However, TV advertising and web advertising do not have a statistically
significant influence on the brand awareness of Ichitan brand at .089 and .357 of
significant level.
Hypothesis 3: Print advertising and intensity of distribution have a statistically significant influence
on the brand association of Ichitan brand at .000. Except TV advertising and web
advertising do not have a statistically significant influence on brand association at .302
and .620 of significant level.

99
Hypothesis 4: Brand association and brand awareness have a statistically significant influence on the
repurchase intention of Ichitan brand at .000. Except perceived quality did not have a
statistically significant influence on repurchase intention at .073 of significant level.
Figure 6.1: Summary of the results of hypotheses testing
Based on Figure 6.1, most variables from hypothesis1 – hypothesis4 were significant, except
the first hypothesis; only web advertising was not significant. The second hypothesis; web advertising
and TV advertising were not significant. the third hypothesis; web advertising and TV advertising
were not significant and in the last hypothesis; only perceived quality was not significant.
6.2 Discussion and Implications
The researcher studied about the factors influencing repurchase intention of Ichitan in
Bangkok, Thailand and collected data from respondents who have drank Ichitan brand drinks. The
researcher collected the data from eight shopping malls in Bangkok, Thailand during September and
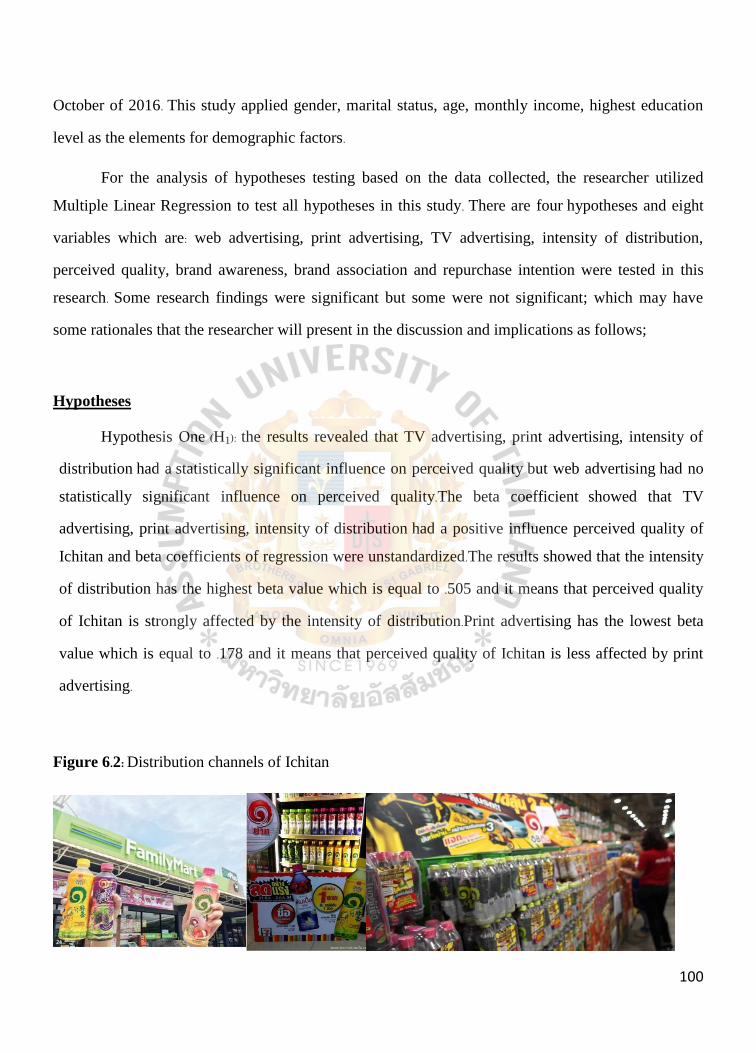
100
October of 2016. This study applied gender, marital status, age, monthly income, highest education
level as the elements for demographic factors.
For the analysis of hypotheses testing based on the data collected, the researcher utilized
Multiple Linear Regression to test all hypotheses in this study. There are four hypotheses and eight
variables which are: web advertising, print advertising, TV advertising, intensity of distribution,
perceived quality, brand awareness, brand association and repurchase intention were tested in this
research. Some research findings were significant but some were not significant; which may have
some rationales that the researcher will present in the discussion and implications as follows;
Hypotheses
Hypothesis One (H1): the results revealed that TV advertising, print advertising, intensity of
distribution had a statistically significant influence on perceived quality but web advertising had no
statistically significant influence on perceived quality.The beta coefficient showed that TV
advertising, print advertising, intensity of distribution had a positive influence perceived quality of
Ichitan and beta coefficients of regression were unstandardized.The results showed that the intensity
of distribution has the highest beta value which is equal to .505 and it means that perceived quality
of Ichitan is strongly affected by the intensity of distribution.Print advertising has the lowest beta
value which is equal to .178 and it means that perceived quality of Ichitan is less affected by print
advertising.
Figure 6.2: Distribution channels of Ichitan
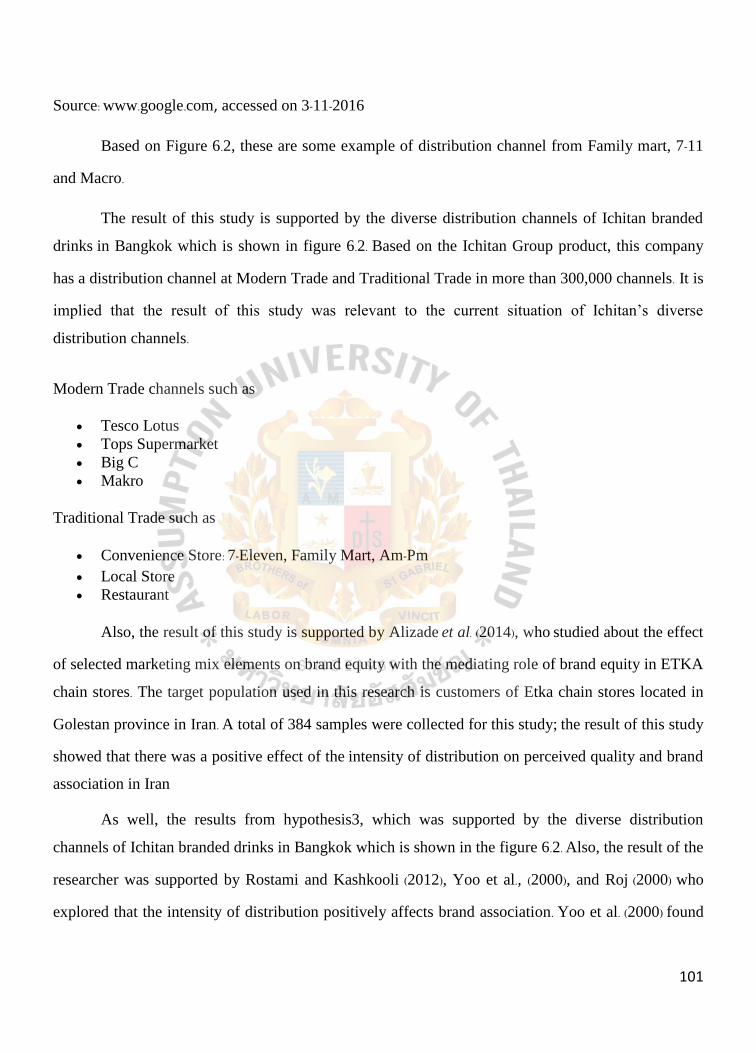
101
Source: www.google.com, accessed on 3-11-2016
Based on Figure 6.2, these are some example of distribution channel from Family mart, 7-11
and Macro.
The result of this study is supported by the diverse distribution channels of Ichitan branded
drinks in Bangkok which is shown in figure 6.2. Based on the Ichitan Group product, this company
has a distribution channel at Modern Trade and Traditional Trade in more than 300,000 channels. It is
implied that the result of this study was relevant to the current situation of Ichitan’s diverse
distribution channels.
Modern Trade channels such as
Tesco Lotus
Tops Supermarket
Big C
Makro
Traditional Trade such as
Convenience Store: 7-Eleven, Family Mart, Am-Pm
Local Store
Restaurant
Also, the result of this study is supported by Alizade et al. (2014), who studied about the effect
of selected marketing mix elements on brand equity with the mediating role of brand equity in ETKA
chain stores. The target population used in this research is customers of Etka chain stores located in
Golestan province in Iran. A total of 384 samples were collected for this study; the result of this study
showed that there was a positive effect of the intensity of distribution on perceived quality and brand
association in Iran
As well, the results from hypothesis3, which was supported by the diverse distribution
channels of Ichitan branded drinks in Bangkok which is shown in the figure 6.2. Also, the result of the
researcher was supported by Rostami and Kashkooli (2012), Yoo et al., (2000), and Roj (2000) who
explored that the intensity of distribution positively affects brand association. Yoo et al. (2000) found

102
that “distribution is intensive when products are placed in a large number of stores to cover the
market.” and also stated that brand association can be increased by distribution intensity.
Hypothesis Two (H2): The result revealed that print advertising influences brand awareness,
but web advertising and TV advertising do not influence brand awareness. Based on the result, as the
Ichitan Group focuses on print advertising to be its major form of advertising, the company paid 149
million baht in 2013 (source; http://www.fareastddb.com/buzz/?p=18549) also, the company installed
print advertising in many famous places in Bangkok.
Figure 6.3: Print advertising of Ichitan
Source: www.google.com, accessed on 3-11-2016

103
As the company mainly focuses on building brand awareness as shows in Figure 6.3, then the
researcher can conclude that print advertising works well, which can be seen from the results of this
study.
The researcher’s results are supported by print advertising for Ichitan in Figure 6.3. The above
advertisement is a print advertisement for Ichitan which can be seen in many shopping malls or
famous destinations in Bangkok. The advertisement mainly focuses on building brand awareness of
Ichitan among its segment market.
The study of Tong and Hawley (2009), who studied about the relationship between brand
equity creating and the effectiveness of eight chosen marketing campaigns in the clothing market of
China, also supported this result which showed that there is a positive effect of print advertising on
brand awareness as well.
As well as the result from hypothesis3, print advertising influenced brand awareness as the
company focuses on print advertising. So, it influences both brand awareness and brand association.
Based on brand association, the result of the researcher was supported by Tong and Hawley
(2009), who studied about brand equity of the Chinese clothing market and the researcher found that
web advertising, print advertising, and TV advertising are positively related with brand association.
And the result of hypothesis4, brand awareness and brand association significantly influence
repurchase intention, but perceived quality does not significantly influence repurchase intention. This
result is based on the result from hypothesis2 and hypothesis3 as print advertising influences brand
awareness and brand association, then it further reflects on customer repurchase intention. Also, the
researcher found that brand awareness was the bigger influence on repurchase intention, more than
brand association as one can see from data standardize that brand awareness has data equal to .808
and brand association has data equal to .245.
The result is supported by Pradhita (2014), who studied about the relationship between brand
awareness, brand loyalty, and perceived quality towards repurchase intention of Ready to Drink

104
(RTD) coffee customers in Malang city in Indonesia. The researcher found that there is an impact on
repurchase intention from brand association and brand awareness.
6.3 Conclusion
This study was conducted to understand the factors which are intended to affect the
repurchase intention of Ichitan.The influencing factors which are considered in the study are:
marketing factors such as the intensity of distribution, print, web and TV advertising, brand
awareness, brand association and perceived quality. A structured statistical model was implemented
to study the relationships among them. The summary below explains the conclusion to this research.
The results implied from analyzing the demographic factors of this research are: a majority
number of the Ichitan customers were female, aged between 24-29 years, single and most of them
have a bachelor’s degree with an income of 10000 – 20000 baht per month. It shows that Ichitan
customers are mainly young people whose needs and wants are the first priority focus to analyze and
pay more attention to build their satisfaction which may bring positive repurchase intention to them
as well. The researcher investigated four hypotheses using Multiple Linear Regression to understand
the relationship between the variables.
From analyzing the results from hypothesis number one, the researcher deduced that the
intensity of distribution, print, and TV advertising have a statistically significant impact on perceived
quality. But, web advertising has no statistically significant impact on creating the perceived quality
of product brand. In consideration of the value of the un-standard beta coefficient, it is clear that the
intensity of distribution, print advertising, TV advertising, and the intensity of distribution have a
significantly positive impact on creating the perceived quality of Ichitan. However, the recorded un-
standardized beta value of Intensity of distribution is considered the highest which implies that the
perceived quality of Ichitan is very much affected by its intensity of distribution and print advertising
has recorded the least beta value. Also, hypothesis3 found that the intensity of distribution has a
statistically significant effect on brand association, which means it affects the brand association of
Ichitan as well.

105
By analyzing the result from hypothesis number two, the researcher deduced that print
advertising has a statistically significant impact on building brand awareness. But, advertising on the
web and TV advertising has no statistically significant impact on building brand awareness. In
consideration of the value of the un-standard beta coefficient, the researcher implied that opting to
advertise via print media will have a positive influence on building brand awareness of the Ichitan
brand. Only the beta value of the variable “print advertising” affects brand awareness, which means it
affects the brand awareness of Ichitan.Also, hypothesis3 found that print advertising has a statistically
significant effect on brand association, which means it affects the brand association of Ichitan as well.
From analyzing the result from hypothesis number four, the researcher deduced that, the
brand’s awareness and its association will have a statistically positive significant impact on
enhancing the intention to repurchase. But, the result also indicated that perceived quality has no
influencing factor on repurchase intention. In consideration of the value of the un-standard beta
coefficient, the researcher found that brand awareness and its association have a very strong positive
impact on enhancing the intention to repurchase towards Ichitan. The recorded un-standardized beta
value of brand awareness is the highest, which shows that the intention to repurchase Ichitan is mostly
affected by it.
By better understanding marketing activities and their effects on perceived quality, brand
awareness, brand association and repurchase intention it will be helpful for Ichitan in approaching
their segment market in the right channel. Ichitan marketers should be able to employ more effective
marketing and advertising strategies in building repurchase intention from customers. With a higher
Intensity of distribution, print advertising and brand awareness there will be a positive repurchase
intention for Ichitan from its customers.
6.4 Recommendations
The findings of this study can give a competitive edge to all marketers and managers who are
working for beverage brands in Thailand. The results of this study not only help to understand the
influencing factors on repurchase intention but also can play a vital role to develop marketing

106
activities, marketing budget allocation and the content of marketing to achieve brand awareness,
brand association and perceived quality towards beverage brands in Thailand. Using data analysis, the
researcher would like to suggest some insights and recommendations for the marketers who are
involved in the beverage industry:
From the result of hypothesis number one: the intensity of distribution, print advertising and
TV advertising has a statistically significant positive effect on perceived quality. The result indicated
that if the intensity of distribution, print advertising and TV advertising of the brand are highly
positive, then the perceived quality of a brand will tend to be significantly positive.
The researcher recommends that the marketers/managers of the brand should focus mainly on
improving the intensity of distribution in order to build a higher positive perceived quality for
Ichitan, in considering its highest un-standard beta coefficient which is then followed by print
advertising and TV advertising. The researcher points out that by increasing the distribution channels
it gives incentives and discounts to local stores and restaurants in order to increase their intensity of
distribution. The researcher also suggests increasing the frequency of advertisements on TV as well as
print to further strengthen the perceived quality of Icthian towards its customers. As per the
hypothesis one result, the researcher concludes that prime time advertisements on TV and cache slots
for print advertising will positively affect the perceived quality of Ichitan. The researcher suggests
that, the content of TV and print advertising, if related to its diverse distribution channels, will have
more impact in building perceived quality for Ichitan.
The result of this research is supported by Tong and Hawley (2009). Tong and Hawley (2009)
studied about the relationship between the effectiveness of eight chosen marketing campaigns and
brand equity in the clothing market of China. The results of this study indicated that there is a direct
positive effect of print advertising and TV advertising on brand awareness in China.
The result from hypothesis3, which was supported by Rostami and Kashkooli(2012), Yoo et
al., (2000), and Roj (2000) who explored that the intensity of distribution positively affects brand
107
association. Yoo et al. (2000) investigated that “distribution is intensive when products are placed in a
large number of stores to cover the market.” and also stated that brand association can be increased
by distribution intensity.
From the result of hypothesis number 2, there is an influence of print advertising on affecting
brand awareness. The result of this study implies that, print advertising can significantly play a very
significant role in contributing brand awareness. Based on the demographic factors, the researcher
points out that Ichitan’s brand presenter should be fit with the main target or customer profile such as
a fresh advertising theme, a flashy color scheme for print advertisements with a design that is
relevant to the majority target group as they are female, single, aged 24-29 with a bachelor degree’s
and a monthly income between 10000-20000. The researcher suggests the marketers should invest
more in print advertising quantity such as advertising in magazines and newspapers in order to build
positive brand awareness towards the brand and circulate pamphlets near universities and shopping
malls with attractive promotions to lure the target segment. The result of this hypothesis is mainly
supported by Gil et al. (2007); the relationship between family and brand equity. The result revealed
that there is a very positive and significant relationship between brand awareness and advertising. The
researchers also stated there will be a positive influence on repurchase intention as well if brand
awareness is positive.
Also, the result of hypothesis three showed that there was a statistically significant impact of
print advertising on Brand association. This result states that if a company advertises more via print
media, then the association of customers towards the brand will be high and the researcher suggests,
the company should invest mainly in its print advertising in order to build its brand association.
In addition, brand association is defined as the characteristics of a product or a service, the
reputation of a company, the attributes of a product or service which are directly linked from the
memory to the brand. A positive brand association can increase the consumers’ loyalty towards that
108
brand. Therefore, building brand association among its segments is a must and it tends to increase
when the brand is well advertised, according to Gil et al. (2007).
According to the result of hypothesis four, there is a statistically significant impact of brand
awareness and brand association on repurchase intention. It indicated that if brand awareness and
brand association of the brand are high, then repurchase intention will also be positively high. By
considering the un-standard beta coefficient, the brand awareness records the highest un-standardized
beta value, which implies it affects very strongly the intention to repurchase of Ichitan followed by
brand association. The researcher suggests Ichitan that the company has to increase its brand
awareness according to the recommendations in hypothesis1-hypothesis3 and more on celebrity
endorsement or outdoor marketing activities.Hypothesis results show that print adverting has a strong
positive significant impact on brand awareness..The researcher also suggests advertising in print with
content referring to its association and the intensity of distribution will have a positive impact on the
repurchase intention of Ichitan. Also for other target groups, Ichitan may produce some relevant
products relevant the age level as one of market segmentation to build a positive effect on repurchase
intention as well.
The result is supported by Jalilvand et al. (2011), who revealed that brand awareness and
association towards the brand can increase repurchase intention towards a brand among its target
population. Advertising, the intensity of distribution, reputation, and the characteristics of the product
will positively affect the repurchase intention of Ichitan in Bangkok.
6.5 Further Research
This study was carried out to understand the factors affecting Repurchase Intention towards
the Ichitan brand in Bangkok, Thailand. Due to the limitations of the study such as time constraints or
the location of the market, the researcher would like to suggest to marketers, strategists, sales
managers or brand managers of any relevant field who have to increase sales volume and are
interested to do future studies by using this research as a reference as follows:

109
The researcher suggest that further studies could compare between Ichitan and its main
competitor which is the Oishi brand. These two firms were founded by the same person,
competing in the same market with the same kind of business and both hold the biggest share
in the industry as well.
This study was scope the products of Ichitan brand during the researcher did the research only
which may not include further products launched by the Ichitan brand in the future. Therefore,
further studies could add new products as one of the factors which may affect the results of
the study as well.
According to the topic of the study, this research was focused on the Ichitan brand only as the
selected brand. Therefore, further studies could be conducted for other RTD Beverage brands
as well by using a similar conceptual framework.
This study focused only on the eight variables according to a limited timeframe. Therefore,
further studies still have other factors to use as the variables such as price promotions, non-
price promotions, celebrity endorsement, more marketing activities, customer satisfaction and
others for better understanding customers’ repurchase intention.
This study is conducted in Bangkok, Thailand which may not represent the repurchase
intention of customers who live in another location, even though they are in Thailand as well.
Therefore, further research could be conducted in other cities of Thailand such as Cholburi,
Phuket, Chiangmai, etc.
110
BIBLIOGRAPHY
Aaker, D. A. (1991). Managing brand equity. San Francisco: Free Press.
Aaker, D. A. (1996). Measuring brand equity across products and markets. California Management, 38
(Spring), 02-120.
Aaker, D. A., Kumar, V., & Day, S. G. (2000). Marketing Research, (7th ed.), New York: John Wiley &
Sons.
Aaker, D.A. (2008), Brand leadership, The Free Press, New York, NY, 13, 27, 40, 48 New York: The
Free Press.
Aaker and John (1989), Dimensions of Brand Personality, Journal of Marketing Research 1997:8,
347-356.
Alba, J. W. (2000), Salience effects in brand recall, Journal of Marketing Research, 23, 363-369
Alba, J. W., and Hutchinson, J. W. (1987), Dimensions of consumer expertise, Journal of Consumer
Research, 13, March, 55-59
Alizade, R., Mehrani, H., & Didekhani, H. (2014, JWY). A study on the effect of selected marketing
mix elements on brand equity with mediating role of brand equity in ETKA chain stores,
golestan province. Kuwait Chapter of Arabian Journal of Business and Management Review,
(11a), 184-192.
Armstrong, S. (2001). Advertising on the Internet, 2nd
ED. London: Kogan Page.
Ashil and Sinha (2004), Consumer Behavior and Marketing Action. Kent Publishing Company:
Boston.
111
Babbie, Earl. (2001), The practice of social research (9th ed.). Belmont, CA: Wadsworth
Publishing.
Baker, W., Michael, J., and Churchill, G. A. (2010). The relevance-accessibility model of advertising
effectiveness. Nonverbal Communications in Advertising, Sidney Hecker and David W.
Steward, eds. Lexington, MA: Lexington Books, 59-84
Berenson, M. L., and Levine, D. M. (1996), Basic Business Statistics, Prentice-Hall, Englewood Cliffs,
New Jersey
Blackwell, S. A., Szinbach, S. L., Barnes, J. H., Garner, D. W., and Bush, V. (1999). The antecedents of
customer loyalty: an empirical investigation of the role of personal and situational aspects on
repurchase decisions. Journal of Services Research, 1(4), 362-375
Blythe, J. (2000), The essence of Consumer Behavior, London, New York: Prentice- Hall
Buil, I., Martinez, E., and Chernatony, D. L. (2013). The influence of brand equity on consumer
responses. Journal of Consumer Marketing, 30(1), 62-74
Chattopadhyay, T., Dutta. R. N., & Sivani, S. (2010). Media mix elements affecting brand equity: A
study of the Indian passenger car market. II MB Management Review, 22, 173-185
Chen, J. V., Yen, D. C., and Chen, K. (2009). The acceptance and diffusion of the innovative smart
phone use: A case study of a delivery service company in logistics. Information and
Management, 46(4), 241-248
Chi, C. G. Q. and Qu, H. (2009). Examining the structural relationships of destination image, tourist
satisfaction and destination loyalty: An integrated approach. Tourism Management, 29, 624-
636
Churchill, G. A. (1999), Marketing Research: Methodological Foundations, (7th ed.), Orlando: Dryden
Cooper, D. R., and Schindler, P. S. (2001), Business Research Methods, (7th ed.), Boston: McGraw-Hill
112
Cronin, J.J., and Taylor, S.A. (2000). Measuring service quality: A re-examination and extension.
Journal of Marketing, 56(3), 56-68
Davis, D. & Hair, R. M. (2000), Business research for decision making, Belmont, CA: Wadsworth.
Deng, Z. H., Lu, Y. B., Wei, K. K. and Zhang, J. L. (2010), Understanding customer satisfaction and
loyalty: an empirical study of mobile instant message in China. International Journal of
Information Management, 30(4), 289-300
De Souza, R. (1992), Walking upright here: Countering prevailing discourses through reflexivity
and methodological pluralism Massey University, Albany, NZ.
Farquhar, P. H. (1989). Managing Brand Equity. Marketing Research, 1 (September), 24-33
Fornell, C. (1992). A national customer satisfaction barometer: the Swedish experience. Journal
of Marketing, Vol. 56, 1-18
Grewal, D., Krishanan, R., Baker, J., and Borin, N. (1998). The Effect of Store Name, Brand Name
and Price Discounts on Consumers' Evaluations and Purchase Intentions. Journal of Retailing,
74 (3), 331-352
Hair, J. F. Anderson, R. E., Tatham, R. L., and Black, W. C. (1996). Multivariate Analysis, (5th ed.),
Prentice-Hall, Madrid
Hair, J. F., Bush, R. P., and Ortinau, D. J. (2000). Marketing Research: A practical approach for the
new millennium, McGraw-Hill Inc
Hassan, A., Chachi, A., and Latif S. A. (2001). Islamic Marketing Ethics and Its Impact on Customer
Satisfaction in the Islamic Banking Industry. JKAU: Islamic Econ., Vol. 21 No. 1, 27-46
113
Huang, H. J., and Sarigöllü, E. (2004). Consumer attitude towards gray market goods. International
Marketing Review, 21(6), 598-614
Idoko et al., (2014). The impact of country-of-origin and country-of-manufacture cues on consumer
perceptions of quality and value. Journal of Global Marketing, 11(1), 7-27
Jackson, B. B. (1985). Winning and Keeping Industrial Customers: The Dynamics of Customer
Relationships, Lexington, MA: D.C. Heath and Company
Jalivand, M. R., and Samiei, N. (2011). The Effect of Electronic Word of Mouth on Brand Image and
Purchase Intention. Marketing Intelligence and Planning, 30(4), 460-476
Janoschka, A. (2003). Web Advertising: New forms of communication on the Internet, xiv, 230
Jones, T. O., and Sasser, E.W. (1995). Why Satisfied Customers Defect, Harvard Business Review 73
(6), 88-99
Keisidou, G. A. and Calantone, R. J. (2013). A flexible model of consumer country-of-origin
perceptions. International Marketing Review, 17(2), 127-145
Keller, K. L. (1993). Conceptualizing, measuring, and managing customer-based brand equity, Journal
of Marketing, Vol. 57, January, 1-22
Keller, K. L. (2003). Strategic Brand Management: Building, Measuring, and Managing Brand
Equity, (2nd ed.), Prentice-Hall, New York, NY
Keller, K. L. (2013). Conceptualizing, measuring and managing customer-based brand equity. Journal
of Marketing, 57 (1), 1-22
Keller, K. L., and Lehmann, D. R. (2003). How do brands create value?”, Marketing Management
Journal, May/June, 27-31
114
Keller, K. L., and Lehmann, D. R. (2006). Brands and branding: research findings and future priorities.
Marketing Science Journal, 25(6), 740-759
Kleppner, O. (1979), Advertising Procedure, 7th ED., Englewood Cliffs, New York: Prentice-Hall
Liu, W. L. (2002). Advertising in China: product branding and beyond. Corporate Communications,
7(2), 117-126
Mackay, M. M. (2001). Application of brand equity measures in service markets. The journal of
Services Marketing, 15(3), -221
Malhotra, N. K. (2000), Marketing Research: An applied orientation international edition, New Jersey:
Prentice Hall
Malhotra, N. K. (2002), Marketing Research: An Applied Orientation, 5th
ED., Prentice Hall
Malhotra, N. K. and Bricks. (2000), Marketing Research: An applied orientation international edition,
New Jersey: Prentice Hall
Malhotra, N. K., and Birks, D. F. (2003), Marketing Research: An Applied Approach, 3rd
ED., Pearson
Education Limited
Malhotra, N. K., and Birks, D. F. (2004), Marketing Research: An Applied Approach, 4th
ED., Pearson
Education Limited
McClave, J., Benson, P., and Sincich, T. (2004), Statistics for Business and Economics, New York:
Prentice-Hall
McDaniel, C. D., and Gates, R. H. (1998), Marketing Research Essentials, Taylor & Francis
Mehrabian, A., and Russell, J. A. (1974), An Approach to Environmental Psychology, MIT
Press, Cambridge, MA
Milgrom, P., and Robert, J. (1986). Price and advertising signals of product quality. Jouranl of
Political Economy, 55 (August), 10-25
115
Morgan, R. M., and Hunt, S. D. (2005). The commitment trust theory of relationship marketing. Jour-
nal of Marketing, 58(2), 20–38.
Nguyen, T. D., Barrett, N. J., and Miller, K. E. (2000). Brand loyalty in emerging markets. Marketing
Intelligence & Planning, 29(3), 222-232
Porr, T. (2003). Essentials of Marketing Research, 3rd
ED., Pearson Education Limited
Porral, J., Toru, H. And Timo, S. (2013) Producing sustainable competitive advantage through the
effective management of people, The Academy of Management Executive, 9(1), 5.
Pradhita, A. (2014) Competing in the service sector-the entrepreneurial challenge, International
Journal of Entrepreneurial Behaviour & Research, 7(1), 5-21
Proctor, T. (1997). Essentials of Marketing research, UK: Financial Times-Prentice Hall
Ranaweera, F.F. and Prabhu (2003). The Loyalty Effect, Harvard Business School Press, Boston, MA.
Reibstein M., and Farris P. (1995). Research Methods for Business Students, Pearson Education 4th
Edition.
Render., Stari., and Hanna. (2009). Quantitative Analysis for Management, 10th
ED., Prentice-Hall, Inc
Rensis, L. (1932). A Technique for the Measurement of Attitudes. Archives of Psychology, 1‐55.
Roberts, D. (2006). China’s Power Brands, Business Week International, 3907, 45, 8 November, 77
Roj, F. F. (2000), The Loyalty Effect, Harvard Business School Press. Boston, MA.
Roj, J. (2002) Accent is on quality in consumer services this decade, Marketing News, 17(4), 12.
Rosenberg, C. and Czepiel (1984). Qualitative research requires quality concepts of its own.
Management Decision, 39(7), 551-555.

116
Rostami, A., and Kashkooli H. (2012). Research managing the customer perceived service quality for
cellular mobile telephony: An empirical investigation. Vikalpa, 33(1), 19.
Russell, T. J., and Lane, R. W. (1993). Roles of Advertising. Kleppner’s Advertising Procedure. New
Jersey: Printice-Hall, 27-55
Sekaran, U. (1992). Research Methods for Business: A Skill Building Approcah, 2nd
ED., John Wiley &
Sons
Sekaran, U., and Bougie, R. (2009). Research methods for business: A skill building approach, 5th
ED..
New York: John Wiley & Sons, Inc.
Srinivasan, R. A. and Houston, M. J. (2005). Script-Based Evaluations of Satisfaction with Services, In
Emerging Perspectives on Services Marketing, L. Berry, G. Shostack, and G. Upah, eds.,
Chicago: American Marketing, 59-62.
Sweeney, R.A. and Williams. A.K. (2002). An Empirical Assessment of the SERVQUAL Scale, and the
Relationship Between Service Quality and Satisfaction, American Marketing Association
Chicago, 4, l-6.
Tong, X., and Hawley, M. J. (2009). Creating brand equity in the Chinese clothing market: The effect
of selected marketing activities on brand equity dimensions. Journal of Fashion Marketing
and Management, 13(4), 566-581
Urdan, R.K. (2005). Expectations, performance evaluation, and consumers’ perceptions of quality, The
journal of marketing, 18-34.
Vanishbancha, K. (2007), SPSS for windows, 10th
ED., Chulabook: Bangkok
Wang, Y., Kandampully, J. A., Lo, H., and Shi, G. (2004). The roles of brand equity and corporate
reputation in CRM: a Chinese study. Corporate Reputation Review, 9(3), 179-197

117
Wells. W., Burnett, J., and Moriarty. S. (1992), Advertising Principles and Practice, 2nd
ED., New
Jersey: Prentice-Hall, Inc
White, J. C., Troy, L. C., and Gerlich, R. N. (2000). The role of slotting fees and introductory
allowances in retail buyers’ new-product acceptance decisions”. Journal of the Academy of
Marketing Science, 28(2), 291-298
Wiguna, H. (2013) Writing up Qualitative Research, (3rd ed.), Thousand Oaks, CA, Sage Publication
Yoo, B., Donthu, N., and Lee, S. (2000). An examination of selected marketing mix elements and
brand equity. Journal of the Academy of Marketing Science, 28(2), 195-211
Zeithaml, V. A. (1981). Consumer perceptions of price, quality and value: A means-end model and
synthesis of evidence, Journal of Marketing, 52(3), 2-22
Zeithaml, V. A. (1988). Consumer perceptions of price, quality and value: A means-end model and
synthesis of evidence, Journal of Marketing, 52(3), 2-22
Zikmund, W. G. (1999). Business Research Methods, (3rd ed.), USA: Thompson Learning, Tampa, FL
Zikmund, W. G. (2000). Business Research Methods, (6th ed.), Forth Worth Dryden Press
Zikmund, W. G. (2003). Business Research Methods, (7th ed.), USA: Thompson Learning, Tampa, FL
Zikmund, W. G. (2014). Business Research Methods, (10th
ed.), USA: Thompson Learning, Tampa, FL
Zimmer, V.A. and Linda L.L. (1999). The nature and determinants of customer expectations of
services, Journal of the Academy of marketing sciences, 21(1), 1-12

118
INTERNET REFERENCES
http://www.bangkok-city.com/shop/mall.html
http://esa.un.org/unpd/wpp/Publications/Files/Key_Findings_WPP_2015.pdf
www.fas.usda.gov,
www.google.com
http://www.ichitangroup.com/
http://www.ichitangroup.com/brands-ichitan-greentea-uht.php
http://www.interbrand.com/it/best-global-brands/2015/Ichitan
http://investor-th.ichitangroup.com/
https://maps.google.com,
http://www.unescap.org/esd/apuf-5/documents/sacr.pdf
http://www.fareastddb.com/buzz/?p=18549

119
Appendix A: Questionnaire
(English Version)
120
QUESTIONNAIRE
This questionnaire is collected by the partial fulfillment of the requirements for the
degree of master of business administration (MBA) student from Assumption University,
Thailand. The objective of questionnaire is to study the factors affecting repurchase intention
towards the Ichitan brand in Bangkok. Please answer the following questions by mark “/” in
the space given below and answer truthfully and complete all questions. Your responds will be
keep confidence. Thank you for your cooperation.
Part I: Screening Question
1. Have you ever drink the Ichitan branded drink before?
------------ Yes ----------------- No
(If your answer is yes, please continue to do the second question. By contrast, if your answer is no,
please return the questionnaire)

121
Part II: Web Advertising
Strongly
disagree
Disagree Neither agree
nor disagree
Agree Strongly
agree
2. Ichitan’s brand is intensively advertised on
social networking websites.
3. The web advertisements for Ichitan’s brand
are seen frequently.
4. Ichitan’s brand spends a great amount of
money on web advertising.
Part III: Print Advertising
Strongly
disagree
Disagree Neither agree
nor disagree
Agree Strongly
agree
5. Ichitan’s brand is intensively advertised in
newspapers, magazines and pamphlets.
6. The print advertisements of Ichitan’s brand
in newspapers, magazines and pamphlets
seem very expensive compared to competing
brands.
7. The print advertisements of Ichitan’s brand
in newspapers, magazines and pamphlets are
seen frequently.
8. Ichitan’s brand spends a great amount of

122
money on print advertising.
Part IV: TV Advertising
Strongly
disagree
Disagree Neither agree
nor disagree
Agree Strongly
agree
9. TV advertisements for Ichitan brand are
seen frequently.
10. Ichitan brand is intensively advertised on
TV.
11. The TV advertisements for Ichitan brand
seem very expensive compared to competing
brands.
12. Ichitan’s TV advertisements are exciting
and innovative.
Part V: Intensity of distribution
Strongly
disagree
Disagree Neither agree
nor disagree
Agree Strongly
agree
13. It is very easy to find and buy Ichitan
brand drinks.
14. Ichitan has a very good distribution
channel. (Such as; direct sales team, sell
through a dealer, whole sale distributor.)

123
15. Consumers can find Ichitan brand drinks
in any store.
Part VI: Brand Awareness
Strongly
disagree
Disagree Neither agree
nor disagree
Agree Strongly
agree
16. I have good knowledge of Ichitan, more
than other brands on the market.
17. When it comes to beverage, the Ichitan
brand stands out in my mind.
18. I know what Ichitan brand looks like.
19. I can recognize Ichitan brand easily
among other brands.
Part VII: Perceived Quality
Strongly
disagree
Disagree Neither agree
nor disagree
Agree Strongly
agree
20. Ichitan brand is associated with very high
quality products.
21. Ichitan brand offers products of consistent
quality.
22. I trust the quality of products from Ichitan

124
brand.
Part VIII: Brand association
Strongly
disagree
Disagree Neither agree
nor disagree
Agree Strongly
agree
23. Some characteristics of Ichitan brand
come to my mind quickly.
24. I can quickly recall the symbol or logo of
Ichitan brand.
25. Ichitan is different from its competing
brands.
Part IX: Repurchase intention
Strongly
disagree
Disagree Neither agree
nor disagree
Agree Strongly
agree
26. I would feel pleasure about my purchase,
if I buy Ichitan branded drink again
27. Ichitan branded drink satisfied me and I
like to buy it again in the future
28. I am always interested in new products
from Ichitan brand and would like to try them
in the future
Part X: General Information

125
29. Gender
( ) Male ( ) Female
30. Marital Status
____ Single ____ Married ____ Divorced/Widowed
31. Age
____ 18-23 ____ 24-29 ____ 30-34
32. Personal Income / Allowance from Parents per month (Baht)
____ 10,000 and less ____ 10,001 - 20,000 ____ 20,000 - 30,000
____ 30,001 - 40,000 ____ 40,001 and above
33. Education level
____ High School Graduate or less ____ Bachelor Degree
____ Master Degree ____ Doctoral Degree
126
Appendix B: Questionnaire
(Thai Version)

127
แบบสอบถาม
แบบสอบถามนเปนสวนหนงของวทยานพนธระดบปรญญาโท คณะบรหารธรกจ มหาวทยาลยอสสมชญ โดยจดท าขนเพอ
ศกษาปจจยทมผลตอความตงใจในการบรโภคซ าของ “เครองดมในเครออชตน” ในประเทศไทย และน าขอมลทไดไปใชเปนประโยชน
ทางสถตภายใตวตถประสงคของการศกษาเทานน .โปรดท าเครองหมาย “/” ในชองวางทตรงกบความเปนจรง ซงผวจยหวงเปนอยาง
ยงวาจะไดรบความกรณาในการตอบแบบสอบถามจากทกๆทานและขอขอบพระคณเปนอยางสงมา ณ ทน
สวนท 1: ค าถามคดกรอง
1. คณเคยซอเครองดมในเครออชตนหรอไม?
------------ เคย ----------------- ไมเคย
(หากทานตอบวา “เคย” โปรดตอบแบบสอบถามในขอถดไปตอ และโปรดคนแบบสอบถามใหแกผวจยหากทานตอบวา “ไมเคย”)
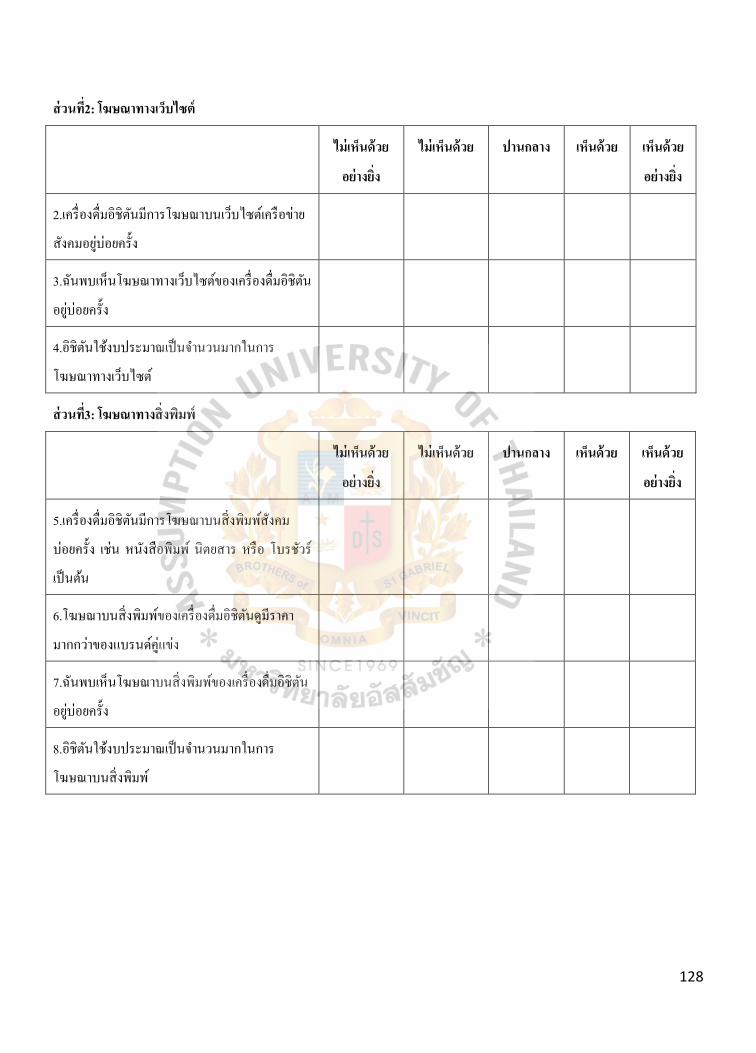
128
สวนท2: โฆษณาทางเวบไซต
ไมเหนดวย
อยางยง
ไมเหนดวย ปานกลาง เหนดวย เหนดวย
อยางยง
2.เครองดมอชตนมการโฆษณาบนเวบไซตเครอขาย
สงคมอยบอยครง
3.ฉนพบเหนโฆษณาทางเวบไซตของเครองดมอชตน
อยบอยครง
4.อชตนใชงบประมาณเปนจ านวนมากในการ
โฆษณาทางเวบไซต
สวนท3: โฆษณาทางสงพมพ
ไมเหนดวย
อยางยง
ไมเหนดวย ปานกลาง เหนดวย เหนดวย
อยางยง
5.เครองดมอชตนมการโฆษณาบนสงพมพสงคม
บอยครง เชน หนงสอพมพ นตยสาร หรอ โบรชวร
เปนตน
6.โฆษณาบนสงพมพของเครองดมอชตนดมราคา
มากกวาของแบรนดคแขง
7.ฉนพบเหนโฆษณาบนสงพมพของเครองดมอชตน
อยบอยครง
8.อชตนใชงบประมาณเปนจ านวนมากในการ
โฆษณาบนสงพมพ
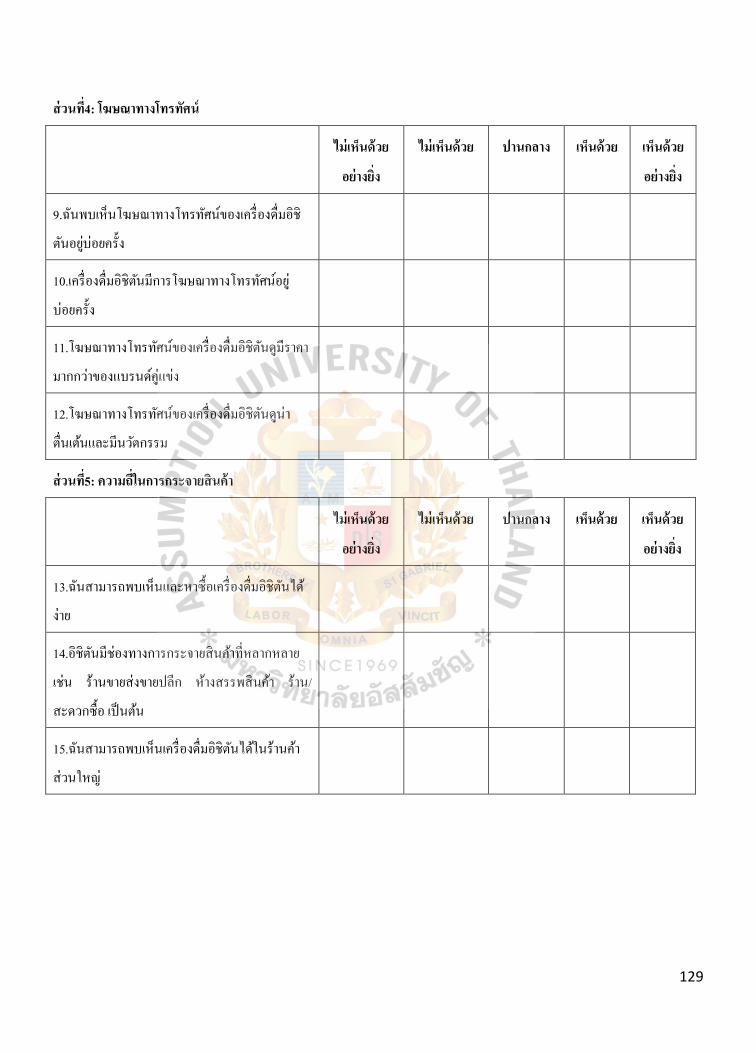
129
สวนท4: โฆษณาทางโทรทศน
ไมเหนดวย
อยางยง
ไมเหนดวย ปานกลาง เหนดวย เหนดวย
อยางยง
9.ฉนพบเหนโฆษณาทางโทรทศนของเครองดมอช
ตนอยบอยครง
10.เครองดมอชตนมการโฆษณาทางโทรทศนอย
บอยครง
11.โฆษณาทางโทรทศนของเครองดมอชตนดมราคา
มากกวาของแบรนดคแขง
12.โฆษณาทางโทรทศนของเครองดมอชตนดนา
ตนเตนและมนวตกรรม
สวนท5: ความถในการกระจายสนคา
ไมเหนดวย
อยางยง
ไมเหนดวย ปานกลาง เหนดวย เหนดวย
อยางยง
13.ฉนสามารถพบเหนและหาซอเครองดมอชตนได
งาย
14.อชตนมชองทางการกระจายสนคาทหลากหลาย
เชน รานขายสง /ขายปลก หางสรรพสนคา ราน
สะดวกซอ เปนตน
15.ฉนสามารถพบเหนเครองดมอชตนไดในรานคา
สวนใหญ

130
สวนท6: การรบรแบรนด
ไมเหนดวย
อยางยง
ไมเหนดวย ปานกลาง เหนดวย เหนดวย
อยางยง
16.ฉนรจกแบรนดอชตนมากกวาแบรนดอนๆใน
ทองตลาด
17.เมอกลาวถงเครองดมฉนมกจะนกถงเครองดมอช
ตน
18.ฉนรวาเครองดมอชตนมลกษณะเปนอยางไร
19.ฉนสามารถจ าและแยกแยะเครองดมอชตนออก
จากเครองดมของแบรนดอนๆได
สวนท7: การรบรคณภาพ
ไมเหนดวย
อยางยง
ไมเหนดวย ปานกลาง เหนดวย เหนดวย
อยางยง
20.เครองดมอชตนมคณภาพทดส าหรบฉน
21.เครองดมอชตนมคณภาพทดเสมอตนเสมอปลาย
22.ฉนเชอมนในคณภาพของสนคาจากแบรนดอชตน
สวนท8: การเชอมโยงแบรนด
ไมเหนดวย
อยางยง
ไมเหนดวย ปานกลาง เหนดวย เหนดวย
อยางยง
23.ฉนสามารถนกถงลกษณะบางอยางของแบรนดอช
ตนไดอยางรวดเรว
24.ฉนรวาสญลกษณของแบรนดอชตนมลกษณะเปน
อยางไร
25.แบรนดอชตนแตกตางจากแบรนดคแขงส าหรบ
ฉน
131
สวนท9: ความตงใจในการบรโภคซ า
ไมเหนดวย
อยางยง
ไมเหนดวย ปานกลาง เหนดวย เหนดวย
อยางยง
26.ฉนรสกพอใจในการจบจายเงนเพอทจะซอ
เครองดมอชตนในอนาคต
27.เครองดมอชตนท าใหฉนรสกพอใจและท าใหฉน
คดทจะซออกในอนาคต
28.ฉนสนใจทจะลองสนคาใหมจากแบรนดอชตนใน
อนาคต
สวนท01: ขอมลทวไป
29. เพศ
( ) ชาย ( ) หญง
30. สถานะ
____ โสด ____ แตงงานแลว ____ หยาราง
31. อาย
____ 18-23 ป ____ 24-29 ป ____ 30-34 ป
32. รายไดตอเดอน
____ ต ากวา 10,000 บาท ____ 10,001 - 20,000 บาท ____ 20,000 - 30,000 บาท
____ 30,001 - 40,000 บาท ____ มากกวา 40,001 บาท
33. ระดบการศกษา
____ ต ากวาปรญญาตร ____ ปรญญาตร
____ ปรญญาโท ____ ปรญญาเอก

132
Appendix C: Reliability Test

133
Table 1: Web Advertising
Reliability Statistics
Cronbach's
Alpha
N of Items
.761 3
Table 2: TV Advertising
Reliability Statistics
Cronbach's
Alpha
N of Items
.773 4
Table 3: Print Advertising
Reliability Statistics
Cronbach's
Alpha
N of Items
.860 4
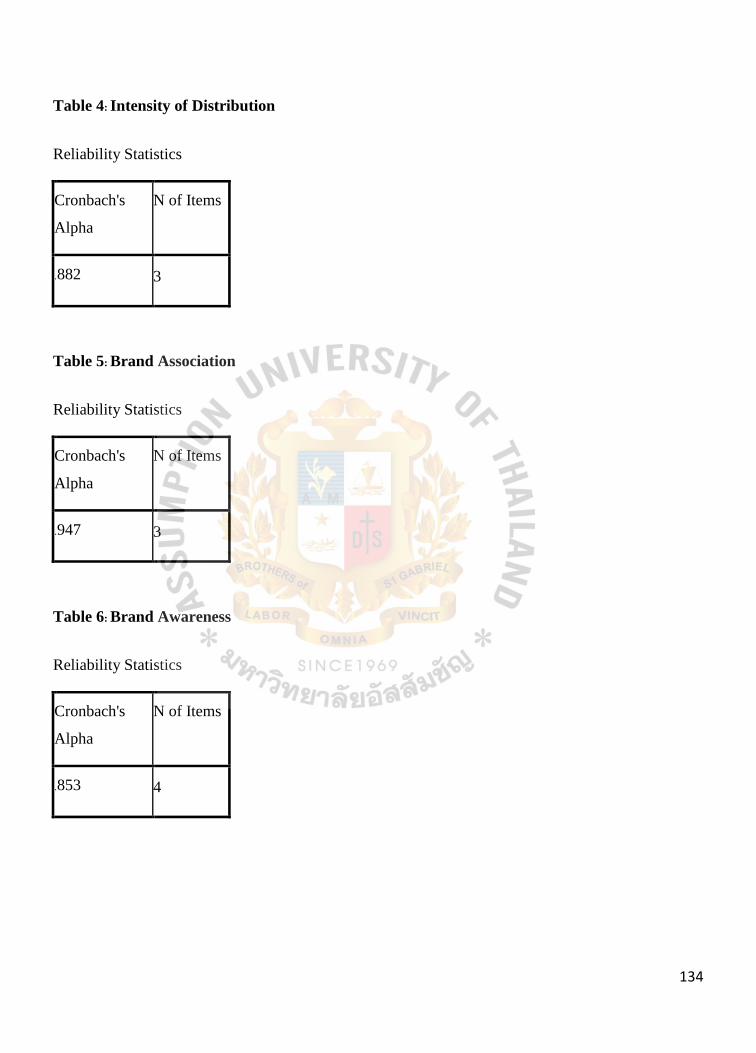
134
Table 4: Intensity of Distribution
Reliability Statistics
Cronbach's
Alpha
N of Items
.882 3
Table 5: Brand Association
Reliability Statistics
Cronbach's
Alpha
N of Items
.947 3
Table 6: Brand Awareness
Reliability Statistics
Cronbach's
Alpha
N of Items
.853 4

135
Table 7: Perceived Quality
Reliability Statistics
Cronbach's
Alpha
N of Items
.947 3
Table 8: Repurchase Intention
Reliability Statistics
Cronbach's
Alpha
N of Items
.882 3

136
Appendix D: Respondents’
General Information

137
Table 1: The analysis of gender levels using frequency and percentage
Table 2: The analysis of marital status using frequency and percentage
Table 3: The analysis of age category using frequency and percentage

138
Table 4: The analysis of personal income using frequency and percentage
Table 5: The analysis of education level using frequency and percentage
