a study of barrier walls for mitigation of … · hydrogen jet flames resulting from ignition of...
TRANSCRIPT

* Sandia National Laboratory, Livermore, CA Sandia is a multiprogram laboratory operated by Sandia Corporation, a Lockheed Martin Company, for the United States Department of Energy’s National Nuclear Security Administration under Contract DE-AC04-94-AL85000.
A STUDY OF BARRIER WALLS FOR MITIGATION OF UNINTENDED RELEASES OF HYDROGEN *
Houf, W.G.1, Evans, G.H.2 , Schefer, R.W.3 , Merilo, E.4, and Groethe, M.5
1 Sandia National Laboratories, Livermore, CA 94551-0969, USA, [email protected] 2 Sandia National Laboratories, Livermore, CA 94551-0969, USA, [email protected]
3 Sandia National Laboratories, Livermore, CA 94551-0969, USA, [email protected] 4 SRI International, Menlo Park, CA 94025, USA, [email protected]
5 SRI International, Menlo Park, CA 94025, USA, [email protected]
Abstract Hydrogen jet flames resulting from ignition of unintended releases can be extensive in length and pose significant radiation and impingement hazards. Depending on the leak diameter and source pressure, the resulting consequence distances can be unacceptably large. One possible mitigation strategy to reduce exposure to jet flames is to incorporate barriers around hydrogen storage and delivery equipment. An experimental and modeling program has been performed at Sandia National Laboratories to better characterize the effectiveness of barrier walls to reduce hazards. This paper describes the experimental and modeling program and presents results obtained for various barrier configurations. The experimental measurements include flame deflection using standard and infrared video and high-speed movies (500 fps) to study initial flame propagation from the ignition source. Measurements of the ignition overpressure, wall deflection, radiative heat flux, and wall and gas temperature were also made at strategic locations. The modeling effort includes three-dimensional calculations of jet flame deflection by the barriers, computations of the thermal radiation field around barriers, predicted overpressure from ignition, and the computation of the concentration field from deflected unignited hydrogen releases. The various barrier designs are evaluated in terms of their mitigation effectiveness for the associated hazards present. The results show that barrier walls are effective at deflecting jet flames in a desired direction and can help attenuate the effects of ignition overpressure and flame radiative heat flux.
1.0 INTRODUCTON The development and commercial use of hydrogen will require safety guidelines for building vehicle fueling stations, storage facilities, and other infrastructure components. If the development of these safety guidelines is to be made on a scientific basis, then validated engineering models of unintended hydrogen releases are needed for scenario and risk analysis.
Hydrogen jet flames resulting from the ignition of unintended releases can be extensive in length and pose significant radiation and impingement hazards [1, 2]. Depending on the leak diameter and source pressure the resulting consequence distances can be unacceptably large [3]. One mitigation strategy for reducing the exposure to flames that can occur with unintended releases is to incorporate barriers around hydrogen storage equipment. The reasoning is that walls will reduce the extent of unacceptable consequences due to jet releases resulting from accidents involving high-pressure equipment. The goal of this work is to evaluate several different barrier configurations with regard to their ability to reduce hazard distances for use in safety guideline risk analysis.
While the use of barrier walls as a mitigation strategy is an important area of current research, the number of studies currently found in the literature is relatively sparse. Shirvill et al. [4] investigated the explosion hazard consequences associated with high-pressure leaks from hydrogen vehicle refueling stations. Tanaka et al. [5] carried out dispersion and explosion experiments in components associated with hydrogen refueling stations. Tchouvelev et al. [6] reported the results of a numerical modeling study to evaluate the effectiveness of small barriers at reducing clearance distances. Schefer et al. [7] and Schefer and Royle et al. [8] have reported experimental studies of high-pressure

hydrogen jet flame interactions with barrier walls. Houf et al. [9, 10] has reported detailed modeling studies of hydrogen jet and jet flame barrier interactions and the overpressure generated by ignition of hydrogen jet releases near barriers.
The purpose of the present study is to extend the available database on barrier walls as a hazard mitigation strategy and to provide technical data for risk-informed hydrogen codes and standards decisions regarding barrier walls. The experimental effort is complemented by a parallel numerical modeling effort that considers the interaction of jet flames and unignited jets with barriers and the ignition overpressure. The effectiveness of the barriers is evaluated in terms of: (a) the ability to deflect jet flames and protect downstream objects from flame impingement, (b) the reduction of exposure to jet flame thermal radiation, (c) the reduction of the extent of the flammable envelope from an unignited release, (d) the amount of ignition overpressure produced.
2.0 JET FLAME BARRIER WALL INTERACTION EXPERIMENTS Four barrier configurations were studied with various wall heights and orientations using high-speed video and other suitable transducers to characterize the flame wall interactions and the ignition overpressure. The configurations of the four barrier wall tests are shown in Figure 1. A fifth test was also performed for a free hydrogen jet flame with no wall present to provide baseline data for evaluating the effectiveness of the barrier walls at hazard mitigation. For the 1-wall and 3-wall barrier configurations additional experiments were also performed to characterize the effects of ignition delay time and ignition location on the overpressure (see Fig. 2). The ignition delay is defined as the time between the start of the hydrogen jet leak and the firing of the ignition spark. Finally, the effect of barrier confinement on ignition overpressure was evaluated by reducing the included angle between the walls of the 3-wall barrier configuration from 135o to 90o (see Fig. 2). All tests were carried out at the SRI International Corral Hollow test site in Tracy, CA. A brief description of the experiments and associated data is given here, a more detailed description can be found in Schefer et al. [7].
The hydrogen for the tests was provided by a “six-pack” of hydrogen cylinders, each individual cylinder with a volume of 43.8 liters (standard commercially-available size 1A). Hydrogen needed to fill the custom “six-pack” before each test was provided by a cylinder farm of five commercial “six-packs”. The modified hydrogen “six pack” source could be filled to approximately 13.79 MPa (2000 psi) immediately prior to each test. During the tests hydrogen was delivered to a stagnation chamber located just prior to the jet exit. The stagnation chamber was 29.2 cm in length with a 15.2 cm inside diameter and was sized to maintain an internal low flow Mach number (less than 1x10⁻³). Both the stagnation chamber pressure and temperature histories were measured for the duration of each test. The jet exit conditions from the nozzle were calculated assuming isentropic expansion between the stagnation chamber and the horizontally-orientated 3.175 mm diameter jet exit where the flow was assumed to be choked. A pneumatic valve was placed between the stagnation chamber and the jet exit and was opened to start a test and allow hydrogen to be discharged through the jet exit. The time at which the valve reaches fully-opened is considered to be time zero, although all recording instrumentation begins about 5 seconds before time zero.
The hydrogen jet was ignited by a spark located 30.5 cm (12 in) in front of the wall and 12.7 cm (5 in) off the jet centerline at about the 7 o’clock position (when looking at the wall), or at an angle of 210o from an upward vertical line. This location corresponds to the estimated position of the mixing layer adjacent to the hydrogen jet where the hydrogen has mixed with sufficient air to form a flammable mixture and the velocity is low enough to allow flame propagation upstream where a stable flame is formed. In all tests, successful ignition was achieved by a single 40 J spark. For the barrier configuration tests shown in Fig. 1 the spark ignition time was held constant for all tests at 136 msec after the valve was fully opened. For the ignition delay time experiments depicted in Fig. 2 the ignition delay time was varied between 40 msec to a maximum of about 6 seconds after leak initiation.

(A) (B) Figure 1. (A) Schematics of barrier wall configurations for tests and calculations. (B) Standard video frames from barrier wall tests at SRI Corral Hollow Test site. Top left: Jet centered on 1-wall vertical barrier (Test 1); Top right: Jet located at top of 1-wall vertical barrier (Test 2); Bottom left: 1-wall barrier tilted at 30 degrees to vertical (Test 3); Bottom right: 3-wall vertical barrier with 135 degrees between walls (Test 5).
(a)
(b) 3.0
4.0
5.0
6.0
7.0
8.0
9.0
10.0
0 1 2 3 4 5 6 7
OP_Test1-33_P4.qpam
1-wall
3-wall 135
3-wall 90
Ov
erp
res
su
re (
kP
a)
Ignition Delay Time (sec)
3-wall 90
3-wall 135
1 wall
Figure 2. (a) Photographs of barrier configurations for ignition delay overpressure tests. (b) Variation of overpressure with ignition delay time for single wall, three-sided wall with 135o angle, and three-sided wall with 90o angle. Pressure transducer (P4) located in front of wall.
Heat flux gauges were located along the flame centerline prior to the wall to determine the radiative heat flux from the undisturbed portion of the free jet flame and heat flux gages were also placed behind the wall to determine the effectiveness of the wall at mitigating the flame radiation hazard. Piezoelectric pressure transducers were used to measure the overpressures that occurred due to ignition. The transducers were located before and after the wall to quantify the effectiveness of the wall at reducing the overpressures. In addition, a displacement sensor was placed on the back side of the wall at the center to measure the deflection of the wall due to initial impact of the jet flow and the overpressure wave. This general experimental setup was used for each of the five barrier test configurations, with some modifications as needed to accommodate the different wall configurations. Standard visible and infrared video camera recordings from the tests were used to characterize the flame size and length, and the effectiveness of the barriers at deflecting the hot flame gases. Single frames taken from standard video recordings of the 4 barrier tests in the visible wavelength range are shown in Fig. 1B. The frames were taken at several seconds into the tests after transient effects due to initial hydrogen jet formation and flame ignition had diminished. Note that video recordings were also

taken in one test consisting of a free jet with no wall present to provide a baseline data set for evaluating the effectiveness of the barrier wall at hazard mitigation. Shown in the frame for Test 1 (1-wall vertical barrier with jet at wall center in upper left frame) is the horizontal hydrogen flame impinging on the 2.4 m x 2.4 m cinderblock wall that is oriented vertically to the ground. The video image shows a 90o upward deflection of the flame, with no apparent flame stabilized behind the wall. The single frame image for Test 2 (1-wall vertical barrier with jet at wall top in upper right frame of Fig. 1B) shows the hydrogen jet and flame centerline raised vertically so that the height of the flame centerline equals the wall height. The object of this test was to characterize the effect of wall height relative to the flame height. The lower half of the visible flame that intersects the wall is deflected downward along the front wall surface, while the top half of the flame passes over the top of the wall. While it was initially expected that a flame stabilization zone would be formed behind the wall, the video frame does not show this to be the case. Instead the flame appears to be only minimally deflected and extends nearly horizontally past the wall. No evidence was seen of any flame being entrained into the region behind the wall and below the jet, and the corresponding infrared images (not shown) also confirm the lack of any flame in this region.
Ignition overpressure measurements obtained during each of the five tests are summarized in Fig 3. In Fig. 3a the maximum overpressures measured by transducer P4, located approximately 0.6 m in front of the wall are shown. It can be seen that the maximum overpressure of 6.89 kPa (1 psi) is measured in the 1-wall vertical barrier test with the jet centered on the wall. While the overpressure measured with the three-sided wall is slightly lower at 6 kPa, the estimated uncertainty in the measurements is ±10%. Thus the overpressures with both the 1-wall and the three-sided wall are comparable within the experimental uncertainty. The overpressure in the inclined wall test is slightly lower, while the overpressure generated in the free jet test with no wall present was about 2.72 kPa. The case with the 1-wall vertical barrier with the jet raised to the height of the wall is very comparable to the free jet. This latter observation is likely due to the fact that with the jet located at the top of the wall, there is little confinement effect imposed by the wall on the expanding combusted gases. The measured overpressure levels are well below the overpressures associated with personal injury from eardrum rupture (approx. 35 kPa (5 psi)) [11]. Figure 3b shows the ratio of the maximum overpressure after the wall, P1, to that measured in front of the wall, P4. The value of P1/P4 is unity for the free jet since no wall is present. The 1-wall vertical barrier configuration with the jet located at the top of the wall is somewhat effective at reducing the pressure behind the wall, reducing the overpressure ratio by about 20%. The 1-wall tilted barrier, 1-wall vertical barrier with centered jet and 3-wall barrier all reduce P1/P4 by greater than a factor of five, with the 3-wall barrier reducing P1/P4 by nearly an order of magnitude. It should be noted that the maximum pressure on the front and back side of the wall may not be located exactly at the positions of P4 and P1.
(a) 0
2
4
6
8
10
1 2 3 4 5
P4 (
kP
a)
Test Number
Free jet1-Wall(Jet at Top)
1-Wall Tilted
1-Wall(Jet at Center)
3-Wall
(b) 0.0
0.20
0.40
0.60
0.80
1.0
1.2
1 2 3 4 5
P1/P
4
Test Number
1-Wall(Jet at Center)
1-Wall(Jet at Top)
1-WallTilted
3-Wall
Free jet
Figure 3. Overpressures measured in a free jet and each of four barrier wall configurations; (a) Maximum overpressure measured prior to wall; (b) Ratio of maximum overpressure measured after wall to overpressure prior to the wall. The radiative heat fluxes measured in the various test configurations are summarized in Figure 4. The

results shown correspond to a time of 25 seconds into the test when the radiative heat flux is near the maximum. Figure 4a shows that the highest radiant heat fluxes measured by R1 (near the jet exit and looking at the wall) are in the jet centered at wall configuration. Values for the jet at wall top, the inclined wall, and the three-sided wall are comparable, while the free jet heat fluxes are the lowest. Shown in Figure 4b are the values of heat flux measured at 25 seconds by R4 located behind the wall and looking at an angle toward the top of the wall. A comparison of this measurement with the heat flux measured in front of the wall provides a measure of the effectiveness of the barrier wall to mitigate the hazard associated with radiative heat flux. It can be seen that the jet at wall top configuration of Test 2 effectively reduces the heat flux by about a factor of 2.5 (R1 and R4 are 10 kW/m2 and 3.8 kW/m2, respectively). The inclined wall and jet at wall center configurations reduce the heat flux by factors of 17 and 40, respectively, while the reduction with the three-sided wall is nearly a factor of 130.
Shown in Figure 2b are results of the ignition delay experiments where the peak measured overpressures in front of the wall are shown as a function of ignition delay time. Results are shown for the single vertical wall, and the three-sided barrier with angles of 135o and 90o between the walls. The single wall barrier showed the lowest measured overpressure (5.4 kPa). Somewhat higher overpressures of 5.8 kPa and 7.0 kPa were measured for the three-sided barrier with angles between the walls of 135o and 90o, respectively. As might be expected, the overpressure increases due to the increased confinement as side walls are added and the angle between the walls is reduced. Results for all 3 barrier configurations show that the overpressure rises rapidly with ignition delay time up to a value of approximately 1 sec and then levels off to nearly a constant value. This same trend is also observed in the barrier ignition delay overpressure simulations reported in Section 3.0.
(a)
0
5
10
15
20
25
1 2 3 4 5
R1 (
kW
/m2 )
Test Number
Free jet
1-Wall(Jet at Top)
1-WallTilted
1-Wall(Jet at Center)
3-Wall
t= 25 seconds
(b)
0
1
2
3
4
5
1 2 3 4 5
R4 (
kW
/m2 )
Test Number
1-Wall(Jet at Top)
1-WallTilted
1-Wall(Jet at Center)
3-Wall
t = 25 seconds
Figure 4. Maximum radiative heat flux at 25 seconds into test measured in a free jet and each of four barrier wall configurations; (a) Heat flux measured at jet origin; (b) Heat flux measured behind wall.
3. JET-BARRIER WALL INTERACTION MODELING Calculations of unignited and ignited turbulent jets impinging on barriers were performed with the Sandia developed code, FUEGO, designed to simulate turbulent, reacting flow and heat transfer [12] on massively parallel computers. In FUEGO the partial differential equations for conservation of mass, momentum, and energy are integrated over unstructured control volumes. A two equation (k-ε) turbulence model is applied to close the Favre averaged equations and the results presented here were obtained using a modified RNG k-ε model [13]. Transport equations are solved for the mass fractions of each chemical species, except for the dominant species (N2 in the present simulations) which is computed by constraining the sum of the species mass fractions to equal one. The flow is model as compressible and the ideal gas equation of state is used to relate the density and pressure of the gas mixture. Combustion of hydrogen is modeled with the EDC model of Magnussen [14], a one-step irreversible conversion of H2 and O2 to H2O where the time scale for chemical reaction is based on the integral turbulent time scale as given by k/ε. For the calculations reported here, the first order upwind scheme was used for the convective terms. Although the code solves the conservation equations in a time-dependent manner the results presented here are for steady conditions.

Radiative heat loss from hydrogen flames is important in determining the flame temperature. The radiation transport was computed with the Sandia developed finite element code SYRINX [15], a discrete ordinates, participating media radiation heat transfer code that is coupled to FUEGO. The directional integration of the radiative transfer equation was carried out using the TN quadrature method [16]. The radiative energy transfer calculated in SYRINX is coupled to FUEGO through a radiative source term in the energy equation and the radiative transport is assumed to be gray (single absorption coefficient). The single absorption coefficient was determined using the model of Leckner [17] which accounts for the presence of CO2 and water vapor in addition to soot. Because there is no soot or CO2 in a hydrogen flame only the absorption of radiation from the spectral bands of water vapor were included from the Leckner model. Initial calculations showed an over prediction of the radiative heat flux as compared to the free jet flame radiometer measurements made as part of Test 4 (see section above). Two parameters in the absorption coefficient model, a length scale and a scale factor, were adjusted to obtain agreement with the data for the free hydrogen jet flame. These parameters have not been adjusted subsequently in the prediction of radiative heat transfer in the simulations of hydrogen jet flames against barriers. A validation study of the ability of the model to predict the velocity and concentration decay along the centerline of unignited hydrogen free jets and the centerline temperature profile for laboratory-scale and large-scale hydrogen jet flames is reported in Houf et al. [18].
The concept of a pseudo-diameter was used to approximate the jet inflow boundary condition for the simulations in order to avoid calculating the complex supersonic expansion between the sonic exit at the jet opening and the eventual subsonic flow downstream. The jet Mach disk analysis of Winters et al. [19] was used to approximate this complex supersonic expansion and to create a subsonic jet inflow boundary condition for the FUEGO simulations. In this approach the computed Mach disk diameter becomes the pseudo-diameter for the jet simulation and the post-shock velocity and temperature become the jet exit conditions.
Simulations were performed for both unignited and ignited releases for the jet barrier impingement experimental geometries described in Section 2.0. The experiments started from approximately the same initial pressure and temperature and had similar blowdown histories. The experimental blowdowns lasted several minutes and in the simulations the jet exit conditions were calculated from the measured stagnation chamber conditions at approximately 6.3 sec into the blowdown when the flow was well established and could be considered quasi-steady. For all simulations the stagnation pressure and temperature used to determine the inflow boundary conditions with the Mach disk analysis were 10.327 MPa (1497.8 psia) and 278.14K, respectively. These conditions corresponded to a time of 6.35 seconds into the blowdown in Test 1.
For the 1-wall vertical barrier configuration a computation parameter study was also performed to extend the results to higher source pressures and different jet leak diameters based on recommendations by an expert panel associated with the development of the new NFPA55 and NPFA2 gaseous hydrogen separation distances table. These results are reported in a recent paper [10].
3.1 Jet Flame Barrier Deflection and Radiation Simulation Figure 5 shows Fuego jet flame simulations of the 4 barrier interaction experiments discussed in Section 2.0. Comparisons of the video clips from the tests (see Fig. 1B) with the temperature color contour plots (Fig. 5) indicate that the model correctly predicts the deflected jet flame behavior observed in the experiments. Figure 5b shows the simulation for Test 2 (1-wall barrier jet at top) and indicates that the lower half of the flame intersects the wall and is deflected downward along the front of the barrier, while the top half of the flame passes over the top of the wall. While it was initially expected that a flame stabilization zone would be formed behind the wall, this pre-test simulation showed no evidence of flame being entrained into the region behind the wall and allowed proper
placement of sensors and cameras for the experiment. Visible as well as infrared images and thermocouple temperature measurements (not shown) from the test confirm the lack of any flame in the region behind the wall and below the jet.
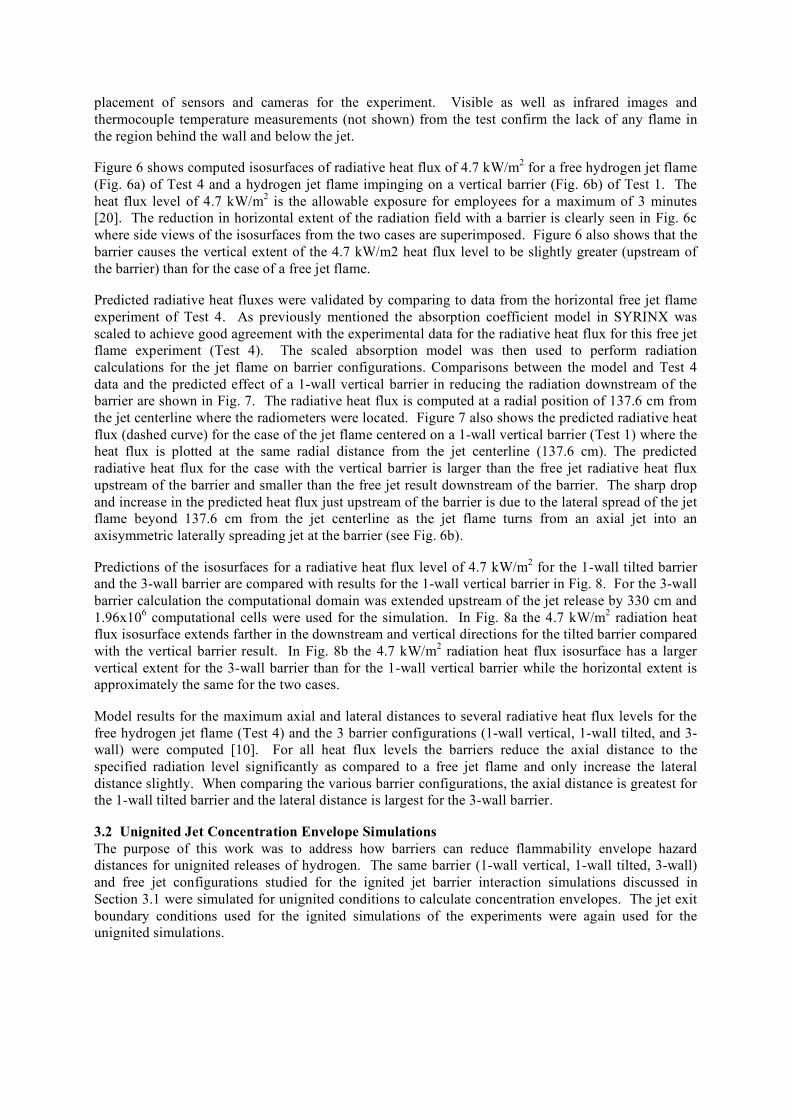
Figure 6 shows computed isosurfaces of radiative heat flux of 4.7 kW/m2 for a free hydrogen jet flame (Fig. 6a) of Test 4 and a hydrogen jet flame impinging on a vertical barrier (Fig. 6b) of Test 1. The heat flux level of 4.7 kW/m2 is the allowable exposure for employees for a maximum of 3 minutes [20]. The reduction in horizontal extent of the radiation field with a barrier is clearly seen in Fig. 6c where side views of the isosurfaces from the two cases are superimposed. Figure 6 also shows that the barrier causes the vertical extent of the 4.7 kW/m2 heat flux level to be slightly greater (upstream of the barrier) than for the case of a free jet flame.
Predicted radiative heat fluxes were validated by comparing to data from the horizontal free jet flame experiment of Test 4. As previously mentioned the absorption coefficient model in SYRINX was scaled to achieve good agreement with the experimental data for the radiative heat flux for this free jet flame experiment (Test 4). The scaled absorption model was then used to perform radiation calculations for the jet flame on barrier configurations. Comparisons between the model and Test 4 data and the predicted effect of a 1-wall vertical barrier in reducing the radiation downstream of the barrier are shown in Fig. 7. The radiative heat flux is computed at a radial position of 137.6 cm from the jet centerline where the radiometers were located. Figure 7 also shows the predicted radiative heat flux (dashed curve) for the case of the jet flame centered on a 1-wall vertical barrier (Test 1) where the heat flux is plotted at the same radial distance from the jet centerline (137.6 cm). The predicted radiative heat flux for the case with the vertical barrier is larger than the free jet radiative heat flux upstream of the barrier and smaller than the free jet result downstream of the barrier. The sharp drop and increase in the predicted heat flux just upstream of the barrier is due to the lateral spread of the jet flame beyond 137.6 cm from the jet centerline as the jet flame turns from an axial jet into an axisymmetric laterally spreading jet at the barrier (see Fig. 6b).
Predictions of the isosurfaces for a radiative heat flux level of 4.7 kW/m2 for the 1-wall tilted barrier and the 3-wall barrier are compared with results for the 1-wall vertical barrier in Fig. 8. For the 3-wall barrier calculation the computational domain was extended upstream of the jet release by 330 cm and 1.96x10⁶ computational cells were used for the simulation. In Fig. 8a the 4.7 kW/m2 radiation heat flux isosurface extends farther in the downstream and vertical directions for the tilted barrier compared with the vertical barrier result. In Fig. 8b the 4.7 kW/m2 radiation heat flux isosurface has a larger vertical extent for the 3-wall barrier than for the 1-wall vertical barrier while the horizontal extent is approximately the same for the two cases.
Model results for the maximum axial and lateral distances to several radiative heat flux levels for the free hydrogen jet flame (Test 4) and the 3 barrier configurations (1-wall vertical, 1-wall tilted, and 3-wall) were computed [10]. For all heat flux levels the barriers reduce the axial distance to the specified radiation level significantly as compared to a free jet flame and only increase the lateral distance slightly. When comparing the various barrier configurations, the axial distance is greatest for the 1-wall tilted barrier and the lateral distance is largest for the 3-wall barrier.
3.2 Unignited Jet Concentration Envelope Simulations The purpose of this work was to address how barriers can reduce flammability envelope hazard distances for unignited releases of hydrogen. The same barrier (1-wall vertical, 1-wall tilted, 3-wall) and free jet configurations studied for the ignited jet barrier interaction simulations discussed in Section 3.1 were simulated for unignited conditions to calculate concentration envelopes. The jet exit boundary conditions used for the ignited simulations of the experiments were again used for the unignited simulations.

(a) Jet centered on 1-wall (b) Jet located at top of 1-wall (Test 2) (c) 1-wall tilted (Test 3) (d) 3-wall (Test 5) Figure 5. Hydrogen jet flame on barrier simulations for the 4 different experimental configurations.
(a) (b)
(c) Figure 6. Calculated isosurfaces for radiative heat flux of 4.7 kW/m2 from hydrogen jet flames; (a) free jet flame with ground plane; (b) jet flame directed toward center of 1-wall vertical barrier; (c) side view of isosurfaces shown in (a) and (b), comparing horizontal and vertical extent of radiation field without and with a barrier; jet flow is from right to left with distances in centimeters.

Figure 7. Comparison of measured and predicted (solid line) radiative heat flux from a horizontal free hydrogen jet flame along a line parallel to the jet. Also shown is the predicted heat flux (dashed line) when the jet flame is directed toward the center of the 1-wall vertical barrier. Predictions and data are for a lateral distance of 137.6 cm from the jet centerline. Predictions use an absorption coefficient scale factor and length scale of 0.2 and 100 cm, respectively and the TN quadrature with 12 ordinates.
(a) (b) Figure 8. Comparisons of side views of calculated isosurfaces of radiative heat flux levels of 4.7kW/m2 from hydrogen jet flames directed at barriers showing horizontal and vertical extent of radiation; (a) 1-wall tilted barrier and 1-wall vertical barrier superimposed; (b) 3-wall barrier and 1-wall vertical barrier superimposed; jet flow is from right to left. Figure 9a shows the unignited isosurfaces for hydrogen mole fractions of 4% and 8% for a horizontal jet impinging on the center of the 1-wall 2.4 m x 2.4 m (8 ft x 8 ft) tilted barrier. The 8% mole fraction surface extends to a maximum of 2.7 meters in the axial direction from the jet exit while the 4% mole fraction surface extends 4.4 meters. A calculation of the horizontal extent of the concentration decay for a free jet using the jet concentration scaling law [3] with the Mach disk pseudo-diameter indicates that the 8% mole fraction surface would extend 10.4 m from the jet exit while the 4% mole fraction surface would extend approximately 20.8m.
Figure 9b and 9c shows the 4% and 8% hydrogen mole fraction isosurfaces for the unignited jet impinging on the 1-wall vertical and 3-wall (135o between walls) barrier configurations, respectively. Figure 9 shows that the effect of these two barrier configurations is to confine the hydrogen to a region essentially upstream of the barriers, greatly reducing the downstream (axial) extent of the unignited release as compared to the case with no barrier or the 1-wall tilted barrier.
Simulations were performed for the different barrier configurations and for all concentration levels the barriers reduced the axial distance to the specified concentration level significantly as compared to a free jet. When comparing the various barrier configurations, the axial distance is greatest for the one-wall tilted barrier and shortest for the three-wall barrier [10].

(a)
(b)
(c) Figure 9. Calculated isosurfaces of 4% and 8% hydrogen mole fraction for unignited horizontal jets impinging on barriers with jet flow from right to left. (a) 1-wall tilted barrier; (b) 1-wall vertical barrier (c) 3-wall barrier with 135o between each wall. 3.3 Ignition Overpressure Simulations of Jet Barrier Impingement Releases The purpose of this work is to investigate the amount of overpressure produced from the ignition of an impinging jet release into a barrier and how that pressure is attenuated by the barrier. Simulations of jet releases into the 1-wall vertical and 3-wall 135o barrier configurations and the computation of the overpressure from ignition for various release times were performed using the FLACS [21] Navier-Stokes code. To begin the simulations, FLACS was used to model the overpressure measured from the 1-wall vertical barrier experiment (Test 1). The FLACS Jet Utility program was used to calculate the pseudo-diameter of the jet exit and the subsonic jet exit conditions for use as jet exit boundary conditions in the model. The pressure and temperature used to calculate the jet exit conditions were taken from measurements in the stagnation chamber of the experiment (Test 1) at the moment when the jet exit valve was fully opened (appox. 12.28MPa, 289K). For simulation of the experiments discussed in Section 2.0 the unignited jet simulation was allowed to run for 136 msec prior to initiating ignition. The ignition source was located in the model at 30.5 cm (12 in) in front of the wall and 12.7 cm (5 in) off the jet centerline at the 7 o’clock position (when looking at the wall) as in the Test 1 experiment. Pressure versus time monitors were placed in the model at the same locations where pressure transducers were placed in the Test 1 experiment. Figure 10a shows a comparison of the predicted and simulated overpressure pulse at pressure transducer P4 located on the front side of the wall (jet side) and pressure transducer P1 located on the back side (downstream) of the wall. Pressure transducer P4 is located 67.31cm (26.5 in) from the front wall and 118.1 cm (46.5 in) off the centerline of the wall at a distance of 6.35cm (2.5 in) off the ground. Pressure transducer P1 is located at a distance of 121.92cm behind the back side of the wall, 2.54 cm (1 in) off the centerline of the wall and 6.35 cm (2.5 in) off the ground. Figure 10a shows that the predicted peak overpressure on the front and back side (downstream) of the barrier is approximately 19% greater than the measured overpressure.
Simulations were also performed for larger ignition delay times for both the 1-wall vertical barrier configuration of Test 1 and the 3-wall barrier configuration of Test 5. The ignition position was kept the same for all simulations and corresponded to the ignition location for the experiments. Figure 10b shows the peak overpressure computed for simulations of the 1-wall vertical barrier and 3-wall barrier configurations as a function of the ignition delay time. The peak overpressure occurs near the front face of the central wall in both cases. Also shown on the plot is the temporal variation of the equivalent stoichiometric cloud [21] based on the volume of the unignited hydrogen/air cloud that
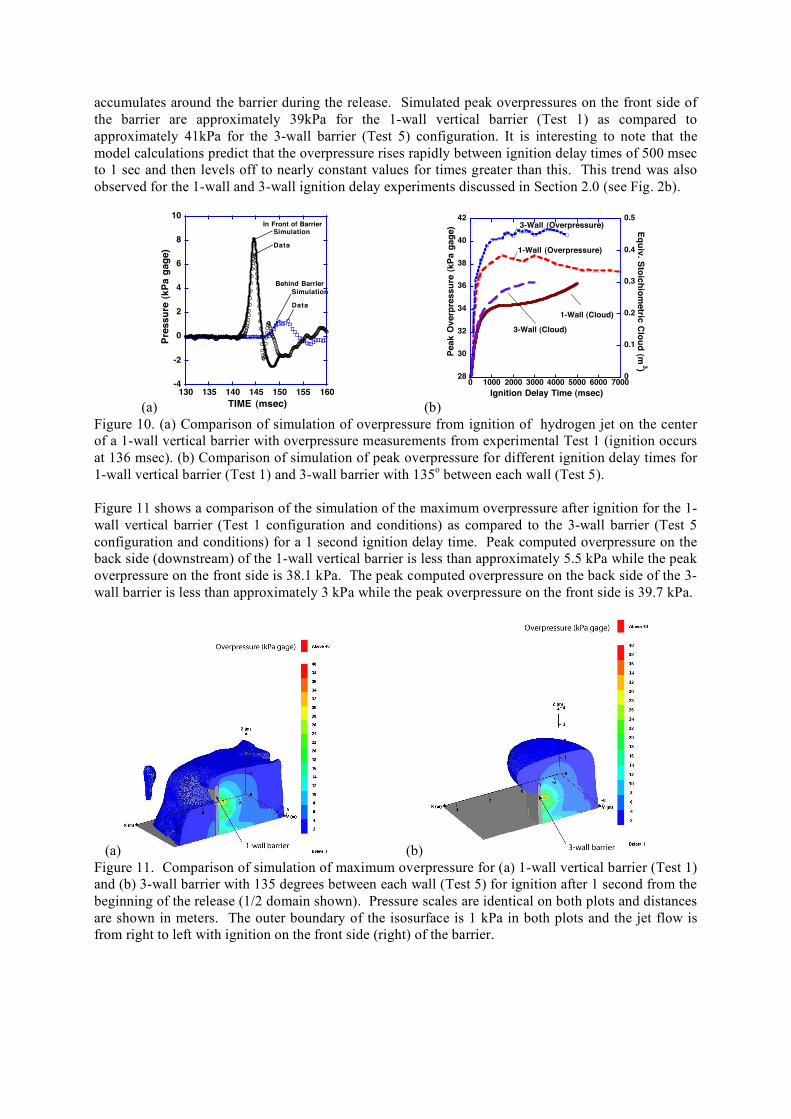
accumulates around the barrier during the release. Simulated peak overpressures on the front side of the barrier are approximately 39kPa for the 1-wall vertical barrier (Test 1) as compared to approximately 41kPa for the 3-wall barrier (Test 5) configuration. It is interesting to note that the model calculations predict that the overpressure rises rapidly between ignition delay times of 500 msec to 1 sec and then levels off to nearly constant values for times greater than this. This trend was also observed for the 1-wall and 3-wall ignition delay experiments discussed in Section 2.0 (see Fig. 2b).
(a)
-4
-2
0
2
4
6
8
10
130 135 140 145 150 155 160
Pre
ss
ure
(k
Pa
ga
ge
)
TIME (msec)
In Front of BarrierSimulation
Data
Behind Barrier
Simulation
Data
(b)
28
30
32
34
36
38
40
42
0
0.1
0.2
0.3
0.4
0.5
0 1000 2000 3000 4000 5000 6000 7000
Pe
ak
Ov
erp
res
su
re (
kP
a g
ag
e) E
qu
iv. S
toic
hio
me
tric C
lou
d (m
3)
Ignition Delay Time (msec)
1-Wall (Cloud)
3-Wall (Cloud)
1-Wall (Overpressure)
3-Wall (Overpressure)
Figure 10. (a) Comparison of simulation of overpressure from ignition of hydrogen jet on the center of a 1-wall vertical barrier with overpressure measurements from experimental Test 1 (ignition occurs at 136 msec). (b) Comparison of simulation of peak overpressure for different ignition delay times for 1-wall vertical barrier (Test 1) and 3-wall barrier with 135o between each wall (Test 5). Figure 11 shows a comparison of the simulation of the maximum overpressure after ignition for the 1-wall vertical barrier (Test 1 configuration and conditions) as compared to the 3-wall barrier (Test 5 configuration and conditions) for a 1 second ignition delay time. Peak computed overpressure on the back side (downstream) of the 1-wall vertical barrier is less than approximately 5.5 kPa while the peak overpressure on the front side is 38.1 kPa. The peak computed overpressure on the back side of the 3-wall barrier is less than approximately 3 kPa while the peak overpressure on the front side is 39.7 kPa.
(a) (b) Figure 11. Comparison of simulation of maximum overpressure for (a) 1-wall vertical barrier (Test 1) and (b) 3-wall barrier with 135 degrees between each wall (Test 5) for ignition after 1 second from the beginning of the release (1/2 domain shown). Pressure scales are identical on both plots and distances are shown in meters. The outer boundary of the isosurface is 1 kPa in both plots and the jet flow is from right to left with ignition on the front side (right) of the barrier.

4. SUMMARY AND CONCLUSION A combined experimental and simulation study has been performed to assess the effectiveness of barriers to reduce the hazard from unintended releases of hydrogen. For the conditions and configurations investigated, the barrier configurations were found to (1) reduce horizontal jet flame impingement hazard by deflecting the jet flame, (2) reduce radiation hazard distances for horizontal jet flames, and (3) reduce horizontal unignited jet flammability hazard distances. The results of this study show that the 3-wall 135o configuration was the most effective overall at mitigating the effects of overpressure, thermal radiation, and unignited jet release. For the 1-wall vertical barrier and 3-wall barrier configurations the simulations of the peak overpressure hazard from ignition were found to be approximately 40kPa on the release side of the barrier while approximately 5-3 kPa on downstream side of the barrier for jet source pressure up to approximately 51.8 MPa. Experiments and modeling of the effect of ignition delay time on barrier overpressure indicate that the barrier overpressure increases rapidly up to a delay time of approximately 1 sec and then levels off and remains fairly constant out to times of approximately 4 sec.
5.0 ACKNOWLEDGMENTS This work was supported by the U.S. Department of Energy, Office of Energy Efficiency and Renewable Energy under the Codes and Standards subprogram element managed by Antonio Ruiz.
6.0 REFERENCES 1. Schefer, R.W., Houf, W.G., Bourne, B., and Colton, J., “Spatial and Radiative Properties of an Open-Flame
Hydrogen Plume,” Int. Jour. of Hydrogen Energy, Vol. 31, 1332-1340, Aug., 2006. 2. Schefer, R.W., Houf, W.G., Williams, T.C., Bourne, B., and Colton, J., “Characterization of High-Pressure,
Under-Expanded Hydrogen-Jet Flames,” Int. Jour. of Hydrogen Energy, Vol. 32, 2081–2093, August, 2007. 3. Houf, W.G., and Schefer, R.W., “Predicting Radiative Heat Fluxes and Flammability Envelopes from
Unintended Releases of Hydrogen,” Int. Jour. of Hydrogen Energy, Vol. 32, 136-151, January 2007. 4. Shirvill, L.C. and Roberts, T.A., Designing for Safe Operations: Understanding the Hazards Posed by High
Pressure Leaks from Hydrogen Refuelling Stations, 2006 NHA Conference, March 12-16, Long Beach, CA, 2006.
5. Tanaka, T., Azuma, T., Evans, J.A., Cronon, P.M., Johnson, D.M. and Cleaver, R.P., Experimental Study on Hydrogen Explosions in a Full-Scale Hydrogen Filling Station, HYSAFE ICHS International Conference on Hydrogen Safety, Paper 120036, Pisa, Italy, Sept. 8-10, 2005.
6. Tchouvelev, A.V., Cheng, Z, Agranat, V.M. and Zhubrin, S.V., Effectiveness of Small Barriers as Means to Reduce Clearance Distances, Int. Jour. of Hydrogen Energy, Vol. 32, 1409-1415, 2007.
7. Schefer, R.W., Groethe, M., Houf, W.G., Evans, G.H., “Experimental Evaluation of Barrier Walls for Risk Reduction of Unintended Hydrogen Releases,” Int. Jour. of Hydrogen Energy, Vol. 34, 1590-1606, Feb. 2009.
8. Schefer, R.W., Houf, W.G., Groethe, M., Evans, G., Royle, M., Willoughby, D., “HYPER Report 5.4 – Report on Experimental Evaluation of Barrier Walls for Risk Reduction of Unintended Releases of Hydrogen,” Sept. 30, 2008
9. Houf, W.G., Evans, G.H., Schefer, R.W., “HYPER Report 4.3 – Releases, Fires, and Explosions Final Modelling Report, Chapter 6 – Effects of Barriers and Walls,” Aug. 31, 2008.
10. Houf, W.G., Evans, G., Schefer, R.W., Groethe, M., Meril, E., “Evaluation of Barrier Walls for Mitigation of Unintended Releases of Hydrogen,” 2009 NHA Conference, March 30 – April 3, Columbia, SC, 2009b.
11. American Institute of Chemical Engineers, Guidelines for Evaluating the Characteristics of Vapor Cloud Explosions, Flash Fires, and BLEVEs, Center for Chemical Process Safety of AICHE, 3 Park Ave., New York, NY, 1994.
12. Moen, C.D., Evans, G.H., Domino, S.P. and Burns, S.P., A Multi-Mechanics Approach to Computational Heat Transfer, proceedings 2002 ASME Int. Mech. Eng. Congress and Exhibition, New Orleans, IMECE2002-33098, Nov. 17-22, 2002.
13. Papageorgakis, G. C. and Assanis, D. N., Comparison of Linear and Nonlinear RNG-based k-e Models for

Incompressible Turbulent Flows, Num. Heat Transfer, Part B, Vol. 35, 1-22, 1999. 14. Magnussen, B. F., Modelling of NOx and Soot Formation by the Eddy Dissipation Concept, Int. Flame
Research Foundation 1st Topical Orientation Meeting, Amsterdam, 1989. 15. Burns, S. P., SYRINX – User’s Manual, unpublished Sandia National Laboratories Report, August 5, 1999. 16. Thurgood, C.P., Pollard, A., and Becker, H.A., “The TN Quadrature Set for the Discrete Ordinates Method,”
J. Heat Transfer, Vol. 117, 1068-1070, Nov. 1995 17. Leckner, B., Spectral and Total Emissivity of Water Vapor and Carbon Dioxide, Combustion and Flame,
Vol. 19, 33-48, 1972. 18. Houf, W. G., Evans, G., and Schefer, R. W., “Analysis of Jet Flames and Unignited Jets from Unintended
Releases of Hydrogen”, International Journal of Hydrogen Energy, In PRESS, Feb., 2009a. 19. Winters, W.S. and Evans, G.H., Final Report for the ASC Gas-Powder Two-Phase Flow Modeling Project
AD2006-09, Sandia National Laboratories Report No. SAND2006-7579. 20. 2006 International Fire Code, International Code Council, Inc., 2006. 21. FLACS Version 8 Users Guide, GEXCON, Bergen, Norway, 2003.