a snapshot of title i schools serving migrant students ...€¦ · web viewpolicy and program...
TRANSCRIPT

This is some
POLICY AND PROGRAM STUDIES SERVICE
A SA SNAPSHOTNAPSHOT OFOF T TITLEITLE I S I SCHOOLSCHOOLS S SERVINGERVING MMIGRANTIGRANT S STUDENTSTUDENTS, 2000–01, 2000–01
U.S. DEPARTMENT OF EDUCATIONDOC # 2003-03
OFFICE OF THE UNDER SECRETARY


A SA SNAPSHOTNAPSHOT OFOF T TITLEITLE I S I SCHOOLSCHOOLS S SERVINGERVING M MIGRANTIGRANT S STUDENTSTUDENTS, 2000–01, 2000–01
SHEILA NATARAJ KIRBYJENNIFER SLOAN MCCOMBS
SCOTT NAFTEL
RAND1200 SOUTH HAYES STREET
ARLINGTON, VIRGINIA 22202-5050
2003

This report was prepared for the U.S. Department of Education under Contract Number EA 97010001. The views expressed herein are those of the contractor. No official endorsement by the U.S. Department of Education is intended or should be inferred.
U.S. Department of EducationRoderick R. PaigeSecretary
Office of the Under Secretary Eugene HickokUnder Secretary
Policy and Program Studies ServiceAlan L. GinsburgDirector
Program and Analytic Studies DivisionDavid GoodwinDirector
October 2003
This report is in the public domain. Authorization to reproduce it in whole or in part is granted. While permission to reprint this publication is not necessary, the citation should be: U.S. Department of Education, Office of the Under Secretary, Policy and Program Studies Service, A Snapshot of Title I Schools Serving Migrant Students, 2000–01, Washington, D.C., 2003.
To order copies of this report, write:ED PubsEducation Publications CenterU.S. Department of EducationP. O. Box 1398Jessup, MD 20794-1398; via fax, dial (301) 470-1244;or via electronic mail, send your request to: [email protected] order online, point your Internet browser to: www.ed.gov/pubs/edpubs.html.This report is also available on the Department’s Web site at: www.ed.gov/about/offices/list/ous/ppss/index.html.On request, this publication is available in alternative formats, such as Braille, large print, audiotape, or computer diskette. For more information, please contact the Department’s Alternate Format Center (202) 260-9895 or (202) 205-8113.

CONTENTS
Introduction.......................................................................................................1
Data..................................................................................................................3
Limitations of Study..........................................................................................4
Definition of Key Terms....................................................................................5
Acknowledgments............................................................................................6
Key Findings.....................................................................................................7
Profile of Title I Schools Serving Migrant Students..........................................8
Standards.......................................................................................................15
Assessments..................................................................................................16
Provision of Title I Services............................................................................18
Parent Involvement in Schools.......................................................................22
Professional Development.............................................................................23
Schools Identified as In Need of Improvement Under Title I..........................25
Comprehensive School Reform Models.........................................................26

EXHIBITS
Exhibit 1. Title I Schools Serving Migrant Students................................................................................................................................................8Exhibit 2. School Poverty Level..............................................................................................................................................................................9Exhibit 3. Percentage Minority Students...............................................................................................................................................................10Exhibit 4. Percentage of Schools Serving Students with Limited English Proficiency...........................................................................................11Exhibit 5. Student Readiness for the Next Grade and Promotion Rates...............................................................................................................12Exhibit 6. Selected Teacher Characteristics.........................................................................................................................................................13Exhibit 7. Prevalence of Schoolwide Programs....................................................................................................................................................14Exhibit 8. Barriers to Using Content Standards with All Students.........................................................................................................................15Exhibit 9. Participation of Migrant Students in State Assessments.......................................................................................................................16Exhibit 10. Reporting of Disaggregated Assessment Results.................................................................................................................................17Exhibit 11. Programs to Extend the Learning Time of Students.............................................................................................................................18Exhibit 12. Programs for Non-Native English Speakers..........................................................................................................................................19Exhibit 13. Settings in Which Additional Instructional Services Were Provided......................................................................................................20Exhibit 14. Use of Teacher Aides to Provide Additional Instructional Services.......................................................................................................21Exhibit 15. Strategies to Increase Parent Involvement in Student Learning...........................................................................................................22Exhibit 16. Professional Development to Meet the Needs of Migrant Students......................................................................................................23Exhibit 17. Relationship Between Professional Development and Teacher Preparedness....................................................................................24Exhibit 18. Schools Identified as In Need of Improvement Under Title I.................................................................................................................25Exhibit 19. Adoption of Comprehensive School Reform Models.............................................................................................................................26Exhibit 20. Difficulty Implementing Comprehensive School Reform Models...........................................................................................................27

INTRODUCTION Migrant students1—children of migratory workers who relocate across school district boundaries in order to obtain seasonal or temporary employment in agriculture or fishing—are often at high risk of educational failure because of educational disruptions resulting from repeated moves and irregular attendance, language barriers, and poverty.2 Migrant farm workers in the United States typically follow one of three geographic migratory streams (East Coast, Midwest, and West Coast). The primary residence or homebase areas for all three streams are economically disadvantaged areas. In the East Coast stream, most workers have their primary homebase in southern Florida. These workers follow the crops northward to the mid-Atlantic states. In the Midwest stream, most farm workers use south Texas as their homebase and work winter crops there before moving up into the midwestern states. South Texas is the largest migrant homebase area in the nation. Some migrant farm workers from there move into the East and West Coast migrant streams. Most migrant farm workers in the West Coast stream use southern California as homebase. These workers follow crops north through Idaho, Oregon, and Washington.
The Migrant Education Program that operates under Title I, Part C, of the Elementary and Secondary Education Act (ESEA) was established to help migrant students overcome the challenges of mobility and other educational consequences of a migratory life. The goal of the program is to assist all migrant students in meeting challenging academic standards and achieving graduation from high school.
The No Child Left Behind Act of 2001 (NCLB) embodies four principles: stronger accountability for results; expanded flexibility and local control; an emphasis on teaching methods that have been proven to work; and expanded options for parents. For example, NCLB requires states to develop and implement challenging content and performance standards for all students, to adopt yearly assessments that are aligned with these standards, and to establish rigorous and explicit criteria for measuring school progress (adequate yearly progress or AYP). At the same time, schools with 40 percent or more of their students eligible for the free and reduced-price lunch program have been given increased flexibility in combining Title I funds with other sources of funding to implement schoolwide Title I programs, to improve the educational program for all students rather than just targeted Title I students. Schools are to be provided data on the performance of their students, disaggregated by a number of characteristics, including race-ethnicity, poverty status, limited English proficiency status, student disability status, gender, and migrant status, to foster data-driven decisionmaking.3 If schools fail to attain the AYP goal for two consecutive years, they are to be identified as in need of improvement under Title I and provided technical assistance to help them improve. In the first year of being identified as in need of improvement, schools must provide students the option of transferring to a better-performing school; in the second year, schools must also provide eligible students supplemental educational services from approved providers (including outside groups). If schools fail to make progress for two years after being identified for improvement, they are subject to “corrective action” by districts, including replacing school staff, imposition of a new 1In ESEA §1309(2), a migrant student is defined as “a child who is, or whose parent or spouse is, a migratory agricultural worker, including a migratory dairy worker, or a migratory fisher, and who, in the preceding 36 months, in order to obtain, or accompany such a parent or spouse, in order to obtain, temporary or seasonal employment in agricultural or fishing work has moved from one school district to another.”2Parsad, B., Heaviside, S., Williams, C., Farris, E., & Greene, B. (2000). Participation of migrant students in Title I Migrant Education Program (MEP) summer-term projects, 1998. Washington, DC: U.S. Department of Education; Strang, W. & von Glatz, A. (1999). Meeting the needs of migrant students in schoolwide programs: Summary. Washington, DC: U.S. Department of Education.3The definition of adequate yearly progress for schools includes separate objectives for improvement in the achievement of students grouped by these categories, with the exception of gender and migrant status.
Page 1 | A Snapshot of Title I Schools Serving Migrant Students, 2000–01

curriculum, significantly decreased management authority, or restructuring. Many of these provisions were first introduced by the 1994 reauthorization of the ESEA. As such, understanding the progress that Title I schools made in implementing the provisions of the 1994 legislation and the challenges they faced in doing so should offer useful lessons for the implementation of NCLB.
The U.S. Department of Education conducted a nationally representative survey of Title I schools—the National Longitudinal Survey of Schools (NLSS)—to examine the implementation of the 1994 provisions in Title I schools across the nation. The NLSS included an over-sample of schools serving significant proportions of migrant students. Principals and a sample of teachers in these schools were surveyed annually from school year (SY) 1998–99 through 2000–01.
An earlier report4 presented data from the first year of the NLSS, 1998–99, to address two main evaluation questions:
How did Title I schools with migrant students compare with Title I schools with no migrant students in terms of their social, demographic, and organizational characteristics?
How were the provisions of Title I being implemented in Title I schools with migrant students, compared with Title I schools with no migrant students?
This report uses a series of exhibits to present a snapshot of Title I schools serving migrant students on the eve of the passage of NCLB . In addition to updating the information provided in the earlier report, this report also focuses on a third evaluation question:
What progress did these schools make over time between 1998–99 and 2000–01 in terms of implementation of the provisions of the 1994 legislation?
For purposes of the report, schools are classified as Title I high-migrant schools (those with 15 or more migrant students),Title I low-migrant schools (those with 1–14 migrant students), or Title I schools with no migrant students. In what follows, we sometimes combine low-migrant and high-migrant schools, referring to them as “Title I schools with migrant students.”
In the remainder of this report, we largely focus on findings as of 2000–01, although we do comment on significant differences between 1998–99 and 2000–01. Tracking differences over time was not always possible because some questions were added to the surveys in 2000–01; some questions that had been present in earlier years were deleted; and the wording of some questions changed over time, making trend comparisons difficult. In addition, small sample sizes mean that differences across categories or over time are often not statistically significant. 5 Nonetheless, we report on these changes when they provide useful information, even if they fail to meet conventional standards of statistical significance.
DATAThe NLSS was based on a nationally representative sample of Title I schools in SY 1998–99. Schools serving significant proportions of migrant students, Native American students, or students with limited English proficiency, and schools that had been identified as in need of improvement 4Kirby, S. N., Naftel, S., Berends, M., & Sloan, J. S. (2002). Title I schools serving migrant students: Recent evidence from the National Longitudinal Survey of Schools. Washington, DC: U.S. Department of Education. (www.ed.gov/offices/OESE/OME/pubs.html)5Throughout this report, the term “significant” is used in the statistical sense to indicate that the difference between two estimates was statistically significant at the .05 level.
Page 2 | A Snapshot of Title I Schools Serving Migrant Students, 2000–01

were over-sampled.6 Designed and conducted by Westat, the principal and teacher surveys of the NLSS were first fielded during 1998–99; schools that remained in Title I status were followed for the next two years through 2000–01.7
The total sample size for the NLSS was 1,507 schools. The number of schools responding in 1998–99 was 1,081, in 1999–2000, 987, and 2000–01, 967. In schools that provided teacher rosters, up to six teachers were sampled in each school: a Title I teacher (where present), mathematics teachers, and reading, language arts, or English teachers.8 The total number of teachers completing the survey was over 5,000 in each year of the survey.
Sample Size of Title I Schools with Migrant Students in the NLSS, 1998–99 and 2000–01Table 1 presents the sample sizes of Title I schools in the NLSS by school level and migrant status: Title I schools with 15 or more migrant students (high-migrant schools); Title I schools with 1–14 migrant students (low-migrant schools); and Title I schools with no migrant students. Migrant status is based on principal reports about the number of migrant students in the school in each year.
Of the 1,507 schools in the sample, a total of 806 schools responded in both 1998–99 and 2000–01. The majority of schools remained in the same classification across the years, with the most movement occurring among schools originally classified as low-migrant schools shifting into one of the other two categories. A total of 159 schools that had failed to respond in 1998–99 responded in 2000–01. About 70 percent of these were schools with no migrant students; the remaining were evenly divided between the other two categories.
6Sample weights were adjusted for over-sampling of schools, nonresponse, and overlap with other studies that examined Title I schools.7Schools were determined to be ineligible for inclusion in the study if they were no longer classified as a Title I school at the time of the survey; the principal screener was not completed; or for other reasons such as school closures, mergers, or changes in the grade levels served. The design of the NLSS did not include refreshing the sample in subsequent years as schools moved in and out of Title I status.8The sample of teachers was independently chosen in Year 2 and Year 3; thus, there was no longitudinal sample of teachers.
Page 3 | A Snapshot of Title I Schools Serving Migrant Students, 2000–01

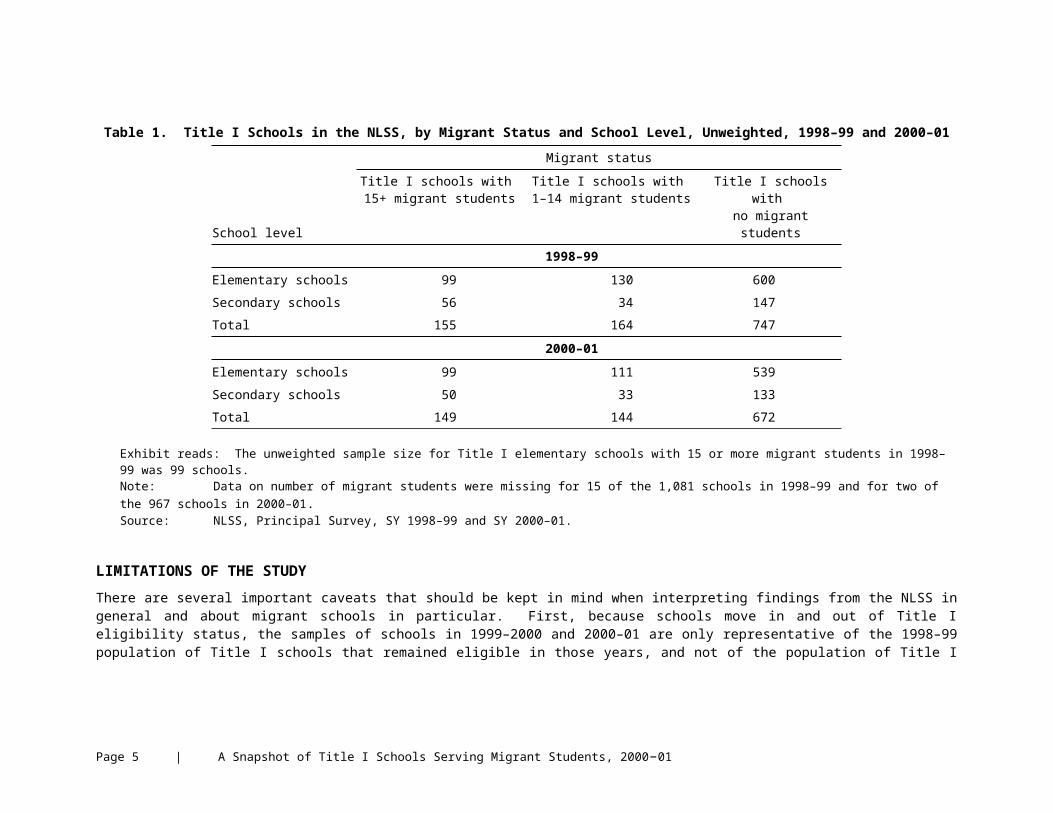
Table 1. Title I Schools in the NLSS, by Migrant Status and School Level, Unweighted, 1998–99 and 2000–01
School level
Migrant status
Title I schools with 15+ migrant students
Title I schools with 1–14 migrant students
Title I schools with no migrant students
1998–99Elementary schools 99 130 600Secondary schools 56 34 147Total 155 164 747
2000–01Elementary schools 99 111 539Secondary schools 50 33 133Total 149 144 672
Exhibit reads: The unweighted sample size for Title I elementary schools with 15 or more migrant students in 1998–99 was 99 schools.Note: Data on number of migrant students were missing for 15 of the 1,081 schools in 1998–99 and for two of the 967 schools in 2000–01.Source: NLSS, Principal Survey, SY 1998–99 and SY 2000–01.
LIMITATIONS OF THE STUDYThere are several important caveats that should be kept in mind when interpreting findings from the NLSS in general and about migrant schools in particular. First, because schools move in and out of Title I eligibility status, the samples of schools in 1999–2000 and 2000–01 are only representative of the 1998–99 population of Title I schools that remained eligible in those years, and not of the population of Title I schools in 1999–2000 or 2000–01. As a result, the distribution by migrant status is not nationally representative in the latter two years.
Second, it is important to keep in mind that the analyses reported here are based on survey data, which rely on respondents’ self-reports.
Third, an important limitation of the study arises from the fact that the NLSS is a snapshot in time. As a result, the classification may be subject to error if there were changes in the number of migrant students over time. Further, other studies have found that identification of migrant students is a problem, so counts of migrant students are subject to error. An additional potential limitation of using the number of migrant students as the threshold, rather than percentages, is that larger schools are much more likely to be classified as high-migrant schools.
Fourth, as is clear from Table 1, sample sizes for secondary schools with migrant students are quite small. As a result, the estimates reported here for secondary schools have large standard errors, making these estimates imprecise. Often, the findings regarding secondary schools must be viewed as suggestive rather than statistically meaningful.
Page 4 | A Snapshot of Title I Schools Serving Migrant Students, 2000–01

Fifth, several of the differences we report here are similar to differences we find between Title I low-poverty (defined as schools with less than 35 percent of their students eligible for the free and reduced-price lunch program) and highest-poverty schools (defined as schools with 75 percent or more of their students eligible for the free and reduced-price lunch program). Small sample sizes make it difficult to determine the degree to which poverty and migrant status contributed independently to the differences reported here.
DEFINITION OF KEY TERMSTitle I School: School receiving Title I funds.
School Poverty Level: Measured by the percentage of students eligible for the free and reduced-price lunch program. Schools are categorized as follows, based on the percentage of students eligible for the free and reduced-price lunch program: “highest-poverty” (≥75 percent); “high-poverty” (≥50 percent); “low-to-medium poverty” (35–49.9 percent); and “low-poverty” (<35 percent).
Percentage Minority Students: Measured by the percentage of students who were classified as other than “white, non-Hispanic.” Schools are categorized as follows, based on the percentage of minority students: “highest-minority” (≥75 percent); “high-minority” (≥50 percent); “low-to-medium minority” (25–49.9 percent); and “low-minority” (<25 percent).
Schoolwide Schools: Schoolwide programs allow high-poverty (≥50 percent) schools to use Title I money in combination with other federal, state, and local funds, to improve the entire educational program for all their students (rather than just targeted Title I students). 9 Schools that do not meet the eligibility criteria can sometimes get a waiver to operate schoolwide programs.
Targeted Assistance Schools: Targeted assistance programs use Title I funds to provide services to students identified as failing or most at risk of failing to meet a state’s content and student performance standards.
Significant: The term is used in the statistical sense to indicate that the difference between the estimates being compared was statistically significant at the 0.05 level.
NOTES The exhibits report weighted estimates. Each exhibit is accompanied by an “Exhibit reads” below the graph or table. This is not intended to highlight the key points of the exhibit or
statistically significant findings, but simply to illustrate how to read the first few data points on the exhibit. The text in the main body of the exhibit discusses key points and where appropriate, the statistical significance of the findings. The exhibits report estimates that have been rounded. As a result, numbers may not total 100 percent.
9As mentioned, the 2001 legislation expanded eligibility for operating schoolwide programs from schools with 50 percent or more of their students eligible for the free and reduced-price lunch program to schools with 40 percent or more of their students eligible for the free and reduced-price lunch program.
Page 5 | A Snapshot of Title I Schools Serving Migrant Students, 2000–01
ACKNOWLEDGMENTSWe thank Susan Sanchez and Daphne Hardcastle, the former and current Contracting Officer’s Representative (COR) for the NLSS and Babette Gutmann of Westat, the Project Director of the NLSS, for their support of this study. We thank Francisco Garcia and Alex Goniprow for their interest in this project and Stephanie Stullich and Beth Franklin for useful comments on earlier versions of this report. We are grateful to the following RAND colleagues for their assistance with this report: Paul Arends, our editor, Heather Barney, our research assistant, Stephen Bloodsworth, our graphics artist, and Carolyn Rowe, our administrative assistant.
Most of all, we thank the teachers, principals, and staff in the studied schools who gave of their time to participate in the surveys.
Page 6 | A Snapshot of Title I Schools Serving Migrant Students, 2000–01

KEY FINDINGS
In 2000–01, 24 percent of Title I schools served migrant students. Ten percent of Title I schools were high-migrant schools, serving 15 or more migrant students, and 14 percent were low-migrant schools, serving 1–14 migrant students.
Compared with Title I schools with no migrant students, Title I schools with migrant students had higher student poverty levels and served higher proportions of minority students and students with limited English proficiency.
Compared with principals in Title I schools with no migrant students, principals in Title I high-migrant schools were more likely to report:
Offering programs to extend the learning time of students (such as before- and after-school instructional programs or extended school-year programs);
Employing higher percentages of inexperienced teachers, but also higher percentages of teachers certified or with an endorsement in English as a Second Language (ESL) or English Language Development (ELD);
Having a higher percentage of students who were not prepared to work at the next grade level; and
Perceiving diversity of student populations and lack of English language proficiency as barriers to using content standards with all students.
Principals in Title I schools with migrant students reported that about 90 percent of migrant students at both the elementary and secondary level participated in state or district assessments in 2000–01. The participation rate of migrant students in assessments had increased over time.
In 2000–01, only 40 percent of low-migrant schools and 50 percent of high-migrant schools received assessment results disaggregated by migrant status of students.
Less than 30 percent of teachers who taught migrant students in Title I schools with migrant students reported receiving professional development in instructional strategies to teach migrant students, although most of the teachers who did not receive such professional development desired it.
Title I schools with migrant students appeared to be making greater efforts to involve parents both at school and at home, compared with Title I schools with no migrant students. These parent involvement strategies included parent training and literacy programs, providing translations of school documents into other languages, and sending home activities in reading and mathematics for parents to do at home with students.
Page 7 | A Snapshot of Title I Schools Serving Migrant Students, 2000–01
Exhibit 1 Profile of Title I Schools Serving Migrant Students
Title I Schools Serving Migrant Students
SOURCE: NLSS Principal Survey, SY 1998–99 and SY 2000–01.
Page 8 | A Snapshot of Title I Schools Serving Migrant Students, 2000–01
In 2000–01, 10 percent of Title I schools were high-migrant schools, serving 15 or more migrant students, 14 percent were low-migrant schools, serving 1–14 migrant students, and 76 percent had no migrant students. This was similar to the distribution of schools by migrant status in 1998–99. In Title I high-migrant schools, migrant students numbered 83 on average and accounted for about 15 percent of total enrollment on average (range was between 0.5 percent and 73 percent). On average, Title I low-migrant schools served about 5 migrant students, and migrant students accounted for 2.5 percent of enrollment in these schools (range was between 1 percent and 33 percent).
Percentage of Title I Schools Categorized by Migrant Status of School, 2000–01
Exhibit reads: Ten percent of Title I schools were high-migrant schools, serving 15 or more migrant students.
Page 9 | A Snapshot of Title I Schools Serving Migrant Students, 2000–01

Exhibit 2 Profile of Title I Schools Serving Migrant Students
School Poverty Level
SOURCE: NLSS Principal Survey, SY 1998–99 and SY 2000–01.
Title I schools with migrant students tended to be much poorer than Title I schools with no migrant students. About 72 percent of Title I high-migrant schools were high-poverty schools, with 50 percent or more of their students eligible for the free and reduced-price lunch program, compared with 55 percent of Title I low-migrant schools and 51 percent of Title I schools with no migrant students. Indeed, 40 percent of high-migrant schools were in the highest-poverty category, with 75 percent or more of students eligible for the free and reduced-price lunch program, compared with 21 percent of Title I schools with no migrant students. High-migrant schools appeared to have become poorer over time. For example, 40 percent of these schools were in the highest-poverty category in 2000–01, compared with 31 percent in 1998–99, although the change was not statistically significant.
School Poverty Level: Title I Schools Categorized by Migrant Status of School, 2000–01
Exhibit reads: About 40 percent of Title I high-migrant schools were in the highest-poverty category, compared with 32 percent of Title I low-migrant schools and 21 percent of Title I schools with no migrant students.
Page 10 | A Snapshot of Title I Schools Serving Migrant Students, 2000–01

Exhibit 3 Profile of Title I Schools Serving Migrant Students
Percentage Minority Students
SOURCE: NLSS Principal Survey, SY 2000–01.
Schools with migrant students served disproportionately high numbers of minority students. In 2000–01, 71 percent of high-migrant schools were high-minority schools serving student populations with 50 percent or more minority students, compared with 46 percent of Title I low-migrant schools and 27 percent of Title I schools with no migrant students. Indeed, about 66 percent of Title I high-migrant schools were both high-poverty and high-minority schools, compared with 39 percent of Title I low-migrant schools and 24 percent of Title I schools with no migrant students.
Percentage Minority Students: Title I Schools Categorized by Migrant Status of School, 2000–01
Exhibit reads: About 55 percent of Title I high-migrant schools were in the highest-minority category, compared with 32 percent of Title I low-migrant schools and 18 percent of Title I schools with no migrant students.
Page 11 | A Snapshot of Title I Schools Serving Migrant Students, 2000–01

Exhibit 4 Profile of Title I Schools Serving Migrant Students
Percentage of Schools Serving Students with Limited English Proficiency
SOURCE: NLSS Principal Survey, SY 2000–01.
Many migrant students also have limited English proficiency, so it is not surprising that migrant schools served a higher proportion of students with limited English proficiency than did schools with no migrant students. Over one-third (35 percent) of high-migrant schools served student populations in which 50 percent or more of students had limited English proficiency, compared with 9 percent of low-migrant schools and 2 percent of schools with no migrant students. Over half (54 percent) of the Title I high-migrant schools served student populations with 25 percent or more of students with limited English proficiency, compared with 21 percent of the Title I low-migrant schools and 7 percent of the Title I schools with no migrant students.
Percentage of Schools Serving Students with Limited English Proficiency: Title I Schools Categorized by Migrant Status of School, 2000–01
Exhibit reads: Thirty-five percent of high-migrant schools served student populations where 50 percent or more of the students had limited English proficiency, compared with 9 percent of low-migrant schools and only 2 percent of schools with no migrant students.
Page 12 | A Snapshot of Title I Schools Serving Migrant Students, 2000–01

Exhibit 5 Profile of Title I Schools Serving Migrant Students
Student Readiness for the Next Grade and Promotion Rates
SOURCE: NLSS Principal Survey, SY 2000–01.
While principals in Title I high-migrant schools reported that 22 percent of elementary students and 34 percent of secondary students were not prepared to work at the next grade level, principals in schools with no or low numbers of migrant students reported that 16–19 percent of their students were not ready for the next grade at both the elementary and secondary levels. The difference was statistically significant in the case of elementary schools. In spite of this, only 5 percent of students in high-migrant elementary schools and 4 percent of students in high-migrant secondary schools were not promoted to the next grade level.
Principal Reports About Percentage of Students Not Prepared to Work at the Next Grade Level and Percentage Not Promoted: Title I Schools Categorized by School Level and Migrant Status of School, 2000–01
Exhibit reads: Among Title I elementary schools, principals in high-migrant schools reported that 22 percent of students were not prepared to work at the next grade level, compared with 16 percent of students reported by principals in low-migrant schools and 17 percent of students reported by principals in r schools with no migrant students.
Page 13 | A Snapshot of Title I Schools Serving Migrant Students, 2000–01

Exhibit 6 Profile of Title I Schools Serving Migrant Students
Selected Teacher Characteristics
SOURCE: NLSS Principal Survey, SY 2000–01; NLSS Teacher Survey, SY 2000–01.
Page 14 | A Snapshot of Title I Schools Serving Migrant Students, 2000–01

Principals in Title I high-migrant schools reported higher percentages of inexperienced teachers (defined as those with less than three years of experience) than did principals in schools with no or low numbers of migrant students. For example, in Title I high-migrant elementary schools, about 17 percent of teachers were inexperienced, compared with 11 percent of teachers in schools with no or low numbers of migrant students, and this difference was statistically significant. The difference at the secondary level (19 percent versus 15 percent) was not statistically significant (not shown).
Teachers in high-migrant schools were significantly more likely to have an endorsement or certification in English as a Second Language (ESL) or English Language Development (ELD). For example, about 44 percent of elementary teachers in high-migrant schools were certified or had an endorsement in these fields, compared with 27 percent of elementary teachers in schools with no migrant students. The corresponding numbers for secondary schools (not shown) were 49 and 19 percent.
Selected Teacher Characteristics: Title I Elementary Schools Categorized by Migrant Status of School, 2000–01
Exhibit reads: Among Title I elementary schools, principals in high-migrant schools reported that 17 percent of their teachers had less than three years of experience, compared with 11 percent reported by principals in low-migrant schools or schools with no migrant students.
Page 15 | A Snapshot of Title I Schools Serving Migrant Students, 2000–01

Exhibit 7 Profile of Title I Schools Serving Migrant Students
Prevalence of Schoolwide Programs
SOURCE: NLSS Principal Survey, SY 1998–99 and SY 2000–01.
Page 16 | A Snapshot of Title I Schools Serving Migrant Students, 2000–01

Title I schoolwide programs allow schools to use Title I funds for all students in the school rather than targeting Title I funds solely to Title I students. In 2000–01, 64 percent of Title I high-migrant schools operated schoolwide programs, as did 69 percent of low-migrant Title I schools and 57 percent of Title I schools with no migrant students. The use of schoolwide programs rose significantly over time among high-migrant schools and schools with no migrant students.
Percentage of Schools Adopting Schoolwide Programs: Title I Schools Categorized by Migrant Status of School, 1998–99 and 2000–01
Exhibit reads: The percentage of Title I high-migrant schools operating schoolwide programs increased from 57 percent in 1998–99 to 64 percent in 2000–01.
Page 17 | A Snapshot of Title I Schools Serving Migrant Students, 2000–01
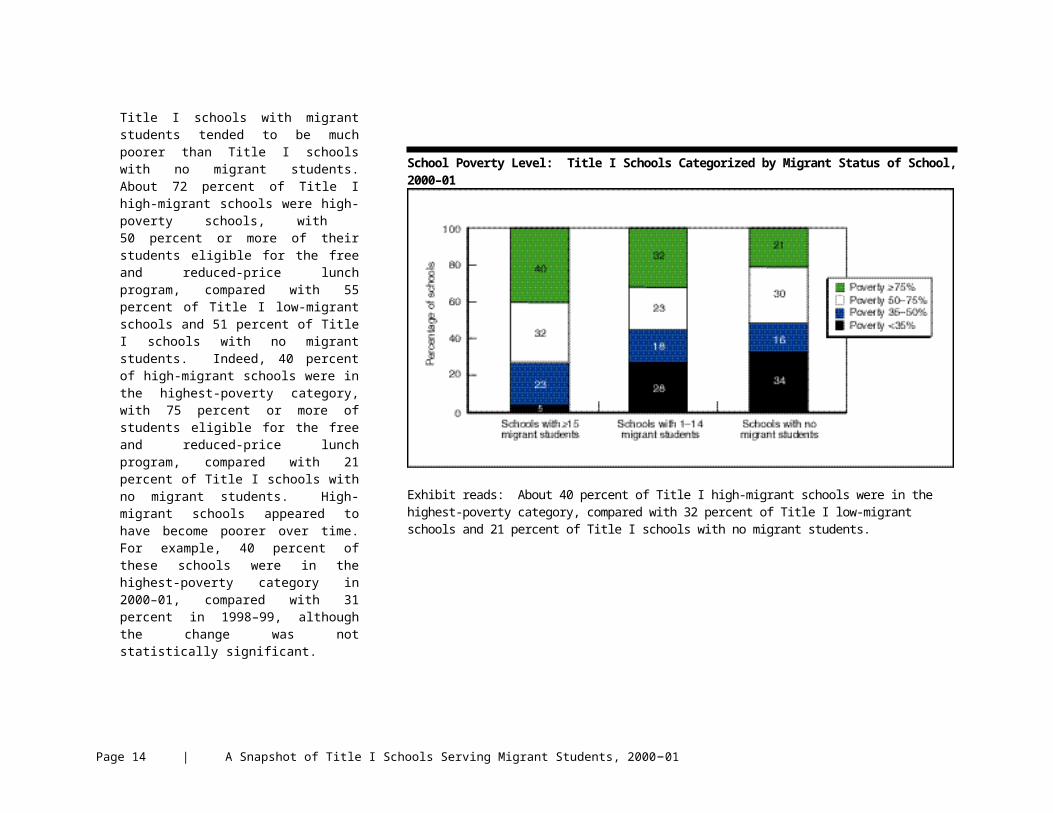
Exhibit 8 Standards
Barriers to Using Content Standards with All Students
NOTE: Questions asked of principals who reported that their school used content standards.
SOURCE: NLSS Principal Survey, SY 2000–01; NLSS Teacher Survey, SY 2000–01.
Principals of high-migrant elementary schools reported lack of English language proficiency, diversity of student populations, and lack of parent support as important barriers to using content standards with all students. The differences in reports between high-migrant schools and schools with no migrant students with respect to diversity of student populations and lack of English language proficiency were statistically significant. Among secondary schools (not shown), lack of English language proficiency was mentioned as a barrier “to a great extent” by 48 percent of principals of high-migrant schools, compared with 6 percent of principals in schools with no migrant students.
On a related item on the teacher survey, teachers in high-migrant schools were much more likely to report lack of basic skills, lack of student motivation, and high student mobility as problems preventing all students from achieving at high levels, compared with teachers in schools with no migrant students.
Percentage of Principals Reporting Perceived Barriers “to a Great Extent” in Using Content Standards with All Students: Title I Elementary Schools Categorized by Migrant Status of School, 2000–01
Exhibit reads: Among Title I elementary schools, about 32 percent of principals in high-migrant schools reported that lack of English language proficiency was a barrier “to a great extent” in using content standards with all students, compared with 13 percent of principals in low-migrant schools and 5 percent of principals in schools with no migrant students.
Page 18 | A Snapshot of Title I Schools Serving Migrant Students, 2000–01

Exhibit 9 Assessments
Participation of Migrant Students in State Assessments
NOTE: Questions were asked of principals who reported that their school participated in the state or district assessment.
SOURCE: NLSS Principal Survey, SY 1998–99 and SY 2000–01.
Principals were asked about the participation of migrant students in their state’s assessment (in the grade levels tested) in the previous year. According to principals, 68–75 percent of migrant students in elementary schools with migrant students participated in the 1997–98 assessments; the percentage varied much more in secondary schools, depending on the migrant status of the school—84 percent in high-migrant schools and 54 percent in low-migrant schools. Migrant student participation in the 1999–2000 assessments was significantly higher in high-migrant elementary schools (90 percent) and in low-migrant secondary schools (95 percent), compared with participation in the 1997–98 assessments.
Percentage of Migrant Students Participating in State Assessments: Title I Schools Categorized by School Level and Migrant Status of School, 1997–98 to 1999–2000
Exhibit reads: The percentage of migrant students participating in the state assessment in Title I high-migrant elementary schools increased over time, from 75 percent in 1997–98 to 90 percent in 1999–2000.
Page 19 | A Snapshot of Title I Schools Serving Migrant Students, 2000–01

Exhibit 10 Assessments
Reporting of Disaggregated Assessment Results
NOTE: Questions were asked of principals who reported that their school participated in the state or district assessment. Questions regarding migrant status and limited English proficiency status were asked only of principals in schools with migrant students or more than 10 percent of students with limited English proficiency in 1998–99 or any students with limited English proficiency in later years. For comparability, data shown are for schools with more than 10 percent of students with limited English proficiency.
SOURCE: NLSS Principal Survey, SY 1998–99 and SY 2000–01.
States were required to provide state assessment data that were disaggregated for a variety of student subgroups in all schools, if the data were statistically sound and final assessments were in place. However, states were not required to have final assessments in place until 2000–01, and many states were using transitional assessments at the time of this study. Only 50 percent of high-migrant elementary schools and 37 percent of low-migrant elementary schools received results disaggregated by migrant status. The comparable numbers for secondary schools were 42 and 46 percent.
Title I high-migrant elementary schools were somewhat more likely to receive assessment results disaggregated by race-ethnicity, Title I participation, and poverty status, compared with schools that had no migrant students. Similar differences existed with respect to secondary schools. The differences were significant with respect to Title I participation and poverty status at both the elementary and secondary levels.
Percentage of Schools Receiving Assessment Results Summarized by Subgroups of Students: Title I Elementary Schools Categorized by Migrant Status of School, 2000–01
Exhibit reads: In 2000–01, 50 percent of Title I high-migrant elementary schools and 37 percent of Title I low-migrant elementary schools received assessment results disaggregated by migrant status of students.
Page 20 | A Snapshot of Title I Schools Serving Migrant Students, 2000–01

Exhibit 11 Provision of Title I Services
Programs to Extend the Learning Time of Students
SOURCE: NLSS Principal Survey, SY 2000–01.
Before- or after-school programs and summer programs were relatively common across all Title I schools, while extended school-year programs or weekend programs were somewhat less prevalent. Overall, about 95 percent of high-migrant schools offered at least one program to extend the learning time of students, compared with 84 percent of schools with no migrant students, and the difference was statistically significant.
At the elementary level, schools with migrant students were more likely to have extended school-year or weekend programs than schools with no migrant students. In general, high-migrant secondary schools were significantly more likely to offer extended learning time in the form of before- or after-school programs and summer or intersession programs, compared with schools with no migrant students. For example, 95–99 percent of high-migrant secondary schools had before- or after-school programs or summer or intersession programs, compared with 77 percent (before- or after-school programs) and 62 percent (summer or intersession programs) of schools with no migrant students.
Prevalence of Programs to Extend Instructional Time: Title I Schools Categorized by School Level and Migrant Status of School, 2000–01
Exhibit reads: At the elementary level, 73 percent of Title I high-migrant schools offered before- or after-school instructional programs, as did 62 percent of low-migrant schools and 65 percent of schools with no migrant students.
Page 21 | A Snapshot of Title I Schools Serving Migrant Students, 2000–01

Exhibit 12 Provision of Title I Services
Programs for Non-Native English Speakers
NOTE: Questions were asked of principals in schools with more than 10 percent of students with limited English proficiency.
SOURCE: NLSS Principal Survey, SY 2000–01.
In 2000–01, 94 percent of elementary schools and 78 percent of secondary schools provided services that were designed to teach English language skills to students with limited English proficiency. Eighty-nine percent of high-migrant elementary schools provided such services, and 52 percent funded them through Title I. Almost all high-migrant secondary schools (99 percent) provided such services, compared with 61 percent of schools with no migrant students, and this difference was statistically significant. Most of the high-migrant secondary schools used Title I funds for this purpose.
About 55 percent of elementary schools and 47 percent of secondary schools offered services in students’ native languages, such as bilingual education to teach content areas (not shown). There was no significant difference by migrant status.
Percentage of Schools Offering Services to Teach English to Students with Limited English Proficiency, by Whether Services Were Funded by Title I: Title I Schools Categorized by School Level and Migrant Status of Schools, 2000–01
Exhibit reads: Eighty-nine percent of Title I high-migrant elementary schools offered services to teach English to students with limited English proficiency, and 52 percent funded these services through Title I.
Page 22 | A Snapshot of Title I Schools Serving Migrant Students, 2000–01

Exhibit 13 Provision of Title I Services
Settings in Which Additional Instructional Services Were Provided
NOTE: Questions asked of classroom teachers who reported having students who received additional instructional services. Data shown are as a percentage of all elementary teachers.
Although the exhibit refers to “additional instructional services,” students receiving these services, particularly in pullout settings, may be missing part of their regular instruction.
SOURCE: NLSS Teacher Survey, SY 2000–01.
Teachers were asked whether any of their students received additional instructional services in reading or mathematics, and if so, in what setting students received this instruction. Overall, about 87 percent of teachers in elementary and secondary schools reported that their students received additional instructional services in class, in a pullout setting, and/or through extended learning time, such as a before- or after-school instructional program. Despite the emphasis in the 1994 ESEA reauthorization on minimizing pullout programs, additional instructional services were much more likely to be provided in a pullout setting than in an in-class setting across all types of schools. For example, 64–72 percent of elementary teachers reported that these services were provided in pullout settings, compared with 41–53 percent who reported that their students received additional services in class. However, about 34 percent of elementary teachers reported that students received additional services in both pullout and in-class settings, and 20 percent reported that students received services in all three settings.
Compared with teachers in elementary schools with no migrant students, teachers in high-migrant elementary schools were significantly more likely to report that services were provided through extended learning time programs (52 percent versus 39 percent). The results were similar for secondary school teachers.
Reports of Classroom Teachers of How Additional Instructional Services Were Provided: Title I Elementary Schools Categorized by Migrant Status of the School, 2000–01
Exhibit reads: In Title I high-migrant elementary schools, 41 percent of teachers reported that additional instructional services were provided in class, 72 percent in a pullout setting, and 52 percent through an extended learning time program.
Page 23 | A Snapshot of Title I Schools Serving Migrant Students, 2000–01
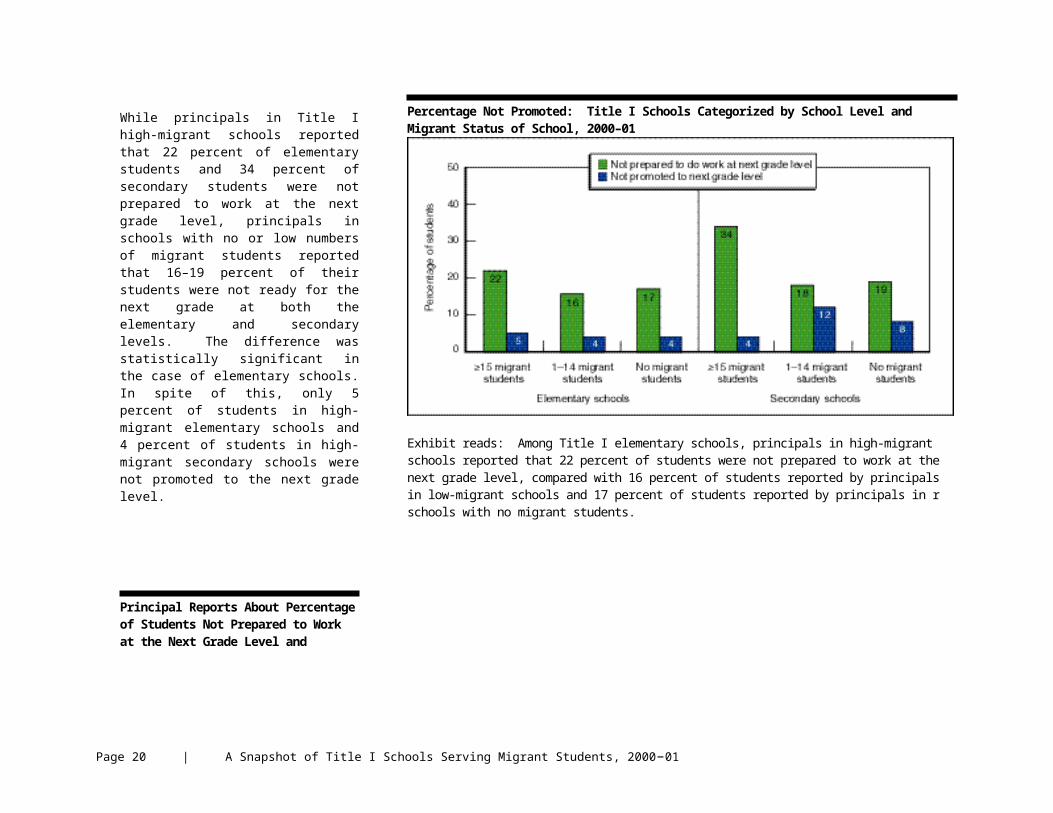
Exhibit 14 Provision of Title I Services
Use of Teacher Aides to Provide Additional Instructional Services
NOTE: Questions about teacher aides were only asked of principals who reported having teacher aides in the school. Data shown are as a percentage of all Title I schools.
Although the exhibit refers to “additional instructional services,” students receiving these services, particularly in pullout settings, may be missing part of their regular instruction.
SOURCE: NLSS Principal Survey, SY 2000–01.
Overall, 47 percent of principals in all Title I schools reported using teacher aides to provide additional instruction in reading. About 31 percent of elementary school principals and 45 percent of secondary school principals reported using teacher aides to provide additional instruction in mathematics. High-migrant elementary schools were somewhat more likely to use teacher aides to provide additional instruction in reading and mathematics than schools with no migrant students, but the differences were not statistically significant. At the secondary level, high-migrant schools were more likely to use teacher aides for additional instruction in reading than schools with no migrant students (86 percent versus 40 percent) as well as for additional mathematics instruction (59 percent versus 40 percent). Only the difference with respect to reading was statistically significant.
Percentage of Schools Using Teacher Aides to Provide Additional Instructional Services in Reading and Mathematics: Title I Schools Categorized by School Level and Migrant Status of School, 2000–01
Exhibit reads: Fifty-nine percent of Title I high-migrant elementary schools used teacher aides to provide additional instruction in reading, and 42 percent used teacher aides to provide additional instruction in mathematics.
Page 24 | A Snapshot of Title I Schools Serving Migrant Students, 2000–01

Exhibit 15 Parent Involvement in Schools
Strategies to Increase Parent Involvement in Student Learning
SOURCE: NLSS Principal Survey, SY 1998–99 and SY 2000–01.
High-migrant elementary schools were significantly more likely than schools with no migrant students to offer training for parents (77 percent versus 52 percent) and to have parent liaisons to improve communication between school and home (74 percent versus 51 percent). Low-migrant elementary schools were significantly more likely to have a family literacy program than other schools (55 percent versus 34 percent). Almost all principals (99 percent) in high-migrant schools reported that their school translated school documents into languages other than English for parents with limited English proficiency, compared with 67 percent of principals in schools with no migrant students. The percentage of principals who reported translating documents increased significantly between 1998–99 and 2000–01 across all migrant status categories and school levels.
Percentage of Schools Using Selected Parent Involvement Strategies: Title I Elementary Schools Categorized by Migrant Status of School, 2000–01
Exhibit reads: At the elementary level, 77 percent of Title I high-migrant schools and 76 percent of Title I low-migrant schools offered training for parents, compared with 52 percent of Title I schools with no migrant students.
Page 25 | A Snapshot of Title I Schools Serving Migrant Students, 2000–01

Exhibit 16 Professional Development
Professional Development to Meet the Needs of Migrant Students
NOTE: Questions were asked only of teachers who reported teaching migrant students and receiving any professional development in the past 12 months.
SOURCE: NLSS Teacher Survey, SY 2000–01.
Overall, about 23 percent of teachers who reported teaching migrant students reported receiving professional development to meet the needs of these students. Teachers in high-migrant schools were somewhat more likely to report such professional development, compared with similar teachers in low-migrant schools (29 percent versus 19 percent at the elementary level and 19 percent versus 14 percent at the secondary level). However, these differences were not significant. A large proportion of teachers who taught migrant students reported wanting professional development to teach migrant students. For example, half of the teachers in high-migrant elementary schools and 71 percent of teachers in low-migrant elementary schools who taught migrant students reported wanting but not receiving such professional development. The corresponding numbers at the secondary level were 64 percent and 45 percent, respectively.
Teacher Reports Regarding Receipt of Professional Development for Meeting the Needs of Migrant Students: Title I Schools Categorized by School Level and Migrant Status of School, 2000–01
Exhibit reads: About 29 percent of teachers who reported teaching migrant students in Title I high-migrant elementary schools received professional development to meet the needs of migrant students; 50 percent reported wanting this type of professional development and not receiving it; and 21 percent of these teachers had neither received nor wanted such professional development.
Page 26 | A Snapshot of Title I Schools Serving Migrant Students, 2000–01
Exhibit 17 Professional Development
Relationship Between Professional Development and Teacher Preparedness
CAVEAT: The analyses reported here rely on respondents’ self-reports and may reflect socially desirable responses. The findings focus on comparisons among variables of interest and are not meant to suggest causality.
NOTE: Questions were asked only of teachers who reported teaching migrant students and receiving any professional development in the past 12 months.
SOURCE: NLSS Teacher Survey, SY 2000–01.
Teachers who received professional development to address the needs of migrant students were significantly more likely to report feeling “very well prepared” to do so. For example, 56 percent of teachers in schools with migrant students who received professional development in how to meet the needs of migrant students reported feeling “very well prepared” to do so, compared with 24 percent of teachers who had not received such professional development. In contrast, only 10 percent of teachers who had received such professional development felt “somewhat” or “not at all prepared” to address the needs of migrant students, compared with 35 percent of teachers who had not received such professional development.
Teacher Reports Regarding Their Level of Preparedness to Meet the Needs of Migrant Students, by Receipt of Professional Development to Meet the Needs of Migrant Students: Title I Schools with Migrant Students, 2000–01
Exhibit reads: Fifty-six percent of teachers who received professional development to address the needs of migrant students reported feeling “very well prepared” to do so, compared with 24 percent of teachers who had not received this type of professional development.
Page 27 | A Snapshot of Title I Schools Serving Migrant Students, 2000–01

Exhibit 18 Schools Identified as In Need of Improvement Under Title I
Schools Identified as In Need of Improvement Under Title I
SOURCE: NLSS District Screener, SY 1998–99 and SY 2000–01.
Page 28 | A Snapshot of Title I Schools Serving Migrant Students, 2000–01

The 1994 reauthorization of ESEA required states to identify schools (and districts) that failed to make adequate yearly progress for two consecutive years as in need of improvement under Title I. Overall, in 2000–01, about 17 percent of all Title I schools had been identified by the district as in need of improvement under Title I. The percentage was much higher for high-migrant schools, 33 percent of which had been identified for improvement. The corresponding numbers for low-migrant schools and schools with no migrant students were 14 percent and 17 percent respectively. The percentage of high-migrant schools identified for improvement had increased sharply over time, from 16 percent in 1998–99 to 33 percent in 2000–01.
Many principals were confused about the school identification and improvement process. For example, among schools identified as in need of improvement, only 54 percent of principals agreed with the district that their school had been identified as in need of improvement under
Title I. Such levels of disagreement were found in both migrant and non-migrant Title I schools.
Percentage of Schools Identified by the District as In Need of Improvement Under Title I: Title I Schools Categorized by Migrant Status of School, 2000–01
Exhibit reads: Seventeen percent of all Title I schools were identified by the district as in need of improvement under Title I, compared with 33 percent of Title I high-migrant schools, 14 percent of Title I low-migrant schools, and 17 percent of Title I schools with no migrant students.
Page 29 | A Snapshot of Title I Schools Serving Migrant Students, 2000–01

Exhibit 19 Comprehensive School Reform Models
Adoption of Comprehensive School Reform Models
SOURCE: NLSS Principal Survey, SY 2000–01.
In 2000–01, about 62 percent of Title I schools had adopted comprehensive school reform models. High-migrant elementary schools were less likely to adopt school reform models than low-migrant elementary schools or elementary schools with no migrant students (56 percent versus 69 percent). However, this difference was not significant.
Of the schools that had adopted a model and had been identified as in need of improvement under Title I, over 60 percent of elementary school principals reported that their school had adopted a model because the school had been identified as in need of improvement. The percentage was somewhat higher in high-migrant schools than in schools with no migrant students (78 percent versus 58 percent). However, this difference was not significant.
Percentage of Schools That Adopted Comprehensive School Reform Models: Title I Elementary Schools Categorized by Migrant Status of School, 2000–01
Exhibit reads: Fifty-six percent of Title I high-migrant elementary schools had adopted a comprehensive school reform model, compared with 69 percent of low-migrant elementary schools or elementary schools with no migrant students.
Page 30 | A Snapshot of Title I Schools Serving Migrant Students, 2000–01

Exhibit 20 Comprehensive School Reform Models
Difficulty Implementing Comprehensive School Reform Models
SOURCE: NLSS Principal Survey, SY 2000–01.
Among all Title I schools that adopted comprehensive school reform models, secondary school principals were significantly more likely than elementary school principals to report finding it difficult to implement the model “to a moderate extent” or “to a great extent” (61 percent versus 20 percent). At the elementary level, 28 percent of principals in high-migrant schools reported that it was difficult to implement the model “to a moderate extent” or “to a great extent,” compared with 19 percent of principals in elementary schools with no migrant students. The difference was even more pronounced at the secondary level, where 73 percent of principals in high-migrant schools reported difficulty in implementation, compared with 40 percent of principals in schools with no migrant students. However, none of these differences was statistically significant.
Principal Reports Regarding Difficulty in Implementing the Model “to a Moderate Extent” or “to a Great Extent:” Title I Schools Categorized by School Level and Migrant Status of School, 2000–01
Exhibit reads: Twenty-eight percent of principals in Title I high-migrant elementary schools reported that the comprehensive school reform model adopted by the school was difficult to implement “to a moderate extent” or “to a great extent,” compared with 19 percent of principals in Title I schools with no migrant students.
Page 31 | A Snapshot of Title I Schools Serving Migrant Students, 2000–01