a snapshot of the data humanitarian and migrant youth ... · migration programmes. figure 1:...
TRANSCRIPT
1. Introduction
1.1 The MYAN
The Multicultural Youth Advocacy Network (MYAN) is the national peak body on
multicultural youth issues – Australia’s only national voice representing the needs
and interests of young people from refugee and migrant backgrounds. The MYAN
provides advice and capacity building to those who work with young people, supports
the development of young people’s skills and networks to engage in advocacy
and influence the national agenda, and undertakes a range of policy and advocacy
activities.
1.2. The refugee experience and settlement
Young people from refugee and migrant backgrounds have enormous potential to
be active participants in Australian society, but often face particular challenges in
accessing the support and opportunities they need. Their particular needs, distinct
from adults and many of their Australian-born counterparts, often go unrecognised as
they are a sub-set of the broader youth and settlement sectors.
Regardless of their mode of arrival, young people who settle in Australia through
the Humanitarian Programme are likely to have experienced long-term insecurity,
separation from family, exposure to violence and associated physical and mental health
issues. They are also likely to have had limited access to services and opportunities,
including education, employment, health and housing. Many humanitarian youth
arrivals will have been through the experience of seeking asylum which is highly
stressful and marked by periods of acute uncertainty, often compounding the effects
of trauma and adding to the complexity of the settlement process.
Many young people who arrive in Australia through the Family and Skilled Migration
Programmes may also come from refugee or refugee-like situations, with their
experiences reflecting those of young people entering through the Humanitarian
Programme. They may have less formal structures and supports in place when they
begin their settlement journey in Australia. For example, young people arriving on 115
and 117 (Last Remaining and Orphan Relative) visas are typically living in Australia in
kinship care arrangements and may have particular vulnerabilities related to their pre-
migration experiences and their transition to a new country and culture. However, as
these young people have arrived through the Family Programme, they are not eligible
for the same services as those arriving through the Humanitarian Programme. This can
place additional pressure on family and mean that the needs of this group of young
people are particularly complex.
A snapshot of the data
Humanitarian and Migrant Youth Arrivals to Australia July 2014 – June 2015
Youth Arrivals to Australia / myan.org.au 2Service providers may be unclear about what supports they can provide and what
referral options exist, resulting in young people not accessing the support they need
to navigate the settlement journey. In a 2013 report exploring the unique migration
experience of young people on 117 visas, International Social Service (ISS) Australia
recommended collaboration between kinship care services and the refugee and
migrant settlement sector to specifically support the needs of this newly arrived
group of young people.1 The Centre for Multicultural Youth (CMY) in Victoria have also
developed a resource where you can access further information about young people
on a 117 or a 115 visa, their entitlements and referral options available to them.2
Young people experience settlement in ways distinct from adults due to their age,
developmental stage and position within the family, and often face additional and
more complex transitions than their Australian-born counterparts. The particular issues
facing young people from refugee backgrounds in the settlement context include:
learning a new language, adjusting to a new culture and education system (often
with disrupted or limited schooling prior to Australia); finding work and establishing
themselves in the Australian workforce; negotiating family relationships in the context
of (new concepts of) independence, freedom and child and youth rights; negotiating
cultural identity and expectations from family and community; and establishing new
peer relationships.3
Young people during their settlement journey also commonly face a range of barriers
to accessing services and opportunities, including language, culture, limited social
and cultural capital (including unfamiliarity with the service system), age, gender,
racism and discrimination and a lack of culturally responsive practice from service
providers. At the same time, this group of young people come to Australia with a range
of strengths, including broad international and cross-cultural knowledge, multilingual
skills, adaptability and resourcefulness. A targeted or specialist approach to policy and
service delivery is essential to addressing the needs of young people from refugee and
migrant backgrounds and ensuring they achieve their potential as active and engaged
members of Australian society. For more information and resources to support a
targeted approach to youth settlement, see the MYAN’s National Youth Settlement
Framework and associated resources available at www.myan.org.au.
1.3 Background
This Information Sheet provides an overview of the settlement trends and basic
demographic data for young people from refugee backgrounds in Australia with a
focus on the period between July 2014 and June 2015. It also includes a brief overview
of some of the issues facing young people of migrant and refugee backgrounds during
the settlement process. These issues have been identified by MYAN through its national
policy and advocacy work and further information can be found in the MYAN’s Young
people from refugee and migrant backgrounds resource. This Information Sheet
may also be read in conjunction with previous MYAN Humanitarian Youth Arrivals to
1 Kavanagh, S. (2013) Home safe home: A report on children who migrate to Australia. Available at http://iss-ssi.org/2009/assets/files/news/ISSAustralia-HomeSafeHomeReport-May2013-web.pdf . P. 5
2 CMY (2014) Young People on Remaining Relative visas (115) and Orphan Relative visas (117). Available at http://www.cmy.net.au/publications/young-people-remaining-relative-visas-115-and-orphan-relative-visas-117.
3 CMY (2006) Settling In: Exploring good settlement for refugee young people in Australia. CMY: Carlton. Available at http://cmy.net.au/publications/settling; and CMY (2013) Settling or surviving: Unaccompanied Young Adults Aged 18-25 Years. CMY: Carlton. Available at http://cmy.net.au/publications/settling-or-surviving
Youth Arrivals to Australia / myan.org.au 3Australia Information Sheets. These and other MYAN resources are available at
www.myan.org.au.
The information presented here is derived from statistics collated by the Department
of Social Services (DSS) based on the records of people arriving in Australia under the
Humanitarian Programme. Statistics have been sourced directly from the Department
of Social Service via the online Settlement Reporting Facility (SRF), which primarily uses
on-arrival data supplemented by data from the Adult Migrant English Program (AMEP),
Medicare and other relevant sources. This data is subject to a number of caveats that
should be considered when reviewing this information.4
4 Details can be found at https://www.dss.gov.au/our-responsibilities/settlement-and-multicultural-affairs/programs-policy/settlement-services/settlement-reporting-facility In addition to these caveats, further notes to be considered when reviewing the information presented here can be found at Appendix 1: Further notes.

Youth Arrivals to Australia / myan.org.au 4
2. Young people arriving in Australia - the numbers 2.1 Age and visa types: How many young people from refugee and migrant backgrounds are settling in Australia?
Figure 1 presents the numbers of young people, aged 12 to 24, arriving through
the Humanitarian Programme (humanitarian youth arrivals) by age group and
year. A total of 3,176 young people aged between 12 and 24 years arrived in
Australia under the Humanitarian Programme during 2014/15. During this period
young people represented one fifth (174, 586) of all arrivals through the Australia’s
Migration Programmes. 155, 245 of these young people arrived through the Family
and Skilled Programmes, representing 89% of youth arrivals through Australia’s
Migration Programmes.4 While 19,320 young people arrived through the
Humanitarian Programme, representing 11% of youth arrivals through Australia’s
Migration Programmes.
Figure 1: Humanitarian youth arrivals by age group, 2010-2015
Table 1 presents the numbers of young people arriving through each migration
stream (youth arrivals) by year, between July 2010 and June 2015.
Over the five years from July 2010 to June 2015, humanitarian youth arrivals
consistently represented between 9% and 16% of all humanitarian arrivals to
Australia and between 25% and 30% of all young people settling in Australia across
the combined Humanitarian, Family and Skilled Programmes. (This is explored
further in Figure 3.) As shown in Table 1, during 2014/15 humanitarian youth
arrivals represented 16% of all the young people migrating to Australia, the highest
percentage during this five year period. Table 1 also shows a decline in the number
of young people arriving through all migration programmes during the last 12
months of this period.
0
1000
2000
3000
4000
5000 18-24
16-17
12-15
2010/11 2011/12 2012/13 2013/14 2014/15
Youth Arrivals to Australia / myan.org.au 5
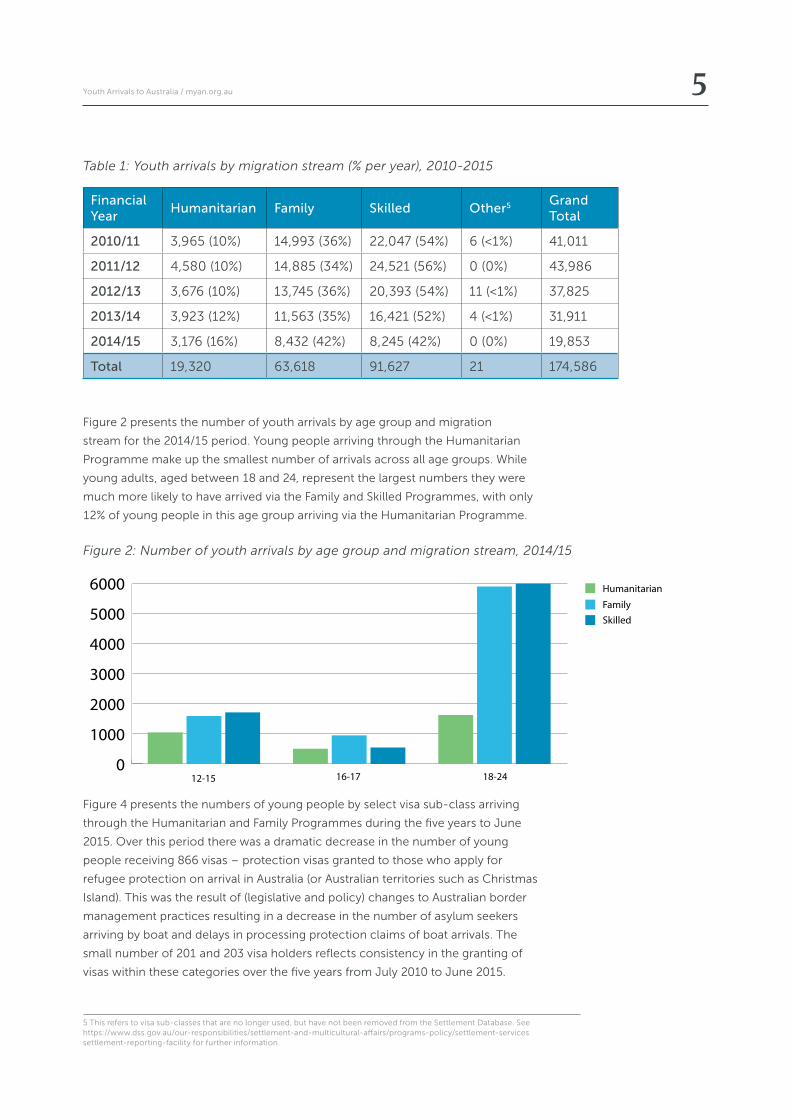
Table 1: Youth arrivals by migration stream (% per year), 2010-2015
Financial Year
Humanitarian Family Skilled Other5 Grand Total
2010/11 3,965 (10%) 14,993 (36%) 22,047 (54%) 6 (<1%) 41,011
2011/12 4,580 (10%) 14,885 (34%) 24,521 (56%) 0 (0%) 43,986
2012/13 3,676 (10%) 13,745 (36%) 20,393 (54%) 11 (<1%) 37,825
2013/14 3,923 (12%) 11,563 (35%) 16,421 (52%) 4 (<1%) 31,911
2014/15 3,176 (16%) 8,432 (42%) 8,245 (42%) 0 (0%) 19,853
Total 19,320 63,618 91,627 21 174,586
Figure 2 presents the number of youth arrivals by age group and migration
stream for the 2014/15 period. Young people arriving through the Humanitarian
Programme make up the smallest number of arrivals across all age groups. While
young adults, aged between 18 and 24, represent the largest numbers they were
much more likely to have arrived via the Family and Skilled Programmes, with only
12% of young people in this age group arriving via the Humanitarian Programme.
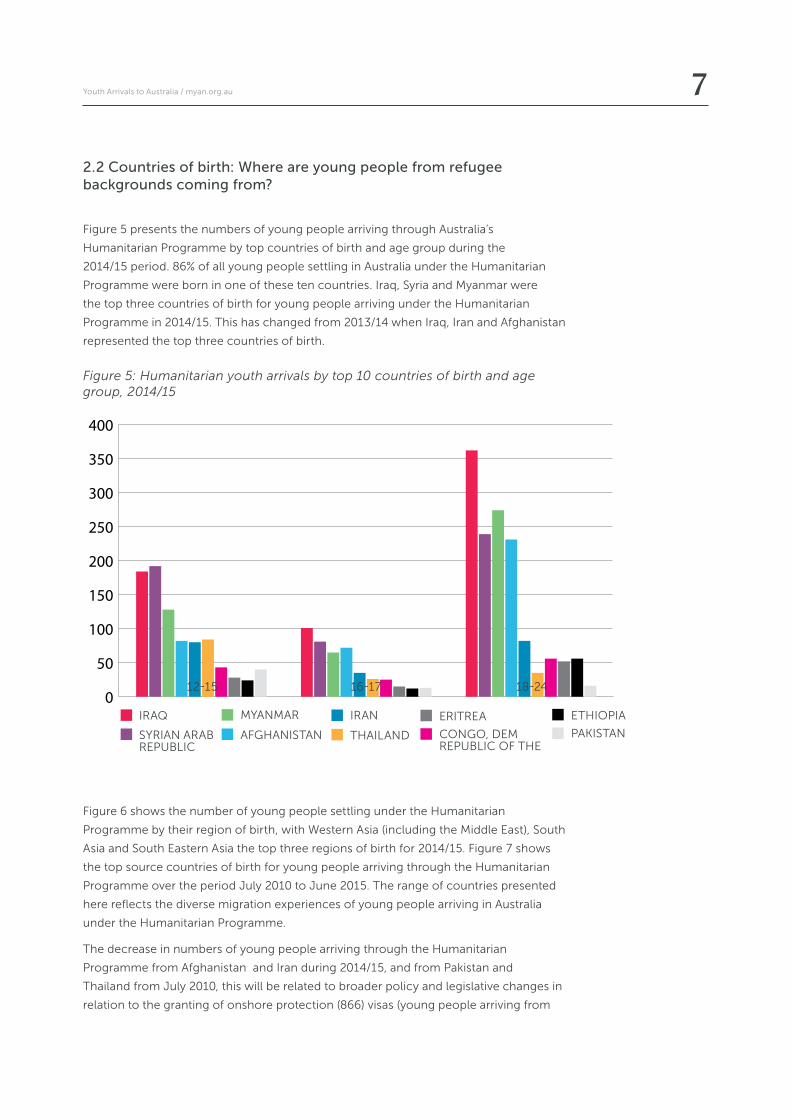
Figure 4 presents the numbers of young people by select visa sub-class arriving
through the Humanitarian and Family Programmes during the five years to June
2015. Over this period there was a dramatic decrease in the number of young
people receiving 866 visas – protection visas granted to those who apply for
refugee protection on arrival in Australia (or Australian territories such as Christmas
Island). This was the result of (legislative and policy) changes to Australian border
management practices resulting in a decrease in the number of asylum seekers
arriving by boat and delays in processing protection claims of boat arrivals. The
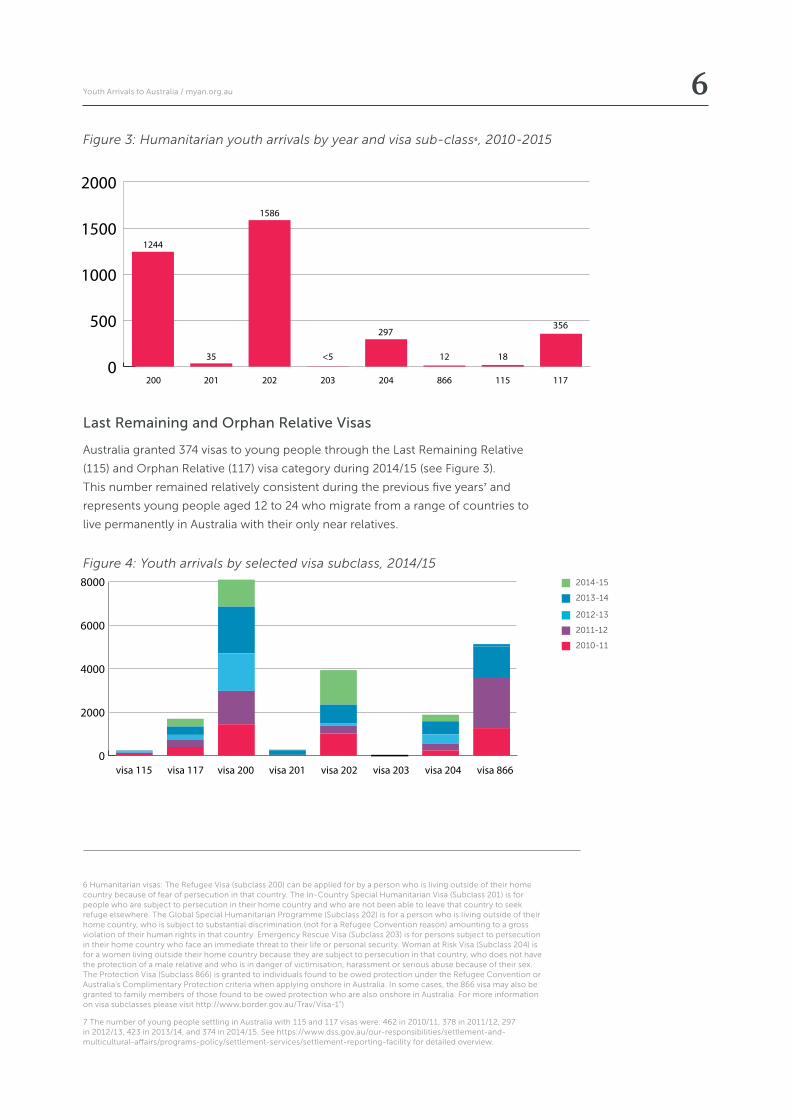
small number of 201 and 203 visa holders reflects consistency in the granting of
visas within these categories over the five years from July 2010 to June 2015.
5 This refers to visa sub-classes that are no longer used, but have not been removed from the Settlement Database. See https://www.dss.gov.au/our-responsibilities/settlement-and-multicultural-affairs/programs-policy/settlement-services settlement-reporting-facility for further information.
0
1000
2000
3000
4000
5000
6000 Humanitarian
FamilySkilled
12-15 16-17 18-24
Figure 2: Number of youth arrivals by age group and migration stream, 2014/15
Youth Arrivals to Australia / myan.org.au 6
Last Remaining and Orphan Relative Visas
Australia granted 374 visas to young people through the Last Remaining Relative
(115) and Orphan Relative (117) visa category during 2014/15 (see Figure 3).
This number remained relatively consistent during the previous five years7 and
represents young people aged 12 to 24 who migrate from a range of countries to
live permanently in Australia with their only near relatives.
Figure 4: Youth arrivals by selected visa subclass, 2014/15
6 Humanitarian visas: The Refugee Visa (subclass 200) can be applied for by a person who is living outside of their home country because of fear of persecution in that country. The In-Country Special Humanitarian Visa (Subclass 201) is for people who are subject to persecution in their home country and who are not been able to leave that country to seek refuge elsewhere. The Global Special Humanitarian Programme (Subclass 202) is for a person who is living outside of their home country, who is subject to substantial discrimination (not for a Refugee Convention reason) amounting to a gross violation of their human rights in that country. Emergency Rescue Visa (Subclass 203) is for persons subject to persecution in their home country who face an immediate threat to their life or personal security. Woman at Risk Visa (Subclass 204) is for a women living outside their home country because they are subject to persecution in that country, who does not have the protection of a male relative and who is in danger of victimisation, harassment or serious abuse because of their sex. The Protection Visa (Subclass 866) is granted to individuals found to be owed protection under the Refugee Convention or Australia’s Complimentary Protection criteria when applying onshore in Australia. In some cases, the 866 visa may also be granted to family members of those found to be owed protection who are also onshore in Australia. For more information on visa subclasses please visit http://www.border.gov.au/Trav/Visa-1”)
7 The number of young people settling in Australia with 115 and 117 visas were: 462 in 2010/11, 378 in 2011/12, 297 in 2012/13, 423 in 2013/14, and 374 in 2014/15. See https://www.dss.gov.au/our-responsibilities/settlement-and-multicultural-affairs/programs-policy/settlement-services/settlement-reporting-facility for detailed overview.
0
500
1000
1500
2000
200
1244
35
1586
<5
297
12 18
356
201 202 203 204 866 115 117
visa 200 visa 201visa 115 visa 117 visa 202 visa 203 visa 204 visa 8660
2000
4000
6000
8000 2014-15
2013-14
2012-13
2011-12
2010-11
Figure 3: Humanitarian youth arrivals by year and visa sub-class6, 2010-2015
Youth Arrivals to Australia / myan.org.au 7
2.2 Countries of birth: Where are young people from refugee backgrounds coming from?
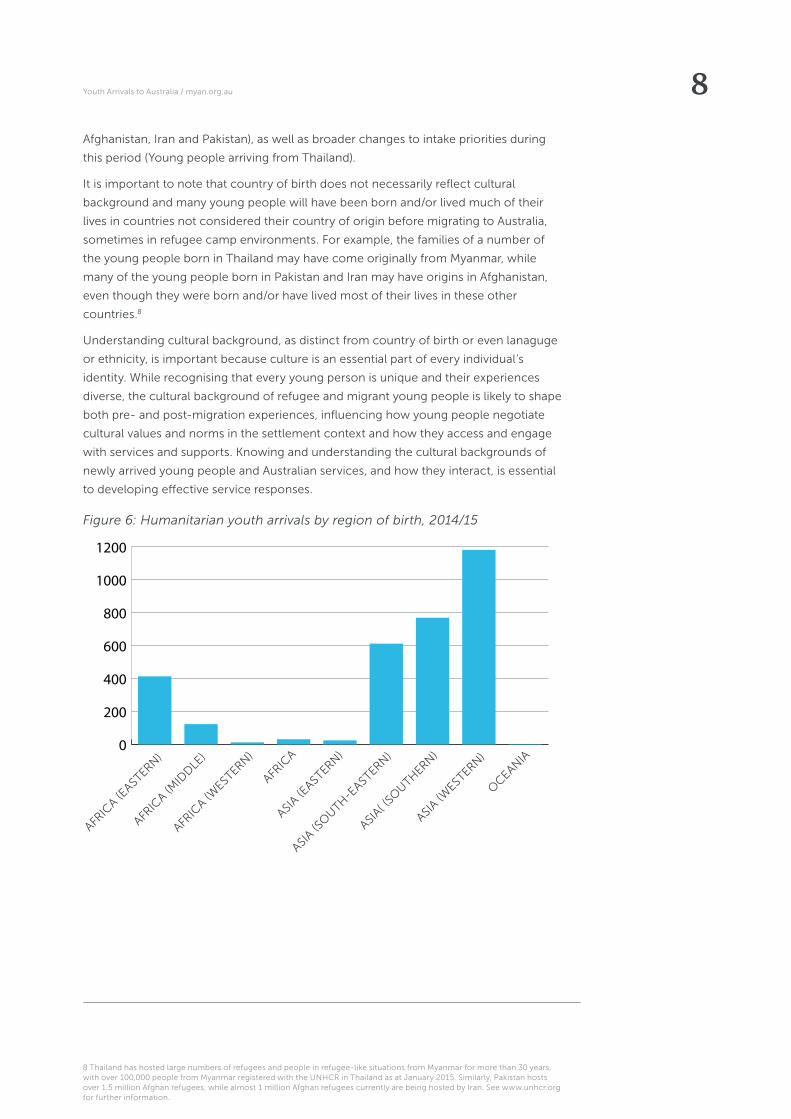
Figure 5 presents the numbers of young people arriving through Australia’s
Humanitarian Programme by top countries of birth and age group during the
2014/15 period. 86% of all young people settling in Australia under the Humanitarian
Programme were born in one of these ten countries. Iraq, Syria and Myanmar were
the top three countries of birth for young people arriving under the Humanitarian
Programme in 2014/15. This has changed from 2013/14 when Iraq, Iran and Afghanistan
represented the top three countries of birth.
Figure 5: Humanitarian youth arrivals by top 10 countries of birth and age group, 2014/15
0
50
100
150
200
250
300
350
400
Figure 6 shows the number of young people settling under the Humanitarian
Programme by their region of birth, with Western Asia (including the Middle East), South
Asia and South Eastern Asia the top three regions of birth for 2014/15. Figure 7 shows
the top source countries of birth for young people arriving through the Humanitarian
Programme over the period July 2010 to June 2015. The range of countries presented
here reflects the diverse migration experiences of young people arriving in Australia
under the Humanitarian Programme.
The decrease in numbers of young people arriving through the Humanitarian
Programme from Afghanistan and Iran during 2014/15, and from Pakistan and
Thailand from July 2010, this will be related to broader policy and legislative changes in
relation to the granting of onshore protection (866) visas (young people arriving from
IRAQ
12-15 16-17 18-24
MYANMAR IRAN
CONGO, DEM REPUBLIC OF THE
PAKISTANAFGHANISTAN THAILAND
ERITREA ETHIOPIA
SYRIAN ARAB REPUBLIC
Youth Arrivals to Australia / myan.org.au 8Afghanistan, Iran and Pakistan), as well as broader changes to intake priorities during
this period (Young people arriving from Thailand).
It is important to note that country of birth does not necessarily reflect cultural
background and many young people will have been born and/or lived much of their
lives in countries not considered their country of origin before migrating to Australia,
sometimes in refugee camp environments. For example, the families of a number of
the young people born in Thailand may have come originally from Myanmar, while
many of the young people born in Pakistan and Iran may have origins in Afghanistan,
even though they were born and/or have lived most of their lives in these other
countries.8
Understanding cultural background, as distinct from country of birth or even lanaguge
or ethnicity, is important because culture is an essential part of every individual’s
identity. While recognising that every young person is unique and their experiences
diverse, the cultural background of refugee and migrant young people is likely to shape
both pre- and post-migration experiences, influencing how young people negotiate
cultural values and norms in the settlement context and how they access and engage
with services and supports. Knowing and understanding the cultural backgrounds of
newly arrived young people and Australian services, and how they interact, is essential
to developing effective service responses.
Figure 6: Humanitarian youth arrivals by region of birth, 2014/15
8 Thailand has hosted large numbers of refugees and people in refugee-like situations from Myanmar for more than 30 years, with over 100,000 people from Myanmar registered with the UNHCR in Thailand as at January 2015. Similarly, Pakistan hosts over 1.5 million Afghan refugees, while almost 1 million Afghan refugees currently are being hosted by Iran. See www.unhcr.org for further information.
0
200
400
600
800
1000
1200
AFRIC
A (EAST
ERN)
AFRIC
A (MID
DLE)
AFRIC
A
AFRIC
A (WEST
ERN)
ASIA (E
ASTER
N)
ASIA (S
OUTH-E
ASTER
N)
ASIA( (
SOUTHER
N)
ASIA (W
ESTER
N)
OCEANIA

Youth Arrivals to Australia / myan.org.au 9
Figure 7: Humanitarian youth arrivals (as %) by top 10 countries of birth, 2010-2015
2.3 Settlement locations: Where are young people from refugee and migrant backgrounds settling in Australia?
Table 2 presents the numbers of young people from refugee and migrant
backgrounds by on-arrival settlement location in each of Australia’s states and
territories. Victoria and New South Wales settled the largest numbers of young people
from the Humanitarian Programme during 2014/15. However, Tasmania settled the
largest proportion of humanitarian youth arrivals to youth arrivals of any state or
territory (see Table 2). This directly reflects broader settlement trends across Australia
for 2014/15, with the majority of all new arrivals across all migration programmes
settling in New South Wales and Victoria, and over a third of all settlers to Tasmania
coming via the Humanitarian Programme.9
Humanitarian youth arrivals represented 16% of the total youth migration to Australia
during 2014/15. The total number of humanitarian arrivals (all age groups) as a
percentage of total migration to Australia during this same period was 10%. This is
an increase from 6.7% in 2013/14, which was the lowest percentage of humanitarian
arrivals as a percentage of total migration to Australia in 30 years.10
Table 2: Number and percentage of youth arrivals by state/territory and migration stream 2014/15
Migration Stream ACT NSW NT QLD SA TAS VIC WA Total11
Humanitarian (as % of total)
29 (9%)
1,086 (17%)
11 (5%)
417 (17%)
296 (20%)
91 (53%)
1,048 (17%)
198 (9%)
3,176 (16%)
Family 130 2,923 108 1,100 632 38 2,521 945 8,432
Skilled 156 2,522 104 872 558 44 2,691 1,182 8,245
Total 315 6,531 223 2,389 1,486 173 6,260 2,325 19,853 9 Almost two thirds (64%) of all people arriving through Australia’s migration program during the 2014/15 period settled in Victoria (29% or 34,253) or New South Wales (35% or 40,801). Over the same period (the 2014/15 financial year), Tasmania settled 822 people, 288 (35%) of whom arrived through the Humanitarian Programme. See https://www.dss.gov.au/our-responsibilities/settlement-and-multicultural-affairs/programs-policy/settlement-services/settlement-reporting-facility.
10 Australia’s first planned Humanitarian Programme tailored to the special needs of refugees and asylum seekers commenced in 1977 and was designed to help Australia respond to the Indochinese humanitarian crisis, with most Indonchinese resettled between 1979 and 1982. By the mid 1980s, the Humanitarian Programme intake had reduced to 11,000–12,000 per year and has remained at around 13,000 ever since. For more see, Phillips (2015) Australia’s Humanitarian Program: a quick guide to statistics since 1947, Australian Parliamentary Library Research Papers 2014/15. Available at http://www.aph.gov.au/About_Parliament/Parliamentary_Departments/Parliamentary_Library/pubs/rp/rp1415/Quick_Guides/Humanitarian
65%
19%
16%
Top 5 (Afghanistan, Iraq, Iran, Myanmar, Pakistan)
Top 10 (Top 5 plus Nepal, Syria, Congo, Thailand, Bhutan)
Other

Youth Arrivals to Australia / myan.org.au 1011 The total includes the following youth arrivals for whom state or territory was not recorded: 0 Humanitarian Programme; 35 Family Programme; and 116 Skilled Programme.
Table 3 presents the number of young people settling in each state and territory by
visa type, and includes young people on 115 (Last Remaining Relative) and 117 (Orphan
Relative) visas.12 Table 3: Youth arrivals by state/territory and visa type, 2014/15
State / Territory
ACT NSW NT QLD SA TAS VIC WA Not recorded
115* 13 <5 <5 <5
117* <5 71 46 62 139 34 <5
200 16 337 7 229 138 55 367 95
201 11 8 9 7
202 13 650 <5 93 134 18 593 84
203 <5
204 77 <5 94 16 18 79 10
866 11 <5
Between July 2010 and June 2015, more than half of all humanitarian youth arrivals to
Tasmania and Queensland were of school age - the national average during this period
was 45%. Table 4 presents the number of school age young people (those aged 12 to
17 years) settling in each state, through the humanitarian program and as a percentage
of the total number of young people aged 12 to 17 years in that state – see row one.
The percentage of humanitarian youth arrivals of school age arriving between July
2010 to June 2015 is presented in row two.
Table 4: School aged humanitarian youth arrivals (aged 12 to 17) years by state/territory, 2010 - 2015
State / Territory ACT NSW NT QLD SA TAS VIC WA Total
number of school aged humanitarian arrivals
74 2372 42 1501 1051 337 2818 590 8785
as % of school aged population
0.25% 0.47% 0.26% 0.52% 1.05% 0.94% 0.71% 0.44% 0.58%
as % of humanitarian youth arrivals
41% 43% 37% 51% 50% 55% 45% 39% 45%
12 See Sections 2.1 and 4 for further information.
* These two visa categories fall under the Family Programme, not the Humanitarian Programme, but are provided here for reference. See Endnote no. 5 for further information.
13 The comparison state and territory statistics for children aged 12 to 17 years in school are taken from ABS data for the year
Youth Arrivals to Australia / myan.org.au 112014. ABS (2015) ABS 4221.0 – Schools, Australia 2014, Table 40a. Available at www.abs.gov.au
3. Characteristics and experiences of young people from refugee backgrounds
3.1 Gender
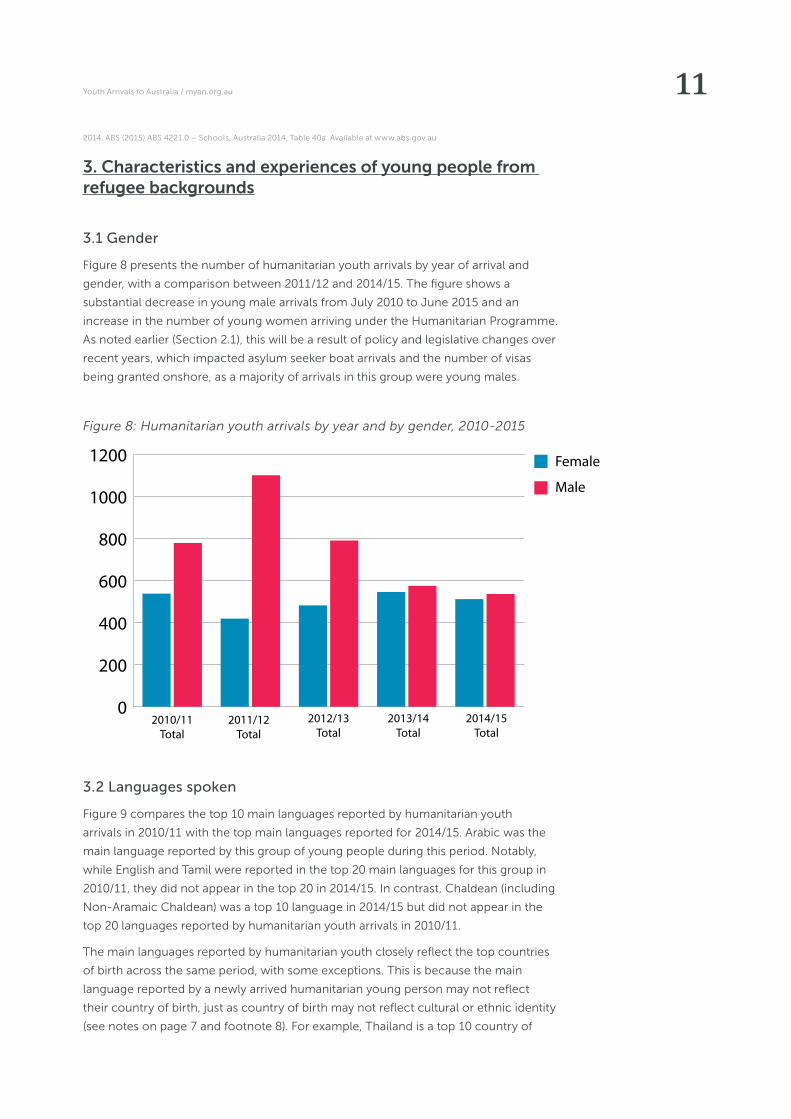
Figure 8 presents the number of humanitarian youth arrivals by year of arrival and
gender, with a comparison between 2011/12 and 2014/15. The figure shows a
substantial decrease in young male arrivals from July 2010 to June 2015 and an
increase in the number of young women arriving under the Humanitarian Programme.
As noted earlier (Section 2.1), this will be a result of policy and legislative changes over
recent years, which impacted asylum seeker boat arrivals and the number of visas
being granted onshore, as a majority of arrivals in this group were young males.
Figure 8: Humanitarian youth arrivals by year and by gender, 2010-2015
2010/11Total
2011/12Total
2012/13Total
2013/14Total
2014/15Total
Female
Male
0
200
400
600
800
1000
1200
3.2 Languages spoken
Figure 9 compares the top 10 main languages reported by humanitarian youth
arrivals in 2010/11 with the top main languages reported for 2014/15. Arabic was the
main language reported by this group of young people during this period. Notably,
while English and Tamil were reported in the top 20 main languages for this group in
2010/11, they did not appear in the top 20 in 2014/15. In contrast, Chaldean (including
Non-Aramaic Chaldean) was a top 10 language in 2014/15 but did not appear in the
top 20 languages reported by humanitarian youth arrivals in 2010/11.
The main languages reported by humanitarian youth closely reflect the top countries
of birth across the same period, with some exceptions. This is because the main
language reported by a newly arrived humanitarian young person may not reflect
their country of birth, just as country of birth may not reflect cultural or ethnic identity
(see notes on page 7 and footnote 8). For example, Thailand is a top 10 country of

Youth Arrivals to Australia / myan.org.au 12birth for newly arrived young people however Thai does not appear in the top 20
main languages of humanitarian youth arrivals over the same period. This is because
Thailand is a major source country for young humanitarian arrivals who speak Karen,
Chin and Burmese languages. Similarly, Dari, Arabic, Assyrian, Hazaragi and Farsi are
spoken throughout Afghanistan, Iraq, Syria and Iran, as well as by humanitarian youth
arrivals born in Pakistan. Arabic is also widely spoken in the countries of birth of other
newly arrived young people, including for example those born in Eritrea and Ethiopia.
Nepali is spoken by arrivals from Nepal and Bhutan, while Swahili is spoken by young
people who report their country of birth as the Democratic Republic of Congo, as well
as by those from Kenya, Tanzania, Uganda, Rwanda and Burundi.
Figure 9: Humanitarian youth arrivals by top 10 main languages, 2010/11 compared with 2014/1514
Figure 10 presents the percentage of humanitarian youth arrivals by main language
over the five years from July 2010. During this period, more than half of all
humanitarian youth arrivals reported one of Arabic, Hazaragi, Dari, Farsi (Persian &
Afghan), or Nepali as their main language. Chin, Karen and other languages from
Myanmar were also highly reported, along with Assyrian, the latter representing the
more recent increase in humanitarian arrivals from Syria.
14 Tamil, English and Chaldean (Non-Aramaic) are provided here as a reference and to allow for comparison with previous years’ Information Sheets.
0
200
400
600
800
1000
Arabic
Assyr
ian
Burmese
& re
lated la
nguages
Chin languag
es
Farsi
(Persi
an +
Afg
han)
Hazar
agi
Karen Lan
guages
Nepali
Swah
iliTa
mil
English
Chaldae
an (N
eo-Ara
maic
)Dar
i
2014/15
2010/11

Youth Arrivals to Australia / myan.org.au 13Figure 10: Percentage of humanitarian youth arrivals by main languages spoken, last five years
3.3 Religion
Figure 11 presents the top ten reported religions of humanitarian youth arrivals to
Australia over the period July 2010 to June 2015. During this period Shia, Christian
and Islam were recorded as the religion of almost three quarters of all humanitarian
youth arrivals.
Figure 11 Top 10 stated religions for 2010 – 2015 as proportion of humanitarian youth arrivals
15 NEC – not elsewhere classified. NFD – not further defined.
Top 5 (Arabic, Hazaragi, Dari, Farsi (Persian & Afghan), Nepali)
Top 10 (Chin Languages, Karen Languages, Assyrian, Burmese/Myanmar & related languages, Swahili)
Top 20 (Persian, Pashto, Somali, Chaldean (incl. Non-Aramaic), English, Tamil, Tigrinya, Urdu, Oromo, A�rcal Lanaguges NEC & NFD)
Other
15
16%
19%
54%
11%
Assyrian Church of the East
East Catholic (NEC)
Hinduism
Not Stated
Buddhism
Sunni
Chaldean Catholic
Islam
Christian (NFD)
Shia
35%
27%
13%
7%
4%
4%3%
3%2%2%

Youth Arrivals to Australia / myan.org.au 14Figure 12 presents the number of humanitarian youth arrivals by top reported religion
from July 2010 to June 2015. It reflects that, while the majority of young people (over
70%) continued to report Islam, Christian or Shia as their religion in 2014/15, as they
did in 2010/11, the proportions changed quite significantly. In 2014/15 the number of
humanitarian youth arrivals reporting their religion as Shia or Islam had almost halved
from the 2010/11 and 2012/13 periods, while the number of young people reporting
Christian as their religion had almost doubled across the same period.
Figure 12: Number of humanitarian youth arrivals by top reported religions 2010/11 compared to 2012/13 and 2014/15
0 200 400 600 800 1000 1200Sunni
Hinduism
Buddhism
Shia
Christian (NFD)
Assyrian Church of the East
Not Stated
Chaldean Catholic
Animisn
Islam
Catholic (NEC)
Bahai World Faith
2010-11 2012-13 2014-15
MYAN Australia
C/O Centre for Multicultural Youth
304 Drummond Street
Carlton VIC 3054
T: (03) 9340 3741 W: www.myan.org.au
The Multicultural Youth Advocacy Network (Australia) is auspiced by the Centre for Multicultural Youth.
©Centre for Multicultural Youth 2015
This work is protected under the Creative Commons Attribution-NonCommercial-NoDerivs 3.0 Australia licence
Full terms www.cmy.net.au/copyright Published December 2015

Youth Arrivals to Australia / myan.org.au 15
Appendix 1: Further Notes
In addition to the caveats applicable to the data source, referenced in Footnote 1, it is
important to note that:
• Young people refers to those aged between 12 to 24 years – data available
through existing Government reporting facilities only allows a breakdown of
12–24 years.
• While this Information Sheet provides an overview primarily of young people
settling under Australia’s Humanitarian Programme, it is important to note
that some young people arriving in Australia under the Family and Skilled
Programmes may come from situations, countries or regions where they may
have experienced refugee-like situations.
• Data displayed as ‘year of arrival’ was provided by the Department of Social
Services on 3 September 2015, all data presented is accurate as at this date
within noted caveats of the Settlement Reporting Facility (SRF).16
• After arriving in Australia young people move for a variety of reasons, including
housing affordability and availability, education and employment opportunities,
and the availability of accessible and appropriate services. Settlement data
presented here reflects information about young people’s on-arrival settlement
location as updated at 3 September 2015. Given the mobility of many newly
arrived young people and the challenges of maintaining up-to-date data on
secondary settlement (relocation), the information provided here should be
considered a guide only.
• The statistics provided refer to financial years and not calendar years.
• The visa sub-classes included under the Humanitarian Stream in this
Information Sheet are: 200 (Refugee), 201 (In-country special humanitarian
programme), 202 (Global special humanitarian programme), 203 (Emergency
rescue), 204 (Woman at risk) and 866 (Protection visa).17
18 Department of Social Services, https://www.dss.gov.au/our-responsibilities/settlement-and-multicultural-affairs/programs-policy/settlement-services settlement-reporting-facility for further information.
19. For more information on these visas please visit http://www.border.gov.au/Trav/Refu/Offs/Refugee-and-Humanitarian-visas