a 'slow pace of life' in australian old-endemic passerine
TRANSCRIPT

University of Wollongong University of Wollongong
Research Online Research Online
Faculty of Science, Medicine and Health - Papers: part A Faculty of Science, Medicine and Health
1-1-2016
A 'slow pace of life' in Australian old-endemic passerine birds is not A 'slow pace of life' in Australian old-endemic passerine birds is not
accompanied by low basal metabolic rates accompanied by low basal metabolic rates
Claus Bech University of Wollongong
Mark A. Chappell University of Wollongong, [email protected]
Lee B. Astheimer University of Wollongong, [email protected]
Gustavo A. Londoño Universidad Icesi
William A. Buttemer University of Wollongong, [email protected]
Follow this and additional works at: https://ro.uow.edu.au/smhpapers
Part of the Medicine and Health Sciences Commons, and the Social and Behavioral Sciences
Commons
Recommended Citation Recommended Citation Bech, Claus; Chappell, Mark A.; Astheimer, Lee B.; Londoño, Gustavo A.; and Buttemer, William A., "A 'slow pace of life' in Australian old-endemic passerine birds is not accompanied by low basal metabolic rates" (2016). Faculty of Science, Medicine and Health - Papers: part A. 3841. https://ro.uow.edu.au/smhpapers/3841
Research Online is the open access institutional repository for the University of Wollongong. For further information contact the UOW Library: [email protected]
A 'slow pace of life' in Australian old-endemic passerine birds is not accompanied A 'slow pace of life' in Australian old-endemic passerine birds is not accompanied by low basal metabolic rates by low basal metabolic rates
Abstract Abstract Life history theory suggests that species experiencing high extrinsic mortality rates allocate more resources toward reproduction relative to self-maintenance and reach maturity earlier ('fast pace of life') than those having greater life expectancy and reproducing at a lower rate ('slow pace of life'). Among birds, many studies have shown that tropical species have a slower pace of life than temperate-breeding species. The pace of life has been hypothesized to affect metabolism and, as predicted, tropical birds have lower basal metabolic rates (BMR) than temperate-breeding birds. However, many temperate-breeding Australian passerines belong to lineages that evolved in Australia and share 'slow' life-history traits that are typical of tropical birds. We obtained BMR from 30 of these 'old-endemics' and ten sympatric species of more recently arrived passerine lineages (derived from Afro-Asian origins or introduced by Europeans) with 'faster' life histories. The BMR of 'slow' temperate-breeding old-endemics was indistinguishable from that of new-arrivals and was not lower than the BMR of 'fast' temperate-breeding non-Australian passerines. Old-endemics had substantially smaller clutches and longer maximal life spans in the wild than new arrivals, but neither clutch size nor maximum life span was correlated with BMR. Our results suggest that low BMR in tropical birds is not functionally linked to their 'slow pace of life' and instead may be a consequence of differences in annual thermal conditions experienced by tropical versus temperate species.
Disciplines Disciplines Medicine and Health Sciences | Social and Behavioral Sciences
Publication Details Publication Details Bech, C., Chappell, M. A., Astheimer, L. B., Londoño, G. A. & Buttemer, W. A. (2016). A 'slow pace of life' in Australian old-endemic passerine birds is not accompanied by low basal metabolic rates. Journal of Comparative Physiology B: biochemical, systemic, and environmental physiology, 186 (4), 503-512.
This journal article is available at Research Online: https://ro.uow.edu.au/smhpapers/3841

1
A ‘slow pace of life’ in Australian old-endemic passerine birds is not accompanied by low
basal metabolic rates
Claus Bech1,2
, Mark A. Chappell1,3
, Lee B. Astheimer1,4,5
, Gustavo A. Londoño6
and William
A. Buttemer1,5
1Australian Flora and Fauna Research Centre, Department of Biological Sciences, University
of Wollongong, NSW 2522, Australia.
2Department of Biology, Norwegian University of Science and Technology, NO-7491
Trondheim, Norway.
3Department of Biology, University of California, Riverside, CA 92521, USA.
4Department of Biomedical Science, University of Wollongong, NSW 2522, Australia.
5Current Address: Centre for Integrative Ecology, Deakin University, Geelong, Victoria.
Australia 3217
6Universidad Icesi, Facultad de Ciencias Naturales, Departamento de Ciencias Biológicas,
Cali, Colombia
Running title: BMR in Australian Passerines
Address for correspondence and proof:
William A. Buttemer
Centre for Integrative Ecology
Deakin University
Geelong, Victoria. Australia 3217
e-mail: [email protected]
2
Abstract
Life history theory suggests that species experiencing high extrinsic mortality rates
allocate more resources toward reproduction relative to self-maintenance and reach maturity
earlier (‘fast pace of life’) than those having greater life expectancy and reproducing at a lower
rate (‘slow pace of life’). Among birds, many studies have shown that tropical species have a
slower pace of life than temperate-breeding species. The pace of life has been hypothesized to
affect metabolism and, as predicted, tropical birds have lower basal metabolic rates (BMR) than
temperate-breeding birds. However, many temperate-breeding Australian passerines belong to
lineages that evolved in Australia and share ‘slow’ life-history traits that are typical of tropical
birds. We obtained BMR from 30 of these ‘old-endemics’ and 10 sympatric species of more
recently arrived passerine lineages (derived from Afro-Asian origins or introduced by Europeans)
with ‘faster’ life histories. The BMR of ‘slow’ temperate-breeding old-endemics was
indistinguishable from that of new-arrivals and was not lower than the BMR of ‘fast’ temperate-
breeding non-Australian passerines. Old-endemics had substantially smaller clutches and longer
maximal life spans in the wild than new arrivals, but neither clutch size nor maximum life span
was correlated with BMR. Our results suggest that low BMR in tropical birds is not functionally
linked to their ‘slow pace of life’ and instead may be a consequence of differences in annual
thermal conditions experienced by tropical versus temperate species.
Keywords Australian passerines; basal metabolic rate; pace-of-life, life history, tropical vs.
temperate
3
Introduction
Biologists interpret life history traits as evolved solutions to ecological challenges that
allow organisms to maximize their reproductive potential (Stearns 2000). Life history is shaped
by intrinsic organismal properties (genetics, physiology, morphology, etc.) as well as by extrinsic
ecological factors, both biotic (e.g., predation, competition) and abiotic (e.g., temperature,
rainfall). Together with phylogenetic history, this complex selective matrix generates a strikingly
diverse assemblage of phenotypes, but there are common features among animals that occupy
particular regions of the life history continuum. For example, species with high rates of extrinsic
mortality are selected to emphasize current reproduction over survival: they mature rapidly,
reproduce early in life, show high fecundity, have low survival rates and reduced maximum
lifespan potential (MLSP), and are said to live a ‘fast pace of life’ (Ricklefs & Wikelski 2002).
By contrast, species with low rates of extrinsic mortality are selected to favor survival over
current reproduction to maximize lifetime reproductive success, have slow maturation, low
fecundity, high survival rates, and higher MLSP. Species with these life histories are said to have
a ‘slow pace of life’ (Ricklefs & Wikelski 2002, Magrath et al. 2000).
The different emphasis on investing in fecundity versus survival as a function of the
urgency of reproduction forms the basis of the physiology/life history nexus proposed by Ricklefs
and Wikelski. They suggested that long-lived species should invest more in immune processes
and other survival-promoting functions than species with short life spans, and some evidence
indicates that immune responses do differ among birds and mammals with varying MSLP (Lee
2006, Prevital et al. 2012). They also predicted that long-lived and slow-paced animals should
have relatively low basal metabolic rates. Basal metabolic rate (BMR) - the minimum energy
cost of homeostatic existence in an endothermic animal - is probably rarely under direct selection
(as by definition it is the cost of performing no growth, activity, or reproduction). However, it is
mechanistically linked to traits that are likely to be ‘seen’ by selection, such as exercise or
thermogenic capacity and field metabolic rate (the daily flux of energy through the animal; White

4
& Seymour 2004; Hulbert & Else 2004). The idea that BMR should be lower in slow-paced
animals was supported by a common-garden experiment with stonechats (Saxicola torquata and
S. rubicola) obtained as nestlings from populations with contrasting life histories (Wikelski et al.
2003). Adults from a sedentary tropical population had lower metabolic rates than birds from a
migratory north-temperate population. Similarly, two extensive comparative analyses showed
that birds from Neotropical forests in Panama and Peru have lower BMR (Wiersma et al. 2007b;
Londoño et al. 2015) and, in the Panamanian birds, lower maximal metabolic rates than species
from temperate latitudes (Wiersma et al. 2007a). Given that tropical birds have smaller clutches,
longer parental care, and higher juvenile and adult survival than their north-temperate
counterparts [Moreau 1944; Skutch 1985; Martin 1996; Cardillo 2002; Russell et al. 2004)], these
studies support the notion that a slow ‘pace of life’ engenders a slow ‘pace’ of energy metabolism
(e.g., Pearl 1928). However, it is unclear if low BMR in the tropics is a functional necessity or a
byproduct of ‘slow’ life history, or instead is simply an outcome of living in warm, stable habitats
with low requirements for thermoregulation, migration, or other energetically demanding
activities (Wiersma et al. 2007a). One way to resolve this is to examine the metabolic rates of
temperate-breeding birds sharing the same ‘slow’ life-history traits as tropical passerines, and
compare them with sympatric passerines with ‘fast’ life-histories.
The Australian avifauna offers a good opportunity for such a test. Passerine species that
breed in Australia include numerous ‘old-endemic’ species that evolved in relative isolation in
Australia and New Guinea. A smaller number of ‘new invaders’ of Afro-Eurasian origin is
thought to have colonized Australia much later. Additionally, a few north-temperate passerines
were introduced by European settlers during the last two centuries (Rowley & Russell 1991;
Keast 1981a). Of 338 passerine species that breed in Australia, 258 are old-endemics while 64
and 16 are ‘new invaders’ and introduced species, respectively (Keast 1981b). For simplicity we
refer to the latter two groups as ‘new-arrivals’.
5
Old-endemics and new-arrivals occur sympatrically in a variety of habitats, most of which
are climatically temperate (warm summers, cool winters, large seasonal changes in rainfall and
daylength). However, old-endemics have a ‘slow pace of life,’ with the small clutches,
prolonged incubation and fledging care, and high survival rates that typify tropical birds
(Magrath et al. 2000; Russell et al. 2004; Rowley & Russell 1991; Woinarski 1985; Yom-Tov
1987; Geffen & Yom-Tov 2000; Russell 2000). In contrast, new-arrivals have ‘fast’ life histories
like those of temperate breeders from the Northern hemisphere. For example, clutch sizes
average 2.7 in old-endemics and 4.7 in new-arrivals (Yom-Tov 1987). While the ecophysiology
of Australian birds has received much attention (Astheimer & Buttemer 2002), no study has
examined the energetics of Australian Passerines in the context of the ‘slow-fast’ contrast in their
life histories. To determine if the BMR of old-endemics is indeed lower that that of new-arrivals,
we measured BMR for 33 species from temperate climates, obtained BMR for several others
from the literature, and used the combined dataset to compare BMR between ‘slow’ versus ‘fast’
life histories. To verify the postulated ‘slow-fast’ contrast in life history of our study species, we
used published information on clutch size and maximum lifespan. To place our findings in a
broader context, we compared our results to a global database of almost 500 temperate and
tropical bird species (Londoño et al. 2015).
Material and methods
Bird capture and handling
We obtained most of the birds measured for this study near Wollongong, NSW (34.25˚S,
153.53˚E) or at the Fowlers Gap Research Station, NSW (31.09˚S, 141.70˚E). Wollongong-area
birds were captured between October 1998 and August 1999 in urban areas, gardens, parks, and
coastal eucalyptus woodland and temperate rainforest. Birds at Fowlers Gap were captured
between September and November 2007 in eucalyptus and saltbush habitats. White-browed

6
Babblers were caught at Back Yamma State Forest, NSW (33.33˚S, 148.21˚E) in May 1998 and
held in large flight cages at the University of Wollongong. Birds were mist-netted between 15:00
and 17:00 local time and transported to the laboratory in individual cloth bags for metabolic
measurements that night. Prior to the start of measurements, birds were caged individually with
access to water but not food. Birds were released the following morning close to the site of
capture (white-browed babblers were returned to flight cages). Each individual was used only
once for determination of BMR.
We obtained maximum life span data for free-living birds from the Australian Bird and Bat
Banding Scheme database (www.environment.gov.au/science/bird-and-bat-banding; October
2015) and clutch sizes from published sources (Yom-Tov 1987; Higgins et al. 2001, 2006;
Higgins and Peter 2002).
Basal metabolism
We measured metabolism as rates of oxygen uptake ( ). BMR trials started at
approximately 1800 (local time) and continued for 12-14 h. Up to four birds were tested
concurrently in individual chambers constructed from paint cans (2 or 5 L) equipped with air
flow ports, a thermocouple, and a perch. Chambers were placed in an environmental cabinet
maintained at 31.0 ± 1.0 °C, which we assumed to be within thermoneutrality for all species (in
some species this was confirmed by measuring metabolism at several ambient temperatures).
Separate mass flow controllers (Tylan; Bedford, Massachusetts, USA) maintained a constant
flow of dry air to each chamber (500-2500 ml min-1
STP depending on bird size). Mass flow
controllers were calibrated by timing the rate of soap bubble travel in a precision burette,
corrected to STP conditions. Excurrent air was subsampled at about 100 ml min-1
, scrubbed of
CO2 and water vapor, and routed to a two-channel O2 analyzer (S3A-2; Applied
Electrochemistry, Sunnyvale, California, USA) through a computer-controlled air stream

7
selector (Respirometry Multiplexer V2.0, Sable Systems, Las Vegas, Nevada, USA), such that
two birds were measured simultaneously (one by each S3A channel). Birds were monitored for
42 minutes, followed by a 3-min reference reading, before switching to another individual.
Accordingly, each bird was monitored approximately 47% of the time. The reference interval
was sufficient for O2 concentrations to reach stable, low values. Data were recorded on a
Macintosh computer interfaced to a DataTaker 500 A/D converter (Data Electronics, Rowville,
Victoria, Australia) with LabHelper software (www.warthog.ucr.edu). We computed as:
(ml O2 min-1
) = F * (FiO2 – FeO2)/(1 – FeO2)
where F is flow rate (ml min-1
STPD), FiO2 is incurrent fractional O2 concentration and FeO2
is excurrent fractional O2 concentration. BMR was calculated as the lowest averaged
over a continuous 10-minute interval when was low and stable. We converted to
Watts using an oxycaloric value of 19.8 kJ LO2-1
. Birds were weighed just prior to being
placed in the respirometer chamber in the evening and again in the morning upon retrieval from
the chamber, with the mean of the two values used as body mass (Mb).
Literature and unpublished data
We measured BMR in 33 free-living Australian passerine species (24 old-endemics, four
new invaders and five introduced species). In addition, we included published BMR for seven
old-endemics and two new-arrivals. We used only data that conformed to requirements for true
BMR (Mckecknie & Wolf 2005) and excluded data from long-term captives (white-browed
babblers were held in large flight cages and were recent captures). When multiple measurements
were available we used mean values, for a total of 40 species (Table 1).
BMR for additional species were obtained from Londoño et al. (2015). To avoid
confounding analyses, we excluded the Australian species from that study that we had measured
ourselves (N=9).
8
Statistics
Analyses are based on species means. Both Mb (in grams) and BMR (in Watts) were
log10-transformed to account for allometric scaling. Where necessary, a further Box-Cox
transformation was applied to achieve normal distributions.
For 12 of the Australian species, data were available for only one or two individuals.
Given these low sample sizes (N), we performed two sets of analyses, one including only species
for which N > 2 (28 species) and the other including all 40 Australian species. There were very
few difference between the two analyses. Accordingly, we show results derived from the
complete dataset, except when there were qualitative differences in significance; these instances
are noted in the Results section.
Phylogenetic signal (a measure of the statistical dependence among species' trait values
due to their phylogenetic relationships; Blomberg et al. 2003) was estimated for BMR, Mb, and
residuals of regressions between BMR and Mb (Revell 2010) with Pagel’s lambda (Pagel 1999)
using ‘phytools’ (Revell 2002). Since significant phylogenetic signal was present (see below),
we made between-group comparisons with phylogenetic analyses performed in R (R Core Team
2013), based on trees derived from the avian ‘tree of life’ (Londoño et al. 2015;Jetz et al. 2012;
Hackett et al. 2008; Fig. 1; Supplemental Fig. 1). Phylogenetic Independent Contrasts (PIC;
Felsenstein 1985) were used to estimate correlations between BMR and Mb (‘ape’ package;
Paradis et al. 2004). To compare BMR and Mb across origins (old-endemic and new-arrivals),
orders, and geographic locations, we performed Phylogenetic Generalized Least Squares (PGLS)
with ‘nlme’ (Pinheiro et al. 2013). We evaluated five models of evolution for the correlation
structure (Londoño et al. 2015; Revell 2010; Blomberg et al. 2003; Grafen 1989; Martins &
Hansen 1997). Akaike Information Criterion tests (‘qpcR’ [39]) indicated that Pagel’s model was
the best fit for Australian passerines and for temperate-tropical and passerine/non-passerine

9
comparisons. The Grafen model was the best fit for comparisons between Australian and non-
Australian passerines. For life span comparisons between old-endemic and new-arrival
Australian passerines, the Ornstein-Unlenbeck model was the best fit.
Since the use of phylogenetically-aware statistical models remains controversial (McNab
2015) we also performed conventional analyses (ordinary least squares; OLS), using JMP Pro 11
(SAS institute, Cary, North Carolina, USA).
Unless stated otherwise, all data are reported as mean standard error.
Results
Tests revealed significant phylogenetic signal in Mb, BMR, and their residuals (P < 0.006
for all groups), and there were significant effects of Mb on BMR in all groups (Tables 2A and 2B).
Maximum life span
OLS ANCOVA of maximum free-living life span (body mass as covariate) revealed
that the old-endemic species in our dataset have maximum life spans (MLS) 62% longer than
those of new arrivals (13.8 ± 0.8 years versus 8.5 ± 1.5 years, respectively; F1,37 = 10.0, P =
0.0031; Supplemental Fig. 1). Maximum life span increased with Mb in old endemics (t =
2.76, P = 0.010), but the relationship was not statistically significant in the smaller sample of
new arrivals (P = 0.95). Results were similar if data for the species with the shortest MLS
were discarded (Eremiornis carteri; 1 year, possibly an artifact of low sample size): old
endemics live longer than new arrivals (13.8 ± 0.8 years versus 9.4 ± 1.4 years, respectively;
F1,36 = 6.9, P = 0.0125).
Phylogenetic analysis (PGLS) yielded qualitatively similar results: old endemics have
maximum life spans longer than those of new arrivals (F1,37 = 6.66, P = 0.0139), and larger
species have longer MLS than small birds (F1,37 = 4.90, P = 0.033).
10
Seasonal effects on BMR
Seasonal changes in avian BMR are well known (McKechnie & Swanson 2010) and
could bias comparisons. Most (but not all) of our data were obtained in the spring and summer
(September – March; Supplemental Table 1), as were the BMR data for northern hemisphere
passerines (April-July; Wiersma et al. 2007). Capture dates (±30 days for literature sources)
were available for 37 of the 40 Australian species in our study. The remaining 3 species were
sampled in the spring and summer (September –February; Vitali et al. 1999). For most species,
all individuals were captured and tested within intervals of 60 days; for these we computed a
mean capture date (day of the year). Seven species were captured in two discrete periods
separated by more than 60 days; for these we computed mean values and capture dates for each
of the two periods. Since capture date could not be normalized, we used nonparametric tests.
For all 37 species for which we had dates, there was no significant influence of capture date on
BMR (P = 0.119, Kendall’s ; P = 0.135, Spearman’s ). Similarly, in the seven species
sampled within two distinct periods, there was no significant effect of capture date (P = 0.154,
Kendall’s ; P = 0.253, Spearman’s ).
Australian passerine BMR
An OLS ANCOVA of the BMR of 40 Australian passerines including Mb, origin (old-
endemic versus new arrival) and clutch size showed strong effects of Mb (F1,38 = 262, P < 0.0001)
and origin (F1,38 = 6.5, P = 0.0155;), with old-endemics having about 12% higher BMR than new
arrivals. There was also an origin X Mb interaction (F = 4.7, P = 0.0376), but no effect of clutch
size on BMR. Removal of clutch size from the model did not change the qualitative results.
Clutch size was independent of Mb (F1,38 = 0.05, P = .82) but was significantly higher in new
arrivals than in old endemics (3.62 ± .21 and 2.68 ± .12, respectively; F = 15.3, P = 0.0004).
11
There was no effect of maximum life span on BMR, after accounting for Mb and origin (F3,36 =
0.3, P = 0.58).
Results from phylogenetically-aware analyses were similar. Regressions describing PIC
of Mb and PIC of BMR were not affected by origin (F1,38 = 0.15, P = 0.70; Group-PIC Mb
interaction = 0.324 in a GLM; Fig. 2). PGLS revealed a strong dependence of BMR on Mb (F1,38
= 448.3, P < 0.0001), but no Mb X origin interaction (F1,38 = 0.15, P = 0.70). Clutch size was
independent of Mb and BMR (P > .75 for both) but was significantly higher in new-arrivals than
in old-endemics (3.61 ± 0.20 and 2.68 ± 0.11 respectively, P = 0.0011). Maximum life span did
not significantly affect BMR after accounting for Mb and origin (PGLS; F1,36 = 0.091, P = 0.76).
Comparison of Australian to Northern Hemisphere Temperate-breeding Passerines
In an OLS ANCOVA of 129 temperate-breeding passerines (40 Australian plus 89
Northern Hemisphere species), Mb was strongly correlated to BMR (F2,126 = 444, P < 0.0001),
origin was also significant (F2,126 = 5.10, P = 0.0074) and there was a significant origin X Mb
interaction (F2,126 = 5.23, P = 0.0066). Post-hoc comparisons (Tukey-Kramer) showed no
difference between new arrivals and either north-temperate breeders (P = .77) or old-endemics (P
= 0.064), but 11% higher BMR in old-endemics than in north-temperate breeders (P = 0.0095).
In phylogenetically-aware tests, there was no Mb X origin interaction (PGLS; F2,126 =
1.66, P = .20). As expected, BMR and Mb were strongly correlated (F2,126 = 624, P < 0.0001),
with a slope (mass exponent) of 0.71 ± 0.04 (SE). However, BMR differed between Australian
and north-temperate passerines (F2,126 = 7.73, P < 0.0001), with BMR of Australian species
averaging 7.7% lower. Most of the difference stemmed from new-arrivals, which had BMR
21.5 % less than that of north-temperate passerines, whereas the BMR of old-endemics was only
3.1 % lower. When analysis was restricted to the 28 Australian species for which sample size
12
was greater than 2 individuals, there was no effect of origin (Australian vs. north-temperate) on
BMR (F2,114 = 2.67, P = 0.105).
Temperate/tropical and passerine/non-passerine comparisons
In 519 bird species (40 Australian passerines plus data from 5 datasets in Londoño et al.
2015), OLS ANCOVA found significantly lower BMR in tropical than in temperate species
(F1,517 = 9.36; P = 0.0023), significantly higher BMR in passerines than in non-passerines, a
significant effect of dataset (F5,513 = 9.68, P <0.0001), a significant dataset X Mb interaction
(F5,513 = 6.90, P= 0.0001), but no Mb X latitude or Mb X order interactions (F1,517 = 1.60, P = 0.21
and F = 1.29, P = 0.26, respectively). As expected, BMR was strongly correlated with Mb
(F1,517 = 2049, P < 0.0001) with a slope (mass exponent) of 0.678 ± 0.015 (SE). On average, the
BMR of temperate species was 12% higher than that of tropical species and the BMR of
passerine birds averaged 19.5% higher than that of non-passerines.
Phylogenetically-aware tests (PGLS) also indicated that tropical birds have lower BMR
than temperate birds (F1, 517 = 17.53, P <0.0001) and that Passeriformes have higher BMR than
non-Passeriformes (F1, 517 = 86.02, P < 0.0001) with a strongly positive overall correlation
between Mb and BMR (F1, 517 = 2368, P < 0.0001). There were significant interactions between
Mb and taxonomic order (F1, 517 = 8.54, P = 0.0038), latitude (F1, 517 = 15.58, P = 0.0001) and
dataset (F5, 513 = 3.69, P = 0.0013). Restricting the PGLS analysis to the 28 Australian species for
which N>2 resulted in similar overall findings, although there was no Mb X taxonomic order
interaction (F1,505 = 0.02, P = 0 .88).
Discussion
The addition of our findings for Australian species does not change the conclusions of
analyses showing lower BMR in tropical-breeding birds than in temperate-breeding species
(Wiersma et al. 2007b; Londoño et al. 2015) and higher BMR in passerines than in non-passerine

13
orders (Londoño et al. 2015). However, in the context of metabolism and life history, our most
interesting findings are that the BMR of temperate-zone, old-endemic Australian passerines is
indistinguishable from that of new-arrivals inhabiting the same region, and that BMR is not
affected by clutch size or by maximum life span. This lack of differentiation was unexpected, as
both old-endemics and tropical forest passerines have a ‘slow pace of life’ but new-arrivals are
‘faster.’ In the Australian species we sampled, clutch size was 35% higher in new-arrivals than
in old endemics, and for a much broader sampling of Australian passerines it was >70% higher in
new-arrivals (Yom-Tov 1987). Maximum life span was 62% longer in the old endemics in our
sample, also consistent with this group having a ‘slow’ life history. If life history and energy
metabolism were coupled, then BMR and clutch size should be positively correlated whereas
BMR and MLS should be negatively correlated after accounting for body mass, and, in general,
old-endemics should have low BMR compared to new-arrivals. None of these predictions was
supported by our data.
Our comparison of Australian passerines to north-temperate passerines also did not reveal
low BMR in the old-endemics (in fact, it may be higher than that of ‘fast’ north-temperate
passerines, as suggested by OLS post-hoc tests). Moreover, the new-arrivals have maintained
similar clutch sizes in Australia as their conspecifics in Europe (Yom-Tov 1987), again showing
lack of correlation between BMR and reproductive ‘pace of life’.
Seasonal variation in some bird species, particularly those from high latitudes, is well
documented (e.g., Mckechnie & Swanson 2010), so if our comparisons of old endemics, new
arrivals, and north-temperate passerines were based on data obtained in contrasting seasons,
results could be biased. Many of the north-temperate species were sampled in spring and
summer (April –July; Wiersma et al. 2007b), and most of the Australian samples were obtained
in the same season (September –February). The Australia data also contained some samples
obtained outside that period, but we found no significant effect of sampling date on BMR, either

14
for all Australian species combined or within a subset of species with data spanning several
months. A previous study of superb fairy-wrens (Lill et al. 2006) also found no effect of season
on BMR. Therefore we do not believe our intergroup comparisons were confounded by sampling
in contrasting seasons.
Of the old-endemics we sampled, only the Pomatostomidae (babblers), which are
relatively weak flyers with clutch sizes averaging 3 eggs, had consistently low BMR (Table 1).
The two old-endemic families with the highest BMR included the one with the lowest average
clutch size (honeyeaters; Meliphagidae; 2.3 eggs) and the Pardalotidae (pardalotes, scrubwrens,
thornbills), which averaged 3 eggs per clutch (Table 1). While clutch size is only one minor
component of total reproductive effort in birds, it is a fundamental life history trait and the basis
of other, larger investments in fecundity (e.g., incubation and especially parental care). The
independence of clutch size and BMR in Australian passerines suggest that the difference in
BMR between temperate and Neotropical birds found by Wiersma et al. (2007b) and Londoño et
al. (2015) may not result from a linkage between the reproductive ‘pace of life’ and metabolism.
Instead, it may derive from latitudinal contrasts in temperature or other factors separate from life
history per se (Wiersma et al. 2007a).
At variance with that suggestion is the lack of effect of a 2.6 km altitude gradient on BMR
in Andean birds in Peru, despite a 12 °C difference in environmental temperature between
lowland and highland habitats (annual means 23 °C and 11 °C, respectively; Londoño et al. 2015).
Such temperature differences should strongly affect rates of energy use for thermoregulation,
especially for small birds, which typically have lower critical temperatures of 25-28 °C
(unpublished data). However, some recent analyses indicate that variation in BMR across bird
species is best explained not only by average ambient temperature, but also by its annual
variation (White et al. 2007; Jetz et al. 2008). Hence, seasonal stability, despite differing average
temperatures, may explain the across-altitude similarity of BMR among Peruvian species
15
(Londoño et al. 2015); in contrast, the large seasonal variation in temperate latitudes may
engender high BMR. Birds expend more energy thermoregulating in cool habitats than in
warmer regions and hence may have greater demand on muscular thermogenesis and digestive
functions. Wiersma and colleagues found that Panamanian birds have lower maximal metabolic
rates than temperate birds during forced exercise and shivering thermogenesis, as well as lower
BMR (Wiersma et al. 2007a). They suggested that the reduced aerobic capacity might derive
from lower demands for flight performance in tropical forests, where most birds are non-
migratory and many are relatively sedentary; this, as well as low BMR (Vezina et al. 2006; Daan
et al. 1990; Chappell et al. 1999) is consistent with data in tropical species showing relatively
small organ masses (pectoral muscle, heart, lung, liver, kidney, liver, pancreas; Wiersma et al.
2012).
Overall, we found that BMR and two indices of the ‘pace of life’ -- reproductive
investment (indicated by clutch size) and maximum life span -- are not linked in Australian
passerines. Our findings are more consistent with the idea that low BMR in tropical birds is a
consequence of living in a benign and relatively aseasonal climate rather than to having a ‘slow’
set of life-history traits, as predicted by the ‘physiology-life history nexus’ concept (Ricklefs and
Wikelski 2002). To further test this interpretation, characterization of BMR in Australian old-
endemic species living in temperate versus tropical regions is an obvious opportunity.
Acknowledgements
All procedures used in these studies were approved by the University of Wollongong
Animal Ethics Committee in accordance with the National Health and Medical Research
Council Code of Practice for the Care and Use of Animals for Scientific Purposes. The study
was supported by funds from the Australian Research Council (Grant Nos. A19600561 and
DP0453021) and the Australian Flora and Fauna Research Centre (to WAB and LBA), U.C.

16
Riverside Academic Senate funds (to MAC), National Science Foundation grant DEB-
1120682 (to S.K. Robinson and MAC) and the Norwegian University of Science and
Technology (to CB).
17
References
Ambrose SJ, Bradshaw SD, Withers PC, Murphy DP (1996) Water and energy balance of captive
and free-ranging Spinifexbirds (Eremiornis carteri) North (Aves:Sylviidae) on Barrow Island,
Western Australia. Aust J Zool 44:107-117
Astheimer LB, Buttemer WA (2002) Changes in latitude, changes in attitude: a perspective on
ecophysiological studies of Australian birds. Emu 102:19-27
Blomberg SP, Garland T, Ives AR (2003) Testing for phylogenetic signal in comparative
data: behavioral traits are more labile. Evolution 57:717-745
Buttemer, WA, Astheimer LB (2000) Testosterone does not affect basal metabolic rate or blood
parasite load in captive male White-plumed Honeyeaters Lichenostomus penicillatus. J
Avian Biol 31:479-488
Cardillo M (2002) The life-history traits of latitudinal diversity gradients: how do species traits
vary from the poles to the equator? J Anim Ecol 71:79-87
Chappell MA, Bech C, Buttemer WA (1999) The relationship of central and peripheral organ
masses to aerobic performance variation in house sparrows. J Exp Biol 202:2269-2279
Collins BG, Cary G, Payne S (1980) Metabolism, thermoregulation and evaporative water loss in
two species of Australian nectar-feeding birds (family Meliphagidae). Comp Biochem Physiol
67A:629–635
Daan S, Masman D, Groenewold A (1990) Avian basal metabolic rates: their association with
body composition and energy expenditure in nature. Am J Physiol 259:R333–R340.
Felsenstein J (1985) Phylogenies and the comparative method. Am Nat 125:1–15
Geffen E, Yom-Tov Y (2000) Old-endemics and new invaders: alternative strategies of
passerines for living in the Australian environment. Behav Ecol Sociobiol 47:250-257
Grafen A (1989) The phylogenetic regression. Phil Trans Royal Soc London, Series B, Biol Sci
326:119-157
18
Hackett SJ, Kimball RT, Reddy S, Bowie RCK, Braun EL, Braun MJ, Chojnowski JL, Cox WA,
Han K, Harshman J, et al. (2008) Phylogenomic Study of Birds Reveals Their Evolutionary
History. Science 320:1763-1768
Higgins PJ, Peter JM, Steele WK (eds.) (2001) Handbook of Australian, New Zealand and
Antarctic Birds. Volume 5. Oxford University Press, Melbourne
Higgins PJ, Peter JM (eds.) (2002) Handbook of Australian, New Zealand and Antarctic Birds.
Volume 6. Oxford University Press, Melbourne
Higgins PJ, Peter JM, Cowling, S (eds.) (2006) Handbook of Australian, New Zealand and
Antarctic Birds. Volume 7. Oxford University Press, Melbourne
Hulbert AJ, Else PE (2004) Basal metabolic rate: history, composition, regulation, and usefulness.
Physiol Biochem Zool 77:869-876
Jetz W, Freckleton RP, McKechnie AE (2008) Environment, migratory tendency, phylogeny and
basal metabolic rate in birds. PLoS ONE 3(9):e3261
Jetz W, Thomas GH, Joy JB, Hartmann K, Mooers AO (2012) The global diversity of birds in
space and time. Nature 491:444-448
Keast A (1981a) Distributional patterns, regional biotas, and adaptations in the Australian biota: a
synthesis. In: Keast A (ed.) Ecological Biogeography of Australia, The Hague: W. Junk, pp.
1891–1997
Keast A (1981b) Origin and relationship of the Australian biota. In: Keast A (ed.) Ecological
Biogeography of Australia, The Hague: W. Junk, pp. 2001-2050
Lee KA (2006) Linking immune defenses and life history at the levels of the individual and the
species. Integr Compar Biol 46: 1000-1015
Lill A, Box J, Baldwin J (2006) Do metabolism and contour plumage insulation vary in response
to seasonal energy bottlenecks in superb fairy-wrens? Aust J Zool 54:23-30

19
Londoño GA, Chappell MA, Castenada, M, Jankowski JE, Robinson SK (2015) Basal
metabolism in tropical birds: Latitude, altitude, and the 'pace of life'. Funct Ecol 29:338-346
Maddocks TA, Geiser F (1997) Energetics, thermoregulation and nocturnal hypothermia in
Australian silvereyes. Condor 99:104-112
Magrath RD, Leedman AW, Gardner JL, Giannasca A, Nathan AC, Yezerinac SM, Nicholls JA
(2000) Life in the slow lane: Reproductive life history of the White-browed Scrubwren, an
Australian endemic. Auk 117:479-489
Martin TE (1996) Life history evolution in tropical and south temperate birds: what do we really
know? J Avian Biol 27:263-272
Martins EP, Hansen TF (1997) Phylogenies and the comparative method: a general approach to
incorporating phylogenetic information into the analysis of interspecific data. Am Nat
149:646-667
McKechnie AE, Wolf BO (2004) The allometry of avian basal metabolic rate: good predictions
need good data. Physiol Biochem Zool 77:502-521
McNab BK (2015) Behavioral and ecological factors account for variation in the mass‐
independent energy expenditures of endotherms. J Comp Physiol B 185:1-13.
Moreau RE (1944) Clutch size: A comparative study, with special reference to African birds.
Ibis 86:286-342
Pagel M (1999) Inferring the historical patterns of biological evolution. Nature 401:877-884.
Paradis E, Claude J, Strimmer K (2004) APE: analyses of phylogenetics and evolution in R
language. Bioinformatics 20:289-290
Pearl R (1928) The rate of living: being an account of some experimental studies on the biology
of life duration. A. A. Knopf, New York
Pinheiro J, Bates D, DebRoy S, Sarkar D. the R Development Core Team (2013) nlme: Linear
and Nonlinear Mixed Effects Models. R package version 3, pp.1-113

20
Previtali MA, Ostfield RS, Keesing F, Jolles AE, Hanselmann R, Martin LB (2012) Relationship
between pace of life and immune responses in wild rodents. Oikos 121:1483-1492
R Core Team (2013) R: A Language and Environment for Statistical Computing. R Foundation
for Statistical Computing. Vienna, Austria. http://www.R-project.org
Revell LJ (2010) Phylogenetic signal and linear regression on species data. Methods Ecol Evol
1:319–329
Revell LJ (2012) phytools: An R package for phylogenetic comparative biology (and other
things). Methods Ecol Evol 3:217–223
Ricklefs RE, Wikelski M (2002) The physiology/life history nexus. Trends Ecol Evol 17:462–
468
Ritz C, Spiess AN (2008) qpcR: an R package for sigmoidal model selection in quantitative real-
time polymerase chain reaction analysis. Bioinformatics 24:1549-1551
Rowley I, Russell E (1991) Demography of passerines in the temperate southern hemisphere. In:
Perrins CM, Leberton JD, Hirons M (eds.), Bird Population Studies, Oxford University Press,
Oxford, pp. 22–44
Russell EM (2000) Avian life histories: is expanded parental care the southern secret? Emu
100:377-399
Russell EM, Yom-Tov Y, Geffen E (2004) Extended parental care and delayed dispersal:
northern, tropical, and southern passerines compared. Behav Ecol 15:831-838
Skutch AF (1985) Clutch size, nesting success, and predation on nests of neotropical birds,
reviewed. In: Buckley PA, Foster MS, Morton ES, Ridgley RS, Buckley FG (eds.),
Neotropical Ornithology, AOU Ornithological Monographs No. 36. AOU, Washington DC, pp.
575-594
Stearns SC (2000) Life history evolution: successes, limitations, and prospects.
Naturwissenschaften 87:476-486
21
Vezina F, Jalvingh KM, Dekinga A, Piersma T (2006) Acclimation to different thermal
conditions in a northerly wintering shorebird is driven by body mass-related changes in organ
size. J Exp Biol 209:3141-3154
Vitali SD, Withers, PC, Richardson KC (1999) Standard metabolic rates of three nectarivorous
meliphagid passerine birds. Aust J Zool 47:385-391
Weathers WW, Paton DC, Seymour RS (1996) Field metabolic rate and water flux of
nectarivorous birds. Aust J Zool 44:445-460
White CR, Seymour RS (2004) Does basal metabolic rate contain a useful signal? Mammalian
BMR allometry and correlations with a selection of physiological, ecological and life-history
variables. Physiol Biochem Zool 77: 929-941
White CR, Blackburn TM, Martin GR, Butler PJ (2007) Basal metabolic rate of birds is
associated with habitat temperature and precipitation and not primary productivity. Proc R
Soc Biol Sci 274:287-293
Wiersma P, Chappell MA, Williams JB (2007a) Cold- and exercise induced peak metabolic rates
in tropical birds. Proc Natl Acad Sci USA 104:20866-20871
Wiersma P, Muñoz-Garcia A, Williams JB (2007b) Tropical birds have a slow pace of life. Proc
Natl Acad Sci USA. 104:9340-9345
Wiersma P, Nowak B, Williams JB (2012) Small organ size contributes to the slow pace of life
in tropical birds. J Exp Biol 215:1662-1669
Wikelski M, Spinney L, Schelsky W, Scheuerlein A, Gwinner E (2003) Slow pace of life in
tropical sedentary birds: a common-garden experiment on four stonechat populations from
different latitudes. Proc R Soc B Biol Sci 270:2383-2388
Woinarski JCZ (1985) Breeding biology and life history of small insectivorous birds in
Australian forests: response to a stable environment? Proc Ecol Soc Austr 14:159-168
Yom-Tov Y (1987) The reproductive rates of Australian passerines. Austr Wildl Res 14:319-330
22
Figures
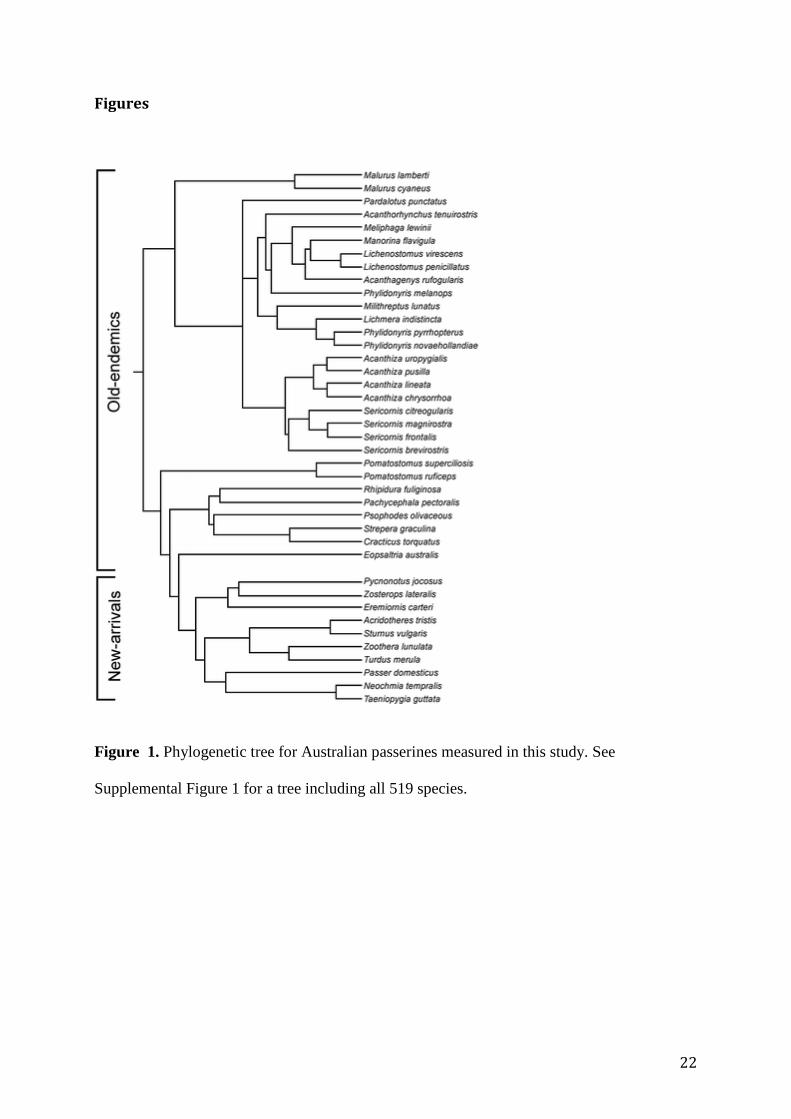
Figure 1. Phylogenetic tree for Australian passerines measured in this study. See
Supplemental Figure 1 for a tree including all 519 species.

23
Figure 2. Phylogenetically independent contrast (PIC) of BMR against PIC of body mass for
40 species of Australian passerines (old-endemics and new-arrivals) and 89 species of temperate-
breeding passerines from the Northern Hemisphere (individual data points not shown for clarity).
The latter was based on data in Wiersma et al. (2007b) and Londoño et al. (2015). See text for
statistics.

24
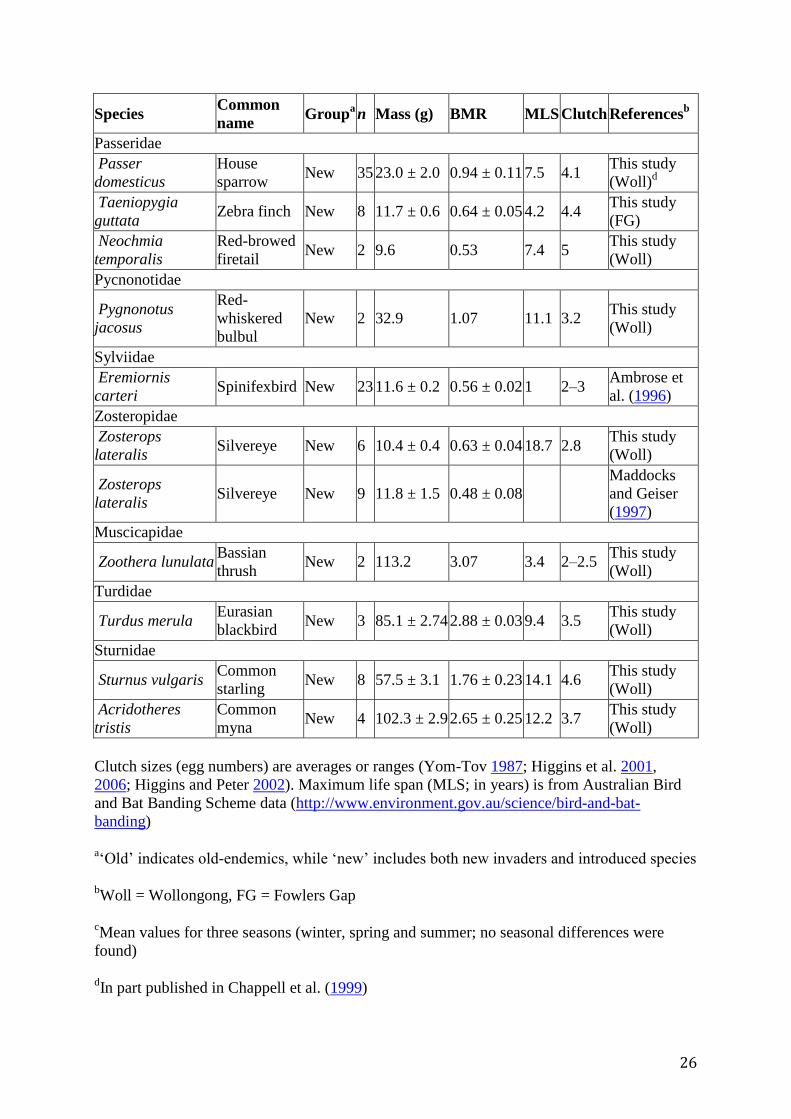
Table 1
Body mass and BMR (in ml O2 min−1
) in Australian old and new endemic passerine birds
(n = number of individuals)
Species Common
name Group
a n Mass (g) BMR MLS Clutch References
b
Maluridae
Malurus cyaneus Superb fairy-
wren Old 10 8.7 ± 0.5 0.53 ± 0.08 10.4 3.1
This study
(Woll)
Malurus cyaneus Superb fairy-
wren Old 9.2 0.45
Lill et al.
(2006)c
Malurus lamberti Variegated
fairy-wren Old 7 7.8 ± 0.4 0.55 ± 0.03 11 2.8
This study
(FG)
Meliphagidae
Acanthagenys
rufogularis
Spiny-
cheeked
honeyeater
Old 7 43.4 ± 4.4 1.90 ± 0.21 13.6 2.2 This study
(FG)
Manorina
flavigula
Yellow-
throated
miner
Old 5 41.1 ± 3.7 1.83 ± 0.22 12.1 3.2 This study
(FG)
Meliphaga
lewinii
Lewin’s
honeyeater Old 7 36.2 ± 3.0 1.60 ± 0.10 15.9 2.2
This study
(Woll)
Lichenostomus
virescens
Singing
honeyeater Old 12 25.0 1.03 12 2.2
Collins et al.
(1980)
Lichenostomus
virescens
Singing
honeyeater Old 4 20.7 ± 0.8 1.06 ± 0.05
This study
(FG)
Lichenostomus
penicillatus
White-
plumed
honeyeater
Old 9 17.7 ± 1.3 0.97 ± 0.06 15.9 2.3
Buttemer and
Astheimer
(2000)
Melithreptus
lunatus
White-naped
honeyeater Old 11 14.3 ± 0.6 0.74 ± 0.01 12.3 2.7
Vitali et al.
(1999)
Lichmera
indistincta
Brown
honeyeater Old 15 9.0 0.55 13.2 1.9
Collins et al.
(1980)
Lichmera
indistincta
Brown
honeyeater Old 6 10.1 ± 0.7 0.63 ± 0.03 2
Vitali et al.
(1999)
Phylidonyris
pyrrhoptera
Crescent
honeyeater Old 14.6 0.96 10.9 2.1
Weathers et
al. (1996)
Phylidonyris
novaehollandiae
New Holland
honeyeater Old 17.3 0.95 14.4 2.2
Weathers et
al. (1996)
Phylidonyris
melanops
Tawny-
crowned
honeyeater
Old 13 18.8 ± 0.7 0.87 ± 0.03 4.9 2.0 Vitali et al.
(1999)
Acanthorhynchus
tenuirostris
Eastern
spinebill Old 7 11.3 ± 0.9 0.83 ± 0.07 15.5 2.2
This study
(Woll)
Acanthorhynchus
tenuirostris
Eastern
spinebill Old 9.7 0.74
Weathers et
al. (1996)
Pardalotidae

25
Species Common
name Group
a n Mass (g) BMR MLS Clutch References
b
Pardalotus
punctatus
Spotted
pardalote Old 2 7.8 0.66 4 3–4
This study
(Woll)
Sericornis
citreogularis
Yellow-
throated
scrubwren
Old 3 16.9 ± 0.5 1.09 ± 0.08 15.6 2.5 This study
(Woll)
Sericornis
frontalis
White-
browed
scrubwren
Old 11 13.2 ± 0.8 0.96 ± 0.10 17.6 2.8 This study
(Woll)
Sericornis
magnirostris
Large-billed
scrubwren Old 1 8.7 0.61 15.3 3
This study
(Woll)
Smicrornis
brevirostris Weebill Old 1 5.9 0.49 7.4 2.6
This study
(FG)
Acanthiza pusilla Brown
thornbill Old 6 6.4 ± 0.7 0.67 ± 0.07 17.7 2.9
This study
(Woll)
Acanthiza
uropygialis
Chestnut-
rumped
thornbill
Old 2 6.6 0.53 12.7 3.3 This study
(FG)
Acanthiza
chrysorrhoa
Yellow-
rumped
thornbill
Old 8 8.3 ± 0.6 0.67 ± 0.07 13.1 3.2 This study
(FG)
Acanthiza lineate Striated
thornbill Old 1 7.3 0.48 23.5 2.9
This study
(Woll)
Pomatostomidae
Pomastostomus
superciliosus
White-
browed
babbler
Old 4 36.1 ± 0.7 1.03 ± 0.06 14.4 2.6 This study
(Woll)
Pomastostomus
ruficeps
Chestnut-
crowned
babbler
Old 8 45.4 ± 2.5 1.32 ± 0.11 8.3 ca. 4 This study
(FG)
Petroicidae
Eopsaltria
australis
Eastern
yellow robin Old 7 19.2 ± 2.3 1.05 ± 0.10 14.6 2.3
This study
(Woll)
Cinclostomatidae
Psophodes
olivaceus
Eastern
whipbird Old 1 61.0 2.12 12.3 2–3
This study
(Woll)
Pachycephalidae
Pachycephala
pectoralis
Golden
whistler Old 4 24.0 ± 0.3 1.08 ± 0.06 18 2.2
This study
(Woll)
Dicruridae
Rhipidura
fuliginosa Grey fantail Old 1 8.9 0.49 9.7 2.7
This study
(Woll)
Artamidae
Cracticus
torquatus
Grey
butcherbird Old 2 93.7 2.13 20.2 3.2
This study
(Woll)
Strepara
graculina
Pied
currawong Old 1 306.7 5.65 24.1 3.1
This study
(Woll)
26
Species Common
name Group
a n Mass (g) BMR MLS Clutch References
b
Passeridae
Passer
domesticus
House
sparrow New 35 23.0 ± 2.0 0.94 ± 0.11 7.5 4.1
This study
(Woll)d
Taeniopygia
guttata Zebra finch New 8 11.7 ± 0.6 0.64 ± 0.05 4.2 4.4
This study
(FG)
Neochmia
temporalis
Red-browed
firetail New 2 9.6 0.53 7.4 5
This study
(Woll)
Pycnonotidae
Pygnonotus
jacosus
Red-
whiskered
bulbul
New 2 32.9 1.07 11.1 3.2 This study
(Woll)
Sylviidae
Eremiornis
carteri Spinifexbird New 23 11.6 ± 0.2 0.56 ± 0.02 1 2–3
Ambrose et
al. (1996)
Zosteropidae
Zosterops
lateralis Silvereye New 6 10.4 ± 0.4 0.63 ± 0.04 18.7 2.8
This study
(Woll)
Zosterops
lateralis Silvereye New 9 11.8 ± 1.5 0.48 ± 0.08
Maddocks
and Geiser
(1997)
Muscicapidae
Zoothera lunulata Bassian
thrush New 2 113.2 3.07 3.4 2–2.5
This study
(Woll)
Turdidae
Turdus merula Eurasian
blackbird New 3 85.1 ± 2.74 2.88 ± 0.03 9.4 3.5
This study
(Woll)
Sturnidae
Sturnus vulgaris Common
starling New 8 57.5 ± 3.1 1.76 ± 0.23 14.1 4.6
This study
(Woll)
Acridotheres
tristis
Common
myna New 4 102.3 ± 2.9 2.65 ± 0.25 12.2 3.7
This study
(Woll)
Clutch sizes (egg numbers) are averages or ranges (Yom-Tov 1987; Higgins et al. 2001,
2006; Higgins and Peter 2002). Maximum life span (MLS; in years) is from Australian Bird
and Bat Banding Scheme data (http://www.environment.gov.au/science/bird-and-bat-
banding)
a‘Old’ indicates old-endemics, while ‘new’ includes both new invaders and introduced species
bWoll = Wollongong, FG = Fowlers Gap
cMean values for three seasons (winter, spring and summer; no seasonal differences were
found)
dIn part published in Chappell et al. (1999)

27
Table 2
Allometric equations for BMR in several groups of birds, based on ordinary least squares
regression, for the relationship between body mass and BMR, where BMR (Watts) = a × M b b
(in g)
Group N a b r 2
Old-endemic 30 0.0547 0.602 ± 0.033 0.92
New-arrivals 10 0.0327 0.722 ± 0.030 0.98
North-temperate passerines 89 0.0329 0.739 ± 0.036 0.83
Temperate breedersa 203 0.0425 0.644 ± 0.012 0.94
Tropical breedersa 316 0.0482 0.592 ± 0.014 0.85
Passerinesa 376 0.0438 0.637 ± 0.017 0.79
Non-passerine ordersa 143 0.0351 0.659 ± 0.015 0.93
Slope (b) is shown ±SE. In all cases, F > 200 and P < 0.0001
aData from Londoño et al. (2015)

28
Table 3
Regression of phylogenetic independent contrasts (PIC) of body mass versus PIC of BMR,
where PIC BMR = a + b × PIC mass
Group N a b r 2
Old-endemics 30 0.0007 0.678 ± 0.07 0.82
New-arrivals 10 −0.004 0.757 ± 0.04 0.98
North-temperate passerinesa 89 −0.002 0.737 ± 0.05 0.69
Temperate breedersa 203 −0.002 1.033 ± 0.04 0.75
Tropical breedersa 316 0.0005 0.981 ± 0.03 0.58
Passerinesa 376 0.0002 0.876 ± 0.04 0.52
Non-passerine ordersa 143 −0.0008 1.095 ± 0.05 0.76
Slope (b) is shown ±SE. In all cases, F > 190 and P < 0.0001
aData from Londoño et al. (2015)