a simple mathematical model for anaerobic digestion process
TRANSCRIPT

~ Pergamon
PH: 80273-1223(97)00166-2
War. Sci. T~clr. Vol. H. No.8. pp. 185-191. 1997.II:> 1997 IAWQ. Pubhshed by Elsevier Science LId
Printed in Greal Britain.0273-1223/97 $17'00 + 0'00
A SIMPLE MATHEMATICAL MODEL FORANAEROBIC DIGESTION PROCESS
S. JeyaseelanSchool o/Civil and Structural Engineering, Blk NJ. #AJ-37, Nanyang TechnologicalUniversity, Nanyang Avenue, Singapore 639798
ABSTRACf
Six different conversion processes have been identified in the anaerobic digestion of particulate organicmaterial to methane. Hydrolysis followed by intermediate acids formation and fermentation to producemethane by five different groups of microorganisms. These may be largely grouped into two major groups.namely the acid producing microorganisms and methane producing microorganisms. Monod kinetic rateequation applies to a strain of bacteria growing on a single rale-Iimiting substrale. By identifying the kineticcoefficients of the Monod kinetic rate equation for every single component of the solids in wastewater animproved prediction of the anaerobic digestion process can be made using Monod kinetic rate equalion.Separate kinetic coefficients for acid fonnation and methane formation must be identified from the literatureor determined through laboratory analysis. Municipal wastewater may be considered as a mixture ofcarbohydrates. proteins. lipids and a very small proportion of other materials. By an extensive literaturereview. many Monod kinetic coefficients for the above said components were selected and a very fewassumed. Several loading conditions for different proportions of influent wastewater characteristicssimulating actual operations were tested using this model. The model can be used to set operating parameterssuch as BOD loadings. retention times and temperatures that will produce desired efficiency in the systemswithin practical limits. <C> 1997 IAWQ. Published by Elsevier Science Ltd
KEYWORDS
Anaerobic digestion; kinetic coefficients; hydrolysis; fennentation; methanogenesis; acetogenesis;wastewater; sludge digestion; treatment efficiency.
INTRODUCTION
Anaerobic treatment has, for many years, provided a technological solution for stabilization of animalmanures and municipal sludges. Anaerobic degradation of organic matter is a complicated biological processand the conversion of organic matter through microbial activities to methane and carbon dioxide involvesseveral groups of microorganisms. The conversion process consists of several independent consecutive andparallel reactions in which a close-knit community of bacteria co-operate to fonn a stable, self-regulatingfennentation that converts organic matter into a mixture of methane and carbon dioxide gases. Two majorgroups of bacteria are responsible for these conversions. The two groups differ significantly with respect tophysiology, nutrient requirements, growth and metabolic characteristics, environmental optima andsensitivity (Ghosh and Pohland, 1974, and Ghosh and Klass. 1978). By separating these two groups andproviding favourable conditions, improved process efficiency could be achieved (Ghosh and Klass, 1978).
18.5

186 S. JEYASEELAN
The study of the microbial ecology of the anaerobic digestion process revealed the conversion to beachieved in six different stages after tripping of biogas. They are listed as hydrolysis ofbiopolymers(proteins. carbohydrates, lipids) into the monomers (animoacids. sugars and long chain fattyacids). fermentation of amino acids and sugars. anaerobic oxidation of long-ehain fatty acids and alcohols.anaerobic oxidation of intermediary products such as volatile fatty acids, conversion of acetate to methaneand conversion of hydrogen to methane (Gujer and Zehnder, 1983; Zinder, 1984). Based on these paths. it ispossible to simulate the anaerobic process and predict the variations in biomass. biogas production andcomposition.
MATHEMATICAL MODELS ON ANAEROBIC PROCESSES
Several mathematical models to characterize the anaerobic digestion process have been developed.Mathematical models have been proposed simulating paths of conversions. The six steps mentioned abovehave been further expanded to fourteen steps identifying the decay of five distinct microbial groups. andincorporating protolysis of biocarbonate and deprotolysis of carbon dioxide (Siegrist et al., 1993). Separatemodels to simulate these 14 processes have been proposed. These models use extensive and complexexperimental data and the models are complicated. Simple empirical models of biological processes are usedby engineers to aid design as a tool for process optimization and this minimizes the analysis of extensive andcomplex experimental data. The Monod model has been the most popularly used. This model was proposedto define the effect of a limiting substrate or nutrient.
THE PROPOSED MODEL
In this simplified model. all the above discussed processes of the anaerobic digestion process are groupedinto two conversion processes. Firstly, the various components of the wastewater are converted to volatileacids by the group of acetogenous bacteria. Monod kinetics describing microbial activity is applied to theindividual components of the wastewater. Secondly, the combined acids produced by the first group ofbacteria are converted to methane and carbon dioxide gases by another group of bacteria and the Monodkinetics is separately applied to this methanogenous activity. This converts volatile acids to methane andcarbon dioxide.
(Bact.ria)
XI
1 1IcarbohYd""al Lipids I I r ....'.iDl I IOlIN. Orpala I
lsc ,..-l=---.-J'---sP_1so1 -----t----- 1
(olbln)Ip
X2 PI.Q4P2-CO,
Figure I. Conversion processes of the Proposed kinetic model.

Anaerobic digestion process 187
The fonnulation of the model is based on the following assumptions. Wastewater is considered as composedof carbohydrates, proteins, lipids and others. These components biodegrade independently without anyinteractions within the intennediate compounds, except in the second stage where the combined volatileacids are degraded to produce biogas. The path of the simplified model is shown in Figure I. The mixedwaste is subdivided into four components, namely carbohydrates (SC), Lipids (SL), Proteins (SP) and others(SO). These complex organic materials are degraded to short-chain organic molecules (mainly volatile fattyacids), which are then converted to organic acids (mainly acetic, propionic and butyric acids). In the secondstage, the intermediate products (organic acids) are converted to methane and carbon dioxide. Organic acidsfrom carborhydrates, proteins, lipids and other organics are treated as a single substrate in the second stage.
The biomass growth rate with Monod kinetic equations may be expressed as in equation (I) and thisequation can be further refined by the introduction of decay coefficient(k~ due to endogenous respiration asshown in equation (2).
rg =kXYS/(Ks + S)
r', =kXY S/(Ks +S) -~X
(I)
(2)
Mass balance equations for microorganism and limiting substrate in a continuous flow system can beestimated by equating accumulation against the increases and decreases occuring in an infinitely short timeinterval as follows.
Rate of accumulationof microorganism =within the systemboundary
Rate of flow ofmicroorganisminto the systemboundary
Rate of flow ofmicroorganismout of the systemboundary
+Net growth ofmicroorganismwithin the systemboundary
This can be written as: Accumulation = Inflow - Outflow + Net growth
(dXIdt).V (3)
Neglecting the concentration of microorganism in the influent, as there is no accumulation at steady statecondition (dXIdt =0), the equation (3) combined with equation (2) reduces to
qN =kYS/(Ks + S) -~
The corresponding substrate balance equation, at steady state yields
From the above equations the following two equations can be derived.
XI = -------------..---
K..{1 + 0.k.JSI -= ----------
0.(Y.k • k,.) - I
(4)
(5)
(6)
(7)
Incorporating the new concepts, by considering the carbohydrates, lipids, proteins and other organicsseparately, the above two equations (6) and (7) can be replaced by equations (8) and (9) respectively.
188
Y(S.. - S;I)XI t -----------.._-_.._--
(I + 0.kool)
K•.(I + 0·kot)S. = t ----------------------
0.(Y j .k, - kool) - I
S. JEYASEELAN
(i = C,L,P,O)
(i = C,L,P,O)
(8)
(9)
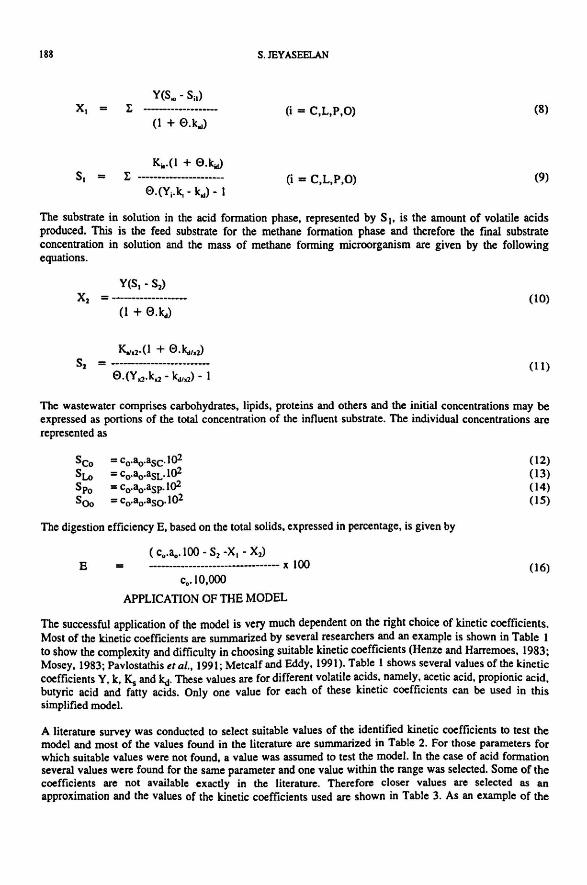
The substrate in solution in the acid formation phase, represented by S l' is the amount of volatile acidsproduced. This is the feed substrate for the methane formation phase and therefore the fmal substrateconcentration in solution and the mass of methane forming microorganism are given by the followingequations.
X2 = ------------------
Sl = -...-----------------------
(10)
(11)
The wastewater comprises carbohydrates, lipids, proteins and others and the initial concentrations may beexpressed as portions of the total concentration of the influent substrate. The individual concentrations arerepresented as
Seo = co·80·ase· l()2SLo = Co·80·asv l()2Spo = Co·80·aSp·l()2SOo =co·ao·aso·1 ()2
The digestion efficiency E, based on the total solids, expressed in percentage, is given by
(12)(13)(14)(15)
=E( c•.a.,.IOO - S2 -X, - X2)
-------------------------------- x 100c•. 10,000
APPLICATION OF THE MODEL
(16)
The successful application of the model is very much dependent on the right choice of kinetic coefficients.Most of the kinetic coefficients are summarized by several researchers and an example is shown in Table Ito show the complexity and difficulty in choosing suitable kinetic coefficients (Henze and Harremoes, 1983;Mosey, 1983; Pavlostathis et al., 1991; Metcalf and Eddy, 1991). Table I shows several values of the kineticcoefficients Y, k, Ks and k.J. These values are for different volatile acids, namely, acetic acid, propionic acid,butyric acid and fatty acids. Only one value for each of these kinetic coefficients can be used in thissimplified model.
A literature survey was conducted to select suitable values of the identified kinetic coefficients to test themodel and most of the values found in the literature are summarized in Table 2. For those parameters forwhich suitable values were not found, a value was assumed to test the model. In the case of acid formationseveral values were found for the same parameter and one value within the range was selected. Some of thecoefficients are not available exactly in the literature. Therefore closer values are selected as anapproximation and the values of the kinetic coefficients used are shown in Table 3. As an example of the

Anaerobic digestion process 189
application. a wastewater flow of 250 m3/d with 3% solids concentration and an effective digester volume of5390 m3 are used.
Several runs with selected kinetic coefficients and varying volatile solids concentrations have been carriedout. The results of these runs together with the runs for the variations of different compositions of thesubstrate are presented in Table 4. For the selected kinetic coefficients volatile solids digestion efficiencyranges from 92% to 97% for all the volatile solids contents assumed. Table 5 shows that the variations insubstrate composition affect the digestion efficiencies. For the kinetic coefficients selected the variations aresmall. At 0.5 proportion of carborhydrates. the digestion efficiencies with 0.4 proportion of lipids is betterthan that for 0.1 proportion of lipids. For the same proportions of carbohydrates, higher lipids contents yieldbetter efficiencies.
Table 1. Values of kinetic constants (Mosey. 1983)
Component Temp. Y k K. ~(OC) (d· l ) (me.L· I ) (d· l )
Acetic Acid 35 0.04 8.1 154 0.01930 0.054 4.8 333 0.03725 0.05 4.7 869 0.011
Propionic Acid 35 0.042 9.6 32 0.01025 0.051 9.8 613 0.040
Butvric Acid 35 0.047 15.6 5 0.027Fatty Acid 35 0.12 6.67 680 0.015
25 0.12 4.65 1270 0.01520 0.12 3.85 1580 0.015
Glucose 37 0.173 30.0 23 0.8
Table 2. Kinetic constants ranges from literature
Component y k K. Ie,.(gVSS (d· l ) (mg.L· I
) W) Reference/I!com
Acid phaseCarbohydrates 0.14-0.17 42-214 22.5-630 6.1 Pavlostathis,1991Proteins 0.07-0.13 -- -- -. Metcalf & Eddy,1991Lipids 0.04-0.11 0.77-13.8 105-3180 0.01- Pavlostathis,1991
0.015Methane phaseAcetic 0.01- 1.48·70 11-421 6.1 Pavlostathis,1991acid/acetate 0.054
Table 3. Typical values of kinetic constants used in the model
Component y k K. Ie,.(gVSS (d· l
) (mg.L· I) (d'I)
/2COD)Acid phase
Carbohydrates 0.14 90 450 6.1Proteins 0.128 20 500 0.014Lioids 0.10 12 850
Methane phaseAcetic acid/acetate 0.03 6 400 0.037

190 S. lEYASEELAN
The effect of retention time on digestion efficiencies was tested with 70% volatile solids concentration aspercentage of total solids. For selected kinetic coefficients. variation of retention times and correspondingdigestion efficiencies are reported in Table 5. The results show that longer retention times provide betterdigestion efficiencies and efficiencies for selected retention times can be determined using the model.
Table 4. Digestor performance with varying volatile solids contents and substrate compositions
asc lisL lisp Influent Vol. Volatile solids Total solidsSolidsrrS (%) dig. eff.(%) diS!. eff. (%)
0.5 0.2 0.3 40 92.93 37.1750 93.50 46.7560 93.88 56.3270 94.15 65.9180 94.36 75.48
0.8 0.1 0.1 40 95.47 37.5650 96.07 47.2360 96.42 56.9170 96.69 66.5980 96.90 76.26
0.5 0.1 0.4 40 92.55 37.0250 93.12 46.5660 93.50 56.1070 93.77 65.6480 93.98 75.18
0.5 0.4 0.1 40 93.67 37.4750 94.25 47.1360 94.63 56.7870 94.90 66.4380 95.11 76.09
Table 5. Effects of retention time on digestion efficiencies
Retention time (davs) 10 20 30 40Volatile solids digestion efficiencv (%) 90.14 94.92 95.88 96.42Total solids diS!estion efficiencv-(%) 63.09 66.44 67.12 67.49
CONCLUSIONS
The model demonstrates that variation of composition of the substrates and retention times affects theefficiency of the digester. The model is simple and can be used to analyse digestion of a known substratewith respect to varying operational parameters such as retention time and temperature. The model can becalibrated with one set of data and used to predict the efficiency knowing the composition of the substrateand controlling the retention time in the digester.
REFERENCES
Guger, W. and Zehnker. A. J. B. (1983). Conversion processes in anaerobic digestion. Wat. Sci. Tuh.l5(819), 127-167.Ghosh. S. and Pohland. F. O. (1974). Kinetics of substrate assimilation and product formation in anaerobic digestion. Joumal
WPCF, 46, 748·7S8.Ghosh. S. and Klass. D. L. (1978). Two phase anaerobic digestion. Process Biochemistry. 30-48.Henze. M. and Harremoes, P. (1983). Anaerobic treatment of wastewater in fixed film reactors - a literature review. Wat. Sci.
Tech.. 15(819), 1-10.

Anaerobic digestion process 191
Metcalf and Eddy. Inc. (1991). Wastewater Engineering: Treatment. Disposal and Reuse. McGraw-Hili International Editions.Third Edition.
Mosey. F. E. (1983). Mathematical modelling of the anaerobic digestion process: regulatory mechanisms for the formation ofshort-chain volatile acids from glucose. Wat. Sci. Tech. 15(819),209-232.
PaivOSlathis. S. G. and Giraldo-Gomez. E. (1991). Kinetics of anaerobic treatment. War. Sci. Tech. 24(8). 35-59.Siegrit. H.• Renggli. D. and Gager. W. (1993). Mathematical modelling of anaerobic mesophilic sewage sludge treatment. Wat.
Sci. Tech .• 27(2). 25-36.Zinder. S. H. (1984). Microbiology of anaerobic conversion of organic wastes to methane: recent developments. ASM News. SO.
294-298.
NOMENCLATURE
Ks~sKstx2qr,r gSSIS2SoSioSilVXXoXiYYiYx2
- solids retention time. d- percentage of volatile solids. (%)- ratio of carbohydrates/volatile solids- ratio of lipids/volatile solids- ratio of proteins/volatile solids- ratio of other organics/volatile solids- influent sludge concentration (%)- digestion efficiency (%)- maximum specific growth/maximum yield coefficient. d-I- maximum specific growth/maximum yield coefficient, for substrate i in the acid fonnation phase,
d-I- maximum specific growth/maximum yield coefficient, for substrate i in the methane fonnation
phase, d-I- half velocity constant. mass/unit volume- half velocity constant for substrate i in the acid fonnation phase, mass/unit volume- half velocity constant for volatile acids in the methane fonnation phase.mass/unit volume- rate of wastewater flow, volume/time- rate of microorganism growth, mass/unit volume.time- net rate of microorganism growth, mass/unit volume.time- concentration of growth-limiting substrate in solution, mass/unit volume- concentration of growth-limiting volatile acids in solution, mass/unit volume- cone. of growth-limiting substrate in solution for methane phase, mass/unit volume- influent concentration of growth-limiting substrate. mass/unit volume- concentration of growth-limiting substrate i in solution. mass/unit volume- concentration of growth-limiting substrate i in solution. mass/unit volume- effective volume of digester- concentration of microorganism in the digester, mass/unit volume- concentration of influent microorganism. mass/unit volume• concentration of microorganism feeding on substrate i. mass/unit volume- maximum yield coefficient- maximum yield coefficient for substrate i in the acid fonnation phase- maximum yield coefficient for substrate i in the methane fonnation phase