a shallow subsurface controlled release facility in … subsurface controlled... · a shallow...
TRANSCRIPT

SPECIAL ISSUE
A shallow subsurface controlled release facility in Bozeman,Montana, USA, for testing near surface CO2 detection techniquesand transport models
Lee H. Spangler • Laura M. Dobeck • Kevin S. Repasky • Amin R. Nehrir • Seth D. Humphries •
Jamie L. Barr • Charlie J. Keith • Joseph A. Shaw • Joshua H. Rouse • Alfred B. Cunningham • Sally M. Benson •
Curtis M. Oldenburg • Jennifer L. Lewicki • Arthur W. Wells • J. Rodney Diehl • Brian R. Strazisar •
Julianna E. Fessenden • Thom A. Rahn • James E. Amonette • Jon L. Barr • William L. Pickles •
James D. Jacobson • Eli A. Silver • Erin J. Male • Henry W. Rauch • Kadie S. Gullickson • Robert Trautz •
Yousif Kharaka • Jens Birkholzer • Lucien Wielopolski
Received: 22 June 2009 / Accepted: 28 November 2009
� The Author(s) 2009. This article is published with open access at Springerlink.com
Abstract A controlled field pilot has been developed in
Bozeman, Montana, USA, to study near surface CO2
transport and detection technologies. A slotted horizontal
well divided into six zones was installed in the shallow
subsurface. The scale and CO2 release rates were chosen to
be relevant to developing monitoring strategies for geo-
logical carbon storage. The field site was characterized
before injection, and CO2 transport and concentrations in
saturated soil and the vadose zone were modeled. Con-
trolled releases of CO2 from the horizontal well were
performed in the summers of 2007 and 2008, and collab-
orators from six national labs, three universities, and the
U.S. Geological Survey investigated movement of CO2
through the soil, water, plants, and air with a wide range of
near surface detection techniques. An overview of these
results will be presented.
L. H. Spangler (&) � L. M. Dobeck � K. S. Gullickson
Department of Chemistry and Biochemistry,
Montana State University, Bozeman, MT 59717, USA
e-mail: [email protected]
K. S. Repasky � A. R. Nehrir � S. D. Humphries �J. L. Barr � C. J. Keith � J. A. Shaw � J. H. Rouse
Department of Electrical and Computer Engineering,
Montana State University, Bozeman, MT 59717, USA
A. B. Cunningham
Department of Civil Engineering, Montana State University,
Bozeman, MT 59717, USA
S. M. Benson
Global Climate and Energy Project, Stanford University,
Stanford, CA 94305, USA
C. M. Oldenburg � J. L. Lewicki � J. Birkholzer
Earth Sciences Division, Ernest Orlando Lawrence Berkeley
National Laboratory, Berkeley, CA 94720, USA
A. W. Wells � J. R. Diehl � B. R. Strazisar
Environmental Science Division, National Energy Technology
Laboratory, Pittsburgh, PA 15236, USA
J. E. Fessenden � T. A. Rahn
Division of Earth and Environmental Sciences, Los Alamos
National Laboratory, Los Alamos, NM 87545, USA
J. E. Amonette � J. L. Barr
Pacific Northwest National Laboratory, Richland,
WA 99352, USA
W. L. Pickles � J. D. Jacobson � E. A. Silver � E. J. Male
Earth and Planetary Sciences, University of California-Santa
Cruz, Santa Cruz, CA 95064, USA
H. W. Rauch
Department of Geology and Geography, University of West
Virginia, Morgantown, WV 26506, USA
R. Trautz
Electrical Power Research Institute, Palo Alto, CA 94304, USA
Y. Kharaka
U.S. Geological Survey, Menlo Park, CA 94025, USA
L. Wielopolski
Department of Environmental Science, Brookhaven National
Laboratory, Upton, NY 11973, USA
123
Environ Earth Sci
DOI 10.1007/s12665-009-0400-2

Keywords Geological carbon sequestration � Controlled
release of carbon dioxide � Transport models �Near surface monitoring � Eddy covariance �Hyperspectral imaging
Introduction
One aspect of mitigating global climate change is the
capture and storage of carbon in geologic formations.
Technologies for assuring effectiveness of carbon capture
and storage under deep injection conditions have already
been implemented at pilot sites such as Weyburn (Whit-
taker 2004) and Frio (Hovorka et al. 2006).
Two other types of experiments have sought to address
these issues and have yielded valuable information.
First, natural analog sites where geologically generated
CO2 rises to the surface such as Mammoth Mountain
(Anderson and Farrar 2001; Lewicki et al. 2008a) and the
Latera caldera in Italy (Annunziatellis et al. 2008) have
been investigated using a variety of detection technologies
which have determined soil gas concentrations and soil
gas flux of CO2 as well as impact on plant life. These
sites have a long-established flux and an unknown source
term which makes it difficult to establish detection limits
for near surface monitoring technologies and hampers
transport modeling because flow paths have been long
established. Additionally, onset of environmental response
such as plant stress and recovery rates after excess CO2
exposure ceases cannot be studied at the natural analog
sites. Both of these issues may be of interest in using
plant response for leak detection in engineered storage
sites.
Second, there has been a small scale experiment using
*2.5 9 2.5 m land plots each fed with a separate CO2 line
(West et al. 2008). This experiment is highly useful for its
designed intent, understanding the biological response of
various plant types at elevated CO2 levels. The small
spatial extent, however, makes it difficult to scale to
potential seepage at a storage site and does not allow
suitable testing of detection technologies that measure or
survey larger areas.
Zero Emission Research and Technology Center (ZERT,
a collaborative involving three universities and six DOE
national laboratories) has developed a testing site with
controlled, shallow release of CO2 to provide controlled
flux, the ability to start and stop flow to measure onset and
recovery response times and with a large enough spatial
extent to permit testing of most relevant detection
technologies.
A wide variety of detection methods have been
implemented with the goal of establishing detection limits
for various methods, determining efficacy of monitoring
strategies and understanding transport from the saturated
zone to the vadose zone and ultimately to the atmosphere.
Release rates were chosen to both challenge detection
limits of near surface detection technologies and also
mimic low-level seepages consistent with desired reten-
tion rates that would mitigate climate change as per the
IPCC guidance (IPCC 2005). If a storage project for a
500 MW power plant is envisioned, a total of *200
Megatons of CO2 will be emplaced over the power plant
lifetime (*4 Mt/year times 50 years). A retention rate of
99.999% per year (99% retention over 1,000 years) would
result in escape of approximately 20,000 t/year or 54 t/
day. If this were to occur along a fault of dimensions
1 km long by 70 m wide, the ZERT facility would be 1%
of this dimension. Thus, a flow of 0.54 t/day at the con-
trolled site would yield the same surface flux (over a
smaller area) that is realistic for desired retention rates. A
rate was chosen that was a significant fraction of this
value, 0.3 t/day.
Characterization of the field site
Soil and plants
The ZERT field site is located on a relatively flat 12 ha
former agricultural plot at the western edge of the Mon-
tana State University-Bozeman campus in Bozeman,
Montana, USA. It is at an elevation of 1,495 m. Vege-
tation on the site consists primarily of alfalfa, clover,
dandelion, thistle, and a variety of grasses. Conditions
underlying the field are typical of the Bozeman area with
alluvial sandy gravel deposits (1,500–1,800 m thick)
overlain by a few meters of silts and clays with a topsoil
blanket (Mokwa R., ‘‘Subsurface exploration for the MSU
CO2 injection project-Phase I’’, unpublished report,
Montana State University, Civil Engineering Department,
2006). There is moderate variation in the thickness of the
topsoil layer which manifests itself as gentle surface
features such as swales and ridges on the field. Test pits
and cores collected from several locations on the field
consistently revealed two distinct soil horizons. The top-
soil of organic silt and clay with some sand ranges in
thickness from 0.2 to 1.2 m. Beneath this is a cohesion-
less deposit of sandy gravel extending to the deepest
depths investigated (5 m).
To assess bulk soil properties that could influence CO2
transport, several field measurements were performed. In
October 2006 percolation tests were carried out to make
estimates of hydraulic conductivity. These tests involved
digging a hole 7 in. deep and repeatedly filling with 6 in. of
water and measuring the time for the water level to drop
1 in. Resulting hydraulic conductivities were calculated in
Environ Earth Sci
123
length/time units. The hydraulic conductivity measured in
the upper soil (sandy silt) layer was *0.76 and *1.4 m/
day in the sand-gravel aquifer. In separate measurements
the average bulk density of the topsoil layer was deter-
mined from core samples to be 1.4 g/cm3.
In July–October of 2007, 18 soil gas permeability
measurements were taken using a compressed air-based
permeameter developed by Iversen et al. (2003). The
permeameter was used to measure the relative perme-
ability to flowing air of the top 0.46 m of soil. Concurrent
measurements of soil moisture in the top 0.3 m of soil
were made using Time Domain Reflectometry (e.g. Topp
and Davis 1985). Soil moisture was expressed as percent
saturation (i.e. percent of soil void space occupied by
water) and air permeability was computed in Darcy units.
Two observations were made: (1) under wet soil condi-
tions (percent saturation *95%) soil permeability to gas
varied between 3.9 Darcy for soil with prairie grass
growing in it and 9.5 Darcy for soil with alfalfa, and (2)
for relatively dry soil conditions (percent saturation less
than *60%) soil gas permeability ranged between 106
and 437 Darcy with no correlation observed with plant
species.
Groundwater
The depth of the water table at the ZERT field site varies
seasonally but always remains quite close to the ground
surface. Following heavy springtime precipitation events it
has been observed to be essentially at the ground surface in
lower lying areas of the field. Over the two and a half years
the depth of the water table has been monitored at the site,
a variation of about 1 m has been recorded. During summer
months the depth of the water table averages about 1.5 m
below ground surface at the southwest end of the horizontal
well. From measurements made in 2006, the direction of
the ground water gradient was estimated to be 17� west of
north. Samples taken by the U.S. Geological Survey before
the first CO2 injection of 2008 showed the groundwater to
have a pH of approximately 7 and a fresh water salinity of
about 600 mg/L TDS. The dominant anion is HCO3, and
the dominant cations are Ca and Mg. There are relatively
low concentrations of Cl and SO4, and the concentrations
of Fe, Mn, Zn, Pb and other trace metals are expectedly
low, at ppb levels (see Kharaka et al., this issue for further
details).
Meteorology
Meteorological data including barometric pressure, tem-
perature, relative humidity, and wind speed and direction
have been continuously monitored at the field site since
September of 2006. This has been supplemented with
precipitation data during and directly before and after CO2
releases. Weather stations on the field record a fairly
consistent diurnal pattern during summer months, with
daytime winds tending to come from the W-NW and
nighttime winds tending to come from the S-SE. This
indicates the general pattern of air rising from the lower
portions of the valley toward the higher elevations with
daytime heating followed by nighttime downslope winds
with valley cooling. In addition to weather data, local soil
moisture levels in the upper 30 cm of soil were recorded by
an array of 15 water content reflectometers in the summer
of 2008.
Controlled release infrastructure
Horizontal well
The horizontal well was sited on the field 45� east off true
north. This orientation was chosen to allow resolution of
vector components perpendicular to the well of potential
CO2 transport both in groundwater and by wind. In order
to minimize the disturbance to the formation, horizontal
directional drilling was chosen as the method of instal-
lation over more aggressive, albeit easier and less costly
methods such as trenching. The well casing is 98 m of
10.16 cm diameter Schedule 40, 304 L stainless steel
pipe. Fifteen and twelve meters on the southwest and
northeast ends, respectively, is solid casing. The remain-
ing central 70 m is slotted with a 20-slot pattern and has
an open area of 0.55%. Directed Technologies Drilling
Inc. installed the well in early December of 2006. A
biodegradable drilling fluid manufactured by Cetco called
Cleandrill that is composed largely of cornstarch, guar
gum, and xanthan gum was used as a lubricant and later
flushed with enzyme breaker in the well development
stage. To preserve the connectivity with the surrounding
formation use of bentonite as a drilling fluid was avoided.
Although effective in the installation process, bentonite
would have left an unacceptable impermeable annulus
around the well casing.
Cobble in the gravel layer presented very difficult dril-
ling conditions, and it was not possible to install the well
screen without some deflection off of a level straight path.
Vertical location (accuracy of ±5% of the absolute depth)
of a sonde in the drilling head was done every 4.6 m along
the length of the well during installation. Thus, depth
below ground surface and the location on the surface
directly above the well is known at intervals of 4.6 m. The
average depth of the slotted section of the well is 1.8 m
below the ground surface. For the 2007 and 2008 experi-
ments this means that the CO2 was injected into the sandy
gravel layer and below the water table.
Environ Earth Sci
123
The CO2 injected was food grade and originated from
Alberta and Wyoming natural gas fields. The refrigerated
liquid CO2 stored on site was converted by a vaporizer to
deliver gaseous CO2 at roughly ambient temperature. An
inline regulator stepped the pressure down to *55 psig
before it entered the mass flow controller system.
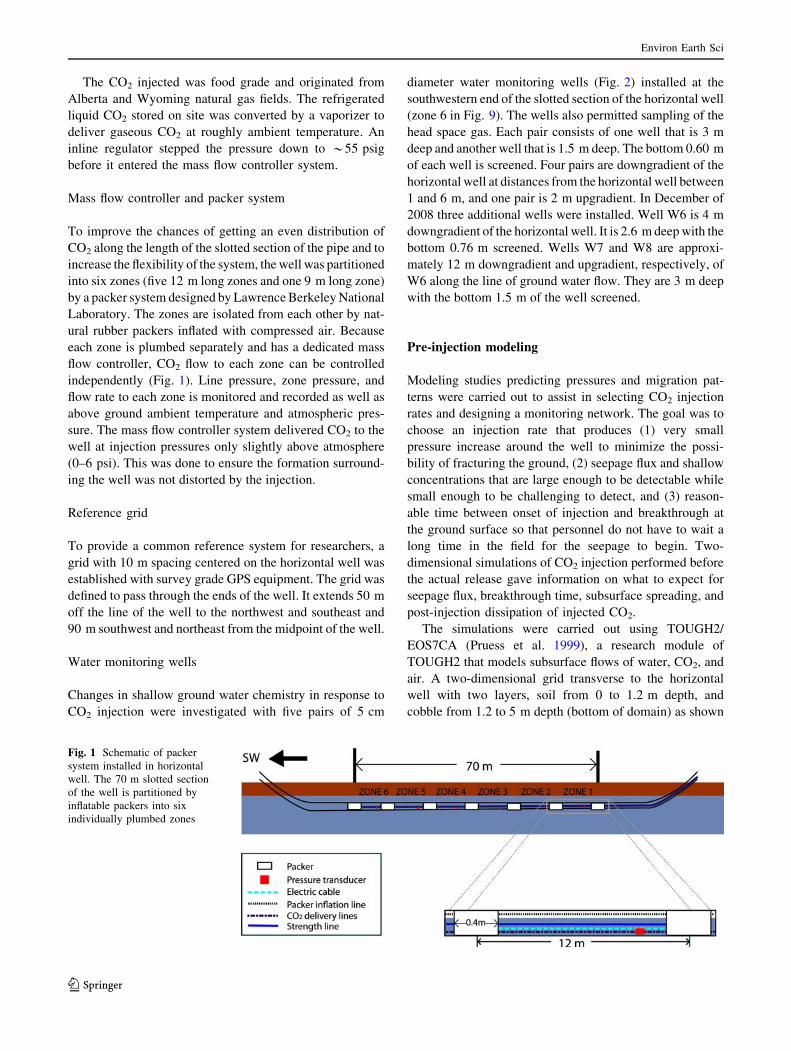
Mass flow controller and packer system
To improve the chances of getting an even distribution of
CO2 along the length of the slotted section of the pipe and to
increase the flexibility of the system, the well was partitioned
into six zones (five 12 m long zones and one 9 m long zone)
by a packer system designed by Lawrence Berkeley National
Laboratory. The zones are isolated from each other by nat-
ural rubber packers inflated with compressed air. Because
each zone is plumbed separately and has a dedicated mass
flow controller, CO2 flow to each zone can be controlled
independently (Fig. 1). Line pressure, zone pressure, and
flow rate to each zone is monitored and recorded as well as
above ground ambient temperature and atmospheric pres-
sure. The mass flow controller system delivered CO2 to the
well at injection pressures only slightly above atmosphere
(0–6 psi). This was done to ensure the formation surround-
ing the well was not distorted by the injection.
Reference grid
To provide a common reference system for researchers, a
grid with 10 m spacing centered on the horizontal well was
established with survey grade GPS equipment. The grid was
defined to pass through the ends of the well. It extends 50 m
off the line of the well to the northwest and southeast and
90 m southwest and northeast from the midpoint of the well.
Water monitoring wells
Changes in shallow ground water chemistry in response to
CO2 injection were investigated with five pairs of 5 cm
diameter water monitoring wells (Fig. 2) installed at the
southwestern end of the slotted section of the horizontal well
(zone 6 in Fig. 9). The wells also permitted sampling of the
head space gas. Each pair consists of one well that is 3 m
deep and another well that is 1.5 m deep. The bottom 0.60 m
of each well is screened. Four pairs are downgradient of the
horizontal well at distances from the horizontal well between
1 and 6 m, and one pair is 2 m upgradient. In December of
2008 three additional wells were installed. Well W6 is 4 m
downgradient of the horizontal well. It is 2.6 m deep with the
bottom 0.76 m screened. Wells W7 and W8 are approxi-
mately 12 m downgradient and upgradient, respectively, of
W6 along the line of ground water flow. They are 3 m deep
with the bottom 1.5 m of the well screened.
Pre-injection modeling
Modeling studies predicting pressures and migration pat-
terns were carried out to assist in selecting CO2 injection
rates and designing a monitoring network. The goal was to
choose an injection rate that produces (1) very small
pressure increase around the well to minimize the possi-
bility of fracturing the ground, (2) seepage flux and shallow
concentrations that are large enough to be detectable while
small enough to be challenging to detect, and (3) reason-
able time between onset of injection and breakthrough at
the ground surface so that personnel do not have to wait a
long time in the field for the seepage to begin. Two-
dimensional simulations of CO2 injection performed before
the actual release gave information on what to expect for
seepage flux, breakthrough time, subsurface spreading, and
post-injection dissipation of injected CO2.
The simulations were carried out using TOUGH2/
EOS7CA (Pruess et al. 1999), a research module of
TOUGH2 that models subsurface flows of water, CO2, and
air. A two-dimensional grid transverse to the horizontal
well with two layers, soil from 0 to 1.2 m depth, and
cobble from 1.2 to 5 m depth (bottom of domain) as shown
Fig. 1 Schematic of packer
system installed in horizontal
well. The 70 m slotted section
of the well is partitioned by
inflatable packers into six
individually plumbed zones
Environ Earth Sci
123

in Fig. 3 was used (The well is offset from the center line
because simulations with flowing groundwater from left to
right were also carried out although not presented here.).
Estimates of the soil properties were made from descrip-
tions of the soil in test pit logs from the site. Further details
of the transverse grid simulations can be found in Olden-
burg (2009), while only a brief summary is presented here.
Simulations of the site using a three-dimensional model are
presented by Oldenburg et al. (this issue).
The most important soil property for predicting flux and
breakthrough times as a function of injection rate is per-
meability (Oldenburg and Unger 2003, 2004). For this
property, a calibration was done based on CO2 flux mea-
surements made during a vertical injection well test. A
� in. Schedule 40 PVC vertical well was located 24 m
northwest of the horizontal well and in similar soil condi-
tions. It was installed to a depth of 3.5 m, and the bottom
0.6 m of the well was screened with a porous polyethylene
well screen (SCHUMASOIL� manufactured by Johnson
Screens). Carbon dioxide was injected at a rate of 4.1 kg/
day. The calibration was done using a radial grid with the
same layer thicknesses as shown in Fig. 3. Manually
adjusting permeability of the two layers while keeping
porosity constant at 0.35 for both layers resulted in a
good fit for ksoil = 5 9 10-11 m2, and kcobble = 3.2 9
10-12 m2. The good fit obtained with large permeability for
the soil likely suggests the presence of macropores or root
casts in the soil layer. Properties of the layers used in the
simulations are provided in Table 1.
The initial steady state gravity–capillary equilibrium
with no infiltration is shown in Fig. 4. Note the capillary
barrier produced by the soil–cobble interface that gives rise
to higher liquid saturations in the soil than in the cobble
below (blue above yellow). The less saturated cobble
below the capillary barrier is expected to have higher
effective permeability to injected CO2 than the more sat-
urated soil above.
In Fig. 5 are shown examples of simulation results for a
high injection rate (1,000 kg/day) and a low injection rate
(100 kg/day) to compare breakthrough times and spreading
patterns. As shown, the 1,000 kg/day injection rate is on its
way to breakthrough after only 3 h and spreads over ten
meters in width after 10 days. Note the preferential
spreading in the unsaturated cobble. The low injection-rate
case (Fig. 5c, d) shows breakthrough is just about to occur
after 2 days, while after 10 days spreading at the surface is
approximately 5 m. Surface flux and shallow-soil concen-
tration as a function of a range of injection rates are shown
in Fig. 6a, b. Note the maximum in surface flux that occurs
at approximately 1 day for the 1,000 kg/day case as CO2
strongly breaks through and then over a slightly longer
time scale spreads in the subsurface thereby diminishing
surface flux slightly.
Because heterogeneities may be present in the field that
are not modeled, breakthrough in the field experiment is
expected to be earlier rather than later than the model
predictions. For this reason, and because the fluxes even at
100 kg/day are known to be readily measurable by some of
the approaches deployed (e.g. the accumulation chamber),
the 100 kg/day injection rate appeared to be reasonable as a
10m(-4,0)
5B
5A
W6
W7
W8
1A
2A
3A
4A4B
3B
2B
1B
(-3,1)
(-4,-1)
Ground-water gradient
17
(-3,0)
Monitoring Wells
Depth = 3 mDepth = 1.5 mGridpointHorizontal well trace
N
Fig. 2 Water monitoring well array. Ordered pairs refer to coordi-
nates in the reference grid. The trace of the horizontal well on the
ground surface is indicated in gray
Fig. 3 Two-dimensional transverse grid model system showing
cobble and soil layers, discretization, well location, and boundary
conditions
Environ Earth Sci
123

starting point for the shallow-release experiment. The
prediction of breakthrough at 2–3 days by the model
agreed well with what was observed experimentally
(Lewicki et al. 2007) in the first release of 2007 performed
at an injection rate of 100 kg/day.
Space does not allow presentation of additional simu-
lations carried out to predict the effects of the second
release at 300 kg/day, nor of groundwater flow and trans-
port simulations to predict effects of the test below the
water table. However, modeling results describing the
patchy emission seen in the 2007 and 2008 releases can be
found in Oldenburg et al. (this issue).
Controlled CO2 releases from the horizontal well
Two shallow subsurface releases of CO2 were performed in
the summer of 2007. The first was begun July 9 and lasted
10 days, ending on July 18. The total flow rate was 0.1
metric ton CO2/day with flux into all six packer zones
being equal. Additionally, 6.5 mL of a perfluorinated tracer
(perfluoromethylcyclohexane) was injected into zone 4
during the first 48 h of CO2 injection. A second release at a
rate of 0.3 t CO2/day with equal flux to all six zones was
carried out from August 3 to August 10.
Over the 2008 field season CO2 was released at a flow
rate of 0.3 t/day from July 9 to August 7. Again, flux into all
six packer zones was equal. Perfluorotrimethylcyclohexane
tracer (16.5 mL) was released into zone 4 over 5 � days
starting at 17:30 on July 9. From August 27 to September 9
CO2 was injected into only zone 3 at a total flow rate of
0.05 t/day.
During the 2007 releases the depth of the water table
measured at the water monitoring well array in zone 6
averaged 1.6 m below ground surface. For the summer
2008 experiments the water level was measured to be about
1.5 m below the ground surface.
Weather conditions during horizontal release
experiments
The weather conditions during the 2007 releases were
generally above-average temperatures with below-average
precipitation, while during the 2008 releases below-aver-
age temperatures and above-average precipitation pre-
vailed. During the first 2007 release (July 9–18) the
measured air temperature at the experiment site exceeded
the average high (27–29�C) for the Gallatin Field National
Weather Service site every day except one, usually by
several degrees centigrade. The extreme difference occur-
red on July 15 when the measured temperature was 35�C,
7�C warmer than the average. Similarly, the measured
daily low temperatures were nearly all 2–7�C warmer than
average (8–9�C). During the second 2007 release (August
3–10), the measured temperatures were near and even
slightly below average, with the highs generally running
approximately 26–28�C, compared to 29�C average, and
the lows staying near the average of 9�C.
The 2008 releases occurred during a generally much
cooler and wetter summer season. During the first 2008
release (July 9–August 7) the measured high temperatures
stayed near the average (*28–29�C), actually falling
below by 5�C or more on at least 8 days. The measured
Table 1 Properties of the two
layers used in the model
a Pruess et al. (1999)
Soil Cobble
Porosity 0.35 0.35
Permeability 5 9 10-11 m2 3.2 9 10-12 m2
Capillary pressure van Genuchtena van Genuchtena
k = 0.291, Slr = 0.15,
a = 2.04 9 10-4 Pa-1,
Pmax = 5 9 105 Pa, Sls = 1
k = 0.627, Slr = 0.10,
a = 1.48 9 10-3 Pa-1,
Pmax = 5 9 105 Pa, Sls = 1
Relative
permeability
van Genuchtena van Genuchtena
Slr = 0.17, Sgr = 0.05 Slr = 0.12, Sgr = 0.05
Molec. diffusivity Liquid: 10-10 m2 s-1 Liquid: 10-10 m2 s-1
Gas: 10-5 m2 s-1 Gas: 10-5 m2 s-1
Fig. 4 Initial liquid saturation at gravity–capillary equilibrium with
water table at a depth of 1.6 m
Environ Earth Sci
123

low temperatures also stayed generally at or below the
average values. The second 2008 release (August 27–
September 9) encompassed an unusually cool period, with
nine of the 14 days experiencing high temperatures that
were 7�C or more below average (26–28�C). The extreme
difference occurred on September 1, when the measured
high temperature (7�C) barely exceeded the average low
(5�C). It should be noted that the average temperatures
cited here are for the Gallatin Field Airport, approximately
15 km northwest of the ZERT field site and approximately
100 m lower elevation, so these averages should be used
only as general guidelines.
Figure 7 shows time-series plots of daily precipitation
for the time period encompassing the 2007 (Fig. 7a) and
2008 (Fig. 7b) release periods. Note the large difference in
vertical scale for the 2 years. During the first 2007 release
there was no measurable precipitation until the afternoon of
the last day, while during the second 2007 release there
Fig. 5 Simulation results
showing mass fraction of CO2 in
the gas phase (color contours)
and contour lines (white)
showing liquid saturation for a1 t CO2/day injection rate at
t = 3 h, b 1 t CO2/day at
t = 10 days, c 100 kg CO2/day
at t = 2 days, and d100 kg CO2/day at t = 10 days
Environ Earth Sci
123

were several light rains, comparable with seasonal daily
precipitation B0.1 cm, and one relatively heavy rainfall of
approximately 0.6 cm. The 2008 releases occurred during a
period of significantly higher precipitation, with the first
release experiencing several extremely heavy rain events
accompanied by short but intense periods of hail of
diameters reaching approximately 3 cm. The precipitation
during the second 2008 release was comparable to the daily
average of 0.1–0.13 cm.
An array of 15 water content reflectometers (Campbell
Scientific CS616) was installed on the southwestern edge
of zone 4 in mid-summer of 2008. They measured vol-
umetric water content averaged over the top 30 cm of
soil. Figure 8 shows a time-series plot of the volumetric
water content measured by one of these probes which
was located on the pipeline on the northeast edge of the
plant strip near grid coordinate (-1.55, 0). The signifi-
cance of spatial variations among the array of soil
moisture probes is currently being studied, but this time-
series plot is typical. The general drying trend that occurs
in the soil during Montana summers was altered very
significantly by the unusually heavy precipitation events
that occurred during the first 2008 release (Fig. 7b). An
interesting and meaningful consequence of the heavy
precipitation events that occurred early in the first 2008
release experiment is that the soil moisture was slightly
higher at the end of the first release than it appears to
have been at the start of the release. Following the fairly
heavy precipitation events of August 8 and August 9
(2008), the soil moisture decreased to a fairly constant
late-summer level that extended into the start of the
second 2008 release. During this second release there
were seasonal precipitation events that caused the soil
moisture to rise slightly.
Fig. 6 Summary of a surface CO2 flux and b shallow CO2 concentration (mass fraction) for various injection rates as a function of time
Fig. 7 Time-series plots of daily precipitation during a 2007 and b2008 field seasons. Gray areas indicate timing of CO2 releases
Fig. 8 Representative volumetric water content measured in the top
30 cm of soil
Environ Earth Sci
123

Layout of experimental techniques
Transport of CO2 through the soil, water, plants, and air
was investigated with near surface detection techniques
deployed by collaborators from Lawrence Berkeley
National Lab (LBNL), the National Energy Technology
Lab (NETL), Los Alamos National Lab (LANL), Pacific
Northwest National Lab (PNNL), Lawrence Livermore
National Lab (LLNL), Brookhaven National Lab (BNL),
U.S. Geological Survey (USGS), Montana State Univer-
sity, Bozeman (MSU), University of California, Santa Cruz
(UCSC), and West Virginia University (WVU). Tech-
niques included soil flux chambers, eddy covariance, soil
gas measurements, perfluorocarbon tracer studies, laser-
based differential absorption measurements (both free
space atmospheric and below surface soil gas), stable iso-
tope studies, multispectral and hyperspectral imaging for
plant stress detection, water sampling, and soil elemental
analysis using gamma-ray spectroscopy induced by
inelastic neutron scattering. Figure 9 shows a schematic of
the layout of experimental techniques for the 2007 and
2008 field seasons.
Soil
Soil CO2 flux
Accumulation chamber measurements
Evolution of the CO2 leakage signal was followed in space
and time by soil CO2 flux measurements. Measurements
using a WEST Systems Fluxmeter (WEST Systems, Pisa,
Italy) based on the accumulation chamber method (e.g.
Chiodini et al. 1998) were made on a daily basis by LBNL
on a grid surrounding the horizontal well for both releases
of 2007 and the first release of 2008. Figure 10 shows a
map of soil CO2 flux measured on July 30, 2008 (day 22 of
the first release of 2008). Six concentrated areas of CO2
flux, or ‘‘hot spots,’’ can be seen on the surface along the
length of the well. There was little lateral spread off the
well trace (\5 m). These hot spots were likely due to flow
of CO2 injected into a zone to the highest elevation within
the zone followed by vertical migration to the ground
surface. Detailed results including time to breakthrough
and establishment of steady state flow as well as
Fig. 9 Layout of experimental
techniques for a 2007 and b2008 field seasons. Well ends
(gray circles) show extent of the
horizontal well. Perfluorcarbon
tracer detection and soil flux
measurements were performed
in the area labeled NETL. The
area labeled PNNL housed an
array of steady state soil CO2
flux chambers. Stars represent
the locations of eddy covariance
stations. Non-dispersive
infrared sensors measured
gaseous CO2 in the soil and
atmosphere along the strip
labeled NDIR sensors
Environ Earth Sci
123

comparison to pre-injection modeling for the 2007 release
can be found in Lewicki et al. (2007). Discussion of soil
CO2 flux accumulation chamber measurements for Release
1 of 2008 can be found in Lewicki et al. (this issue).
Non-steady state CO2 soil flux measurements were also
made by NETL during the first releases of both 2007 and
2008. A LI-COR 6400 photosynthesis chamber with the
soil CO2 flux chamber (6400-09) was used to map out one
of the two surface flux anomalies in zone 4 on a finer
spaced grid (Strazisar et al. 2009). These results and those
of the 2008 experiment are detailed in Wells et al. (this
issue).
Pacific Northwest National Laboratory deployed a
3 9 5 array of 15 surface flux chambers to make steady
state measurements of soil CO2 fluxes during the first
release of 2007. The chambers covered a 4-m 9 8-m area
centered over the horizontal CO2 injection well in zone 3
with an additional reference chamber placed 10 m from the
well. This array was expanded for the second release of
2008 to 24 chambers covering a 10 m 9 5 m area in
packer zones 2 and 3 and three additional reference
chambers located more than 10 m from the well. The
multi-channel analysis system dilutes samples automati-
cally prior to determination of CO2 concentrations by a LI-
COR LI-7000 analyzer, collects concentration/flux data
continuously with minimal maintenance, and can be con-
trolled remotely by a cellular modem link. In 2008, Mon-
tana State University placed five LI-COR LI-8100-104
Long-Term Chambers (for non-steady state measurements
of CO2 flux) within the PNNL array for comparison. For
these results and a description of the PNNL 2007 and 2008
findings (see Amonette et al., this issue).
Soil gas concentration
Perfluorocarbon tracers
For part of the first releases of 2007 and 2008, a perflu-
orocarbon tracer was injected along with the CO2 into zone
4. Each injection contained a unique tracer so that tracer
identity could be clearly distinguished. NETL researchers
installed an array of sorption tubes at a depth of 1 m below
ground surface to monitor for the appearance of this tracer.
Soil gas CO2 depth profiles were also taken. For further
details see Strazisar et al. (2009) and Wells et al. (this issue).
Differential absorption measurements using laser-based
instruments
A differential absorption instrument based on a continuous
wave temperature tunable distributed feedback (DFB) laser
(Repasky et al. 2006; Humphries et al. 2008) was deployed
in zone 1 by MSU to measure real time underground CO2
soil gas concentrations. Light from the laser is delivered by
fiber optic to sensors buried underground in waterproof
cases. These cases are fitted with gas permeable membranes
to allow soil gas to diffuse into the sensors. In 2007, a 1 m
long absorption cell was buried approximately 0.75 m
below the ground surface directly above the horizontal well.
Results of these experiments can be found in Humphries
et al. 2008. In 2008, the case with the 1 m long absorption
cell was buried approximately 0.75 m below the ground
surface 1 m northwest off the horizontal well. A second case
with a 0.3 m absorption cell and a sensor using a photonic
band gap fiber was buried directly above the horizontal well
at a depth of *0.75 m. In both the 2007 and 2008 experi-
ments elevated CO2 levels from the release were clearly
measurable above natural variability in the soil CO2 con-
centration. Typical background CO2 soil gas concentrations
of 4,000 ppm were measured. During the 0.3 t/day release
of 2008, 30,000 ppm CO2 was regularly seen. The results
for the 2008 experiment can be found in Barr et al. (2009).
Non-dispersive infrared sensors
In 2008 an array of non-dispersive infrared (NDIR) sensors
for the measurement of gaseous carbon dioxide were
installed at the southwest edge of zone 4 (Fig. 9b). Sensors
installed at 30 cm depth in the soil at 0, 2.5, 5, 7.5, and
10 m on a line going northwest off the well and at 4 cm
above the ground surface at 0 and 5 m northwest of the
well continuously measured soil and atmospheric CO2
concentrations. A discussion of soil and atmospheric CO2
Fig. 10 Map of log soil CO2 flux measured on 7/30/2008 using the
accumulation chamber method. Point (0, 0) indicates the location of
the reference grid origin. The black box in the center of the grid points
shows the approximate location of the trace of the horizontal well on
the ground surface
Environ Earth Sci
123
concentration data and their relationship to meteorological
and soil parameter variations during the first release of
2008 can be found in Lewicki et al. (this issue).
Total carbon in soil
Inelastic neutron scattering
Brookhaven National Laboratory tested Inelastic Neutron
Scattering (INS) at the field site to see if it could detect
CO2 seepage from the controlled release. The INS system,
based on gamma-ray spectroscopy induced by fast neu-
trons, offers two distinct advantages: it is a non-destructive
method, and it also provides multi-elemental analysis in
situ. This system consisting of an electrical neutron gen-
erator, an array of detectors, and a power supply is
mounted on a cart hovering about 30 cm above the ground.
Its high-energy neutrons and gamma rays interrogate
uniquely large soil volumes of about 0.3 m3 to an effective
depth of 30 cm and over an approximate footprint of
1.5 m2. The data for multi-elemental analysis is acquired
during operation either in static or scanning modes, thus
covering arbitrarily large areas. Wielopolski et al. (2008)
gives a detailed description of the system.
To look for changes in the soil during the first release of
2008, an INS system was placed above a point on the
horizontal well with known high soil CO2 flux in zone 3.
The results collected at that point were compared with
background measurements taken at several places adjacent
to the horizontal well. From among the elements measured
by the INS system only a difference in carbon was
observed, as reported in Wielopolski and Mitra (this issue).
Water
Water chemistry
During the 2007 and 2008 field seasons several water
chemistry parameters were sampled at the water moni-
toring well array in zone 6 before, during, and after CO2
injection. For details on the change in water chemistry
due to the injection of CO2 during the 2007 field season.
In 2008 the USGS measured water level, pH, alkalinity,
electrical conductance, and dissolved oxygen in the field.
Major, minor and trace inorganic compounds, dissolved
organic carbon (DOC), and a selection of organic com-
pounds as well as some isotopes were analyzed in the
laboratory. Results show rapid systematic and significant
to major changes in most of the chemical parameters
determined following CO2 injection (for results of the
July–August release of 2008 see Kharaka et al., this
issue).
Plants
Plant health
Hyperspectral and multispectral imaging
The response of plant health to the injection of CO2 in the
shallow subsurface was monitored by UCSC and MSU. A
high wavelength resolution portable field spectrometer
(ASD Inc.), a portable hyperspectral imaging system (Res-
onon Inc.), and one stationary multispectral imager followed
the changes in the visible and near infrared reflectance
spectra of plants located varying distances from the hori-
zontal well in both the 2007 and 2008 experiments. The
Resonon hyperspectral imager was also flown over the field
site 27 days after the beginning of the first release of 2008.
The portable field spectrometer measured reflectance
spectra from the same 68 plants almost daily before, dur-
ing, and after the first 2008 release. The spectral signatures
clearly showed stressed vegetation over the hot spots
mapped by Lewicki et al. (this issue) (see also Fig. 10).
The effects on the plants of CO2 from the injection were
detectable above natural seasonal variations. The level of
plant response to the injected CO2 was dependent on plant
species and began when soil CO2 concentrations reached
4–8%, which was two to three times greater than back-
ground levels. Plants up to 2.5 m off hot spots along the
horizontal well showed deterioration in health. Further
description of the daily spectral measurements and the
hyperspectral overflight image are given in Male et al. (this
issue).
The hyperspectral (Keith et al. 2009) and multispectral
(Rouse 2008) imaging techniques also detected compro-
mised plant health at the 0.3 t CO2/day release rate in 2007
and 2008. The ability of the multispectral imager to obtain
calibrated reflectance images during cloudy and clear con-
ditions showed the feasibility of deploying a system long-
term to collect a continuous data record. Statistically sig-
nificant signal changes that are correlated with CO2 injec-
tion patterns in space and time were observable in both field
seasons. For a description of the stationary multispectral
imaging experiments (see Shaw et al., this issue).
Air
Net CO2 flux
Eddy Covariance measurements
An eddy covariance station from LBNL positioned
approximately 30–35 m northwest of the horizontal well
measured net flux of CO2 continuously during the summers
Environ Earth Sci
123

of 2006, 2007, and 2008 (Lewicki et al. 2008b, c). The
method is based on measuring the temporal covariance of
vertical wind velocity and CO2 density at a fixed height
above the ground (e.g. Baldocchi et al. 1988; Foken and
Wichura 1996; Aubinet et al. 2000; Baldocchi 2003).
Changes in eddy covariance CO2 fluxes were difficult to
discriminate from background variations during the first
2007 release at 0.1 t CO2/day. A clear surface leakage
signal, however, was discernable during the 0.3 t CO2/day
release of that year. A second eddy covariance station from
LANL was placed approximately 30 m southeast of the
horizontal well in 2007 and 2008.
CO2 concentration
Differential absorption measurements using laser-based
instruments
A second differential absorption instrument was deployed
near the northeast end of the horizontal well to measure
atmospheric concentration of CO2 above the horizontal
well. It is also based on a continuous wave temperature
tunable DFB laser developed at MSU (Repasky et al.
2006). The laser is directed at a retroflector which sends the
light back to a detector measuring the amount of absorption
by CO2 over the path length the laser light travels. From
this information atmospheric CO2 concentration can be
calculated. The laser was placed near the northeast end of
the slotted section of the horizontal well (see Fig. 9). In
2007, the retroreflector was positioned on the well trace
43 m to the southwest for a total path length of 86 m.
Estimation of the background atmospheric CO2 concen-
tration was made by moving the entire laser system to a
location *120 m away from the horizontal well where
contributions from injected CO2 were expected to be
negligible. For details of the system design and results of
the 2007 release (see Humphries et al. 2008). In 2008, the
retroreflector was placed above the horizontal well 29 m
southwest of the laser system. Estimates of background
CO2 concentrations were made by using a flip mirror in the
laser housing to direct the beam to a second retroreflector
located 90� off the well trace. For the release rates of 2007
and 2008 atmospheric CO2 concentration levels above the
natural diurnal cycles were easily measurable by this sys-
tem. The results for the 2008 experiment can be found in
Barr et al. (2009).
Mapping the atmospheric CO2 plume
Perfluorocarbon tracers
For the first release of 2008 NETL deployed an array of
sorption tubes above the soil surface at a height of 1.2 m in
order to detect and characterize the atmospheric plume of
CO2 by looking for perfluorinated tracer co-injected with
the CO2 in zone 4. A clear plume was detected with tracer
concentrations more than five orders of magnitude greater
than background downwind of the release point. In addi-
tion, a plume of residual tracer from the 2007 release was
also detected, likely due to long residence time in the soil.
Details are given in Wells et al. (this issue).
Stable isotopes of CO2 in atmospheric, vegetation, soil,
and groundwater reservoirs
Stable isotopes of CO2 can be a useful marker for
identifying leakage of injected CO2. The carbon dioxide
injected in the ZERT field experiments originated from a
natural gas field and thus has a carbon isotope signature
(d13C measured to be -52%) distinct from the natural
background produced by organic respiration and
photosynthesis.
The stable isotopes of carbon were measured on soil
cores (from 0 to 70 cm below the surface), on dissolved
inorganic carbon (DIC) in groundwater, dominant plants,
and in the local CO2 (using Keeling plots from chamber
CO2) and regional CO2 (using Keeling plots on CO2 col-
lected at an eddy covariance tower—2 m height). The light
stable isotopes were measured in these reservoirs prior to
and during the first releases of 2007 and 2008. A signature
from the injected tank CO2 was seen in the groundwater,
plants, chamber and regional CO2 after the release. This
experiment showed that d13C in carbon reservoirs is a
useful tool to detect CO2 seepage either within days or
weeks of release, depending upon the reservoir and also
distance from the source. For a detailed description of the
stable isotope studies (see Fessenden et al., this issue).
Conclusions
A facility has been constructed to perform controlled
shallow releases of CO2 at flow rates that challenge near
surface detection techniques and can be scalable to desired
retention rates of large scale CO2 storage projects. Pre-
injection measurements were made to determine back-
ground conditions and characterize natural variability at the
site. Modeling of CO2 transport and concentration in sat-
urated soil and the vadose zone was also performed to
inform decisions about CO2 release rates and sampling
strategies.
Four releases of CO2 were carried out over the summer
field seasons of 2007 and 2008. Transport of CO2 through
soil, water, plants, and air was studied using near surface
detection techniques. Soil CO2 flux, soil gas concentration,
total carbon in soil, water chemistry, plant health, net CO2
Environ Earth Sci
123
flux, atmospheric CO2 concentration, movement of tracers,
and stable isotope ratios were among the quantities mea-
sured. Even at relatively low fluxes, most techniques were
able to detect elevated levels of CO2 in the soil, atmo-
sphere, or water. Plant stress induced by CO2 was detect-
able above natural seasonal variations.
Acknowledgments We would like to thank Ray Solbau, Paul Cook
and Alex Morales (LBNL) for the design and valuable technical
support of the flow control system and Liz Burton and Frank Gouveia
(LLNL) for assistance with soil CO2 concentration instrumentation.
This work was carried out within the ZERT project, funded by the
Assistant Secretary for Fossil Energy, Office of Sequestration,
Hydrogen, and Clean Coal Fuels, and National Energy Technology
Laboratory. This paper was prepared with the support of the U.S.
Department of Energy, under Award No. DE-FC26-04NT42262.
However, any opinions, findings, conclusions, or recommendations
expressed herein are those of the author(s) and do not necessarily
reflect the views of the DOE.
Open Access This article is distributed under the terms of the
Creative Commons Attribution Noncommercial License which per-
mits any noncommercial use, distribution, and reproduction in any
medium, provided the original author(s) and source are credited.
References
Anderson DE, Farrar CD (2001) Eddy covariance measurement of
CO2 flux to the atmosphere from an area of high volcanogenic
emissions, Mammoth Mountain, California. Chem Geol 177(1–
2):31–42
Annunziatellis A, Beaubien SE, Bigi S, Ciotoli G, Coltella M,
Lombardi S (2008) Gas migration along fault systems and
through the vadose zone in the Latera caldera (central Italy):
implications for CO2 geological storage. Int J Greenh Gas
Control 2(3):353–372
Aubinet M, Grelle A, Ibrom A, Rannik U, Moncrieff J, Foken T,
Kowalski AS, Martin PH, Berbigier P, Bernhofer C, Clement R,
Elbers J, Granier A, Grunwald T, Morgenstern K, Pilegaard K,
Rebmann C, Snijders W, Valentini R, Vesala T (2000) Estimates
of the annual net carbon and water exchange of forests: the
EUROFLUX methodology. Adv Ecol Res 30:113–175
Baldocchi DD (2003) Assessing the eddy covariance technique for
evaluating carbon dioxide exchange rates of ecosystems: past,
present and future. Glob Change Biol 9(4):479–492
Baldocchi DD, Hicks BB, Meyers TP (1988) Measuring biosphere-
atmosphere exchanges of biologically related gases with micro-
meteorological methods. Ecology 69(5):1331–1340
Barr JL, Humphries SD, Nehrir AR, Repasky KS, Dobeck LM,
Carlsten JL, Spangler LH (2009) Laser based carbon dioxide
monitoring instrument testing during a thirty day controlled
underground carbon release field experiment (submitted)
Chiodini G, Cioni R, Guidi M, Raco B, Marini L (1998) Soil CO2 flux
measurements in volcanic and geothermal areas. Appl Geochem
13(5):543–552
Foken T, Wichura B (1996) Tools for quality assessment of surface-
based flux measurements. Agric For Meteorol 78(1–2):83–105
Hovorka SD, Benson SM, Doughty C, Freifeld BM, Sakurai S, Daley
TM, Kharaka YK, Holtz MH, Trautz RC, Nance HS, Myer LR,
Knauss KG (2006) Measuring permanence of CO2 storage in
saline formations: the Frio experiment. Environ Geosci
13(2):105–121
Humphries SD, Nehrir AR, Keith CJ, Repasky KS, Dobeck LM,
Carlsten JL, Spangler LH (2008) Testing carbon sequestration
site monitor instruments using a controlled carbon dioxide
release facility. Appl Opt 47(4):548–555
IPCC (2005) IPCC special report on carbon dioxide capture and
storage: Special Report of the Intergovernmental Panel on
Climate Change. Cambridge University Press, London
Iversen BV, Moldrup P, Schjonning P, Jacobsen OH (2003) Field
application of a portable air permeameter to characterize spatial
variability in air and water permeability. Vadose Zone J
2(4):618–626
Keith CJ, Repasky KS, Lawrence RL, Jay SC, Carlsten JL (2009)
Monitoring effects of a controlled subsurface carbon dioxide
release on vegetation using a hyperspectral imager. Int J Greenh
Gas Control 3(5):626–632. doi:10.1016/j.ijggc.2009.03.003
Lewicki JL, Oldenburg CM, Dobeck L, Spangler L (2007) Surface
CO2 leakage during two shallow subsurface CO2 releases.
Geophys Res Lett 34:L24402. doi:10.1029/2007gl032047
Lewicki JL, Fischer ML, Hilley GE (2008a) Six-week time series of
eddy covariance CO2 flux at Mammoth Mountain, California:
performance evaluation and role of meteorological forcing. J
Volcanol Geotherm Res 171(3–4):178–190
Lewicki JL, Hilley GE, Fischer ML, Pan L, Oldenburg CM, Dobeck L,
Spangler L (2008b) Detection of CO2 leakage by eddy covariance
during the ZERT project’s CO2 release experiments. Energy
Procedia 1(1):2301–2306. doi:10.1016/j.egypro.2009.01.299
Lewicki JL, Hilley GE, Fischer ML, Pan L, Oldenburg CM, Dobeck
L, Spangler L (2008c) Eddy covariance observations of surface
leakage during shallow subsurface CO2 releases. J Geophys Res
Oldenburg CM, Lewicki JL, Dobeck L, Spangler L (2009) Modeling
gas transport in the shallow subsurface during the ZERT CO2
release test. Transp Porous Med, LBNL-1529E. doi:10.1007/
s11242-009-9361-x
Oldenburg CM, Unger AJA (2003) On leakage and seepage from
geologic carbon sequestration sites: unsaturated zone attenua-
tion. Vadose Zone J 2(3):287–296
Oldenburg CM, Unger AJA (2004) Coupled vadose zone and
atmospheric surface-layer transport of carbon dioxide from
geologic carbon sequestration sites. Vadose Zone J 3(3):848–857
Pruess K, Oldenburg CM, Moridis G (1999) TOUGH2 user’s guide,
version 2.0. Lawrence Berkeley National Laboratory, LBNL-
43134
Repasky KS, Humphries S, Carlsten JL (2006) Differential absorption
measurements of carbon dioxide using a temperature tunable
distributed feedback diode laser. Rev Sci Instrum 77:113107.
doi:10.1063/1.2370746
Rouse JH (2008) Measurements of plant stress in response to CO2
using a three-CCD imager. Master of Science Dissertation,
Montana State University-Bozeman
Strazisar BR, Wells AW, Diehl JR (2009) Near surface monitoring for
the ZERT shallow CO2 injection project. Int J Greenh Gas
Control 3(6):736–744. doi:10.1016/j.ijggc.2009.07.005
Topp GC, Davis JL (1985) Measurement of soil-water content using
time-domain reflectometry (TDR)—a field-evaluation. Soil Sci
Soc Am J 49(1):19–24
West JM, Pearce JM, Coombs P, Ford JR, Scheib C, Colls JJ, Smith
KL, Steven MD (2008) The impact of controlled injection of
CO2 on the soil ecosystem and chemistry of an English lowland
pasture. Energy Procedia 1(1):1863–1870. doi:10.1016/j.egypro.
2009.01.243
Whittaker S (2004) Geological storage of greenhouse gases: the IEA
Weyburn CO2 monitoring and storage project. Can Soc Pet
Reserv 31(8):9
Wielopolski L, Hendrey G, Johnsen KH, Mitra S, Prior SA, Rogers
HH, Torbert HA (2008) Nondestructive system for analyzing
carbon in the soil. Soil Sci Soc Am J 72(5):1269–1277
Environ Earth Sci
123