a self coordinating bus route to resist bus bunching
TRANSCRIPT
8/12/2019 A Self Coordinating Bus Route to Resist Bus Bunching
http://slidepdf.com/reader/full/a-self-coordinating-bus-route-to-resist-bus-bunching 1/26
A self-coordinating bus routeto resist bus bunching ∗
John J. BARTHOLDI, III
Supply Chain and Logistics Institute,
Stewart School of Industrial and Systems Engineering,
Georgia Institute of Technology, Atlanta, Georgia 30332-0205, USA
Donald D. EISENSTEINBooth School of Business, The University of Chicago,
Chicago, Illinois 60637, USA
February 2011; revised October 21, 2011
Abstract
The primary challenge for an urban bus system is to maintain constant headways
between successive buses. Most bus systems try to achieve this by adherence to a
schedule; but this is undermined by the tendency of headways to collapse, so that
buses travel in bunches. To counter this, we propose a new method of coordinating
buses. Our method abandons the idea of a schedule and even any a priori target
headway. Under our scheme headways are dynamically self-equalizing and the nat-
ural headway of the system tends to emerge spontaneously. Headways also become
self-correcting in that after disturbances they reequalize without intervention by man-
agement or even awareness of the drivers.
We report on a successful implementation to control a bus route in Atlanta.
Keywords: Bus bunching, transit operations, headway control, adaptive control, self-
organization∗To appear in Transportation Research Part B
1
8/12/2019 A Self Coordinating Bus Route to Resist Bus Bunching
http://slidepdf.com/reader/full/a-self-coordinating-bus-route-to-resist-bus-bunching 2/26
1 Bus bunching
When buses circulate on a route, service is best when times between successive bus ar-
rivals (headways) are equal. However, it is impossible to maintain equal headways be-
cause of variability in traffic and in the boarding and deboarding of passengers. These
variations inevitably cause some buses to slow relative to others; and the larger the head-
way, the more strongly it tends to grow, because the trailing bus will likely meet more
passengers than average at each stop and so will be further delayed. Similarly, a headway
that has become smaller will tend to shrink even more because the trailing bus will likely
meet fewer passengers. This phenomenon is called bus bunching or platooning.
Bus bunching increases both the mean and variance of the wait time of passengers.
This is because larger gaps allow more time for passenger arrivals, and these arrivals will
wait longer on average, and their waiting times will be more variable. Bunching also
wastes capacity because trailing buses may be nearly empty. At the time of this writing,
bus bunching is the most common customer complaint at the Chicago Transit Authority
(CTA), and has received considerable local press coverage (see for example Gerasole
(2008) and Luman (2007)).
We propose a method of coordinating buses that tends to equalize headways and so
provides better service. In fact, under our scheme the headways become “self-equalizing”
so that after any disruption the buses will tend, spontaneously, to re-space themselves at
equal intervals. Furthermore, this will happen without direction from management or the
intention or even awareness of the drivers. Our scheme abandons the concept of a schedule
and so management is freed from building and monitoring a schedule and drivers are freed
from the distraction of repeatedly checking their time, location, and velocity. This seems
well-suited to urban bus routes because riders typically ignore schedules with headways
less than 10–12 minutes Minser (2009).
2
8/12/2019 A Self Coordinating Bus Route to Resist Bus Bunching
http://slidepdf.com/reader/full/a-self-coordinating-bus-route-to-resist-bus-bunching 3/26
2 Co ordinating buses
Bus bunching has long been understood (for example, Newell and Potts (1964)); but it is
hard to fix. There are essentially two ways to separate buses that are too close. One is to
ask the leading bus to speed up; but this can be disruptive to traffic flow, and difficult or
impossible in a heavily-trafficked urban environment.
The other way to separate buses that are too close is to slow the trailing bus. But
a slowing bus can annoy both following traffic and on-board passengers, so in practice
buses are typically delayed, when necessary, only at certain key stops, which we refer
to as control points. The endpoints of routes that follow an out-and-back path are ideal
control points because few, if any, passengers ride through them.
In the US, municipal bus routes are typically managed by target schedules, in which
the arrival times of buses at each stop are planned to the minute and extra time is budgeted
for each bus to pause at each control point. These delays help recover the schedule if the
buses get ahead; and if behind, a bus can forfeit some or all of the planned delay. More
planned delay gives greater ability to recover a schedule, but at a cost of idle bus capacity.
Recently, Daganzo (2009) proposed an approach that focuses on achieving a target
headway. When a bus arrives at a control point, its headway is compared to a pre-specified
target value. If the headway is smaller, then the arriving bus is judged to be following too
close behind its predecessor, and it delays for a longer than nominal duration; and if the
headway is larger, the arriving bus delays a shorter than nominal value.
Both target schedules and target headways attempt to realize a pre-specified static
value of headway. We consider this a technical weakness in both approaches, because
the ideal achievable headway is not static and not even knowable in advance. Instead, it
changes continually with traffic conditions, habits of the driver, and numbers of passengers
boarding and deboarding at each stop. Consequently, any system that coordinates buses
based on target headways must sometimes underestimate achievable headway, and so fail
to meet the target, and sometimes overestimate it, and so waste bus capacity.
3
8/12/2019 A Self Coordinating Bus Route to Resist Bus Bunching
http://slidepdf.com/reader/full/a-self-coordinating-bus-route-to-resist-bus-bunching 4/26
A more serious objection is that neither a target schedule nor target headway can re-
spond adequately to serious disruption. For example, when a bus breaks down, it leaves a
gap until a replacement can be inserted. When the gap is large enough, it will overwhelm
any planned slack. In the case of a target schedule, a trailing bus may be so far behind
schedule that its planned departure time will have already lapsed when it reaches a control
point, and it must depart immediately, still behind schedule. And in the case of a target
headway, the delay computed for the trailing bus can be negative, which can be inter-
preted as directing the trailing bus to speed up — but this is not practical except in special
situations, such as when there are reserved bus lanes. This leaves both schemes vulnera-
ble to any large system-wide disruption, such as a snowstorm, that might reduce average
bus velocity, and so increase all headways. When disruptions are large, both target-based
schemes abdicate control, and the result can be bus bunching.
We propose a control system that abandons both the notion of a schedule and, in
addition, that of any pre-specified target headway. By abandoning any target headway, the
system is free to express the natural headway, which may change over time. Moreover,
under our scheme headways will tend to equilibrate even in the presence of perturbations.
Our system will converge to the smallest common headway possible given the current
capacity and demands upon the system. Even after a large disruption of service, such as
when a bus breaks down, our system will spontaneously re-position buses to achieve a
new, albeit necessarily larger, common headway.
Hickman (2001) gives an excellent summary of previous work on headway control.
We add the observation that the literature divides naturally into that prior to automatic
vehicle location (AVL) systems, such as global positioning systems (GPS), and that af-
ter. Before GPS, approaches assumed that not much information was available. Barnett
(1974) is typical in computing bus delays based on the distribution of observed headways.
In these papers, the object was generally to reduce variation.
Subsequent to GPS, models have typically assumed accurate and real-time knowledge
4
8/12/2019 A Self Coordinating Bus Route to Resist Bus Bunching
http://slidepdf.com/reader/full/a-self-coordinating-bus-route-to-resist-bus-bunching 5/26
8/12/2019 A Self Coordinating Bus Route to Resist Bus Bunching
http://slidepdf.com/reader/full/a-self-coordinating-bus-route-to-resist-bus-bunching 6/26
in an idealized model in which perturbations are infrequent (Section 3.1). Then we en-
hance this model to explore the opposing tendencies of equalization and a very strong
form of bunching (Section 3.2). Finally, we strengthen our scheme to produce the version
that we suggest for practical use (Section 3.3).
Of course the true test of such a scheme is how well it works. In Section 4 we report on
the performance of self-equalizing headways on the central bus route through the campus
of the Georgia Institute of Technology in Atlanta, Georgia, US. In Section 5 we compare
the three approaches—target schedule, target headway, and self-equalizing headways—by
simulating ridership and traffic on route 63 of the Chicago Transit Authority. The analytic
model, the field tests, and the simulations all argue for the practicality and efficacy of our
scheme.
3 Self-equalizing headways
As do the target schedule or target headway approaches, our method seeks to improve
service by systematically delaying buses at control points.
Consider a route with a single control point. Let the bus newly-arrived at the control
point be bus 1, and index the others in the direction of travel, so that the bus trailing 1 is
bus n. The headway hi is the time separating bus i from bus i + 1. We base the delay of
bus 1 on the headway hn of the trailing bus (or, in the terminology of some authors, on
the backwards headway of bus 1). Specifically, we delay bus 1 at the control point for
duration
α hn, (3.1)
where 0 < α < 1 is a control parameter that determines the sensitivity of our scheme to
perturbations.
We present three arguments for the efficacy of this scheme. These arguments are
based, respectively, on an idealized model (presented in this section), on experiments
6
8/12/2019 A Self Coordinating Bus Route to Resist Bus Bunching
http://slidepdf.com/reader/full/a-self-coordinating-bus-route-to-resist-bus-bunching 7/26
with a real bus system (Section 4) and on a simulation (Section 5).
Our idealized model treats the bus route as a dynamical system with n buses moving
at constant average velocity v about a circular route of length that has been normalized to
1, with a single control point at 0 (equivalently, 1). At any point in time each bus i has a
location xi ∈ [0, 1) about this circuit.
Let those instants at which a bus arrives at the control point be indexed by t = 1, 2, . . . .
At each such time we re-index the buses so that the bus that has just arrived at the control
point is bus 1, the next in the direction of bus movement is bus 2, and so on, until the last
bus, which is the next bus to arrive at the control point, is bus n. For each time t let the
vector xt = xt
1, xt
2, . . . , xt
n
represent the locations of the buses, where 0 = xt
1 ≤ xt
2 ≤ · · · ≤
xt n < 1. From arbitrary starting positions x0, the trajectory of bus positions
x0, x1, . . .
may be thought of as a series of snapshots of the bus route at those times when a bus
arrives at the control point.
Let the vector ht =
ht
1, ht
2, . . . , ht
n give the headways of the buses at time t . In the
absence of perturbations, ht i = ( xt
i+1 − xt
i)/v for all buses i, except for bus 1, which we
require to pause at the control point for time αht n according to (3.1).
3.1 Equilibrium dynamics of self-equalizing headways
Our main result says that this method for computing delays creates a force that resists
bunching. More specifically, from any initial positions of the buses — such as after a
disruption of service — a common headway will spontaneously emerge. Furthermore,
the value of this common headway depends only on the number and average velocity v of
the buses and on the control parameter α.
Theorem 3.1. For 0 < α < 1 , any trajectory of bus positions will converge to a unique
fixed point x∗ with common headway
h∗ = 1(n − α) v
. (3.2)
7
8/12/2019 A Self Coordinating Bus Route to Resist Bus Bunching
http://slidepdf.com/reader/full/a-self-coordinating-bus-route-to-resist-bus-bunching 8/26
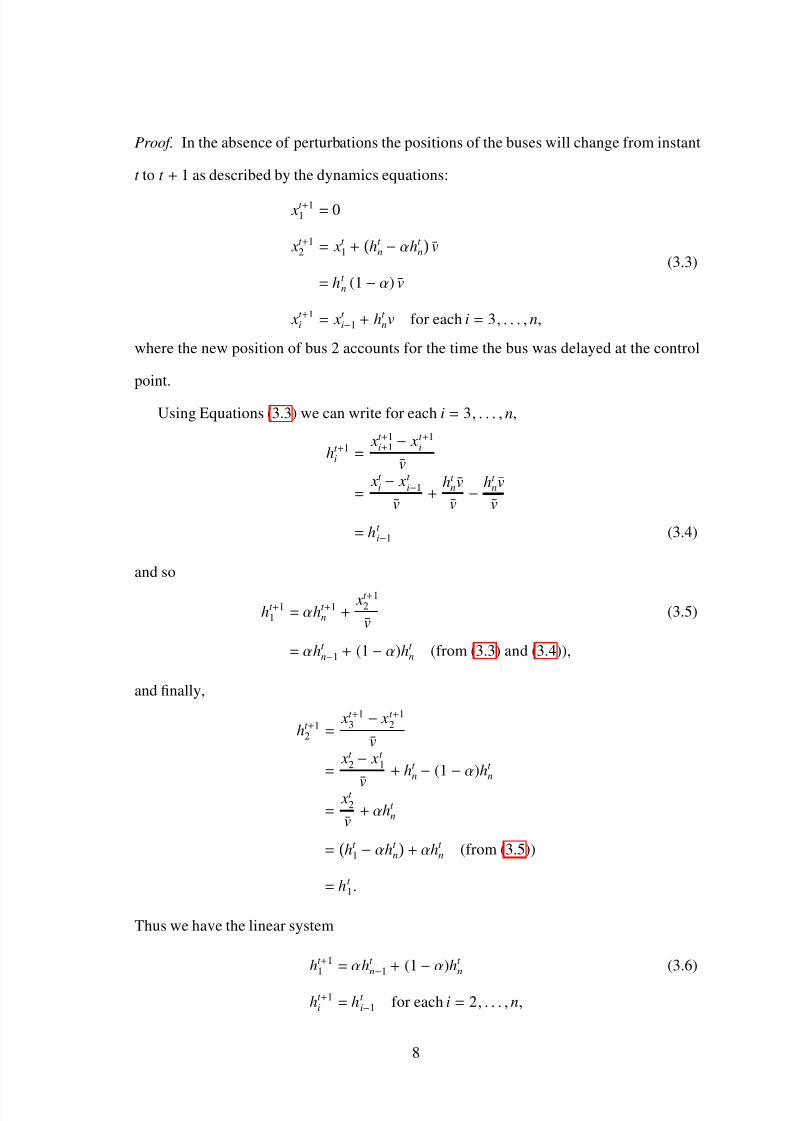
Proof. In the absence of perturbations the positions of the buses will change from instant
t to t + 1 as described by the dynamics equations:
xt +11 = 0
xt +12 = xt
1 +ht
n − αht n
v
= ht n (1 − α) v
xt +1i = xt
i−1 + ht nv for each i = 3, . . . , n,
(3.3)
where the new position of bus 2 accounts for the time the bus was delayed at the control
point.
Using Equations (3.3) we can write for each i = 3, . . . , n,
ht +1i =
xt +1i+1
− xt +1i
v
= xt
i − xt
i−1
v+
ht nv
v−
ht nv
v
= ht i−1 (3.4)
and so
ht +11 = αht +1
n + xt +1
2
v(3.5)
= αht n−1 + (1 − α)ht
n (from (3.3) and (3.4)),
and finally,
ht +12 =
xt +13
− xt +12
v
= xt
2 − xt
1
v
+ ht n − (1 − α)ht
n
= xt
2
v+ αht
n
=ht
1 − αht n
+ αht
n (from (3.5))
= ht 1.
Thus we have the linear system
ht +11 = αht
n−1 + (1 − α)ht n (3.6)
ht +1i = ht
i−1 for each i = 2, . . . , n,
8
8/12/2019 A Self Coordinating Bus Route to Resist Bus Bunching
http://slidepdf.com/reader/full/a-self-coordinating-bus-route-to-resist-bus-bunching 9/26
which can written as ht +1 = A ht , where A is a stochastic matrix that may be interpreted to
represent the transitions of a finite-state Markov chain that is irreducible and aperiodic if
and only if 0 < α < 1. By the Markov Chain Theorem each row of the limit A∞ is
1
n − α, . . . ,
1
n − α, 1 − α
n − α
,
and all entries of ht converge to the claimed common value.
The computation of Equation (3.6) changes the headway of each newly arrived bus
to a weighted average of its former headway and the former headway of the trailing bus.
If its former headway was larger, its new headway becomes smaller, and vice versa. The
result is that headways are constantly adjusted to become more nearly equal. Furthermore,
this adjustment proceeds from any starting positions of the buses, which means that the
headways will tend to reequalize after any disturbance, no matter how severe.
The smallest possible common headway for n buses, each traveling at constant average
velocity v is 1/ (nv). But such a system has no slack and so no ability to recover from
disruptions. Under our scheme headways converge to the common value h∗ as given in
Expression (3.2). From the denominator it may be seen that α represents the bus capacity
held in reserve at the control point to help the system recover from disruptions.
Note that the equilibrium value h∗ is determined by several factors. Slack, as given by
α, is set by management. On the other hand, the value of v is mostly determined by traffic
conditions and levels of ridership, which is expected to change during the day. And while
management can choose the number n of buses on the route, unplanned events, such as
bus breakdowns, may have an eff ect as well. So as conditions change, the natural equilib-
rium headway h∗ adjusts, and under our scheme all headways will be pulled towards this
common value.
It is simple to add more control points if more control of headways is wanted, such as
for a long bus route or after segments with highly variable transit times. Each control point
makes successive headways more nearly equal, and so Theorem 3.1 can be generalized
9
8/12/2019 A Self Coordinating Bus Route to Resist Bus Bunching
http://slidepdf.com/reader/full/a-self-coordinating-bus-route-to-resist-bus-bunching 10/26
to show that using α j at control point j = 1, . . . , k propels convergence to a common
headway of
h∗ = 1n −
k j=1 α j
v
. (3.7)
Others have studied the question of where to locate control points and this literature is
nicely summarized by Hickman (2001). This issue seems less important under self-
equalizing headways: The computations of delay at each control point are independent
of those at other control points, so control points can be added or removed without in-
terrupting operations. This can give management freedom to experiment with choice of
number and location.
It is worth noting that our model can be extended, by scaling, to any common bus
velocity function v( x) that gives the instantaneous velocity of a bus at each point x along
the route, as long as v( x) is bounded above and below at every point (see Bartholdi and
Eisenstein (1996), for example).
It is also straightforward to extend our analysis in a number of ways to account for
sufficiently smooth and small noise as in Daganzo (2009) or Bartholdi et al. (2001). But
the analysis is similar and the stability results the same.
Our idealized model demonstrates the resistance conferred by our scheme to bunching,
but the real question is whether this will assert itself on an actual bus route. To answer
this we first extend our analysis to allow a strong form of bunching. This will lead us to a
final version of our control we suggest for implementation. We then report on both a field
test and a simulation study.
3.2 Performance under strong bunching
In Section 3.1 we established the tendency of headways to equalize under our scheme.
Here we show that our scheme can resist even a very strong form of bunching.
In a study of route 63 for the CTA, Milkovits (2008) measured the time a bus spends
boarding and deboarding passengers at a stop. He found that passenger movement was
10
8/12/2019 A Self Coordinating Bus Route to Resist Bus Bunching
http://slidepdf.com/reader/full/a-self-coordinating-bus-route-to-resist-bus-bunching 11/26
hindered by those on the bus, and so dwell time at the stop was not simply proportional to
the number of boarding / deboarding passengers, as is typically assumed, but was a super-
linear function. Therefore, if the number of passengers boarding or deboarding grows
linearly with the time since the last bus, the headway must grow super-linearly.
Such behavior may be described by letting the eff ective average velocity of bus i dur-
ing iteration t be
v( xt
i+1− xt
i)/v
1/v
ω = v
xt i+1
− xt i
ω (3.8)
for some ω ≥ 0. The expression ( xi+1 − xi) measures the proportion of nominal headway
for bus i, and ω imposes a super-linear decline in the velocity of the bus as the number
of passengers increase. This means the velocity of a bus increases rapidly as its headway
decreases.
In our enlarged model there are two opposing forces: Under the natural dynamics
of super-linear dwell times, small headways tend to become smaller and large headways
larger when 0 < ω. Contrariwise, under our system small headways tend to grow larger
and large headways to become smaller when 0 < α < 1. This contention is described by
incorporating (3.8) into the dynamics (3.6).
xt +11 = 0
xt +12 = min
xt
1 + T t (1 − α) v
( xt 2
− xt 1
)ω , xt +1
3
xt +1
i = min
xt
i−1 +
T t v
( xt i − xt
i−1)ω , x
t +1
i+1
for each i = 3, . . . , n − 1
xt +1n = min
xt
n−1 + T t v
( xt n − xt
n−1)ω
, 1
,
(3.9)
where
T t =
1 − xt
n
v/(1 − xt
n)ω =
1 − xt
n
1+ω
v
is the time required for iteration t , and the min operator reflects the fact that the lead bus
must always be slowed (even if passing is allowed).
The dynamics equations (3.9) are complex, but can be examined numerically to show
11
8/12/2019 A Self Coordinating Bus Route to Resist Bus Bunching
http://slidepdf.com/reader/full/a-self-coordinating-bus-route-to-resist-bus-bunching 12/26
0.0 0.05 0.10 0.15 0.20 0.250.0
0.02
0.04
0.06
0.08
α = 0.5
Smallest Headways in Starting Bus Positions
S t r e n g t h o f B u n c h i n g ( ω
)
Convergence to
Equal Headways
Convergence to
Bunching
(Bunched) (Balanced)
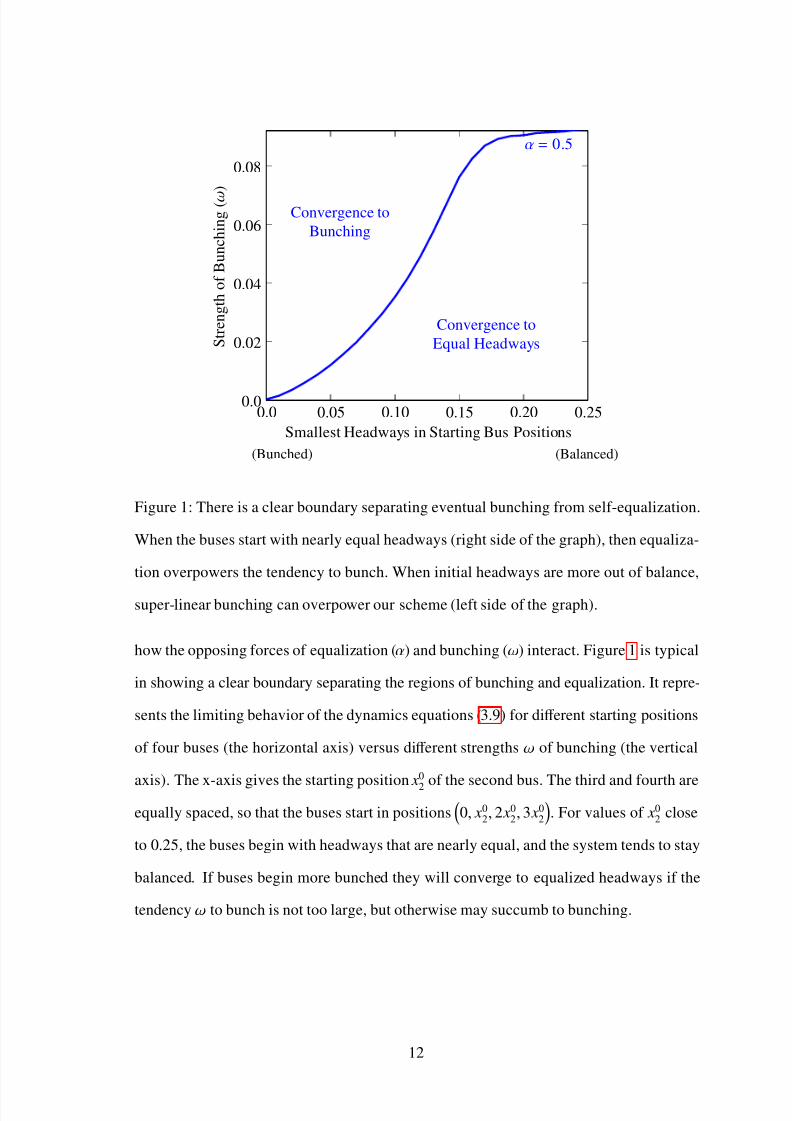
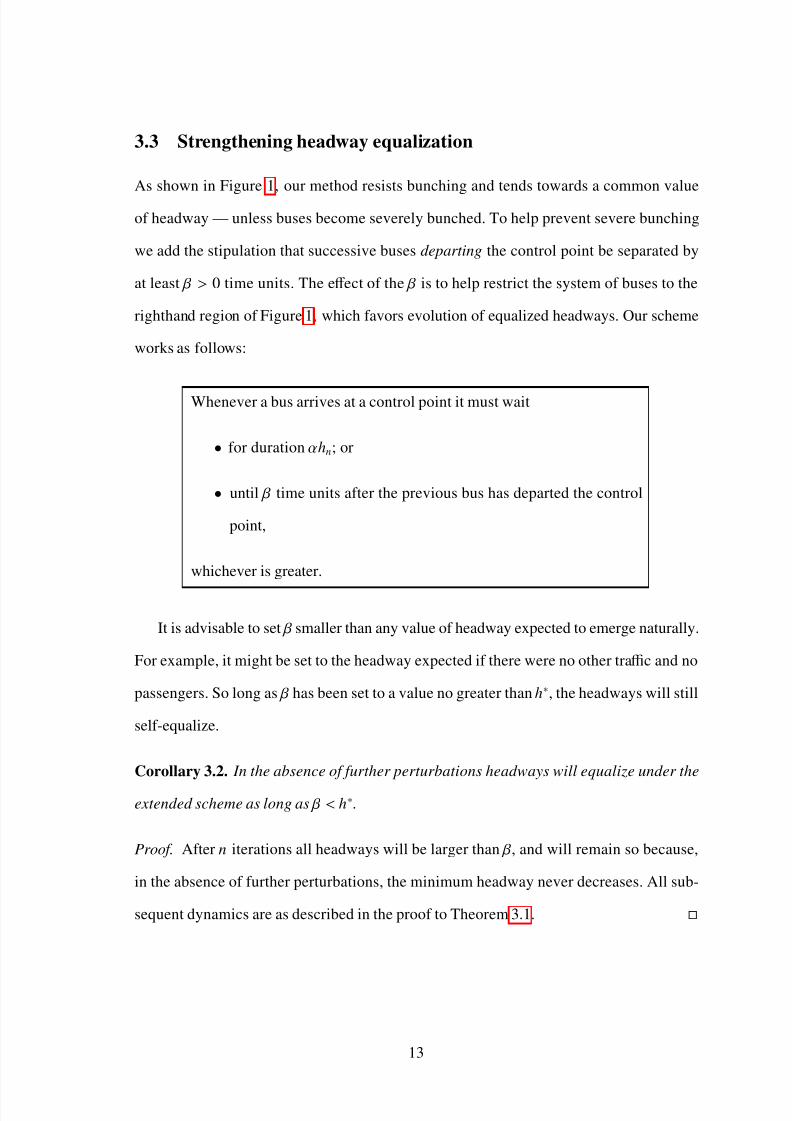
Figure 1: There is a clear boundary separating eventual bunching from self-equalization.
When the buses start with nearly equal headways (right side of the graph), then equaliza-
tion overpowers the tendency to bunch. When initial headways are more out of balance,
super-linear bunching can overpower our scheme (left side of the graph).
how the opposing forces of equalization (α) and bunching (ω) interact. Figure 1 is typical
in showing a clear boundary separating the regions of bunching and equalization. It repre-
sents the limiting behavior of the dynamics equations (3.9) for diff erent starting positions
of four buses (the horizontal axis) versus diff erent strengths ω of bunching (the vertical
axis). The x-axis gives the starting position x
0
2 of the second bus. The third and fourth are
equally spaced, so that the buses start in positions0, x0
2, 2 x0
2, 3 x0
2
. For values of x0
2 close
to 0.25, the buses begin with headways that are nearly equal, and the system tends to stay
balanced. If buses begin more bunched they will converge to equalized headways if the
tendency ω to bunch is not too large, but otherwise may succumb to bunching.
12
8/12/2019 A Self Coordinating Bus Route to Resist Bus Bunching
http://slidepdf.com/reader/full/a-self-coordinating-bus-route-to-resist-bus-bunching 13/26
3.3 Strengthening headway equalization
As shown in Figure 1, our method resists bunching and tends towards a common value
of headway — unless buses become severely bunched. To help prevent severe bunching
we add the stipulation that successive buses departing the control point be separated by
at least β > 0 time units. The eff ect of the β is to help restrict the system of buses to the
righthand region of Figure 1, which favors evolution of equalized headways. Our scheme
works as follows:
Whenever a bus arrives at a control point it must wait
• for duration αhn; or
• until β time units after the previous bus has departed the control
point,
whichever is greater.
It is advisable to set β smaller than any value of headway expected to emerge naturally.
For example, it might be set to the headway expected if there were no other traffic and no
passengers. So long as β has been set to a value no greater than h∗, the headways will still
self-equalize.
Corollary 3.2. In the absence of further perturbations headways will equalize under the
extended scheme as long as β < h∗.
Proof. After n iterations all headways will be larger than β, and will remain so because,
in the absence of further perturbations, the minimum headway never decreases. All sub-
sequent dynamics are as described in the proof to Theorem 3.1.
13
8/12/2019 A Self Coordinating Bus Route to Resist Bus Bunching
http://slidepdf.com/reader/full/a-self-coordinating-bus-route-to-resist-bus-bunching 14/26
4 Performance on a public bus route
We tested our coordination scheme on the central bus route at the Georgia Institute of
Technology. This route is an out-and-back loop of total length 3.3 miles (5.3 kilometers).
It cuts through the center of campus and ties together key origins and destinations, includ-
ing dormitories, the Student Athletic Center, Technology Square, and the Atlanta subway.
This is the most heavily traveled of the campus bus routes with around 5,000 riders each
day. In addition to the usual morning and evening peaks, the route experiences surges in
ridership ten minutes before and ten minutes after class changes.
To help the buses keep to schedule, the operator of the bus system (Groome Trans-
portation) maintains two control terminals, one at each of the endpoints of the route,
ISyE / Rec Center and MARTA Midtown, where the buses typically pause for a few min-
utes. Furthermore, a manager is stationed at the ISyE / Rec Center stop to monitor perfor-
mance and deal with problems.
This route is normally run according to a schedule. Each driver is assigned a bus and
each bus is assigned a repeating sequence of bus stops and corresponding times. The
key performance indicator for the system and for the individual drivers was adherence to
schedule.
For our experiment, we instructed the drivers to abandon the schedule and ignore
headways. Instead, they were to simply drive with the flow of traffic from one end of the
route to the other. A student at each control point recorded arrival times and computed
departure times. This computation relies on having estimates of how long until the next
bus arrives to a control point. We got this information from www.NextBus.com , which
collects the positions of buses from their GPS devices every 15 seconds, predicts the
number of minutes until the next bus will arrive, and updates a publicly-accessible web
page.
14
8/12/2019 A Self Coordinating Bus Route to Resist Bus Bunching
http://slidepdf.com/reader/full/a-self-coordinating-bus-route-to-resist-bus-bunching 15/26
4.1 Experiment 1: Regularity of service
To be conservative we configured our scheme to approximate the normal schedule. During
most of the day during the academic year there are 6 buses circulating the route, and the
target schedule calls for 6 minute headways with a 3 minute wait at one of the control
points and a 4 minute wait at the other. The standard time allocated in the target schedule
to drive the route is 29 minutes, and so to seek the same 6 minute headway of the schedule
for 6 buses, we wrote Equation (3.7) as
6 = 296 − (α1 + α2)
,
from which it follows that α1 + α2 = 7/6. We could have chosen any solution for which
0 < αi < 1, but for convenience in doing hand calculations chose α1 = α2 = 7/12 ≈ 0.5.
And we set β = 5 minutes at each of the two control points.
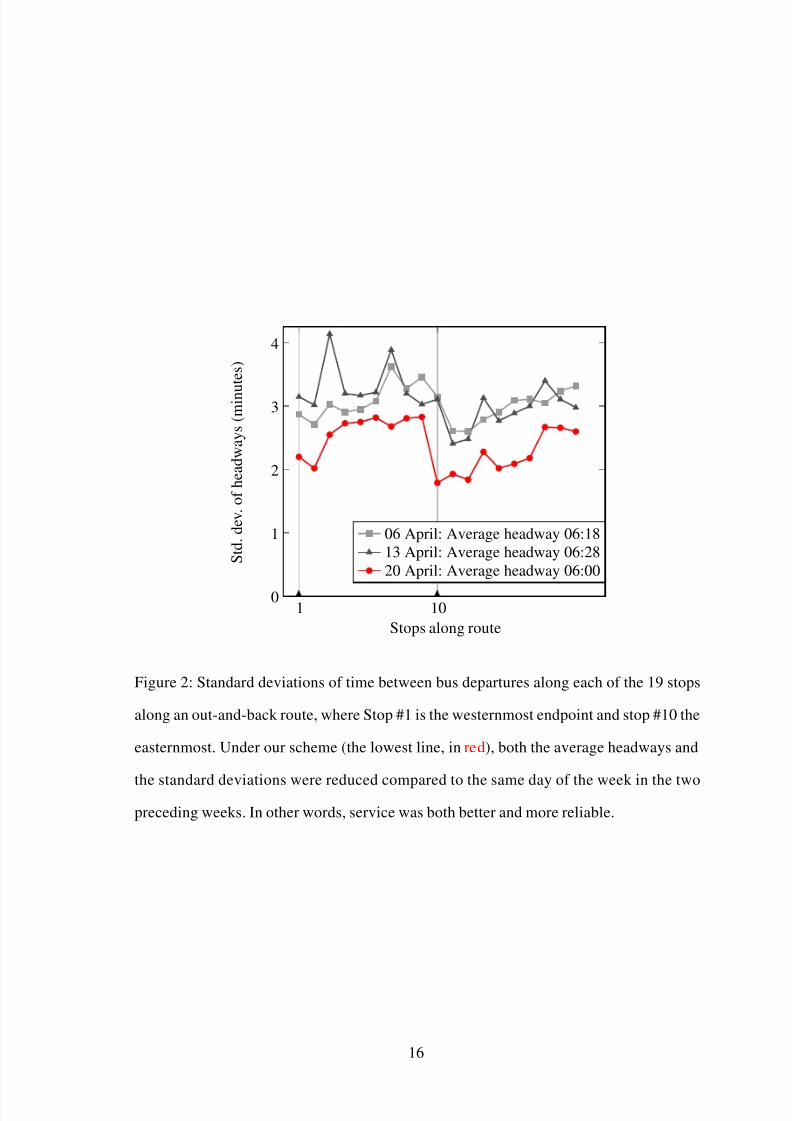
As shown in Figure 2, buses departed each control point with greater regularity under
our scheme than under the target schedule. Furthermore, our headways were on average
shorter than headways realized under the target schedule. Thus passenger waiting times
were shorter and more reliable.
Our scheme entirely avoided severe bunching: The smallest headway under our scheme
was 2 minutes 28 seconds, compared to only 1 second under scheduled service on a com-
parable day. Similarly, the largest headway under our scheme was 14 minutes 59 seconds,
but 19 minutes 45 seconds under scheduled service.
We interviewed bus drivers after the experiment and they liked not having to check the
clock constantly, worry about the schedule, and try to make adjustments. They felt that
our scheme freed them to concentrate on safe driving.
4.2 Experiment 2: Resilience
In both the Georgia Tech and the CTA systems, buses continually circle an assigned route.
If a bus is suddenly and unexpectedly unavailable, such as due to mechanical breakdown,
15
8/12/2019 A Self Coordinating Bus Route to Resist Bus Bunching
http://slidepdf.com/reader/full/a-self-coordinating-bus-route-to-resist-bus-bunching 16/26
1 100
1
2
3
4
Stops along route
S t d .
d e v . o f h e a d w a y s ( m i n u t e s )
06 April: Average headway 06:18
13 April: Average headway 06:28
20 April: Average headway 06:00
Figure 2: Standard deviations of time between bus departures along each of the 19 stops
along an out-and-back route, where Stop #1 is the westernmost endpoint and stop #10 the
easternmost. Under our scheme (the lowest line, in red), both the average headways and
the standard deviations were reduced compared to the same day of the week in the two
preceding weeks. In other words, service was both better and more reliable.
16
8/12/2019 A Self Coordinating Bus Route to Resist Bus Bunching
http://slidepdf.com/reader/full/a-self-coordinating-bus-route-to-resist-bus-bunching 17/26
2 4 6 8 10 12 140
5
10
15
20
25
Successive Arrivals to Control Point
H e a d w a y ( m i n u t e s )
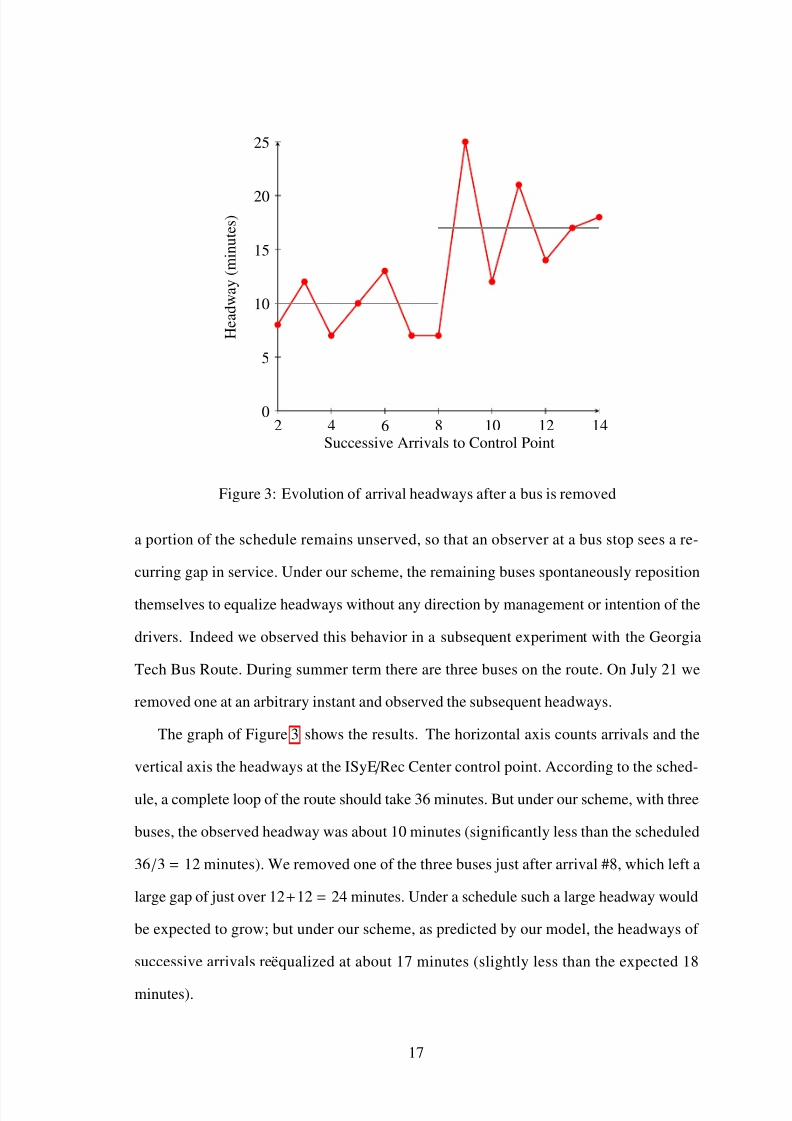
Figure 3: Evolution of arrival headways after a bus is removed
a portion of the schedule remains unserved, so that an observer at a bus stop sees a re-
curring gap in service. Under our scheme, the remaining buses spontaneously reposition
themselves to equalize headways without any direction by management or intention of the
drivers. Indeed we observed this behavior in a subsequent experiment with the Georgia
Tech Bus Route. During summer term there are three buses on the route. On July 21 we
removed one at an arbitrary instant and observed the subsequent headways.
The graph of Figure 3 shows the results. The horizontal axis counts arrivals and the
vertical axis the headways at the ISyE / Rec Center control point. According to the sched-
ule, a complete loop of the route should take 36 minutes. But under our scheme, with three
buses, the observed headway was about 10 minutes (significantly less than the scheduled
36/3 = 12 minutes). We removed one of the three buses just after arrival #8, which left a
large gap of just over 12+12 = 24 minutes. Under a schedule such a large headway would
be expected to grow; but under our scheme, as predicted by our model, the headways of
successive arrivals reequalized at about 17 minutes (slightly less than the expected 18
minutes).
17
8/12/2019 A Self Coordinating Bus Route to Resist Bus Bunching
http://slidepdf.com/reader/full/a-self-coordinating-bus-route-to-resist-bus-bunching 18/26
5 Comparative performance on a simulated route
We built a simulation of Route 63 of the Chicago Transit Authority (CTA). This route
travels out and back along 63rd street between Stony Island Avenue and Midway Airport.
The entire loop is 17.75 miles long (28.57 kilometers). We based our simulation on CTA
data collected from GPS systems and automatic passenger counters on each bus.
Route 63 has almost 80 stops, of which the CTA monitors GPS data from only 18,
including the two control points, one each at the easternmost and westernmost ends of
the route. The historical travel times between key stops is well-described as the sum of
uniformly distributed times for each intervening city block (1/8 mile or 0.2 kilometers in
length).
We matched the simulated passenger arrivals and departures with the historical daily
patterns by proceeding as follows: From the data we set the total arrivals to the system
every half hour over a 14 hour period, from 04:00 to 18:00. Arrivals and departures at key
bus stops vary over the day according to four major time periods: AM Early, AM Peak,
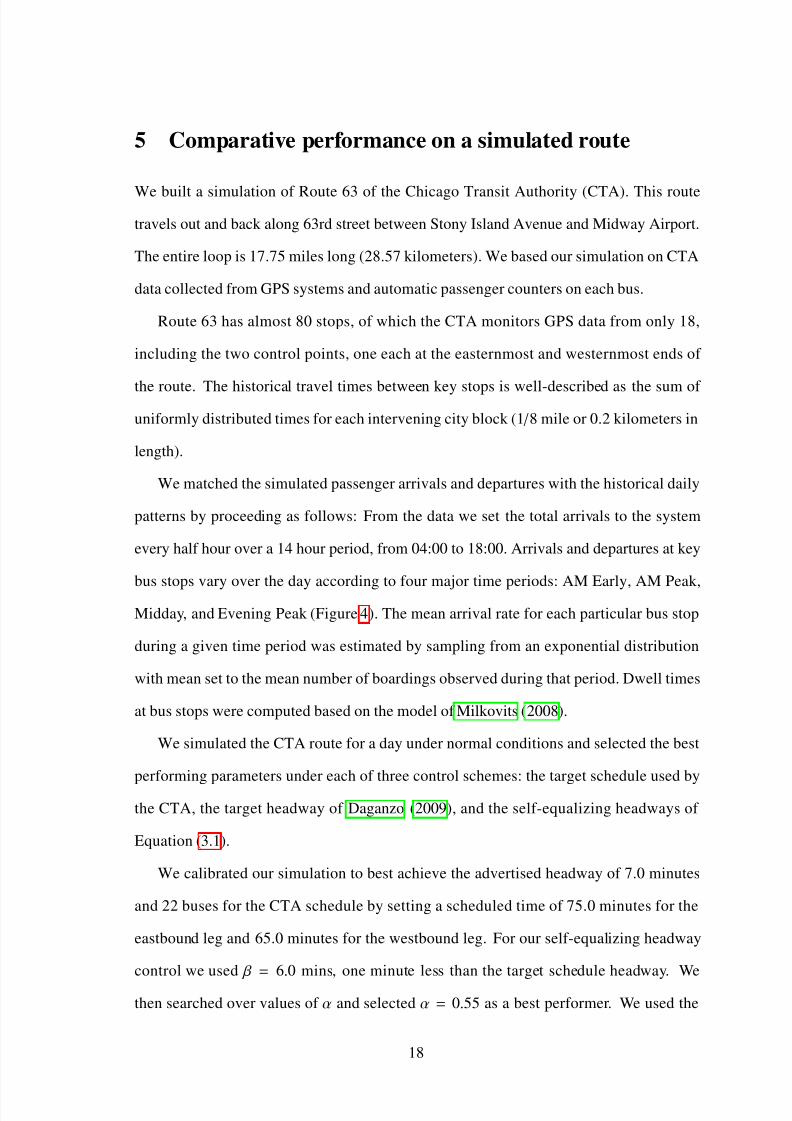
Midday, and Evening Peak (Figure 4). The mean arrival rate for each particular bus stop
during a given time period was estimated by sampling from an exponential distribution
with mean set to the mean number of boardings observed during that period. Dwell times
at bus stops were computed based on the model of Milkovits (2008).
We simulated the CTA route for a day under normal conditions and selected the best
performing parameters under each of three control schemes: the target schedule used by
the CTA, the target headway of Daganzo (2009), and the self-equalizing headways of
Equation (3.1).
We calibrated our simulation to best achieve the advertised headway of 7.0 minutes
and 22 buses for the CTA schedule by setting a scheduled time of 75.0 minutes for the
eastbound leg and 65.0 minutes for the westbound leg. For our self-equalizing headway
control we used β = 6.0 mins, one minute less than the target schedule headway. We
then searched over values of α and selected α = 0.55 as a best performer. We used the
18
8/12/2019 A Self Coordinating Bus Route to Resist Bus Bunching
http://slidepdf.com/reader/full/a-self-coordinating-bus-route-to-resist-bus-bunching 19/26
4 5 6 7 8 9 10 11 12 13 14 15 16 17 18
1.0
2.0
3.0
4.0
5.0
Hour of Day
P e r c e n t o f D a i l y A r r i v a l s
Figure 4: Arrival rates of passengers to CTA Route 63, showing morning and evening
surges
distance to the trailing bus and its average velocity to compute the hn headways for our
delay control. We used four control points, one each at the easternmost and westernmost
endpoint; and one each at the eastbound and westbound crossing of the bus route with the
elevated train (these provide natural control points since so many passengers board and
deboard at these stops).
Under the target headway scheme of Daganzo (2009), a bus arriving at the control
point is delayed for duration
max {0, d + g ( H − h1)} , (5.1)
where H is the target headway, h1 is the forward headway of the arriving bus, d > 0 is
the average delay at equilibrium, and g > 0 is a control parameter. For targeted headway
control we simulated over a thousand parameter combinations, including the selection of
either 4 or 8 control points, and chose the best performing: d = 5.8, g = 0.8, h = 7.0, and
8 control points.
When each scheme is allowed to choose its best parameters ex post facto, self-equalizing
19
8/12/2019 A Self Coordinating Bus Route to Resist Bus Bunching
http://slidepdf.com/reader/full/a-self-coordinating-bus-route-to-resist-bus-bunching 20/26
5 6 7 8 9 10 11 12 13 14 15 16 17 18
0.5
1.0
1.5
2.0
Hour of Day
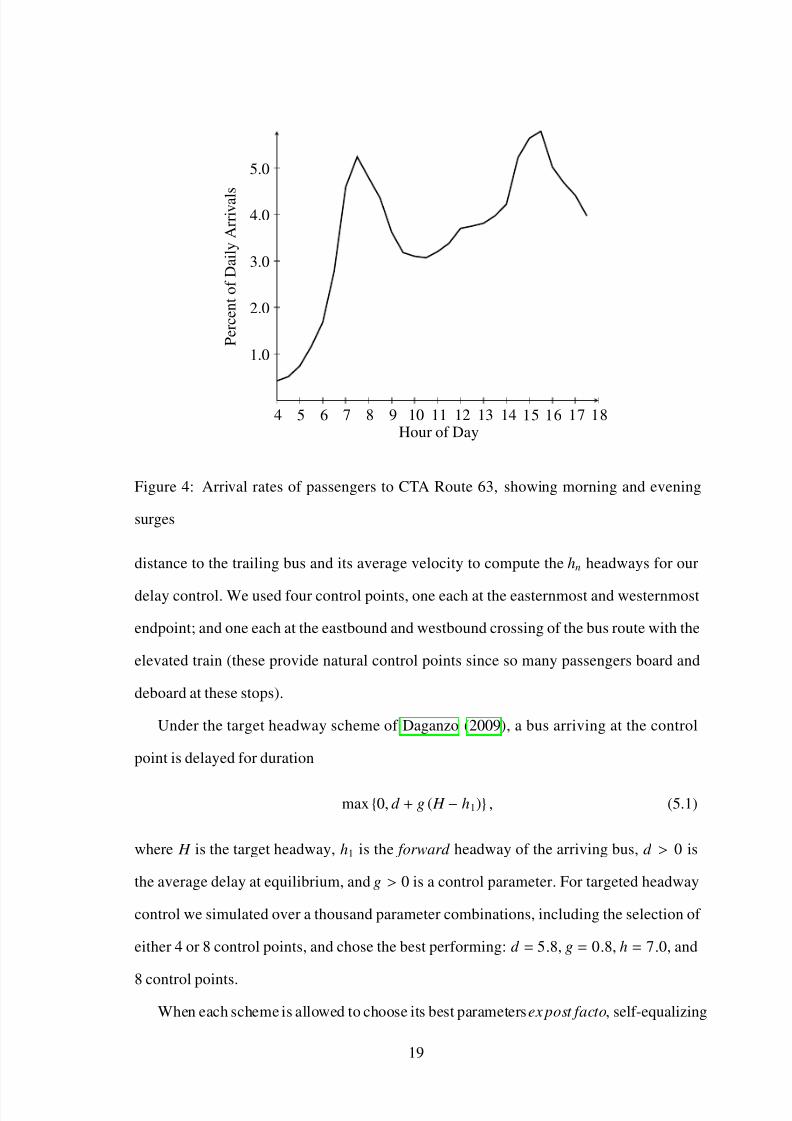
S t a n d a r d D e v i a t i o n o f H e a d w a y s (
m i n u t e s )
Passenger Wait Time:16:00–18:00 Rush
Average (mins) Std Dev (mins)
Min Headway Control 39.33 40.02
Target headways 19.06 18.97
Target schedule 10.80 9.42
Self-equalizing headways 6.55 5.78
Figure 5: Standard deviation of bus headways over a simulated day of heavy ridership.
headways performed best, with an average wait time over the day of 3.92 minutes, com-
pared to 4.79 minutes for the target schedule, and 6.15 minutes for the target headway
method.
Of course, in practice one cannot select parameters ex post facto. The control scheme
must be able to react to the shocks and variances of each day. To test this, we used the
parameter settings described above, but re-ran the simulation to mimic a reduction in
travel velocity by 10%, as might be caused by bad weather or road construction.
The results are shown by the solid lines in Figure 5. Initially, all schemes performed
well under the stress of decreased bus velocity. The target schedule was the first to suc-
cumb to bunching (indicated by the increased standard deviation of bus headways). The
target schedule was able to recover during the midday lull, but at 14:00 both the target
schedule and target headway allowed a rapid increase in bunching. Furthermore, nei-
ther recovered before the end of the day. In contrast, self-equalizing headways showed
less degradation during surges in ridership and recovered more quickly. The table within
Figure 5 shows the resulting average and standard deviation of passenger wait times dur-
20
8/12/2019 A Self Coordinating Bus Route to Resist Bus Bunching
http://slidepdf.com/reader/full/a-self-coordinating-bus-route-to-resist-bus-bunching 21/26
5 6 7 8 9 10 11 12 13 14 15 16 17 18
0.5
1.0
1.5
2.0
Hour of Day
S t a n d a r d D e v i a t i o n o f H e a d w a y s (
m i n u t e s )
Passenger Wait Time:16:00–18:00 Rush
Average (mins) Std Dev (mins)
Min Headway Control 3.59 2.47
Target headways 9.74 10.79
Target schedule 4.62 3.41
Self-equalizing headways 3.39 2.31
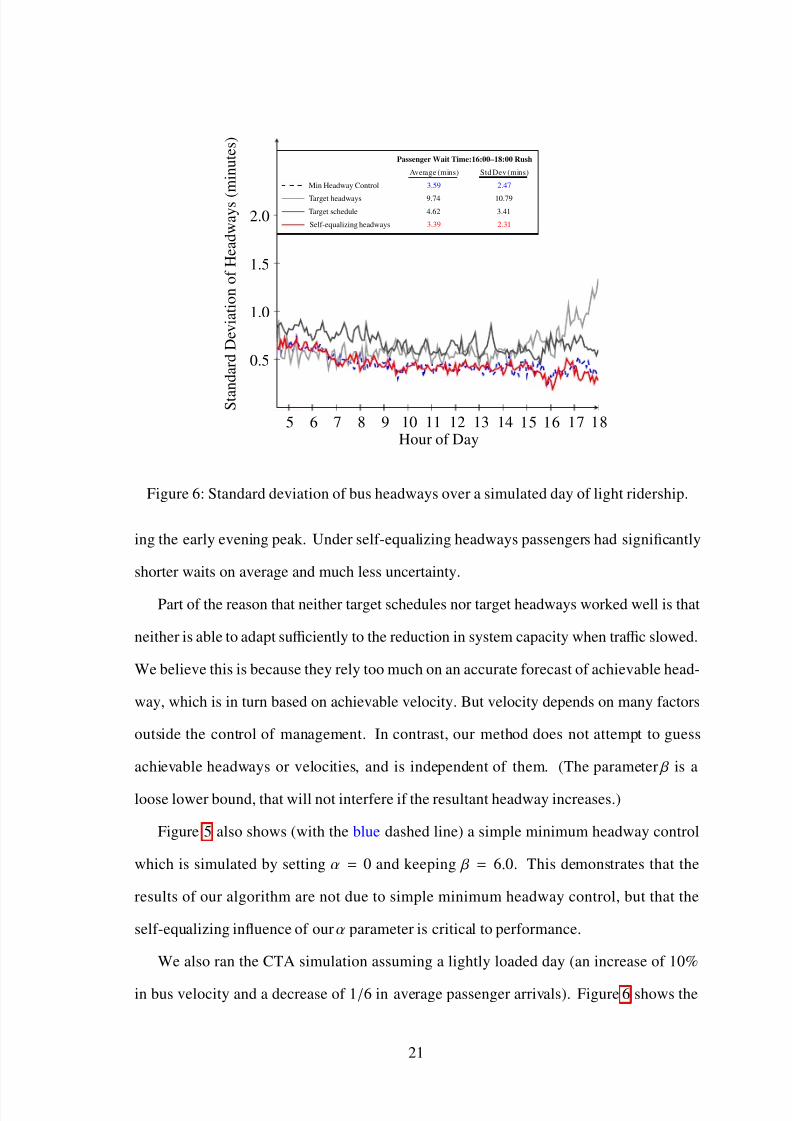
Figure 6: Standard deviation of bus headways over a simulated day of light ridership.
ing the early evening peak. Under self-equalizing headways passengers had significantly
shorter waits on average and much less uncertainty.
Part of the reason that neither target schedules nor target headways worked well is that
neither is able to adapt sufficiently to the reduction in system capacity when traffic slowed.
We believe this is because they rely too much on an accurate forecast of achievable head-
way, which is in turn based on achievable velocity. But velocity depends on many factors
outside the control of management. In contrast, our method does not attempt to guess
achievable headways or velocities, and is independent of them. (The parameter β is a
loose lower bound, that will not interfere if the resultant headway increases.)
Figure 5 also shows (with the blue dashed line) a simple minimum headway control
which is simulated by setting α = 0 and keeping β = 6.0. This demonstrates that the
results of our algorithm are not due to simple minimum headway control, but that the
self-equalizing influence of our α parameter is critical to performance.
We also ran the CTA simulation assuming a lightly loaded day (an increase of 10%
in bus velocity and a decrease of 1/6 in average passenger arrivals). Figure 6 shows the
21
8/12/2019 A Self Coordinating Bus Route to Resist Bus Bunching
http://slidepdf.com/reader/full/a-self-coordinating-bus-route-to-resist-bus-bunching 22/26
results. All methods perform better, as to be expected; but self-equalizing headways and
the minimum headway control perform best, because both are able to take advantage of
the fact that the achievable headway has decreased.
6 Conclusions
Under our control scheme the system of buses acts in eff ect as an analog computer and,
in the absence of perturbations, computes the common headway by achieving it. This
reduces work for management, and simplifies the job of the drivers, who can focus purely
on flowing with the traffic. And most importantly, it provides better service to riders.
It is unnecessary for management to construct a schedule in advance or to monitor ad-
herence to a schedule. All that is required is the setting of two parameters, α to determine
bus utilization and speed of convergence of headways; and β, a lower bound on headway
to strengthen equalization. The amount α of bus capacity held in reserve is easy to under-
stand and to control. A manager can adjust the resultant headway by changing the control
parameter α or by inserting an additional bus into the flow or by removing one, and the
headways will reequilibrate appropriately.
From (3.6) equalization of headways is slowed for α near 0 or near 1. Analysis for
small number n of buses and computational experiments for larger n suggest that conver-
gence (self-equalization) is fastest for values of α in the range 0.5–0.6. Using an α near
0.5 has, so far, always been accepted by managers of bus systems, as this choice means
that at equilibrium each bus is delayed by half the natural headway; about 3–5 minutes in
the small headway systems for which our approach is best suited. In any case, the Markov
chain of Theorem 3.1 converges exponentially fast and therefore the time for our system
to recover equal headways after a disturbance grows only logarithmically in the size of
the disturbance.
Our scheme responds even to large disruptions, such as a bus breakdown or surge in
ridership, by re-distributing the buses to equalize the headways at a new (larger) value.
22
8/12/2019 A Self Coordinating Bus Route to Resist Bus Bunching
http://slidepdf.com/reader/full/a-self-coordinating-bus-route-to-resist-bus-bunching 23/26
Similarly, with reduced traffic, the common headway is spontaneously reduced and ser-
vice improves.
Another advantage of our scheme is that buses can be added to or removed from a
route at arbitrary times and points. This is not so for a target schedule: For example, on
the Georgia Tech Bus Route, scheduled service starts early in the day with a single bus,
then increases to three, and finally to six; and in the evening service is reduced from six
to three to one. It is impractical to increase the number of buses from three to, say, four,
because the schedules of at least two of the three buses would have to be re-anchored. In
contrast, under our scheme, buses can be added or removed arbitrarily (though one may
wish to adjust β and perhaps α).
Our method is also scaleable, in the sense that one can further reduce variance in
headways simply by adding more control points, which enables more frequent correction.
Our scheme is robust even when the route is reconfigured, such as when construction
altered the flow of traffic on campus and forced the temporary re-routing of the Georgia
Tech buses. Such changes would require construction of a new target schedule; but our
scheme would continue to produce regular bus service.
Under our scheme any improvements in processes, such as introducing procedures to
speed boarding, go directly to reduce headways, without the need to rebuild schedules or
re-compute target headways.
Our scheme is easy to implement. In the first experiment students computed the de-
parture times for each successive bus. For the second experiment we provided the same
functionality in wifi-enabled netbook computers. We are now building the third genera-
tion of the control system on mobile phones to be mounted in each bus. A subsequent
paper will describe details.
Because of its simplicity it is easy to adapt our scheme to account for additional busi-
ness rules. For example, some bus systems guarantee drivers a short break time, γ, at each
arrival to specified control points. In this case, our scheme can be extended to delay each
23
8/12/2019 A Self Coordinating Bus Route to Resist Bus Bunching
http://slidepdf.com/reader/full/a-self-coordinating-bus-route-to-resist-bus-bunching 24/26
8/12/2019 A Self Coordinating Bus Route to Resist Bus Bunching
http://slidepdf.com/reader/full/a-self-coordinating-bus-route-to-resist-bus-bunching 25/26
stituto Tecnologico Autonomo de Mexico (October 2010), Metro Transit, Minneapolis,
Minnesota (October 2010), the Department of Industrial and Systems Engineering at the
University of Minnesota (October 2010), INFORMS Austin (November 2010), the Illi-
nois Institute of Technology (November 2010), and the Zaragoza Logistics Center (June
2011). We thank the audiences for many stimulating questions.
References
Barnett, Arnold. 1974. On controlling randomness in transit operations. Transportation Science
8(2) 102–116.
Bartholdi, J. J., III, D. D. Eisenstein. 1996. A production line that balances itself. Operations
Research 44(1) 21–34.
Bartholdi, J. J., III, D. D. Eisenstein, R. D. Foley. 2001. Performance of bucket brigades when
work is stochastic. Operations Research 49(5) 710–719.
Daganzo, C. F. 2009. A headway-based approach to eliminate bus bunching: Systematic analysis
and comparisons. Transportation Research Part B 43(10) 913–921.
Daganzo, C. F., J. Pilachowski. 2011. Reducing bunching with bus-to-bus cooperation. Trans-
portation Research Part B 45(1) 267–277.
Delgado, F., J. C. Munoz, R. Giesen, A. Cipriano. 2009. Real-time control of buses in a transit
corridor based on vehicle holding and boarding limits. Transportation Research Record
(2090) 59–67.
Eberlein, X. J., N. H. M. Wilson, D. Bernstein. 2001. The holding problem with real-time infor-
mation available. Transportation Science 35(1) 1–18.
Gerasole, Vince. 2008. CTA working to reduce frustrating ‘bus bunching’. URL http:
//CBS2Chicago.com/local/bus.bunching.frustrations.2.647878.html .
Hickman, M. D. 2001. An analytic stochastic model for the transit vehicle holding problem.
Transportation Science 35(3) 215–237.
Luman, Stuart. 2007. Bunching and waiting. Crain’s Chicago Business .
25
8/12/2019 A Self Coordinating Bus Route to Resist Bus Bunching
http://slidepdf.com/reader/full/a-self-coordinating-bus-route-to-resist-bus-bunching 26/26
Milkovits, M. N. 2008. Simulating service reliability of a high frequency bus route using au-
tomatically collected data. Master of science in transportation, Massachusetts Institute of
Technology, Department of Civil and Environmental Engineering.
Minser, Jason. 2009. Manager, market research, planning and development. Chicago Transit Au-
thority. Personal communication.
Newell, G. F., R. B. Potts. 1964. Maintaining a bus schedule. Proceedings of the 2nd Australian
Road Research Board , vol. 2. 388–393.
Zhao, J., S. Bukkapatnam, M. M. Dessouky. 2003. Distributed architecture for real-time coordi-
nation of bus holding in transit networks. IEEE Transactions on Intelligent Transportation
Systems 4(1) 43–51.
Zhao, J., M. Dessouky, S. Bukkapatnam. 2006. Optimal slack time for schedule-based transit
operations. Transportation Science 40(4) 529–539.