a reliability engineering approach to digital watermark ... · a reliability engineering approach...
TRANSCRIPT

A Reliability Engineering Approachto Digital Watermark Evaluation
Hyung Cook Kim and Edward J. Delp
Video and Image Processing Laboratory (VIPER)School of Electrical and Computer Engineering
Purdue UniversityWest Lafayette, Indiana USA
ABSTRACT
Robust watermarks are evaluated in terms of image fidelity and robustness. We extend this framework and applyreliability testing to robust watermark evaluation. Reliability is the probability that a watermarking algorithmwill correctly detect or decode a watermark for a specified fidelity requirement under a given set of attacksand images. In reliability testing, a system is evaluated in terms of quality, load, capacity and performance.To measure quality that corresponds to image fidelity, we compensate for attacks to measure the fidelity ofattacked watermarked images. We use the conditional mean of pixel values to compensate for valumetric attackssuch as gamma correction and histogram equalization. To compensate for geometrical attacks, we use errorconcealment and perfect motion estimation assumption. We define capacity to be the maximum embeddingstrength parameter and the maximum data payload. Load is then defined to be the actual embedding strengthand data payload of a watermark. To measure performance, we use bit error rate (BER) and receiver operatingcharacteristics (ROC) and area under the curve (AUC) of the ROC curve of a watermarking algorithm fordifferent attacks and images. We evaluate robust watermarks for various quality, loads, attacks, and images.
Keywords: Digital Watermarking, Robust Still Image Watermark Evaluation, Compensated Mean SquareError, Reliability Testing
1. INTRODUCTION
Robust image watermarks are image watermarks designed to survive attacks that include signal processing andspatial transformations [1–3]. As recognized in [4], we need fair watermark evaluation methods and benchmarksto facilitate the advancement of robust digital watermarking. Because of this need, various evaluation methodsand benchmarks have been developed [4–14]. A block diagram of a typical robust watermarking model [15] isshown in Figure 1. Important properties of robust watermarks are fidelity and performance of the watermarkagainst different attacks [1]. Fidelity is the perceptual similarity between the original and watermarked image.Performance is the ability to detect/decode the watermark. Attacks are important part of watermark evaluationand various attacks are implemented as part of benchmarks [6–8]. We use StirMark 4.0 [6, 7] attacks in thispaper. There is a trade off between performance and fidelity [4] and we control this trade off by using theembedding strength α shown in Figure 1. The most popular fidelity measure for images is the mean squareerror (MSE) [16] and PSNR which is a logarithmic scaled MSE [16]. Because PSNR [16] does not correlate toowell with the human visual system (HVS), other more sophisticated objective fidelity metrics have been usedfor watermark evaluation [4, 5, 8, 12, 14]. For performance measures, receiver operating characteristic (ROC),bit error rate (BER), and message error rate are generally used [1, 4, 17]. To display evaluation results, theuse of “BER versus visual quality,” “BER versus attack,” “attack versus visual quality” for a fixed BER, wasproposed in [4]. In watermark evaluation, it is important to summarize the results to facilitate the comparisonof algorithms. For BER, the results are summarized using message error rate or average bit error rate [4]. Forfidelity metric summarization, some iterate the embedding strength for each image to meet a fidelity requirement
This work was supported by the Air Force Research Laboratory, Information Directorate, Rome Research Site, underresearch grant number F30602-02-2-0199. Address all correspondence to E. J. Delp, [email protected].
Security, Steganography, and Watermarking of Multimedia Contents VIII, edited by Edward J. Delp III, Ping Wah Wong,Proc. of SPIE-IS&T Electronic Imaging, SPIE Vol. 6072, 60721N, © 2006 SPIE-IS&T · 0277-786X/06/$15
SPIE-IS&T/ Vol. 6072 60721N-1

Figure 1. A Block Diagram of a Watermarking System [15]
threshold [4,5,11,12]. To summarize ROC, area under the curve (AUC), equal error rate, false negative rate fora fixed false positive probability are used [4, 11].
Many of the watermark evaluation methods fit into the reliability testing framework [18]. We define reliabilityas the probability that a watermarking algorithm will correctly detect or decode a watermark for a specifiedfidelity requirement under a given set of attacks and images. In reliability testing, a system is evaluated in termsof quality, load, capacity, and performance. To measure quality that corresponds to image fidelity, we need tomeasure the fidelity of the attacked image as well as the watermarked image. PSNR, as it is, cannot be used tomeasure fidelity for valumetric attacks [1, 19] such as gamma correction or amplitude scaling, pixel loss attackssuch as cropping or random row column removal [4, 6, 7], geometrical attacks such as image shifting or aspectratio change. In this paper, we will measure fidelity of these attacks by compensating the attacks [12]. Using thisnew measure, we will evaluate watermark algorithms in a reliability testing framework by varying embeddingstrength, payload and measure the performance and fidelity. This paper is organized as follows: In section 2,we describe a technique to measure fidelity in terms of mean square error for valumetric attacks, pixel lossattacks, and geometrical attacks. In section 3, we define quality, load, capacity, and performance and evaluatewatermarking algorithms by varying quality and load. The conclusion and future work is given in section 4.
2. COMPENSATED MEAN SQUARE ERRORMeasuring fidelity of the attacked images is important as well as measuring the fidelity of the watermarkedimage. In [12], fidelity evaluation for geometrical attacks are given. In [14], conditional entropy is used toevaluate valumetric attacks including histogram equalization, and amplitude scaling. In the following, we willextend MSE by compensating for valumetric attacks, geometrical attacks, and pixel loss attacks. A distortionfunction we will use is given below and similar to the one given in [20].
d(s,y) = minθ∈Θ
‖s − Tθy‖2
, where Θ is the set of compensating functions. We develop Tθ for geometrical attacks, valumetric attacks andpixel loss attacks and combine them to measure in terms of MSE. For test images, we will use the images shownin Figure 2.
2.1. Compensation for Valumetric AttacksValumetric Attacks or point operations are zero memory operations where a function f(s) maps a pixel value s tof(y) [16,19]. Valumetric attacks include contrast stretching, digital negative, range compression, and histogramequalization. These point operation functions are either monotonically increasing or decreasing. We assume thatthese operations work because HVS determines the content not by the exact value of a pixel but the rank of thepixel values. This is analogous to changing keys in music.
Let s(y) be a function that maps the attacked image pixel values to other pixel values. This function isdefined only for values y such that p(y) > 0. We can write MSE for the image produced by the mapping s(y)using the joint probability as follows:
MSE(s, y) =∑
s
∑
y,p(y)>0
(s − s(y))2p(s, y).
SPIE-IS&T/ Vol. 6072 60721N-2

(a) fcc-door(440x324) (b) 0115(600x400) (c) grid-16-16(600x400)
Figure 2. Test Images.
It is well known that smmse(y) (p(y) > 0), which minimizes MSE, is the conditional mean,
smmse(y) =∑
s
sp(s|y).
Theorem 2.1. Let y = f(s) be a monotonically increasing function. Then smmse(y) is an increasing functionfor values of y s.t. p(y) > 0.
Proof.
We can rewrite smmse(y) as follows:
smmse(y) =∑
s,p(s)>0,f(s)=y
sp(s|y).
Because∑
s p(s|y) = 1, smmse(y) is an weighted average of s’s for f(s) = y. By the definition of f , if s1 and s2
exists s.t. f(s1) > f(s2) then s1 > s2. This implies that if y1 > y2, then smmse(y1) > smmse(y2) for any y1 andy2 s.t. p(y1) > 0 and p(y2) > 0. This means smmse(y) is an increasing function for values of y s.t. p(y) > 0.
Since the conditional mean preserves the rank of the attacked image pixel values, we use the conditionalmean to evaluate images that go through a point operation. From the histogram h(s, y) of pixel values, we canapproximate the conditional mean as follows:
smmse(s) =∑
s
sp(s|y)
≈∑
s sh(s, y)∑s h(s, y)
.
2.2. Compensating for Pixel Loss Attacks
We define pixel loss attacks as attacks that lose the value of a pixel. Pixel loss attacks include cropping,random column and row removal. Pixel loss attacks can be seen as a packet loss due the error occurring in thechannel [21–23]. Although we could use conditional mean for the lost pixels by mapping the lost pixels to anarbitrary pixel value (e.g. -1 or 256), we are ignoring the correlation between adjacent pixels in an image. Thehuman visual system can estimate the values of lost pixels by the pixels close to the lost pixel. For pixel lossattacks, there are error concealment methods already developed [24]. Here we use the neighborhood mean forerror concealment to estimate the lost pixel values as shown in Figure 3.
SPIE-IS&T/ Vol. 6072 60721N-3

Figure 3. Neighborhood mean.
2.3. Compensation for Geometrical Attacks
A geometric attack is defined by a spatial transformation [25]. It can be expressed as
[x, y] = [X(u, v)Y (u, v)]
or[u, v] = [U(x, y)V (x, y)]
where [u,v] is the input image coordinates and [x,y] is the output image coordinates of the spatial transformation.X and Y are the forward mapping and U and V are the inverse mapping. Inverse mapping is more common thanthe forward mapping in spatial transformation implementations [25] and is used in StirMark 4.0. Currently, twomethods exist to evaluate geometrically attacked images [12]. One is to do a subjective evaluation. The other isto use a registration technique to match the host image and the attacked image geometrically.
As mentioned above, we take the approach of compensating the attacked image and measure fidelity in termsof MSE. For all geometric attacks in StirMark 4.0, we can obtain the exact expression for forward mappingexcept the local random bending attack. This eliminates the image registration step. The reason that there isno exact expression for the forward mapping in local random bending is that there are random components inthe inverse mapping. For interpolation of pixels, we use the biquadratic interpolation used in StirMark 4.0. Itsspeed and interpolation quality is between bilinear interpolation and bicubic interpolation [26].
2.3.1. Forward Mapping for the Affine Transform
For an affine transform inverse mapping
u = a1x + a2y + a3
v = a4x + a5y + a6
, the forward mapping is
x =a5(u − a3) − a2(v − a6)
a1a5 − a2a4
y =−a4(u − a3) + a1(v − a6)
a1a5 − a2a4.
2.3.2. Inverse Mapping Approximation using the Bilinear Transform
We approximate the inverse mapping for the local bending attack as a piecewise bilinear transform [25] bydividing the output image into square grids.
Given four points on a square grid (x0, y0), (x0 + 1, y + 1), (x0 + 1, y0 + 1), and its corresponding bilineartransformed points (u1, v1), (u2, v2), (u3, v3), and (u4, v4), we can obtain the bilinear transform as follows:
u = a1(x − x0) + a2(y − y0) + a3(x − x0)(y − y0) + u1
v = a5(x − x0) + a6(y − y0) + a7(x − x0)(y − y0) + v1.
SPIE-IS&T/ Vol. 6072 60721N-4

a1 = u2 − u1
a5 = v2 − v1
a2 = u3 − u1
a6 = v3 − v1
a3 = u4 − a1 − a2 − u1
a7 = v4 − a5 − a6 − v1
A property of the bilinear transform is that it maps horizontal or vertical lines to straight lines in thetransformed coordinates [25]. This means that a grid square in the output image coordinates is mapped to aquadrangle in the input image coordinates.
2.3.3. Forward Mapping using the Inverse Mapping Approximation
We approximate the forward mapping given the piecewise bilinear transform using a minimization algorithm [27]to find the inverse with the following cost function and its gradient:
f(x, y) = (U(x, y) − u)2 + (V (x, y) − v)2
∇f(x, y) = 2[
(U(x, y) − u)(a1 + a3(y − y0)) + (V (x, y) − v)(a2 + a3(x − x0))(U(x, y) − u)(a5 + a7(y − y0)) + (V (x, y) − v)(a6 + a7(x − x0))
]
We used the Broyden-Fletcher-Goldfarb-Shanno (BFGS) variable metric algorithm from the gnu gsl library [28]as our minimization algorithm.
To use the BFGS algorithm, we need to choose an initial point (xo, yo). We make an array aij that stores allthe initial points for the input grid points. aij has the same size as the input image. For each point (u, v) in theinput image, we choose the initial point as a�u��v� and based on the value of the initial point we can determinef(x,y), and ∇f(x, y). For each output image grid square, we draw a bilinear transformed quadrangle on thevector array aij . We use the same bilinear transform used in the inverse mapping. Quadrangles are drawn usingthe midpoint line algorithm [29]. The values of the quadrangle we draw with are the center point of the outputimage grid square which is a vector not a scalar value. To fill inside the quadrangle, we use the neighborhoodmean shown in Figure 3. Using the neighborhood mean, we also fill aij ’s that are not inside any quadranglegenerated by the output image grid squares.
2.4. Experimental ResultsThe histogram equalization image and its conditional mean image are shown in Figure 4. The amplitude scaledimage and its conditional mean image are shown in Figure 5. The difference image is the difference between theattacked image and the conditional mean image. As we can see from the test images, the conditional mean didnot considerably change the PSNR values for attacks that are not valumetric attacks. This may be due to thefact that the three attacks locally preserve DC values. We can see that for attacks other than valumetric attacks,conditional mean image show artifacts in the image. This is because the conditional mean does not consider therelationship between adjacent pixels or the frequency response of the human visual system.
PSNR values using conditional mean or error concealment is shown in Figure 6 and Figure 7 for croppingand row and column removal (jitter attack). We can see that the PSNR for the conditional mean images aresimilar for the two attacks. This is because we are losing similar amount of pixels. From comparing the twoimages, error concealment works better for the “0115” test image. If we compare cropping and jitter attack,jitter attack has better PSNR because interpolation is more accurate than extrapolation. If we compare the twoimages for the cropping attack, PSNR for the conditional mean image is better than the error concealment imagefor the “fcc-door” test image. This is due to the frame around the “fcc-door” test image. Results for 45 degreeis shown in Figure 8. Results for a local random bending attack is shown in Figure 9. We can see that localrandom bending attack includes pixel loss attack due to cropping. Because of iteration in the forward mappingapproximation, compensating local random bending attack takes about 5 seconds on a Xeon 3.6 GHz computerfor a 600x400 image.
SPIE-IS&T/ Vol. 6072 60721N-5

4
PSNR 17.5dB PSNR 54.7dB(a) Attacked image (b) Conditional mean
Figure 4. Histogram Equalization.
PSNR 12.4dB PSNR 52.1dB(a) Attacked image (b) Conditional mean
Figure 5. Amplitude Scaling with factor 916
.
PSNR 19.4dB PSNR 16.8dB
PSNR 22.4dB PSNR 32.6dB(a) Attacked image (b) Conditional mean (c) Error concealment
Figure 6. Cropping with factor 0.9
SPIE-IS&T/ Vol. 6072 60721N-6

'''''III''''''
r rPSNR 22.9dB PSNR 41.5dB
(a) Attacked image (b) Conditional mean (c) Error concealment
Figure 7. Remove every 10th row and column.
PSNR 32.1dB PSNR 32.1dB(a) Attacked image (b) Conditional mean (c) Error concealment
Figure 8. Rotation 45 degree.
3. RELIABILITY TESTING
Most of the watermark evaluation methods [4,5,8,12,14] fit the reliability testing framework. We define reliabilityas the probability that a watermarking algorithm will correctly detect or decode a watermark for a specifiedfidelity requirement under a given set of attacks and images. In reliability testing, a system is evaluated in termsof quality, load, capacity and performance [18]. We define quality as the fidelity of watermarked images producedby an watermarking algorithm and attacks. In this paper, we will measure fidelity using the compensated MSEdescribed in section 2. We define capacity as the maximum data payload or minimum embedding strength thatsatisfies a certain error criteria. Then, we define load to be the actual embedding strength and data payload of awatermark. Because, capacity usually exceeds watermarking requirements, we will not consider capacity in thispaper. The environment we used in this paper is as follows. We use PSNR as our fidelity measure and ROC andBER as our performance measure. We use the Taguchi loss function to summarize BER and PSNR results [13,14]and AUC to summarize ROC results. AUC is an estimate of the probability that the detection statistic from anwatermarked image will be greater than the detection statistic from an unwatermarked image [30].
3.1. Watermark Evaluation Parameters
For our watermark evaluation parameters, we follow the evaluation parameters described in [14]. We selectedASSW, ISSW, and MSSW described in [13,14] as our test algorithms. We modified the algorithms so that it onlyembeds on the DCT coefficients shown in Figure 10 to reduce the visibility of watermarks [31, 32]. We set thelower specification limit for PSNR′ [14] as 45dB. We chose the data payload to be 16 bits. This specification canbe used as a specification for “fingerprinting” applications [33, 34]. We tested 20 keys for no attacks and 2 keys
SPIE-IS&T/ Vol. 6072 60721N-7

UIPSNR=7.4dB PSNR=23.6 dB PSNR=21.1dB
PSNR=24.8dB PSNR=30.9dB PSNR=41.2dB(a) Attacked image (b) Conditional mean (c) Error concealment
Figure 9. StirMark attack
Figure 10. Watermarking in the DCT domain.
SPIE-IS&T/ Vol. 6072 60721N-8

Name No Attack Gaussian Filtering SharpeningASSW (45.0,45.0) (31.6,33.5) (21.9,22.8)MSSW (45.0,∞) (31.6,33.5) (22.5,23.8)ISSW (45.0,45.0) (31.6,33.5) (21.9,22.8)
Name JPEG Amplitude Scaling Histogram EqualizationASSW (39.0,39.8) (12.4,13.3) (13.3,16.1)MSSW (38.1,38.9) (12.4,13.3) (13.0,16.3)ISSW (39.0,39.8) (12.4,13.3) (13.3,16.1)
Table 1. (PSNR′, Average(PSNR)) pair for different attacks
for other attacks for each image. For the image test set, we used the WET(watermark evaluation testbed) [13]image database. It has 1301 images. We choose the attacks described in [14] which include blur, sharpening,JPEG, amplitude scaling, histogram equalization. We use StirMark 4.0 [6, 7] implementation of these attacksexcept histogram equalization which is an implementation of the algorithm described in [16]. We measure thefidelity of the attacked image using compensated MSE instead of conditional entropy used in [14]. Similar to [4],instead of fixing the payload and embedding strength as in [14], we varied the payload and embedding strengthto better characterize the watermarking algorithm. We also varied the JPEG quality from 10%, to 90% with20% increments.
3.2. Experimental Results
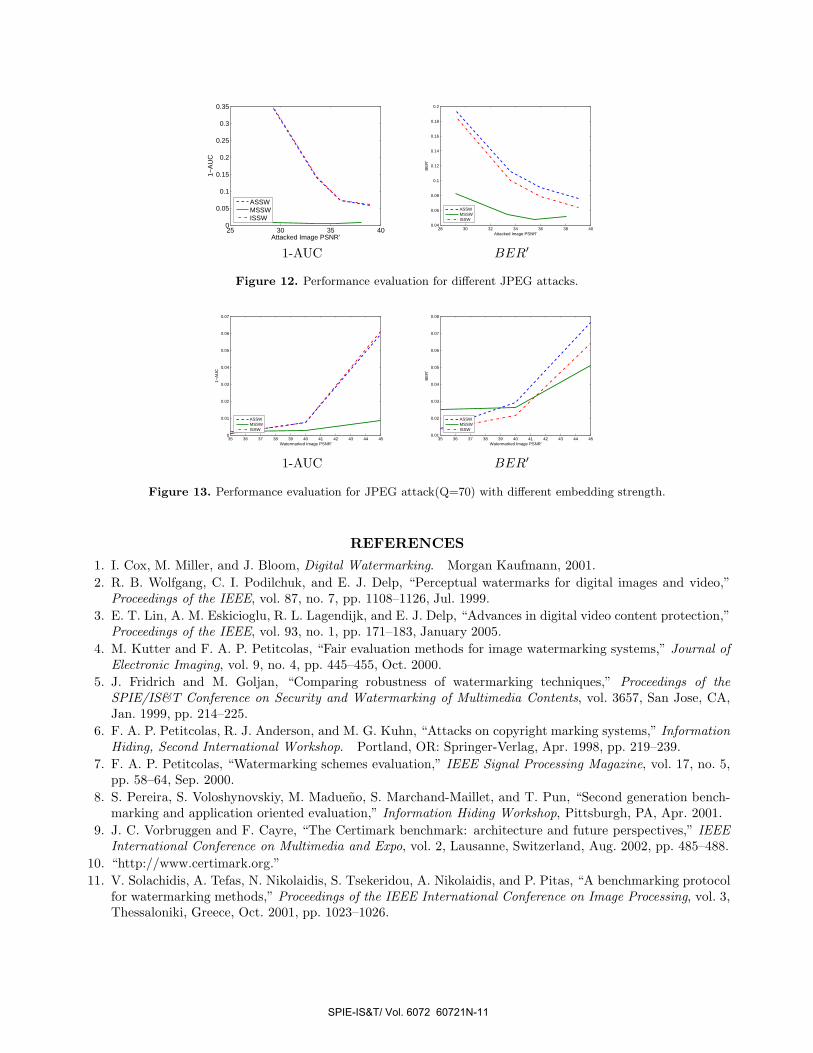
Table 1 shows the average PSNR, PSNR′ values. Table 2 shows results for the conditional mean image PSNR(PSNRcm). For the histogram equalization and amplitude scaling, PSNRcm has a significantly larger value thanPSNR. Table 3 shows the BER results for different attacks. It shows that ISSW is always better than the ASSWin terms of BER for the attacks selected except histogram equalization. MSSW is better than ISSW and ASSWfor the JPEG attack. It also shows that the sharpening attack lowered BER for all algorithms even though theimages are degraded more than other attacks. Table 4 shows the 1-AUC results. It shows that 1-AUC values forASSW and ISSW are similar and MSSW is better that the other two for JPEG and Gaussian filtering. Figure 11shows the performance results for different payload and JPEG attack. As expected, the performance decreasedwhen payload increased. Figure 12 shows the results for different JPEG attacks. It shows that performanceof MSSW does not change as much compared to other two algorithms. Figure 13 shows the results for variousembedding strength. It shows that ASSW and ISSW can have better performance than MSSW by sacrificingfidelity.
4. CONCLUSION AND FUTURE WORK
Evaluating fidelity of the attacked images is important for attack development and consequently watermarkdevelopment. We measured the fidelity for valumetric attacks using conditional mean, pixel loss attacks usingerror concealment, and geometrical attacks by inverting the attacks. We also evaluated watermarks in a reliabilitytesting framework. We evaluated watermarks by varying the embedding strength, payload, and attacks. We usedthe Taguchi loss function to summarize BER and PSNR results and AUC to summarize ROC results.
For future work, to measure fidelity for valumetric attacks, we could extend conditional mean by consideringthe frequency component of the image or correlation between adjacent pixels. For error concealment, we coulduse multiresolution error concealment techniques to improve PSNR values. For forward mapping of the bilineartransform used to compensate StirMark attack, we need to improve speed of the mapping. We could useinformation from previous pixels to improve speed. For the watermark evaluation results, we did not includeconfidence level results. We need to devise a way to include confidence intervals into the evaluation results. Also,we only used PSNR as our fidelity measure and we need to investigate other objective fidelity measures [12].
SPIE-IS&T/ Vol. 6072 60721N-9
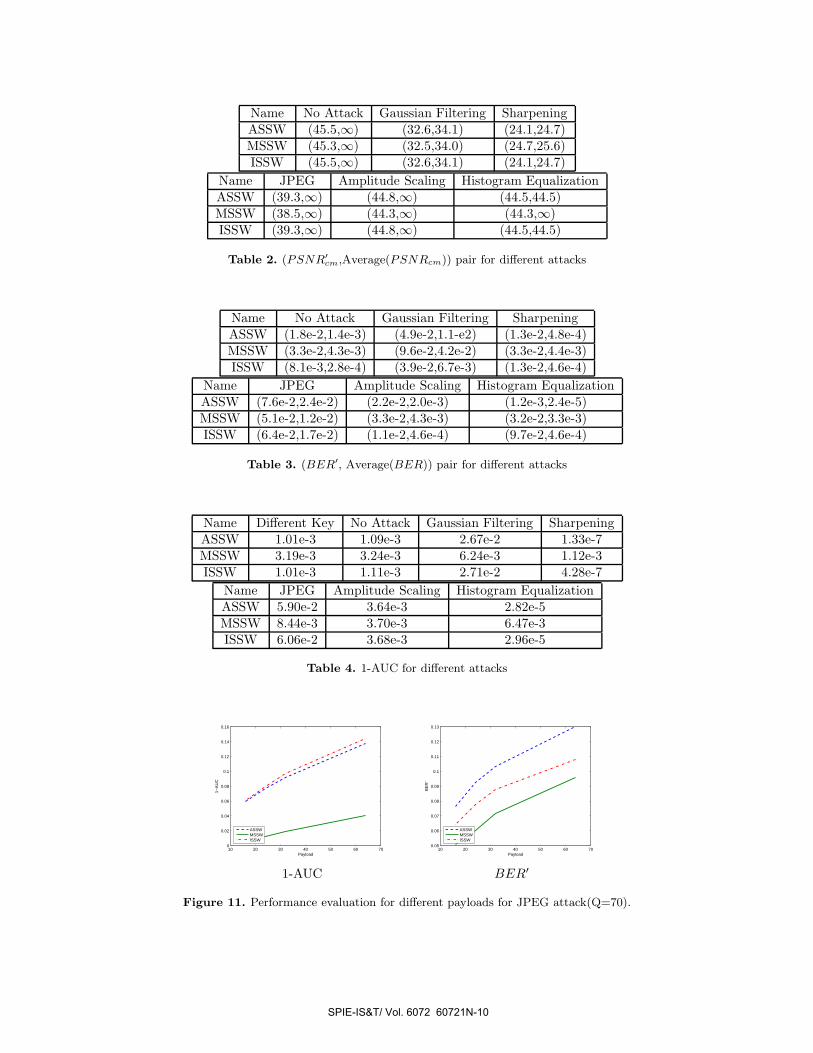
Name No Attack Gaussian Filtering SharpeningASSW (45.5,∞) (32.6,34.1) (24.1,24.7)MSSW (45.3,∞) (32.5,34.0) (24.7,25.6)ISSW (45.5,∞) (32.6,34.1) (24.1,24.7)
Name JPEG Amplitude Scaling Histogram EqualizationASSW (39.3,∞) (44.8,∞) (44.5,44.5)MSSW (38.5,∞) (44.3,∞) (44.3,∞)ISSW (39.3,∞) (44.8,∞) (44.5,44.5)
Table 2. (PSNR′cm,Average(PSNRcm)) pair for different attacks
Name No Attack Gaussian Filtering SharpeningASSW (1.8e-2,1.4e-3) (4.9e-2,1.1-e2) (1.3e-2,4.8e-4)MSSW (3.3e-2,4.3e-3) (9.6e-2,4.2e-2) (3.3e-2,4.4e-3)ISSW (8.1e-3,2.8e-4) (3.9e-2,6.7e-3) (1.3e-2,4.6e-4)
Name JPEG Amplitude Scaling Histogram EqualizationASSW (7.6e-2,2.4e-2) (2.2e-2,2.0e-3) (1.2e-3,2.4e-5)MSSW (5.1e-2,1.2e-2) (3.3e-2,4.3e-3) (3.2e-2,3.3e-3)ISSW (6.4e-2,1.7e-2) (1.1e-2,4.6e-4) (9.7e-2,4.6e-4)
Table 3. (BER′, Average(BER)) pair for different attacks
Name Different Key No Attack Gaussian Filtering SharpeningASSW 1.01e-3 1.09e-3 2.67e-2 1.33e-7MSSW 3.19e-3 3.24e-3 6.24e-3 1.12e-3ISSW 1.01e-3 1.11e-3 2.71e-2 4.28e-7
Name JPEG Amplitude Scaling Histogram EqualizationASSW 5.90e-2 3.64e-3 2.82e-5MSSW 8.44e-3 3.70e-3 6.47e-3ISSW 6.06e-2 3.68e-3 2.96e-5
Table 4. 1-AUC for different attacks
10 20 30 40 50 60 700
0.02
0.04
0.06
0.08
0.1
0.12
0.14
0.16
Payload
1−A
UC
ASSWMSSWISSW
10 20 30 40 50 60 700.05
0.06
0.07
0.08
0.09
0.1
0.11
0.12
0.13
Payload
BE
R’
ASSWMSSWISSW
1-AUC BER′
Figure 11. Performance evaluation for different payloads for JPEG attack(Q=70).
SPIE-IS&T/ Vol. 6072 60721N-10
25 30 35 400
0.05
0.1
0.15
0.2
0.25
0.3
0.35
Attacked Image PSNR’
1−A
UC
ASSWMSSWISSW
28 30 32 34 36 38 400.04
0.06
0.08
0.1
0.12
0.14
0.16
0.18
0.2
Attacked Image PSNR’
BE
R’
ASSWMSSWISSW
1-AUC BER′
Figure 12. Performance evaluation for different JPEG attacks.
35 36 37 38 39 40 41 42 43 44 450
0.01
0.02
0.03
0.04
0.05
0.06
0.07
Watermarked Image PSNR’
1−A
UC
ASSWMSSWISSW
35 36 37 38 39 40 41 42 43 44 450.01
0.02
0.03
0.04
0.05
0.06
0.07
0.08
Watermarked Image PSNR’
BE
R’
ASSWMSSWISSW
1-AUC BER′
Figure 13. Performance evaluation for JPEG attack(Q=70) with different embedding strength.
REFERENCES1. I. Cox, M. Miller, and J. Bloom, Digital Watermarking. Morgan Kaufmann, 2001.2. R. B. Wolfgang, C. I. Podilchuk, and E. J. Delp, “Perceptual watermarks for digital images and video,”
Proceedings of the IEEE, vol. 87, no. 7, pp. 1108–1126, Jul. 1999.3. E. T. Lin, A. M. Eskicioglu, R. L. Lagendijk, and E. J. Delp, “Advances in digital video content protection,”
Proceedings of the IEEE, vol. 93, no. 1, pp. 171–183, January 2005.4. M. Kutter and F. A. P. Petitcolas, “Fair evaluation methods for image watermarking systems,” Journal of
Electronic Imaging, vol. 9, no. 4, pp. 445–455, Oct. 2000.5. J. Fridrich and M. Goljan, “Comparing robustness of watermarking techniques,” Proceedings of the
SPIE/IS&T Conference on Security and Watermarking of Multimedia Contents, vol. 3657, San Jose, CA,Jan. 1999, pp. 214–225.
6. F. A. P. Petitcolas, R. J. Anderson, and M. G. Kuhn, “Attacks on copyright marking systems,” InformationHiding, Second International Workshop. Portland, OR: Springer-Verlag, Apr. 1998, pp. 219–239.
7. F. A. P. Petitcolas, “Watermarking schemes evaluation,” IEEE Signal Processing Magazine, vol. 17, no. 5,pp. 58–64, Sep. 2000.
8. S. Pereira, S. Voloshynovskiy, M. Madueno, S. Marchand-Maillet, and T. Pun, “Second generation bench-marking and application oriented evaluation,” Information Hiding Workshop, Pittsburgh, PA, Apr. 2001.
9. J. C. Vorbruggen and F. Cayre, “The Certimark benchmark: architecture and future perspectives,” IEEEInternational Conference on Multimedia and Expo, vol. 2, Lausanne, Switzerland, Aug. 2002, pp. 485–488.
10. “http://www.certimark.org.”11. V. Solachidis, A. Tefas, N. Nikolaidis, S. Tsekeridou, A. Nikolaidis, and P. Pitas, “A benchmarking protocol
for watermarking methods,” Proceedings of the IEEE International Conference on Image Processing, vol. 3,Thessaloniki, Greece, Oct. 2001, pp. 1023–1026.
SPIE-IS&T/ Vol. 6072 60721N-11

12. B. Macq, J. Dittmann, and E. J. Delp, “Benchmarking of image watermarking algorithms for digital rightsmanagement,” Proceedings of the IEEE, vol. 92, no. 6, pp. 971–984, June 2004.
13. H. C. Kim, H. Ogunleye, O. Guitart, and E. J. Delp, “The Watermark Evaluation Testbed (WET),”Proceedings of the SPIE/IS&T Conference on Security and Watermarking of Multimedia Contents, ser.Proceedings of SPIE Electronic Imaging, San Jose, CA, Jan. 2004, pp. 236–247.
14. H. C. Kim, E. T. Lin, O. Guitart, and E. J. Delp, “Further progress in Watermark Evaluation Testbed(WET),” Proceedings of the SPIE/IS&T Conference on Security and Watermarking of Multimedia Contents,ser. Proceedings of SPIE Electronic Imaging, San Jose, CA, Jan. 2005, pp. 241–251.
15. C. I. Podilchuk and E. J. Delp, “Digital watermarking: Algorithms and applications,” IEEE Signal Pro-cessing Magazine, vol. 18, no. 4, pp. 33–46, Jul. 2001.
16. A. K. Jain, Fundamentals of digital image processing. Englewood Cliffs, NJ: Prentice-Hall, Inc., 1989.17. A. M. Eskicioglu and E. J. Delp, “An overview of multimedia content protection in consumer electronics
devices,” Signal Processing: Image Communication, vol. 16, pp. 681–699, 2001.18. E. E. Lewis, Introduction to Reliability Engineering. John Wiley and Sons, Inc., 1996.19. P. Bas, “A quantization watermarking technique robust to linear and non-linear valumetric distortions using
a fractal set of floating quantizers,” Information Hiding Workshop, Barcelonna, Spain, May 2005.20. P. Moulin and R. Koetter, “Data-hiding codes,” to appear in Proceedings IEEE, December 2005.21. E. T. Lin, C. I. Podilchuk, T. Kalker, and E. J. Delp, “Streaming video and rate scalable compression:
What are the challenges for watermarking?” Journal of Electronic Imaging, vol. 13, no. 1, pp. 198–205, Jan.2004.
22. A. M. Eskicioglu, J. Town, and E. J. Delp, “Security of digital entertainment content from creation toconsumption,” Signal Processing: Image Communication, vol. 18, pp. 237–262, 2003.
23. E. T. Lin and E. J. Delp, “Temporal synchronization in video watermarking,” IEEE Transactions on SignalProcessing, vol. 52, no. 10, pp. 3007–3022, Oct. 2004.
24. P. Salama, N. B. Shroff, and E. J. Delp, “Error concealment in encoded video streams,” Signal RecoveryTechniques for Image and Video Compression and Transmission. Kluwer Academic Publishers, 1998, pp.199–233.
25. G. Wolberg, Digital Image Warping. Los Alamitos, CA: IEEE Computer Society Press, 1990.26. N. A. Dodgson, “Quadratic interpolation for image resampling,” IEEE Transactions on Image Processing,
vol. 6, no. 9, 1997.27. W. H. Press, B. P. Flannery, S. A. Teukolsky, and W. T. Vetterling, Numerical Recipes: The Art of Scientific
Computing, 2nd ed. Cambridge (UK) and New York: Cambridge University Press, 1992.28. “http://www.gnu.org/software/gsl/.”29. J. D. Foley, A. van Dam, S. K. Feiner, and J. F. Hughes, Computer graphics: principles and practice (2nd
ed.). Boston, MA, USA: Addison-Wesley Longman Publishing Co., Inc., 1990.30. T. Fawcett, “Roc graphs: Notes and practical considerations for data mining researchers,” Technical Report
HPL-2003-4, HP Labs, 2003.31. M. Barni and F. Bartolini, Watermarking Systems Engineering. Marcel Dekker, Inc., 2004.32. M. Barni, C. I. Podilchuk, F. Bartolini, and E. J. Delp, “Watermark embedding: Hiding a signal within a
cover image,” IEEE Communications Magazine, vol. 39, no. 8, pp. 102–108, Aug. 2001.33. Deliverables D21: Watermarking applications and requirements for benchmarking. The Certimark Consor-
tium, Oct. 2000, Available from http://www.certimark.org.34. E. J. Delp, “Is your document safe: An overview of document and print security,” presented at NIP18:
International Conference on Digital Printing Technologies, San Diego, CA, Sep. 29–Oct. 4 2002.
SPIE-IS&T/ Vol. 6072 60721N-12