a regime switching approach to the feldstein–horioka puzzle: evidence from some european countries
TRANSCRIPT
Journal of Policy Modeling 29 (2007) 523–533
A regime switching approach to the Feldstein–Horiokapuzzle: Evidence from some European countries
Erdinc Telatar ∗, Funda Telatar, Nasip BolatogluDepartment of Economics, Hacettepe University, Beytepe, Ankara, Turkey
Received 6 February 2006; received in revised form 6 October 2006; accepted 6 December 2006Available online 16 January 2007
Abstract
The domestic savings-investment correlation is re-examined using data for some European countries inorder to obtain some information about the degree of capital mobility in the sense of the Feldstein andHorioka [Feldstein, M., & Horioka, C. Y. (1980). Domestic saving and international capital flows. EconomicJournal 90, 314–329]. Applying a Markov-switching model with heteroscedastic disturbances, we find thatthe correlation coefficients are unstable due to the policy regime changes consistent with the Lucas [Lucas,R. (1976). Econometric policy evaluation: A critique. In K. Brunner, & A. H. Meltzer (Eds.), The Phillipscurve and labor markets. Amsterdam: North-Holland] critique.© 2006 Society for Policy Modeling. Published by Elsevier Inc. All rights reserved.
JEL classification: F41; C11; C32
Keywords: Capital mobility; Feldstein–Horioka puzzle; Markov-switching model; Gibbs sampling
1. Introduction
The degree of international financial integration, defined as the extent to which financial marketsare connected, has increased substantially in both developed and developing countries during thelast three decades as a result of technological breakthroughs, financial liberalization, and growthin the volume of trade (Obstfeld, 1998). These developments have made the idea of free capitalmobility to be a reality in Europe since the late 1980s. However, when one measures the degreeof capital mobility using the relationship between domestic savings and domestic investment, this
∗ Corresponding author.E-mail addresses: [email protected] (E. Telatar), [email protected] (F. Telatar),
[email protected] (N. Bolatoglu).
0161-8938/$ – see front matter © 2006 Society for Policy Modeling. Published by Elsevier Inc. All rights reserved.doi:10.1016/j.jpolmod.2006.12.001
524 E. Telatar et al. / Journal of Policy Modeling 29 (2007) 523–533
reality becomes blurred. Empirical literature on the effect of liberalization of capital movementson the relationship between domestic savings and investment has been subject to considerabledebate.
In the literature of open-economy macroeconomics, defining and measuring capital mobilityhas been one of the most important issues. The traditional approach to testing the capital mobilityhypothesis was proposed by the seminal paper of Feldstein and Horioka (1980).1 Feldstein andHorioka proposed to use the savings-investment retention coefficient, later called the F–H coeffi-cient, revealing the extent to which an increase in domestic savings finances domestic investment,as an indicator of capital mobility.
Feldstein and Horioka (1980), Feldstein (1983) and Feldstein and Bacchetta (1989) interpretthe positive correlation coefficient as an evidence of a low degree of the long-term internationalcapital mobility. A high correlation coefficient means that investments have been financed mainlyby domestic savings. On the contrary, if capital mobility is high the correlation coefficient shouldbe low since investments might be financed by savings from abroad. The reason behind this isthat capital moves from the countries where it is less efficient to those where it is more efficient(Hogendorn, 1998: 142). As the degree of mobility increases, higher portion of domestic savingswould be invested elsewhere in the world. When national savings and investment rates are equalto each other, the current account balance will be close to zero. This means that investmentsmade by domestic residents are matched by their own savings. Feldstein and Horioka conductedan empirical test to measure the degree of capital mobility among 16 OECD countries overthe period of 1960–1976. Their estimation of the saving-retention coefficient is close to unityindicating that just 5–15% of national savings was invested abroad. Their finding implies thatcapital mobility had been low during the sample period. This result, henceforth the F–H, wassurprising because it is in contrast with the observations that capital mobility had been very highamong the OECD countries during the analyzed period which has witnessed major transformationstowards international capital market liberalization.
The F–H result has become a puzzle due to its apparent contradiction with reality. The F–Hpuzzle had led to an extensive debate in the literature on international capital mobility and sub-sequent research has been devoted to explain it. Importance of solving the puzzle comes mainlyfrom the fact that the performance of the economic policies to promote domestic savings dependson the degree of correlation between savings and investment. If the correlation is strong, policiesaimed at promoting domestic savings will ultimately increase domestic investment. Otherwise,such policies may or may not affect the level of domestic investment since they might increasethe flow of capital to international markets.
Attempts aimed at solving the F–H puzzle can be classified into two broad strands of theliterature. The first strand of the literature relates to the theoretical implications of the F–Hcoefficient. Within this strand, several studies, in contrast to Feldstein and Horioka (1980), interpretthe high F–H coefficient as evidence of high international capital mobility.2 A number of studies
1 The degree of capital mobility is also measured by interest rate differential. See, for example, Chinn and Frankel(1994), Marston (1995), and Obstfeld and Taylor (1998).
2 For example, according to Murphy’s (1984) “country size argument”, responses of the world interest rates to changesin savings of any country depend on how large this country is. If a fall in savings is happened in a large country, the worldinterest rates will rise and depress investments in all countries. This will be resulted in having positive correlations betweensavings and investment. Baxter and Crucini (1993) also point out that the country size should be taken into account in theestimation procedure since larger countries whose financial system is highly developed in international terms tend to havehigher correlations than small countries because of their capacities to influence interest rates in the world capital markets.
E. Telatar et al. / Journal of Policy Modeling 29 (2007) 523–533 525
(Gundlach & Sinn, 1992; Jansen, 1996; Coakley, Kulasi, & Smith, 1996; Moreno, 1997; Sachsida& Caetano, 2000; Coiteux & Olivier, 2000) argue that the F–H puzzle should be interpreted asa direct reflection of the fact that savings and investment are cointegrated in time dimension,irrespective of the degree of capital mobility.3 Consistent with this interpretation, Tobin (1983),Summers (1988) and Bayoumi (1990) suggest that a high correlation coefficient is due to thecurrent account targeting followed by the governments who try to offset the changes in privatesavings by variations in public savings. In this case, it is reasonable to find a strong positivecorrelation because of the endogenous “government reaction function” indicating that monetaryand fiscal policies are used to stabilize the external position of the country.
The second strand of the literature relates to econometric modeling issues as the explanation ofthe F–H coefficient. Feldstein and Horioka’s (1980) original work was performed by using cross-sectional and time-averaged data with the goal of eliminating the procyclical nature of savingsand investment. Several subsequent studies based on cross-sectional data have provided evidenceto confirm the original F–H result.4 Cross-sectional regressions in the context of the F–H analysishave been criticized in several ways. The first argument is that the sample period in Feldsteinand Horioka (1980) was not long enough to capture increases in capital mobility in the secondhalf of the 1970s.5 The second argument is that the nature of shocks and structure of economymight differ across countries. In this case, it will be unreasonable to expect to find the samerelationship between savings and investment for all countries in the sample. The third argumentis that outliers in the sample may cause significant bias in parameter estimates in cross-sectionregressions.6 The fourth argument is focused on the importance of taking into account of short-rundynamics of the relationship between savings and investment. As Sinn (1992) and Krol (1996)pointed out, the use of time-averaged data in cross-sectional regressions biases the results againstcapital mobility.7 In the same line of thought, Obstfeld (1994) and Ho (2002) indicate that whenthe sample period is long enough, using time-averaged data in cross-sectional regressions maylead to misleading conclusions about real magnitude of the saving-retention coefficient. Someresearchers propose as an alternative to use time series analysis to cope with these deficienciesof the cross-sectional approach. Time series approach allows us to examine the F–H coefficientfor individual countries by avoiding the heterogeneity problem among countries. However, in thetime-series specifications, the estimated parameters of the model might be spurious due to thepossible presence of simultaneous equation bias in the savings and investment regressions (see,for example, Feldstein & Horioka, 1980; Obstfeld, 1986; Dooley, Frankel, & Mathieson, 1987).
In this paper, we presume that a key feature of the F–H argument is that the correlationbetween domestic savings and investment may not be invariant to the policy regime changes, as inHo (2000) and Ozmen and Parmaksiz (2003a,b), and attempt to re-examine the F–H puzzle usingtime series data. In other words, we argue that the F–H argument ignores the fact that internationalcapital mobility is essentially a time-varying phenomenon and cannot be represented by one fixed
3 In the studies using intertemporal general equilibrium models of open economy based upon the assumption of perfectcapital mobility, the long-run correlation is treated as the manifestation of the solvency constraint. In other words, thecorrelation coefficient should not be used to test the degree of capital mobility since it rather indicates the “solvencyconstraint” implied by the fact that a nation’s balance of payments must be stationary.
4 See, Coakley et al. (1996) for an excellent survey.5 It is with this belief that analyses in Feldstein and Bacchetta (1989) and Frankel (1991) are undertaken. They extended
the analyzed period and found that correlation between savings and investment tended to weaken, but still remained high.6 Obstfeld (1993) and Coiteux and Olivier (2000) argue that Luxembourg is a good example of extreme outlier in the
context of F–H regression.7 See, for example, Jansen (1998, 2000), Bayoumi (1990), Tesar (1991), Coiteux and Olivier (2000).
526 E. Telatar et al. / Journal of Policy Modeling 29 (2007) 523–533
coefficient. The theoretical roots of this argument can be found in the Lucas critique stating that theparameter estimates in any structural macroeconomic model should shift as policy regime changesthrough their effects on the expectations of private economic agents. The creation of the EuropeanMonetary Union (EMU) is a good example to test validity of the Lucas critique in the F–H context.In line with Ho (2000), our hypothesis is that drawing samples from a finite mixture of distributionsverifies the appropriateness of using a two-state first-order Markov switching savings-investmentmodel to analyze the international capital mobility for some European countries. Our study differs,however, from Ho (2000) in two ways: we allow not only the samples but also the variances tobe drawn from two different regimes (high or low mobility) in our model, and we estimate themodel by incorporating a Bayesian Gibbs sampling.
The rest of the paper is organized as follows. In Section 2 we present briefly our methodologicalapproach. Section 3 describes the data set. In Section 4, we report the empirical results. Section5 provides some policy implications.
2. The Markov-switching model with heteroscedastic disturbances
Ho (2000) presented a Markov-switching model to examine the regime-switching behavior ofthe F–H coefficients. In his model, the parameters were allowed to change in different regimes.However, he ignored the fact that policy-regime changes may also cause shifts in the conditionalvariance of the F–H regression. In this paper, we present a similar model but incorporate regimeshifts in both the parameters and variance structure of the F–H regression.
Our model of F–H regression to examine the regime-switching behavior of the F–H coefficientsis as follows:(
I
Y
)t
= αst + βst
(S
Y
)t
+ εst (1)
st = 0 or 1 and εst ∼ N(0, σ2st
) (2)
αst = α0(1 − st) + α1st (3)
βst = β0(1 − st) + β1st, β0 < β1 (4)
σ2st
= σ20 (1 − st) + σ2
1st (5)
Pr[st = 0|st−1 = 0] = p Pr[st = 1|st−1 = 0] = 1 − p
Pr[st = 1|st−1 = 1] = q Pr[st = 0|st−1 = 1] = 1 − q(6)
where I, S, and Y are investment, savings and GDP, respectively. The parameters, αst , βst , σ2st
,of the model are a function of unobserved regimes st which follow a two-state ergodic discretefirst-order Markov process with transition probabilities p and q.8 We assume that st can taketwo values; st = 1 represents high degree of correlation between savings and investment, i.e. lowcapital mobility, and st = 0 corresponds to the low degree of correlation, i.e. high capital mobility.Since we assume a two-state Markov process, each regime needs to correspond to at least onetime point. Our capital mobility regimes are drawn from a mixture of two densities, each of whichcorresponds to a single state. An underlying two-state Markov process determines the singledensity coming from the unobserved state at a given time.
8 See, for example, Hamilton (1988).
E. Telatar et al. / Journal of Policy Modeling 29 (2007) 523–533 527
This Markov-switching model has the advantage that it allows for shifts in both the param-eters and the variances of the F–H model and does not make a smooth transition from onestate to another possible. This is the characteristic which is consistent with the Lucas’ (1976)critique of econometric policy evaluation arguing that macroeconomic parameter estimatesare not invariant to changes in the policy regimes since economic agents alter their expec-tations accordingly. In this case, it will be useless for forecasting the impact of the regimechanges based on the estimates obtained from linear models. Time varying parameter modelshave been developed to take into account the Lucas critique. In these models, coefficients canchange over time allowing parameter estimates to respond differently under alternative policyregimes.
In our model, the parameters, α0, α1, β0, β1, σ20 , σ2
1 , unobserved states, st = {0, 1}, and transitionprobabilities, p and q, need to be estimated for t = 1, 2, . . ., T, where T is the number of observations.Following joint posterior density is decomposed by using Bayes’ theorem:
g(sT , α0, α1, β0, β1, σ0, σ1, p, q|yT )
g(α0, α1, β0, β1, σ0, σ1, p, q|yT , sT )g(sT |yT )
g(α0, α1, β0, β1, σ0, σ1|yT , sT ), g(p, q|yT , sT )g(sT |yT )
where y represents the data set and yT = [y1y2· · ·yT ]′ and sT = [s1s2· · ·sT ]′.Given initial values of the parameters, estimation is performed via Gibbs sampling which is an
iterative estimation method based on Monte-Carlo technique that simulates the parameters as wellas unobserved states from the joint conditional distribution. We perform Gibbs sampling algorithmas in Kim and Nelson (1998). First sT is generated by using multi-move Gibbs sampling methoddeveloped by Carter and Kohn (1994). Then the transition probabilities p and q are generatedconditional on sT . In the last step, α0, α1, β0, β1, σ2
0 , σ21 are generated. This operation is performed
a total of 10,000 times, first 4000 of which are discarded, and the remaining 6000 are used forstatistical inference.
3. Data
All data for this study are taken from the OECD National Accounts. We follow Krol’s (1996)methodology of the use of annual data to avoid the problem of having biased results against capitalmobility. Our period of analysis is 1970 to 2002. It includes the late 1970s and 1980s during whichdeveloped countries have been better able to finance their investments from external sources. Itis also a time period during which balance of payments considerations are less likely to affectmacroeconomic policies due to the system of flexible exchange rates. We use gross fixed capitalformation as a measure of investment. Savings is defined as gross domestic product minus thesum of the private and government consumption.
We perform our analysis for some European countries, namely Belgium, Denmark, Finland,France, Germany, Italy, Netherlands, Norway, Sweden, and the UK. Driving force behind oursample selection is the argument that financial flows between the EU countries should be greaterthan among OECD countries due to informational and institutional links.9 Distinguishing featureof the countries included in our sample are their being members of the EEC.
9 See, for example, Feldstein and Bacchetta (1991) and Bayoumi, Sarno, and Taylor (1996).
528 E. Telatar et al. / Journal of Policy Modeling 29 (2007) 523–533
4. Empirical results
Table 2 presents the mean and standard deviation of each variable. The estimated coefficientsβi (i = 0, 1) denote the correlation coefficients of the mean in the high and in the low capitalmobility regimes, respectively. The estimated transition probabilities have special importance inour model as they show how international capital mobility change between the two regimes.For example, when the current savings-investment relationship is in the high capital mobil-ity regime, the chance for the next savings-investment relationship to stay in the same regimeis p.
The estimated coefficients of the mean in the high capital mobility regimes (β0) shown inTable 2 are significantly different from zero for Belgium, Finland and Sweden. They are foundto be statistically insignificant for Denmark, France, Germany, Italy, the Netherlands and theUK. Having found β0 > 0 for Belgium, Finland and Sweden indicates that high but not perfectcapital mobility is the case for these countries. The transition probabilities (p and q) indicate thatin both regimes the degree of persistence is high, especially in the low capital mobility regime,in each country. The degree of persistence is the lowest in the low capital mobility regime forGermany and the Netherlands implying that probability of switching from the low to the highcapital mobility regime is high for these countries.
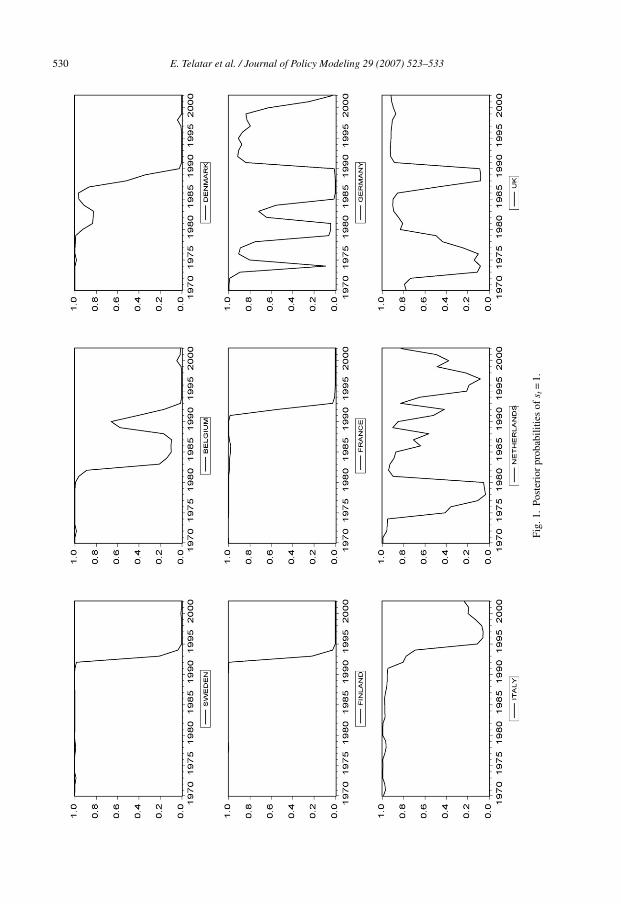
Fig. 1 depicts the posterior probabilities of the regime st = 1 in which it is observed high F–Hcoefficients. The results in Fig. 1 indicate strong evidence for time-varying parameter betweensavings and investment. It is seen that there is a shift in the F–H coefficients from high to lowvalues meaning that there has been a regime switching from the low capital mobility to the highcapital mobility for Sweden, Belgium, Denmark, Finland, France, and Italy. This suggests thatnational savings had ceased to be a constraint on national investment during the 1990s for thesecountries.
For Germany, the UK and the Netherlands we found that there has been no single switchingpoint in the relationship between national savings and national investment. In Germany, nationalsavings seems to become a constraint in some periods, such as during the 1970s, the first halfof the 1980s, and the 1990s. For the Netherlands, there have been clear switching points fromthe low capital mobility to the high capital mobility in the second half of the 1970s and thesecond half of the 1990s. The F–H coefficient has become high in the UK during the first half ofthe 1980s and after the 1990s implying that national savings have been a constraint on nationalinvestment.
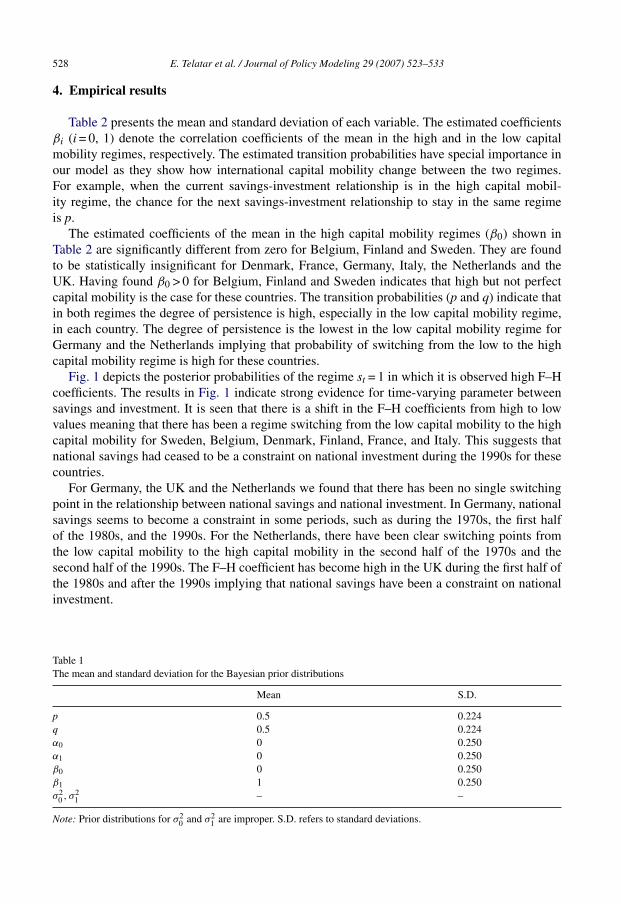
Table 1The mean and standard deviation for the Bayesian prior distributions
Mean S.D.
p 0.5 0.224q 0.5 0.224α0 0 0.250α1 0 0.250β0 0 0.250β1 1 0.250σ2
0 , σ21 – –
Note: Prior distributions for σ20 and σ2
1 are improper. S.D. refers to standard deviations.

E.Telatar
etal./JournalofPolicyM
odeling29
(2007)523–533
529
Table 2The mean and standard deviations for Bayesian posterior distributionsParameters Countries
Belgium Denmark Finland France Germany Italy Netherlands Sweden UK
Mean S.D. Mean S.D. Mean S.D. Mean S.D. Mean S.D. Mean S.D. Mean S.D. Mean S.D. Mean S.D.
p 0.860 0.088 0.868 0.083 0.843 0.098 0.848 0.095 0.694 0.124 0.776 0.142 0.659 0.163 0.841 0.101 0.692 0.139q 0.807 0.092 0.845 0.086 0.890 0.058 0.885 0.062 0.709 0.116 0.884 0.068 0.732 0.133 0.889 0.060 0.813 0.100α0 0.124 0.028 0.136 0.041 0.100 0.012 0.127 0.037 0.174 0.046 0.247 0.061 0.259 0.047 0.118 0.020 0.178 0.043α1 0.111 0.028 0.064 0.020 0.046 0.028 0.017 0.019 −0.022 0.013 0.032 0.033 −0.037 0.038 0.104 0.015 0.078 0.020β0 0.321 0.113 0.296 0.192 0.371 0.049 0.319 0.178 0.226 0.199 −0.248 0.303 −0.152 0.184 0.254 0.096 0.153 0.211β1 0.525 0.104 0.833 0.096 0.912 0.110 1.020 0.086 1.134 0.054 0.886 0.138 1.021 0.144 0.505 0.066 0.586 0.131σ2
0 6.8 × 10⁻⁵ 4.5 × 10⁻⁵ 2.1 × 10⁻⁴ 1.1 × 10⁻⁴ 2.5 × 10⁻⁵ 2.0 × 10⁻⁵ 9.2 × 10⁻⁵ 7.0 × 10⁻⁵ 4.6 × 10⁻⁴ 2.5 × 10⁻⁴ 2.6 × 10⁻⁵ 4.6 × 10⁻⁵ 5.3 × 10⁻⁵ 7.6 × 10⁻⁵ 3.9 × 10⁻⁵ 2.9 × 10⁻⁵ 2.5 × 10⁻⁴ 2.1 × 10⁻⁴
σ21 2.1 × 10⁻⁴ 1.3 × 10⁻⁴ 1.7 × 10⁻⁴ 7.0 × 10⁻⁵ 4.8 × 10⁻⁴ 1.6 × 10⁻⁴ 9.6 × 10⁻⁵ 3.4 × 10⁻⁵ 2.8 × 10⁻⁵ 4.5 × 10⁻⁵ 2.7 × 10⁻⁴ 9.3 × 10⁻⁵ 2.7 × 10⁻⁴ 3.2 × 10⁻³ 2.1 × 10⁻⁴ 7.3 × 10⁻⁵ 7.5 × 10⁻⁵ 1.1 × 10⁻⁴
Note: Priors for the parameters are given in Table 1.
530 E. Telatar et al. / Journal of Policy Modeling 29 (2007) 523–533
Fig.
1.Po
ster
ior
prob
abili
ties
ofs t
=1.
E. Telatar et al. / Journal of Policy Modeling 29 (2007) 523–533 531
5. Concluding remarks and policy implications
This paper examines empirically the relationship between savings and investment for someEuropean countries over the period of 1970–2002. We restricted our sample to some of the membercountries of the EU. Following Ho’s (2000) strategy, we use a Markov-switching model allowingdata to be drawn from two different states – high capital mobility and low capital mobility – andextend it to allow variances to change among different regimes.
We found that capital mobility could be measured by using saving retention coefficient ofFeldstein and Horioka (1980) when regime-switching properties of data are taken into account.According to our results, the countries studied may be divided into two groups. The first, consistingof Belgium, Denmark, Finland, France, Italy and Sweden, is characterized by a transition periodfrom low capital mobility to high capital mobility following the creation of the EMU with theTreaty of European Union in the year 1994. This finding justifies the theoretical expectationthat the saving retention coefficient should have declined after establishment of the EMU sincecapital markets are expected to become progressively more integrated. Therefore, a low correlationbetween savings and investment can be interpreted as a good indicator of capital market integration.In this respect, it is reasonable to conclude that the level of domestic savings has ceased to bea constraint on domestic investment for these countries after the EMU. The main reason behindthis is the fact that joining EMU entailed lifting the capital controls.
The second group, made up of Germany, the UK and the Netherlands, includes economiesfor which we found no single switching point in the regime of capital mobility measuring thedegree of correlation between national savings and national investment. This finding suggests thatthe extent to which national saving is a constraint on national investment has changed over timefor these countries depending on changes in the determinants of national savings and nationalinvestment. This is left as an interesting topic for future research.
The results of the paper show that the Lucas critique should be taken into account in the stud-ies on the F–H puzzle over the countries which experienced major policy changes during thesample period since private economic agents’ expectations are played major role in determiningthe national savings and investment of any country. The main policy implication of our paper isthat the success of any economic policy aimed at promoting domestic savings in order to improveeconomic growth through increases in domestic investment depends mainly on the value of saving-retention coefficient. Since the estimated value of the savings-retention coefficient changes notonly among countries but also through time, any common policy without considering the pres-ence of heterogeneity among the EMU countries may not create homogenous outcomes over theindividual countries. Our results may provide insightful information to be used by policymakerstrying to equalize the income distribution among nations.
Acknowledgements
This paper has benefited from the constructive comments of anonymous referees and the editorof the journal.
References
Baxter, M., & Crucini, M. J. (1993). Explaining savings-investment correlations. American Economic Review, 83, 416–436.Bayoumi, T. (1990). Saving-investment correlations: Immobile capital, government policy, or endogenous behavior? IMF
Staff Papers, 37, 360–387.
532 E. Telatar et al. / Journal of Policy Modeling 29 (2007) 523–533
Bayoumi, T., Sarno, L., & Taylor, M. P. (1996). Saving-investment correlations, European capital flows and regional risk.Discussion Paper, Department of Economics and Accounting. Liverpool: University of Liverpool.
Carter, C. K., & Kohn, R. (1994). On Gibbs sampling for state space models. Biometrika, 81, 541–553.Chinn, M. D., & Frankel, F. A. (1994). Financial links around the Pacific Rim: 1982–1992. In R. Glick & M. Hutchison
(Eds.), Exchange rate policy and interdependence perspectives from the Pacific Basin (pp. 17–47). Cambridge, UK:Cambridge University Press.
Coakley, J., Kulasi, F., & Smith, R. P. (1996). Current account solvency and the Feldstein-Horioka puzzle. EconomicJournal, 106, 620–627.
Coiteux, M., & Olivier, S. (2000). The saving retention coefficient in the long run and in the short run: Evidence frompanel data. Journal of International Money and Finance, 19, 535–548.
Dooley, M., Frankel, J., & Mathieson, D. (1987). International capital mobility: What do saving-investment correlationstell us? International Monetary Fund Staff Papers, 34, 503–530.
Feldstein, M. (1983). Domestic saving and international capital movements in the long run and the short run. EuropeanEconomic Review, 21, 129–151.
Feldstein, M., & Bacchetta, P. (1989). National savings and international investment. National Bureau of EconomicResearch. Working paper no. 3164.
Feldstein, M., & Horioka, C. Y. (1980). Domestic saving and international capital flows. Economic Journal, 90, 314–329.Frankel, J. A. (1991). Quantifying international capital mobility in the 1980s. In B. D. Bernheim & J. B. Shoven (Eds.),
National Saving and Economic Performance. Chicago: University of Chicago Press.Gundlach, E., & Sinn, S. (1992). Unit root tests of the current account balance: Implications for international capital
mobility. Applied Economics, 24, 617–625.Hamilton, J. D. (1988). Rational expectations econometric analysis of changes in regimes: An investigation of the term
structure of interest rates. Journal of Economic Dynamics and Control, 12, 385–432.Ho, T. (2000). Regime-switching investment-saving correlation and international capital mobility. Applied Economics
Letters, 7, 619–622.Ho, T. (2002). A panel cointegration approach to the investment-saving correlation. Emprirical Economics, 27, 91–100.Hogendorn, C. (1998). Capital mobility in historical perspective. Journal of Policy Modeling, 20(2), 141–161.Jansen, W. J. (1996). Estimating saving-investment correlations: Evidence for OECD countries based on an error correction
model. Journal of International Money and Finance, 15, 749–781.Jansen, W. J. (1998). Interpreting saving-investment correlations. Open Economies Review, 9, 205–218.Jansen, W. J. (2000). International capital mobility: Evidence from panel data. Journal of International Money and Finance,
19, 507–511.Kim, C., & Nelson, C. R. (1998). Testing for mean reversion in heteroskedastic data II: Autoregression tests based on
Gibbs-sampling-augmented randomization. Journal of Empirical Finance, 5(4), 385–396.Krol, R. (1996). International capital mobility: Evidence from panel data. Journal of International Money and Finance,
15, 467–474.Lucas, R. (1976). Econometric policy evaluation: A critique. In K. Brunner & A. H. Meltzer (Eds.), The Phillips curve
and labor markets. North-Holland: Amsterdam.Marston, R. C. (1995). International financial integration: A study of interest differentials between the major indus-
trial countries. Japan-US Center Sanwa Monographs on International Financial Markets. Cambridge: CambridgeUniversity Press.
Moreno, R. (1997). Saving-investment dynamics and capital mobility in the US and Japan. Journal of International Moneyand Finance, 16(6), 837–863.
Murphy, R. G. (1984). Capital mobility and the relationship between saving and investment rates. Journal of InternationalMoney and Finance, 3, 327–342.
Obstfeld, M. (1986). How integrated are world capital markets? Some new tests. NBER Working Paper No. 2075.Massachusetts: Cambridge.
Obstfeld, M. (1993). International capital mobility in the 1990s. NBER Working Paper No. 4534. Massachusetts: Cam-bridge.
Obstfeld, M. (1994, June). International capital mobility in the 1990s. International Finance Discussion Papers No. 472.Board of Governors of the Federal Reserve System. Washington, D.C.
Obstfeld, M. (1998). The global capital market: Benefactor or menace? Journal of Economic Perspectives, 12, 9–30.Obstfeld, M., & Taylor, A. (1998). The great depression as a watershed: International capital mobility over the long-run.
In M. D. Bordo, C. Goldin, & E. N. White (Eds.), The defining moment: The great depression and the Ameri-can economy in the twentieth century. NBER Project Report Series (pp. 353–402). Chicago: University of ChicagoPress.

E. Telatar et al. / Journal of Policy Modeling 29 (2007) 523–533 533
Ozmen, E., & Parmaksiz, K. (2003a). Policy regime change and the Feldstein-Horioka puzzle: The UK evidence. Journalof Policy Modeling, 25, 137–149.
Ozmen, E., & Parmaksiz, K. (2003b). Exchange rate regimes and the Feldstein-Horioka puzzle: The French evidence.Applied Economics, 35, 217–222.
Sachsida, A., & Caetano, M. A. (2000). The Feldstein-Horioka puzzle revisited. Economics Letters, 68, 85–88.Sinn, S. (1992). Saving-investment correlations and capital mobility: On the evidence from annual data. The Economic
Journal, 102, 1161–1170.Summers, L. H. (1988). Tax policy and international competitiveness. In J. Frankel (Ed.), International aspects of financial
policies. Chicago: University of Chicago Press.Tesar, L. (1991). Saving, investment, and international capital flows. Journal of International Economics, 31, 55–78.Tobin, J. (1983). Comments on domestic saving and international capital movements in the long run and the short run by
M. Feldstein. European Economic Review 21, 153–156.