a reconciliation of asymmetries in trade-in-goods ... · a reconciliation of asymmetries in trade...
TRANSCRIPT

A Reconciliation of Asymmetries in Trade-in-Goods Statistics Published by the UK and
Other European Union Member States
HMRC Trade Statistics
3rd Floor Unit Alexander House
21 Victoria Avenue Southend-on-Sea
SS99 1AA United Kingdom
www.uktradeinfo.com

EU Asymmetry Report 2014 data
2
Table of Contents
1 Introduction…………………………………………………………………………………. 3
2 Measures of asymmetries………………………………………………………………… 3
3 UK asymmetries with the EU in 2014……………………………………………………. 5
3.1 UK arrivals asymmetries by partner country…………………………………... 5
3.2 UK arrivals asymmetries by commodity………………………………………... 7
3.3 UK dispatches asymmetries by partner country……………………………... 10
3.4 UK dispatches asymmetries by commodity………………………………...... 11
4 Conclusions………………………………………………………………………………...14
5 Annexes……………………………………………………………………………………. 15
5.1 Annex 1: HS2 Chapter Descriptions…………………………………………... 15
5.2 Annex 2: Glossary………………………………………………………………. 19

EU Asymmetry Report 2014 data
3
1 Introduction
Asymmetries are the differences between the published trade statistics of partner countries. Due to each country collecting data on their own international trade-in-goods for both imports and exports, in theory the ‘mirror flow’ collected by the partner countries should match. In reality, it is often the case that the figures do not match and this is referred to as an ‘asymmetry’. For example, there may be a difference between what the United Kingdom (UK) records as arrivals1
from France, and France records as dispatches2 to the UK. This difference or asymmetry can be measured. For trade-in-goods between the European Union (EU) Member States, trade information is collected via the Intrastat3 survey
and is controlled by EU Statistical legislation which aims to harmonise the
classifications and collection. However, there remain legitimate reasons why asymmetries still exist. More information, including causes, can be found in the overview of asymmetries paper published on UKTradeInfo. The Trade Statistics unit, in HM Revenue & Customs (HMRC), carries out regular analyses of the asymmetries between the UK and the EU, and occasional analyses of the differences with other major trading partners. This information is used as part of the quality assurance work on the trade data and to investigate discrepancies. This paper is an asymmetry study covering trade in goods between the UK and the EU for the
calendar year 2014. The data used in the compilation of this report has been extracted from the
Comext database.
2 Measures of Asymmetries
There are two types of asymmetries for EU trade that are referred to in this report: the arrivals asymmetry and the dispatches asymmetry. The arrivals asymmetry is the difference between the declarant country’s arrivals from the partner country and the partner country’s dispatches to the declarant country. If this asymmetry is positive it means that the declarant country’s arrivals from the partner country are greater than the partner country’s dispatches to the declarant country. The dispatches asymmetry is the difference between the declarant country’s dispatches to the partner country and the partner country’s arrivals from the declarant country. If this asymmetry is positive it means that the declarant country’s dispatches to the partner country are greater than the partner country’s arrivals from the declarant country. As an example, the UK’s arrivals asymmetry with Germany is the comparison between what the UK records as arrivals from Germany and what Germany records as dispatches to the UK. If the value of UK arrivals minus German dispatches is negative, it suggests that the UK is recording less goods as received from Germany than Germany is recording as sent to the UK.
1 The term used to describe goods imported by an EU Member State from another EU member state. 2 The term used to describe goods exported by an EU Member State to another EU member state. 3 Intrastat was introduced in 1993 to replace customs declarations for trade between EU member states following the introduction of the single market.

EU Asymmetry Report 2014 data
4
If we use D to represent the declarant country and P to represent the partner country, we can set out the main indicators used by Eurostat4 to calculate asymmetry. Note that for the purposes of this report the UK will always be the declarant. Indicators of Asymmetry
(1) Absolute Asymmetry:
= | Value (D) – Value (P) |
This is the absolute difference between the value of a flow and its mirror value.
(2) Relative Asymmetry (%):
= Value (D) – Value (P) X 100
0.5 (Value (D) + Value (P))
The relative asymmetry looks at the difference between the value reported by the declarant country
and the value reported by the partner country with respect to the mean of those two flows. This
method makes no assumption about which value (D or P) is the correct value and instead looks at
the asymmetry with respect to the mean of the two values.
(3) Share of Total Absolute Asymmetry (%):
= | Value (D) – Value (P) | X 100
∑ | Value (D) – Value (P) |
This percentage dictates the contribution a country or chapter is having on the absolute total of the
asymmetries within a certain flow, e.g. Chapter 45 may be responsible for 10 per cent of the total
UK arrivals asymmetry.
Note: The values used within the tables in this report are quoted in Euros. UK declarations are made in pounds sterling and converted to Euros by Eurostat. The data that Eurostat receives from each Member State is compiled in the local currency and is then converted to Euros using a monthly exchange rate.
4 Eurostat is the statistical office of the European Union situated in Luxembourg.
EU Asymmetry Report 2014 data
5
Unallocated trade: Whilst the vast majority of trade declared between EU Member States provides detail at value, product and country levels, there is provision for member states to apply suppressions. This means that full details may be provided to Eurostat, but only to be published at a less detailed level. For trade reported by the declarant (UK arrivals and dispatches), there is some trade ‘not allocated’ to a country. For example ‘countries & territories not specified in the framework of Intra-Community trade’ and ‘countries & territories not specified for commercial or military reasons in the framework of Intra-Community trade’ are identified as ‘unallocated’. For trade reported by our EU partners (arrivals and dispatches), the chapter total does not add up to the country total and is therefore referred to as unallocated.
3 UK Asymmetries with the EU, 2014
3.1 UK arrivals asymmetries by partner country
Table 3.1 shows that the largest asymmetry in arrivals is with Germany, with a €5.4 billion negative
asymmetry. This accounted for a 21% share of the total absolute asymmetry. Further investigation
shows that the total absolute asymmetry with Germany at chapter level is €7.8 billion, of which
Chapter 88 (Aircraft, spacecraft and parts thereof) accounted for 12% of this asymmetry.
The largest relative asymmetry is with Malta at 46% and this has a value of €59.3 million. Further
investigation has revealed that the total absolute asymmetry with Malta at chapter level is €119.4
million of which Chapter 30 (Pharmaceutical Products) accounted for 47% of this asymmetry.
The total asymmetry for 2014 has decreased from -€20.2 billion in 2013 to -€15.4 billion, a drop of
€4.8 billion or 24%.
Similar to 2013, there is significant positive asymmetry for trade ‘not allocated’ to a country. The
total EU dispatches to the UK corresponds to the sum of the dispatch figures of each individual
country, but on the arrivals side there remains £3.5 billion of trade unallocated. This means that
some goods entering the UK are not allocated a partner country. As described previously this is due
to certain trade with countries being suppressed for reasons of confidentiality whilst the total trade is
the total calculated by Eurostat including the confidential trade for partner countries.
EU Asymmetry Report 2014 data
6
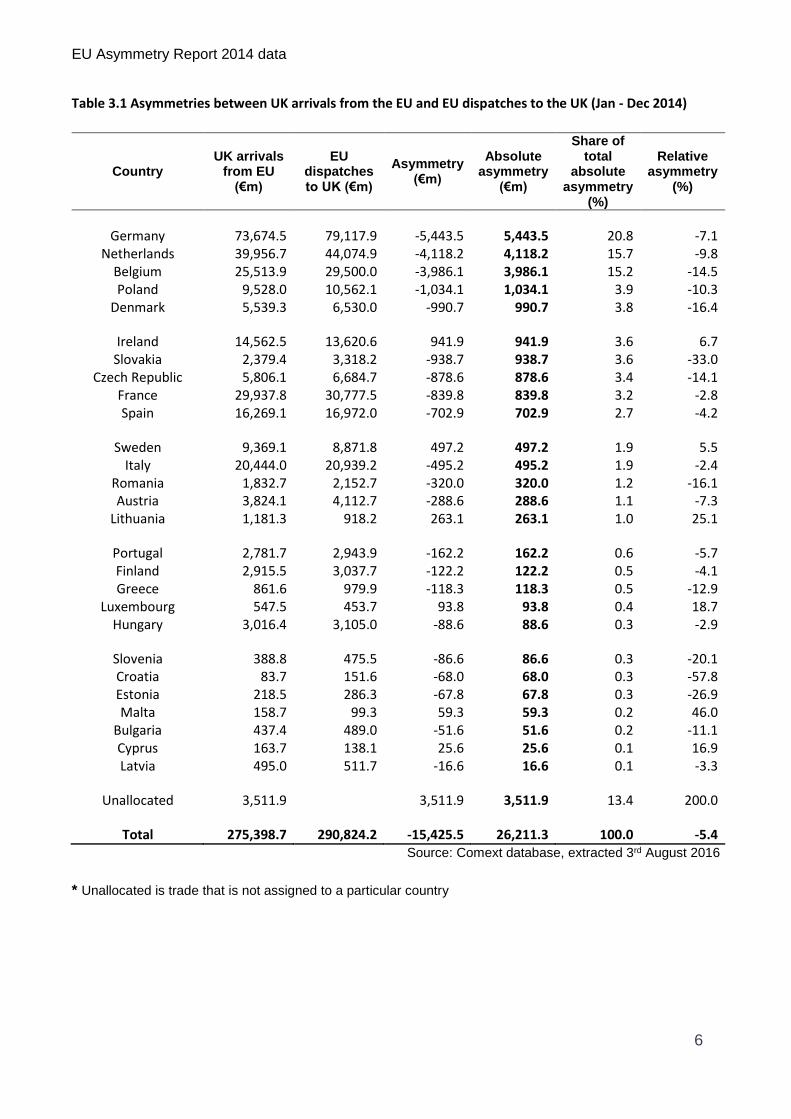
Table 3.1 Asymmetries between UK arrivals from the EU and EU dispatches to the UK (Jan - Dec 2014)
Country UK arrivals
from EU (€m)
EU dispatches to UK (€m)
Asymmetry (€m)
Absolute asymmetry
(€m)
Share of total
absolute asymmetry
(%)
Relative asymmetry
(%)
Germany 73,674.5 79,117.9 -5,443.5 5,443.5 20.8 -7.1 Netherlands 39,956.7 44,074.9 -4,118.2 4,118.2 15.7 -9.8
Belgium 25,513.9 29,500.0 -3,986.1 3,986.1 15.2 -14.5 Poland 9,528.0 10,562.1 -1,034.1 1,034.1 3.9 -10.3
Denmark 5,539.3 6,530.0 -990.7 990.7 3.8 -16.4
Ireland 14,562.5 13,620.6 941.9 941.9 3.6 6.7 Slovakia 2,379.4 3,318.2 -938.7 938.7 3.6 -33.0
Czech Republic 5,806.1 6,684.7 -878.6 878.6 3.4 -14.1 France 29,937.8 30,777.5 -839.8 839.8 3.2 -2.8 Spain 16,269.1 16,972.0 -702.9 702.9 2.7 -4.2
Sweden 9,369.1 8,871.8 497.2 497.2 1.9 5.5 Italy 20,444.0 20,939.2 -495.2 495.2 1.9 -2.4
Romania 1,832.7 2,152.7 -320.0 320.0 1.2 -16.1 Austria 3,824.1 4,112.7 -288.6 288.6 1.1 -7.3
Lithuania 1,181.3 918.2 263.1 263.1 1.0 25.1
Portugal 2,781.7 2,943.9 -162.2 162.2 0.6 -5.7 Finland 2,915.5 3,037.7 -122.2 122.2 0.5 -4.1 Greece 861.6 979.9 -118.3 118.3 0.5 -12.9
Luxembourg 547.5 453.7 93.8 93.8 0.4 18.7 Hungary 3,016.4 3,105.0 -88.6 88.6 0.3 -2.9
Slovenia 388.8 475.5 -86.6 86.6 0.3 -20.1 Croatia 83.7 151.6 -68.0 68.0 0.3 -57.8 Estonia 218.5 286.3 -67.8 67.8 0.3 -26.9 Malta 158.7 99.3 59.3 59.3 0.2 46.0
Bulgaria 437.4 489.0 -51.6 51.6 0.2 -11.1 Cyprus 163.7 138.1 25.6 25.6 0.1 16.9 Latvia 495.0 511.7 -16.6 16.6 0.1 -3.3
Unallocated 3,511.9
3,511.9 3,511.9 13.4 200.0
Total 275,398.7 290,824.2 -15,425.5 26,211.3 100.0 -5.4 Source: Comext database, extracted 3rd August 2016
* Unallocated is trade that is not assigned to a particular country

EU Asymmetry Report 2014 data
7
3.2 UK arrivals asymmetries by commodity
Table 3.2 (a) shows the top ten chapters in order of their contribution to the total absolute
asymmetry. These chapters have the greatest difference in the value of arrivals reported by the UK
and the value of dispatches reported by the EU.
Similar to the years 2011 and 2012, the chapter showing the greatest asymmetry was Chapter 85
(Electrical machinery and equipment). This chapter shows a negative asymmetry of €2.2 billion,
which represents a 9% share of the total absolute asymmetry for all chapters. Further analysis
shows that the total absolute asymmetry by country for this chapter is €4.7 billion, with the
Netherlands accounting for 34% of this amount.
For 2014 the top ten chapters account for 43% of the total absolute asymmetry for all chapters.
Trade that is not allocated to a chapter is responsible for a negative asymmetry of €4.1 billion and
17% of the total absolute asymmetry.
Table 3.2 (a) Top ten chapters by share of total absolute asymmetry (Jan - Dec 2014)
Chapter UK arrivals
from EU (€m)
EU dispatches to
UK (€m)
Asymmetry (€m)
Absolute Asymmetry
(€m)
Share of total absolute
asymmetry (%)
85 24,014.1 26,194.2 -2,180.1 2,180.1 9.1 99 120.7 1,553.1 -1,432.4 1,432.4 6.0 84 33,032.0 34,431.7 -1,399.7 1,399.7 5.8 88 3,646.4 5,044.7 -1,398.3 1,398.3 5.8 29 6,179.4 5,350.2 829.2 829.2 3.4
73 4,116.2 4,924.9 -808.8 808.8 3.4 27 13,636.7 12,965.2 671.5 671.5 2.8 87 48,813.9 49,416.7 -602.9 602.9 2.5 90 7,835.7 8,377.4 -541.7 541.7 2.3 94 3,888.6 4,421.7 -533.1 533.1 2.2
Sum of top 10 145,283.7 152,679.9 -7,396.3 10,397.8 43.2 Sum of others 130,115.1 134,018.2 -3,903.1 9,541.0 39.6 Unallocated
4,126.1 -4,126.1 4,126.1 17.1
Total 275,398.7 290,824.2 -15,425.5 24,064.9 100.0 Source: Comext database, extracted 3rd August 2016
* Unallocated is trade that is not assigned to a particular chapter

EU Asymmetry Report 2014 data
8
Table 3.2 (b) shows the top ten chapters by positive relative asymmetry. Unlike the previous table which measures the largest asymmetries, this table focuses on the level of asymmetry with respect to the mean of the two flows. Chapter 93 (Arms and ammunition) shows the largest positive relative asymmetry of 89%. This effectively means that the asymmetry is greater than the mean of the two flows. Further analysis on this chapter is not appropriate as the majority of the positive asymmetry relates to unallocated trade.
Chapter 26 (Ores, slag and ash) is the next largest relative asymmetry in the table at 56%. Further analysis shows that the total absolute asymmetry by country for this chapter is €426 million, with Germany attributing to 59% or €249m of this amount.
Table 3.2 (b) Top ten chapters by positive relative asymmetry (Jan - Dec 2014)
Chapter UK arrivals from
EU (€m) EU dispatches to
UK (€m) Asymmetry (€m)
Relative Asymmetry (%)
93 358.0 137.4 220.7 89.1 26 648.4 364.3 284.1 56.1 47 401.3 294.6 106.7 30.7 10 802.3 594.6 207.8 29.7 25 496.3 392.5 103.8 23.4
17 1,005.8 811.3 194.6 21.4 15 1,137.4 920.2 217.2 21.1 36 70.6 58.8 11.8 18.3 24 404.8 341.9 62.9 16.9 96 1,220.0 1,040.0 179.9 15.9
Sum of top 10 6,545.0 4,955.6 1,589.5 27.6 Sum of others 268,853.7 281,742.6 -12,888.9 -4.7 Unallocated
4,126.1 -4,126.1 -200.0
Total 275,398,738 290,824,233 -15,425,496 -5.4 Source: Comext database, extracted 3rd August 2016
* Unallocated is trade that is not assigned to a particular chapter

EU Asymmetry Report 2014 data
9
Table 3.2 (c) shows the top ten chapters by negative relative asymmetry rather than positive relative
asymmetry.
The largest asymmetry here is Chapter 99 (Other Products) with the UK recording arrivals of €121
million against EU dispatches of €1.6 billion. Although this is a large asymmetry and features as the
second largest absolute asymmetry in Table 3.2 (a), this is to be expected due to the miscellaneous
nature of this chapter. Different Member States use Chapter 99 in different ways and in the absence
of harmonisation, asymmetries are to be expected. The countries contributing the most to this
asymmetry are Ireland (30%), Germany (30%) and Belgium (26%).
The second largest asymmetry was recorded in Chapter 89 (Ships, Boats) at negative €266.4
million. This is a notoriously tricky area due to the complex nature of ownership and the timing of
changes to ownership. EU legislation allows Member States to record specific movement of goods
using different methodologies, which invariably leads to asymmetries.
Table 3.2 (c) Top ten chapters by negative relative asymmetry (Jan - Dec 2014)
Chapter UK arrivals
from EU (€m) EU dispatches to
UK (€m) Asymmetry (€m)
Relative Asymmetry (%)
99 120.7 1,553.1 -1,432.4 -171.2 89 175.2 441.5 -266.4 -86.4 14 4.5 7.1 -2.7 -45.7 03 631.6 997.7 -366.1 -44.9 80 32.8 50.7 -18.0 -43.0
46 6.2 8.8 -2.7 -35.7 43 52.7 73.7 -20.9 -33.2 66 11.3 15.8 -4.5 -33.1 88 3,646.4 5,044.7 -1,398.3 -32.2 63 368.8 478.6 -109.8 -25.9
Sum of top 10 5,050.1 8,671.8 -3,621.8 -52.8 Sum of others 270,348.7 278,026.3 -7,677.6 -2.8 Unallocated
4,126.1 -4,126.1 -200.0
Total 275,398.7 290,824.2 -15,425.5 -5.4 Source: Comext database, extracted 3rd August 2016
* Unallocated is trade that is not assigned to a particular chapter
3.3 UK dispatches asymmetries by partner country Table 3.3 shows that the largest asymmetry in dispatches is also with Germany, with a €2.4 billion
absolute asymmetry. This accounted for a 15% share of the total absolute asymmetry. The largest
absolute asymmetries outside of Germany are with Ireland and France, which account for 9% and
7% of the total absolute asymmetry respectively.

EU Asymmetry Report 2014 data
10
The largest relative asymmetries were with Lithuania (99%), Cyprus (37%) and Slovakia (30%) of
which the largest actual difference of €723.9 was also with Lithuania. Further analysis at a chapter
level revealed that Chapter 85 (Electrical machinery and equipment) accounted for 50% of the total
absolute asymmetry with Lithuania
Table 3.3 Asymmetries between UK dispatches to EU and EU arrivals from the UK (Jan - Dec 2014)
Country UK
dispatches to EU (€m)
EU arrivals from UK
(€m)
Asymmetry (€m)
Absolute asymmetry
(€m)
Share of total
absolute asymmetry
(%)
Relative asymmetry
(%)
Germany 37,419.6 39,847.0 -2,427.4 2,427.4 14.9 -6.3 Ireland 22,038.0 20,637.7 1,400.2 1,400.2 8.6 6.6 France 22,812.2 21,670.9 1,141.3 1,141.3 7.0 5.1 Spain 10,890.1 11,888.3 -998.3 998.3 6.1 -8.8
Belgium 15,647.2 16,640.8 -993.6 993.6 6.1 -6.2
Netherlands 27,623.0 26,695.9 927.0 927.0 5.7 3.4 Sweden 6,743.0 7,543.1 -800.1 800.1 4.9 -11.2
Lithuania 367.8 1,091.8 -723.9 723.9 4.4 -99.2 Italy 10,721.0 10,282.4 438.6 438.6 2.7 4.2
Czech Republic 2,534.2 2,940.1 -405.9 405.9 2.5 -14.8
Austria 2,005.5 2,358.0 -352.5 352.5 2.2 -16.2 Slovakia 572.5 770.6 -198.1 198.1 1.2 -29.5 Poland 4,732.7 4,555.9 176.8 176.8 1.1 3.8
Portugal 1,646.4 1,817.9 -171.6 171.6 1.1 -9.9 Romania 1,160.8 1,331.9 -171.1 171.1 1.0 -13.7
Cyprus 543.9 373.6 170.3 170.3 1.0 37.1 Finland 1,982.1 1,820.5 161.6 161.6 1.0 8.5 Hungary 1,496.1 1,376.5 119.6 119.6 0.7 8.3
Malta 504.8 390.2 114.6 114.6 0.7 25.6 Denmark 3,433.7 3,544.5 -110.8 110.8 0.7 -3.2
Bulgaria 548.6 444.2 104.4 104.4 0.6 21.0 Estonia 332.7 434.2 -101.4 101.4 0.6 -26.5 Latvia 414.9 330.7 84.3 84.3 0.5 22.6
Croatia 175.8 218.3 -42.5 42.5 0.3 -21.6 Greece 1,221.8 1,250.5 -28.7 28.7 0.2 -2.3
Luxembourg 264.0 255.6 8.4 8.4 0.1 3.2 Slovenia 301.0 306.9 -5.9 5.9 0.0 -1.9
Unallocated 3,925.9
3,925.9 3,925.9 24.1 200.0
Total 182,059.0 180,817.8 1,241.2 16,304.7 100.0 0.7 Source: Comext database, extracted 3rd August 2016
* Unallocated is trade that is not assigned to a particular chapter

EU Asymmetry Report 2014 data
11
3.4 UK dispatches asymmetries by commodity
Table 3.4 (a) shows the top ten chapters in order of their contribution to the total absolute
asymmetry. These chapters have the greatest difference in the value of dispatches reported by the
UK to the value of arrivals reported by the EU.
The chapter showing the greatest asymmetry was Chapter 27 (Mineral fuels, mineral oils). This
chapter shows a positive asymmetry of €3.0 billion, which represents a 14% share of the total
absolute asymmetry for chapters. The next greatest asymmetry relates to chapter 30
(Pharmaceutical Products), with a positive asymmetry of €2.1 billion and a 10% share of the total
absolute asymmetry.
Further analysis of Chapter 27 reveals that the total absolute asymmetry by country is €6.5 billion.
The Netherlands accounts for 41% of this asymmetry, with France the next highest accounting for
19%.
For 2014 the top ten chapters account for 52% of the total absolute asymmetry for chapters. Trade
that is not allocated to a chapter is responsible for a negative asymmetry of €3.5 billion and
accounts for 17% of the total absolute asymmetry.
Table 3.4 (a) Top ten chapters by share of total absolute asymmetry (Jan - Dec 2014)
Chapter UK dispatches
to EU (€m) EU arrivals
from UK (€m) Asymmetry
(€m)
Absolute asymmetry
(€m)
Share of total absolute
asymmetry (%)
27 32,509.5 29,513.7 2,995.8 2,995.8 14.4 30 13,370.5 11,309.2 2,061.3 2,061.3 9.9 85 12,727.4 13,866.4 -1,139.0 1,139.0 5.5 99 358.4 1,387.6 -1,029.2 1,029.2 4.9 88 6,118.4 5,244.0 874.5 874.5 4.2
87 17,271.1 17,915.3 -644.2 644.2 3.1 40 1,763.5 2,327.1 -563.6 563.6 2.7 62 2,508.3 1,944.7 563.6 563.6 2.7 29 5,042.7 5,543.5 -500.8 500.8 2.4 61 2,130.7 1,691.4 439.3 439.3 2.1
Sum of top 10 93,800.4 90,742.8 3,057.6 10,811.1 52.0 Sum of others 88,258.6 86,555.2 1,703.4 6,470.8 31.1 Unallocated
3,519.8 -3,519.8 3,519.8 16.9
Total 182,059.0 180,817.8 1,241.2 20,801.7 100.0 Source: Comext database, extracted 3rd August 2016
* Unallocated is trade that is not assigned to a particular chapter

EU Asymmetry Report 2014 data
12
Table 3.4 (b) gives the top ten chapters by positive relative asymmetry.
Like 2013, Chapter 93 (Arms and ammunition) has the highest asymmetry in the table at 131%, with
differences in how countries choose to suppress trade in this chapter being a notable factor in
causing this asymmetry.
Chapter 67 (Prepared feathers and down) is the second largest asymmetry in the table, although
the difference at €14.5 million is relatively small, reflecting the lower level of trade in this commodity.
Chapter 57 (Carpets and other Textile Floor Covering) is the next largest with a 61% relative
asymmetry. Further analysis shows that the total absolute asymmetry for this chapter by country is
€106 million with the countries contributing the most to the asymmetry being the Netherlands (47%)
and Ireland (25%).
The largest actual differences in reported trade amongst these chapters lies in Chapter 54 (Strip
and the like of man-made textile materials) at €172.4 million and a relative asymmetry of 38%.
Table 3.4 (b): Top ten chapters by positive relative asymmetry (Jan - Dec 2014)
Chapter UK dispatches to
EU (€m) EU arrivals from
UK (€m) Asymmetry (€m)
Relative asymmetry (%)
93 165.2 34.3 130.9 131.3 67 29.1 14.6 14.5 66.2 57 202.4 107.7 94.7 61.1 66 14.5 8.4 6.0 52.6 53 20.4 12.3 8.1 49.2
50 19.8 12.5 7.3 45.0 54 537.5 365.0 172.4 38.2 46 4.6 3.2 1.4 36.1 65 123.7 88.3 35.4 33.4 12 341.6 247.5 94.1 31.9
Sum of top 10 1,458.7 893.9 564.8 48.0 Sum of others 180,600.4 176,404.1 4,196.2 2.4 Unallocated
3,519.8 -3,519.8 -200.0
Total 182,059.0 180,817.8 1,241.2 0.7 Source: Comext database, extracted 3rd August 2016
* Unallocated is trade that is not assigned to a particular chapter

EU Asymmetry Report 2014 data
13
Table 3.4 (c) lists the top ten chapters by negative relative asymmetry.
Chapter 80 (Tin and articles thereof) has the highest negative relative asymmetry at -121% however
the corresponding value of £50.6 million is quite low in comparison to other chapters in the table.
Further analysis revealed that Germany (56%) and the Netherlands (37%) make up 93% of this
asymmetry.
The second largest relative asymmetry in the table is for Chapter 99 (Other Products) at -118% or
€1 billion. Further analysis shows that the total absolute asymmetry for this chapter by country is a
similar figure at €1.35 billion and that Ireland is the largest contributor at 67%. As mentioned in the
commentary for Table 3.2 (c), this is to be expected due to the discretion that Member States have
regarding this chapter.
Table 3.4 (c) Top ten chapters by negative relative asymmetry (Jan - Dec 2014)
Chapter UK dispatches to EU
(€m) EU arrivals from
UK (€m) Asymmetry (€m)
Relative asymmetry (%)
80 16.6 67.2 -50.6 -120.9 99 358.4 1,387.6 -1,029.2 -117.9 26 36.8 112.3 -75.5 -101.3 47 100.7 194.7 -94.0 -63.6 08 198.9 380.9 -182.1 -62.8
43 21.6 41.1 -19.6 -62.5 79 57.3 99.8 -42.5 -54.1 40 1,763.5 2,327.1 -563.6 -27.6 20 370.0 485.9 -115.9 -27.1 17 369.7 483.2 -113.5 -26.6
Sum of top 10 3,293.4 5,579.9 -2,286.5 -51.5 Sum of others 178,765.7 171,718.1 7,047.5 4.0 Unallocated 0.0 3,519.8 -3,519.8 -200.0
Total 182,059.0 180,817.8 1,241.2 0.7 Source: Comext database, extracted 3rd August 2016
* Unallocated is trade that is not assigned to a particular chapter

EU Asymmetry Report 2014 data
14
4 Conclusions
UK Arrivals
For the calendar year 2014 the total asymmetry recorded between UK arrivals from the EU and EU
dispatches to the UK was €15.5 billion. The asymmetry in 2013 was €20.2 billion, suggesting that
the data recorded by both the UK and its partner countries is converging. This is despite the fact
that the overall level of trade for UK arrivals has increased by €18 billion (7%) and for EU dispatches
by €13 billion (5%).
The country contributing the most to the total absolute asymmetry (ignoring whether it is a positive
or negative asymmetry) is Germany. This is the same as the calendar year 2011, 2012 and 2013,
although the German share has actually progressively decreased from 32% to 21%. In value terms,
the difference between the UK arrivals from Germany and the German dispatches to the UK stands
at €5.5 billion.
Other countries that have a significant asymmetry in value terms are the Netherlands and Belgium,
with both having an approximate asymmetry of €4 billion. These two countries account for 31% of
the UK’s total absolute asymmetry which is significantly different to 2013 where the two countries
only accounted for 16%.
At a commodity level the largest asymmetries are with Chapter 85 (Electrical machinery and
equipment) and Chapter 99 (Other Products). The absolute asymmetries in these chapters are €2.2
billion and €1.4 billion respectively. In terms of relative asymmetry, there hasn’t been much change
in comparison to 2013, 2012 and 2011 with Chapter 93 (Arms and ammunition) remaining the
largest positive relative asymmetry at 89% and Chapter 99 (Other Products) the largest negative
figure at -171%. Again, these are due to the suppression of figures with arms and ammunition and
the miscellaneous nature of the heading “other products”.
UK Dispatches
The total asymmetry in 2014 between UK dispatches to the EU and EU arrivals from the UK is €1.2
billion. The asymmetry in 2013 was €9 billion and there has therefore been a considerable decrease
of 87%. The overall level of trade for UK dispatches has increased by €4.8 billion (3%) whilst the EU
arrivals have decreased by €5.6 billion (3%). This has resulted in a significant fall in the relative
asymmetry in 2014 to 0.7% from -5% in 2013.
Germany still accounts for the largest share of the total absolute asymmetry although it has fallen
notably from 38% in 2013 to 15% in 2014. The actual difference in UK dispatches to Germany
against German arrivals from the UK is €2.4 billion. The total absolute asymmetry with Germany at
chapter level is €6.7 billion with Chapter 88 (Aircraft, spacecraft and parts thereof) accounting for
27% of this asymmetry. Other countries with large absolute asymmetries are Ireland (€1.4billion)
and France (€1.1billion).
At a commodity level the largest asymmetries are in Chapter 27 (Mineral fuels, mineral oils) and
Chapter 30 (Pharmaceutical Products). These chapters account for 14% and 10% of the total
absolute asymmetry respectively. The asymmetry in Chapter 27 has risen significantly from €0.8

EU Asymmetry Report 2014 data
15
billion in 2013 to €3 billion in 2014, an increase of 268%. The main rises in asymmetry were with the
Netherlands (€1.1) and France (€0.8) due to increases in already notably positive asymmetries.
Asymmetries with Germany also contributed to this (€1.0), however an earlier large negative
asymmetry was reduced to a more balanced figure. Further analysis reveals there may be
classification differences with crude oil in particular with the Netherlands and France.
EU Asymmetry Report 2014 data
16
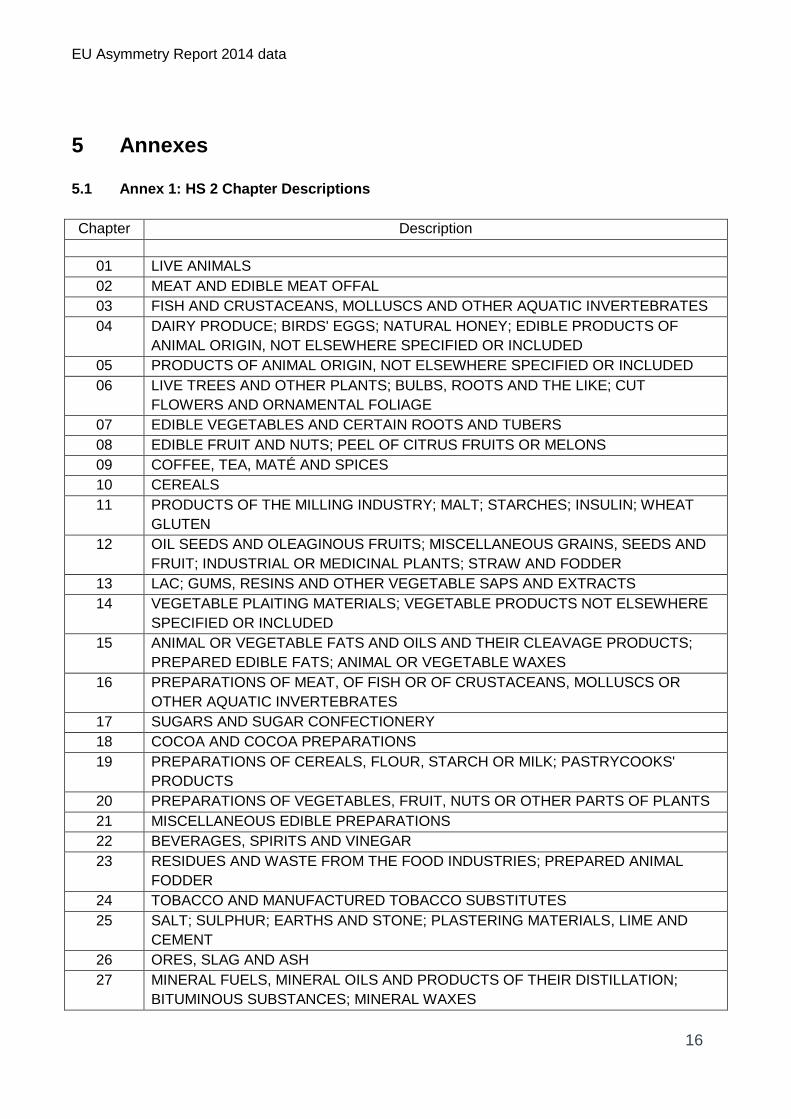
5 Annexes
5.1 Annex 1: HS 2 Chapter Descriptions
Chapter Description
01 LIVE ANIMALS
02 MEAT AND EDIBLE MEAT OFFAL
03 FISH AND CRUSTACEANS, MOLLUSCS AND OTHER AQUATIC INVERTEBRATES
04 DAIRY PRODUCE; BIRDS' EGGS; NATURAL HONEY; EDIBLE PRODUCTS OF
ANIMAL ORIGIN, NOT ELSEWHERE SPECIFIED OR INCLUDED
05 PRODUCTS OF ANIMAL ORIGIN, NOT ELSEWHERE SPECIFIED OR INCLUDED
06 LIVE TREES AND OTHER PLANTS; BULBS, ROOTS AND THE LIKE; CUT
FLOWERS AND ORNAMENTAL FOLIAGE
07 EDIBLE VEGETABLES AND CERTAIN ROOTS AND TUBERS
08 EDIBLE FRUIT AND NUTS; PEEL OF CITRUS FRUITS OR MELONS
09 COFFEE, TEA, MATÉ AND SPICES
10 CEREALS
11 PRODUCTS OF THE MILLING INDUSTRY; MALT; STARCHES; INSULIN; WHEAT
GLUTEN
12 OIL SEEDS AND OLEAGINOUS FRUITS; MISCELLANEOUS GRAINS, SEEDS AND
FRUIT; INDUSTRIAL OR MEDICINAL PLANTS; STRAW AND FODDER
13 LAC; GUMS, RESINS AND OTHER VEGETABLE SAPS AND EXTRACTS
14 VEGETABLE PLAITING MATERIALS; VEGETABLE PRODUCTS NOT ELSEWHERE
SPECIFIED OR INCLUDED
15 ANIMAL OR VEGETABLE FATS AND OILS AND THEIR CLEAVAGE PRODUCTS;
PREPARED EDIBLE FATS; ANIMAL OR VEGETABLE WAXES
16 PREPARATIONS OF MEAT, OF FISH OR OF CRUSTACEANS, MOLLUSCS OR
OTHER AQUATIC INVERTEBRATES
17 SUGARS AND SUGAR CONFECTIONERY
18 COCOA AND COCOA PREPARATIONS
19 PREPARATIONS OF CEREALS, FLOUR, STARCH OR MILK; PASTRYCOOKS'
PRODUCTS
20 PREPARATIONS OF VEGETABLES, FRUIT, NUTS OR OTHER PARTS OF PLANTS
21 MISCELLANEOUS EDIBLE PREPARATIONS
22 BEVERAGES, SPIRITS AND VINEGAR
23 RESIDUES AND WASTE FROM THE FOOD INDUSTRIES; PREPARED ANIMAL
FODDER
24 TOBACCO AND MANUFACTURED TOBACCO SUBSTITUTES
25 SALT; SULPHUR; EARTHS AND STONE; PLASTERING MATERIALS, LIME AND
CEMENT
26 ORES, SLAG AND ASH
27 MINERAL FUELS, MINERAL OILS AND PRODUCTS OF THEIR DISTILLATION;
BITUMINOUS SUBSTANCES; MINERAL WAXES
EU Asymmetry Report 2014 data
17
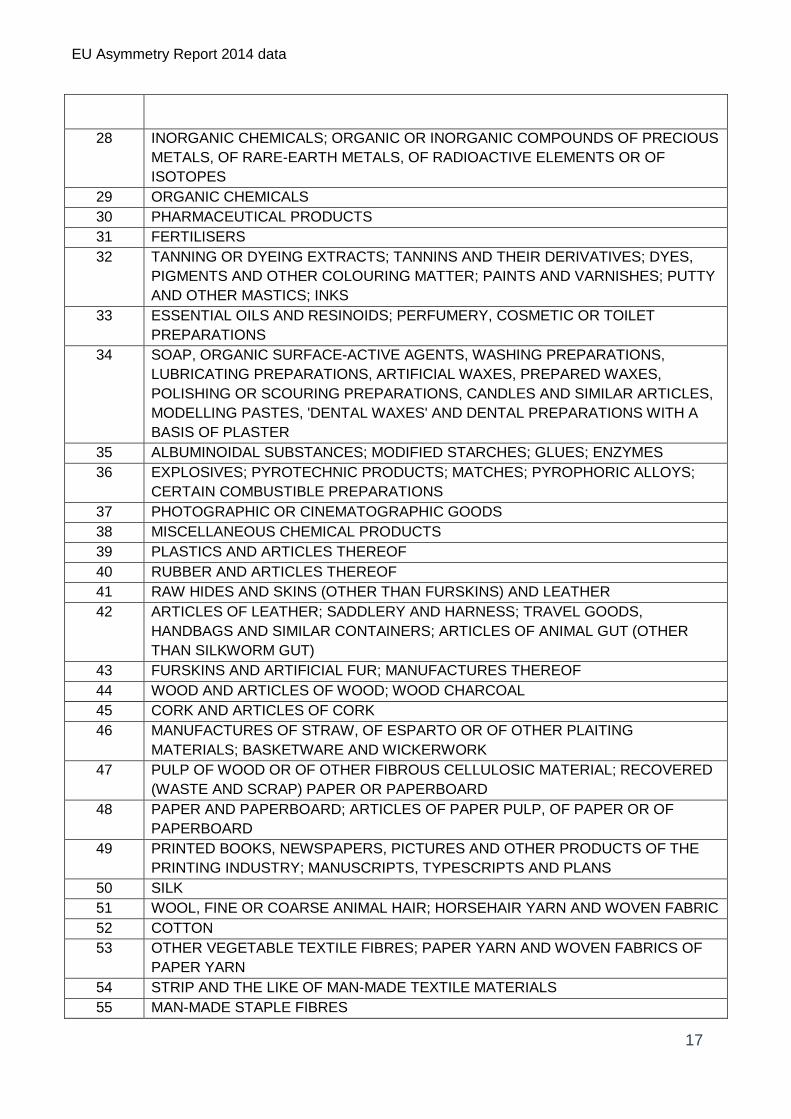
28 INORGANIC CHEMICALS; ORGANIC OR INORGANIC COMPOUNDS OF PRECIOUS
METALS, OF RARE-EARTH METALS, OF RADIOACTIVE ELEMENTS OR OF
ISOTOPES
29 ORGANIC CHEMICALS
30 PHARMACEUTICAL PRODUCTS
31 FERTILISERS
32 TANNING OR DYEING EXTRACTS; TANNINS AND THEIR DERIVATIVES; DYES,
PIGMENTS AND OTHER COLOURING MATTER; PAINTS AND VARNISHES; PUTTY
AND OTHER MASTICS; INKS
33 ESSENTIAL OILS AND RESINOIDS; PERFUMERY, COSMETIC OR TOILET
PREPARATIONS
34 SOAP, ORGANIC SURFACE-ACTIVE AGENTS, WASHING PREPARATIONS,
LUBRICATING PREPARATIONS, ARTIFICIAL WAXES, PREPARED WAXES,
POLISHING OR SCOURING PREPARATIONS, CANDLES AND SIMILAR ARTICLES,
MODELLING PASTES, 'DENTAL WAXES' AND DENTAL PREPARATIONS WITH A
BASIS OF PLASTER
35 ALBUMINOIDAL SUBSTANCES; MODIFIED STARCHES; GLUES; ENZYMES
36 EXPLOSIVES; PYROTECHNIC PRODUCTS; MATCHES; PYROPHORIC ALLOYS;
CERTAIN COMBUSTIBLE PREPARATIONS
37 PHOTOGRAPHIC OR CINEMATOGRAPHIC GOODS
38 MISCELLANEOUS CHEMICAL PRODUCTS
39 PLASTICS AND ARTICLES THEREOF
40 RUBBER AND ARTICLES THEREOF
41 RAW HIDES AND SKINS (OTHER THAN FURSKINS) AND LEATHER
42 ARTICLES OF LEATHER; SADDLERY AND HARNESS; TRAVEL GOODS,
HANDBAGS AND SIMILAR CONTAINERS; ARTICLES OF ANIMAL GUT (OTHER
THAN SILKWORM GUT)
43 FURSKINS AND ARTIFICIAL FUR; MANUFACTURES THEREOF
44 WOOD AND ARTICLES OF WOOD; WOOD CHARCOAL
45 CORK AND ARTICLES OF CORK
46 MANUFACTURES OF STRAW, OF ESPARTO OR OF OTHER PLAITING
MATERIALS; BASKETWARE AND WICKERWORK
47 PULP OF WOOD OR OF OTHER FIBROUS CELLULOSIC MATERIAL; RECOVERED
(WASTE AND SCRAP) PAPER OR PAPERBOARD
48 PAPER AND PAPERBOARD; ARTICLES OF PAPER PULP, OF PAPER OR OF
PAPERBOARD
49 PRINTED BOOKS, NEWSPAPERS, PICTURES AND OTHER PRODUCTS OF THE
PRINTING INDUSTRY; MANUSCRIPTS, TYPESCRIPTS AND PLANS
50 SILK
51 WOOL, FINE OR COARSE ANIMAL HAIR; HORSEHAIR YARN AND WOVEN FABRIC
52 COTTON
53 OTHER VEGETABLE TEXTILE FIBRES; PAPER YARN AND WOVEN FABRICS OF
PAPER YARN
54 STRIP AND THE LIKE OF MAN-MADE TEXTILE MATERIALS
55 MAN-MADE STAPLE FIBRES

EU Asymmetry Report 2014 data
18
56 WADDING, FELT AND NONWOVENS; SPECIAL YARNS; TWINE, CORDAGE,
ROPES AND CABLES AND ARTICLES THEREOF
57 CARPETS AND OTHER TEXTILE FLOOR COVERINGS
58 SPECIAL WOVEN FABRICS; TUFTED TEXTILE FABRICS; LACE; TAPESTRIES;
TRIMMINGS; EMBROIDERY
59 IMPREGNATED, COATED, COVERED OR LAMINATED TEXTILE FABRICS; TEXTILE
ARTICLES OF A KIND SUITABLE FOR INDUSTRIAL USE
60 KNITTED OR CROCHETED FABRICS
61 ARTICLES OF APPAREL AND CLOTHING ACCESSORIES, KNITTED OR
CROCHETED
62 ARTICLES OF APPAREL AND CLOTHING ACCESSORIES, NOT KNITTED OR
CROCHETED
63 OTHER MADE-UP TEXTILE ARTICLES; SETS; WORN CLOTHING AND WORN
TEXTILE ARTICLES; RAGS
64 FOOTWEAR, GAITERS AND THE LIKE; PARTS OF SUCH ARTICLES
65 HEADGEAR AND PARTS THEREOF
66 UMBRELLAS, SUN UMBRELLAS, WALKING-STICKS, SEAT-STICKS, WHIPS,
RIDING-CROPS AND PARTS THEREOF
67 PREPARED FEATHERS AND DOWN AND ARTICLES MADE OF FEATHERS OR OF
DOWN; ARTIFICIAL FLOWERS; ARTICLES OF HUMAN HAIR
68 ARTICLES OF STONE, PLASTER, CEMENT, ASBESTOS, MICA OR SIMILAR
MATERIALS
69 CERAMIC PRODUCTS
70 GLASS AND GLASSWARE
71 NATURAL OR CULTURED PEARLS, PRECIOUS OR SEMI-PRECIOUS STONES,
PRECIOUS METALS, METALS CLAD WITH PRECIOUS METAL, AND ARTICLES
THEREOF; IMITATION JEWELLERY; COIN
72 IRON AND STEEL
73 ARTICLES OF IRON OR STEEL
74 COPPER AND ARTICLES THEREOF
75 NICKEL AND ARTICLES THEREOF
76 ALUMINIUM AND ARTICLES THEREOF
78 LEAD AND ARTICLES THEREOF
79 ZINC AND ARTICLES THEREOF
80 TIN AND ARTICLES THEREOF
81 OTHER BASE METALS; CERMETS; ARTICLES THEREOF
82 TOOLS, IMPLEMENTS, CUTLERY, SPOONS AND FORKS, OF BASE METAL;
PARTS THEREOF OF BASE METAL
83 MISCELLANEOUS ARTICLES OF BASE METAL
84 NUCLEAR REACTORS, BOILERS, MACHINERY AND MECHANICAL APPLIANCES;
PARTS THEREOF
85 ELECTRICAL MACHINERY AND EQUIPMENT AND PARTS THEREOF; SOUND
RECORDERS AND REPRODUCERS, TELEVISION IMAGE AND SOUND
RECORDERS AND REPRODUCERS, AND PARTS AND ACCESSORIES OF SUCH
ARTICLES

EU Asymmetry Report 2014 data
19
86 RAILWAY OR TRAMWAY LOCOMOTIVES, ROLLING-STOCK AND PARTS
THEREOF; RAILWAY OR TRAMWAY TRACK FIXTURES AND FITTINGS AND
PARTS THEREOF; MECHANICAL (INCLUDING ELECTRO-MECHANICAL) TRAFFIC
SIGNALLING EQUIPMENT OF ALL KINDS
87 VEHICLES OTHER THAN RAILWAY OR TRAMWAY ROLLING-STOCK, AND PARTS
AND ACCESSORIES THEREOF
88 AIRCRAFT, SPACECRAFT, AND PARTS THEREOF
89 SHIPS, BOATS AND FLOATING STRUCTURES
90 OPTICAL, PHOTOGRAPHIC, CINEMATOGRAPHIC, MEASURING, CHECKING,
PRECISION, MEDICAL OR SURGICAL INSTRUMENTS AND APPARATUS; PARTS
AND ACCESSORIES THEREOF
91 CLOCKS AND WATCHES AND PARTS THEREOF
92 MUSICAL INSTRUMENTS; PARTS AND ACCESSORIES OF SUCH ARTICLES
93 ARMS AND AMMUNITION; PARTS AND ACCESSORIES THEREOF
94 FURNITURE; BEDDING, MATTRESSES, MATTRESS SUPPORTS, CUSHIONS AND
SIMILAR STUFFED FURNISHINGS; LAMPS AND LIGHTING FITTINGS, NOT
ELSEWHERE SPECIFIED OR INCLUDED; ILLUMINATED SIGNS, ILLUMINATED
NAME-PLATES AND THE LIKE; PREFABRICATED BUILDINGS
95 TOYS, GAMES AND SPORTS REQUISITES; PARTS AND ACCESSORIES THEREOF
96 MISCELLANEOUS MANUFACTURED ARTICLES
97 WORKS OF ART, COLLECTORS' PIECES AND ANTIQUES
99 OTHER PRODUCTS

EU Asymmetry Report 2014 data
20
5.2 Annex 2: Glossary
Arrivals Goods imported into an EU Member State from another EU Member State.
Asymmetries Differences between the trade recorded by countries, e.g. the difference between what the United Kingdom records as an arrival from Germany and what Germany records as a dispatch to the United Kingdom.
Comext
Eurostat’s Trade Statistics database, which contains standardised trade data from all EU Member States.
Dispatches Goods exported from an EU Member State to another EU Member State.
Exports Goods exported to non EU countries, but often used to describe EU trade as well.
Imports Goods imported from non EU countries, but often used to describe EU trade as well.
Intrastat Survey of trade in goods between EU Member States.
MTIC Missing Trader Intra-Community (VAT Fraud), see Carousel fraud.
Statistical value On export, the value of the goods at the place and time they leave the statistical territory of the exporting Member State. On import, the value of goods at the place and time they enter the statistical territory of the importing Member State.
Threshold The Intrastat system has thresholds including an exemption threshold (above which traders must submit declarations giving details of their trade with the rest of the EU). In the UK there is also a delivery terms threshold (a simplification where only traders above this threshold must submit details on delivery terms and costs in order to calculate statistical value).