a real-time intrusion detection algorithm for network security · a real-time intrusion detection...
TRANSCRIPT

A Real-Time Intrusion Detection Algorithm for Network Security
HAZEM M. EL-BAKRY
Faculty of Computer Science & Information Systems, Mansoura University, EGYPT
E-mail: [email protected]
NIKOS MASTORAKIS
Department of Computer Science, Military Institutions of University Education (MIUE) -Hellenic Naval Academy, Greece
Abstract — E-government is an important issue which integrates existing local area networks into a global network that provide many services to the nation citizens. This network requires a strong security infrastructure to guarantee the confidentiality of national data and the availability of government services. In this paper, a framework for network intrusion detection systems is presented. Such framework utilizes data mining techniques and is customized for the E-Government Network (EGN). It consists of two phases: an offline phase in which the intrusion detection system learns the normal usage profiles for each local network domain, and a real time intrusion detection phase. In the real time phase, known attacks are detected at a global layer at the EGN perimeters while normal behavior is filtered out at a local layer defined for each LAN domain. Clustering is used to focus the analysis on the remaining suspicious activity and identify whether it represents new intrusive or normal behavior. This framework is intended to detect intrusions in real-time, achieve low false alarm rates, and continuously adapt to the environment changes and emergence of new behavior. This research is a development for the work presented in [22,23]. The main achievement of this paper is the fast attack detection algorithm. Such algorithm based on performing cross correlation in the frequency domain between data traffic and the input weights of fast time delay neural networks (FTDNNs). It is proved mathematically and practically that the number of computation steps required for the presented FTDNNs is less than that needed by conventional time delay neural networks (CTDNNs). Simulation results using MATLAB confirm the theoretical computations.
Keywords— Fast Intrusion Detection, Clustering, Data Mining, E-Government, Cross correlation, Frequency domain, and Neural Networks.
1. Introduction Intrusion detection is the process of monitoring the activities of a computer or network system and analyzing them for signs of intrusions or attacks [1]. The intrusion detection system (IDS) is the software or hardware that automates this monitoring and analysis. The intrusion detection system depends on two basic processes to work: monitoring the underlying system activity and analyzing the resulting event data. The analysis process can be conducted by means of two main techniques: The first is misuse detection, in which data is analyzed to find intrusions matching predefined attack signatures kept by the IDS, and the second is anomaly detection, in which data is analyzed to spot anomalies different from a predefined normal profile of the protected system.
The IDS analysis phase is concerned with finding intrusions within large amounts of activity data. Since data mining techniques can analyze large data sets and discover interesting patterns hidden in them, they have been used to discover patterns of intrusions that may exist among the data monitored by the IDS. However, IDSs that use data mining techniques suffer from high false alarm rates because they are used mainly for anomaly detection, and they need extensive training over attack-free correctly labeled data instances [2].
In this paper a framework for a fast data mining-based network intrusion detection system for the E-Government Network (EGN) is presented. The EGN generally consists of multiple independent governmental domains that are linked together via a virtual private network. Communications from outside parties that wish to use the EGN services are carried out through the Internet and are screened by a central security system. This architecture suggests that the
functions of the IDS be distributed over two conceptual layers: a global layer to enhance the security of the EGN domain where it is connected to the public domain, and a local layer to enhance the security of the local governmental domains that provide specific services. The proposed framework adapts this layered approach to detect intrusions, where the IDS performs known attacks detection at the global layer and normal profile filtering at the local layer. Then it uses clustering to analyze unknown activity to find out whether it is similar to the system profile in the local layer or to the known attacks detected in the global layer. The gradual filtering of known behavior (whether known attacks or known normal profiles) leaves only a small subset of data to be analyzed for possible new intrusions, which improves the detection rate of the intrusion detection system [3]. This framework works through two phases: a phase in which local normal profiles are built for each domain, and a phase of real time detection that depends on the layered approach previously outlined. The real time intrusion detection system utilizes the existing domain knowledge about intrusion signatures and attempts to help establish new knowledge about the intrusions. This framework aims at achieving a low false alarm rate while keeping the suspicion level of the intrusion detection system high.
2. Data Mining Intrusion Detection Systems Most of the work in the area of building operational IDSs using data mining depends on an offline analysis phase to build models of normal behavior. The Minnesota Intrusion Detection System (MINDS) proposed in [4] uses a suite of data mining techniques to automatically detect attacks against computer networks. MINDS first constructs features that are used in the data mining analysis. Known attack detection module is then used to detect network connections that correspond to attacks for which the signatures are available, and they are removed from further analysis. Next, the data is fed into the MINDS anomaly detection module that uses an
WSEAS TRANSACTIONS on COMMUNICATIONS Hazem M. El-Bakry, Nikos Mastorakis
ISSN: 1109-2742 1222 Issue 12, Volume 7, December 2008

outlier detection algorithm to assign an anomaly score to each network connection. The architecture thus does not consider the changes in normal system behavior. On the other hand, the work in [5] deals with the problem of false positives resulting from new normal behavior not previously seen by the IDS. The proposed architecture depends on adaptive IDS using fuzzy association rules. The architecture continuously measures the similarity between each day’s activity and a normal profile. When the similarity goes down below a threshold level this indicates either a change in behavioral patterns or an attack on the system. It is the abruptness of change that helps decide which case is true. A real time data mining-based IDS is proposed in [6] that attempts to address three issues; accuracy, efficiency, and usability. To improve accuracy, the system uses data mining programs to analyze audit data and extract features that can distinguish normal activities from intrusions, and uses artificial anomalies instead of attack signatures to produce hybrid misuse and anomaly detection models. To improve efficiency, the computational costs of features are analyzed and a multiple-model cost-based approach is used to produce detection models with low cost and high accuracy. A distributed architecture is also introduced for evaluating cost-sensitive models in real time. To improve usability, adaptive learning algorithms are used to facilitate model construction and incremental updates, and unsupervised anomaly detection algorithms are used to reduce the reliance on labeled data. The proposed architecture consists of sensors, detectors, a data warehouse, and model generation components. This architecture facilitates the sharing audit data among detectors and the distribution of new or updated models and improves the efficiency and scalability of the IDS. The system is designed to be independent of the sensor data format and model representation.
Data mining algorithms that were applied to network traffic data include association rules mining, classification, and clustering. Association rules mining [5-7] was used to identify interesting attributes that occur together with a high support in the traffic data, these associations were used to classify the traffic data online. Classification techniques such as decision trees [8] and Bayesian classification [9] were used to build classifiers of normal network activity data and detect data that do not match the classifiers' rules. Clustering techniques work by grouping similar data instances into clusters regardless of the instances' class labels. They were used to tackle the problem of labeling data before training, which is inherent in association rule mining and classification techniques. Clustering is used in [10], where three clustering strategies are applied on data containing both attack scenarios and normal traffic, namely, the Self-Organizing Maps, K-means clustering, and Expected Maximization Clustering. This work shows that SOM has the same complexity regardless of the data volume or clusters used. However, SOM can misclassify data inputs that will correspond to nodes not affected during training. The K-means clustering algorithm has a predictable performance and classification; however, it poorly manipulates highly dimensional data sets. The Expected Maximization algorithm can tolerate missing and unlabeled data and can offer information about how close a data point is to each cluster since the data point has a varying membership to all clusters.
The mixed nature of data is addressed in [11]. A clustering algorithm (CLAD) is proposed that can identify suspicious clusters that are distant and of an unusual size. To identify these clusters, a cluster’s size and its position relative to other clusters are examined to encompass strong outliers. This work has three main
contributions: a statistically derived cluster width is proposed instead of user-defined, a novel approach for measuring distance among discrete values, a global view of outliers through introduction of notion of strong outliers. To calculate the width, CLAD randomly draws a sample from the entire dataset and calculates the pair-wise distances. The average of the smallest distances is the cluster width. The distance between two discrete values is based on their frequency rather than their values. To determine if a cluster is an outlier, CLAD uses cluster density and distance from the other clusters. Clusters that are distant and sparse are considered outliers and anomalous. A sparse cluster is a local outlier, whereas a distant cluster is a global outlier. A strong outlier is both global and local a outlier.
The algorithm in [12] builds clusters progressively as the data points are submitted. If the data point does not fit within a fixed width of any existing cluster, a new cluster is created with this point as its centroid. To find out which clusters contain normal instances and which contain attacks, the assumption that normal instances constitute a very large portion of the training dataset is used. This means that clusters containing normal data will have a much larger number of instances associated with them than would clusters containing anomalies. The problem with this approach is when there are many sub-types of normal instances in the training set. This produces a large number of such normal clusters with relatively small density. Each of these clusters will have a relatively small number of instances, leading to having these clusters incorrectly labeled as anomalous.
The work in [13] is based on two concepts: supervised clustering for learning signature patterns of normal and intrusive activities during training, and instance-based classification for using those signature patterns to classify activities during testing. While incrementally clustering data records during training, the proposed work uses dummy clusters to prevent consecutive data records from being clustered together, even though their attribute values are not similar. The algorithm incrementally groups the data points in the training dataset into clusters supervised by the target class information. First, the training data is used to compute the relevance of each feature to the target the target class. Then, data points are compared to each cluster using the distance measure. If the data point and the nearest cluster have the same class, the data point is assigned to the cluster. Otherwise, a new cluster is created with this data point as the centroid and the target class of the new cluster is the class of this data point.
In [14], the fuzzy c-medoids algorithm is used to build models from data streams. The algorithm takes pair wise distances between the data-points as input. A data point is a member of a given cluster if its distance from the medoid of that cluster is less than a specified threshold distance for that cluster. The threshold for a given cluster is based on the intra-cluster radius for that cluster. Two different outlier detection schemes are employed to test the algorithm. In the Absolute Distance scheme, the distances of a test data point from all the medoids of a cluster are calculated. If any of these distances is within the specified radius threshold the data-point is a member of that cluster. In the Average Distance scheme the average of the distances of the test data-point from all the medoids of the cluster is calculated. If this average distance is within the specified radius threshold of some cluster, the data point is a member of that cluster and an outlier otherwise.
The authors in [15] propose a clustering heuristic for intrusion detection called Y-means. It overcomes two shortcomings of K-
WSEAS TRANSACTIONS on COMMUNICATIONS Hazem M. El-Bakry, Nikos Mastorakis
ISSN: 1109-2742 1223 Issue 12, Volume 7, December 2008

means: number of clusters dependency and degeneracy. Y-means algorithm partitions the normalized data into k clusters. The next step is to find whether there are any empty clusters. If there are, new clusters will be created to replace these empty clusters; and then instances will be re-assigned to existing centers. This iteration will continue until there is no empty cluster. Subsequently, the outliers of clusters will be removed to form new clusters, in which instances are more similar to each other; and overlapped adjacent clusters will merge into a new cluster. In this way, the value of k will be determined automatically by splitting or merging clusters. The last step is to label the clusters according to their populations, if the population ratio of one cluster is above a given threshold, all the instances in the cluster will be classified as normal; otherwise, they are labeled intrusive.
Here, we develop the work presented in [22,23]. We propose a fast algorithm for an operational data mining-based IDS together with a clustering algorithm that first compares real-time data points to predefined attack signatures, then to the normal clusters, then to the intrusive clusters. This gradually filters out data with previously known behavior and leaves only a small subset of the data for comprehensive anomaly analysis. The purpose of the system is to utilize local normal system profiles together with the existing domain knowledge about intrusions signatures to build a real-time IDS that can adapt to the changing EGN environment and the newly conducted attacks. This architecture also aims at achieving a low false alarm rate while keeping the suspicion level of the intrusion detection system high.
3. The Proposed IDS Framework The proposed IDS is designed to operate through two main phases: the Normal Profiles Building Phase (NPBP) and the Real-Time Detection Phase (RTDP). The NPBP is carried out offline and is concerned with building a system profile for each local site in the EGN. The RTDP filters out these normal profiles together with the known-attacks definitions obtained from the industry practices. Clustering is used to focus the analysis on the remaining suspicious activity and identify whether it represents new intrusive or normal behavior. A detailed description of both phases is given in the following subsections, with an overview of the used clustering algorithm.
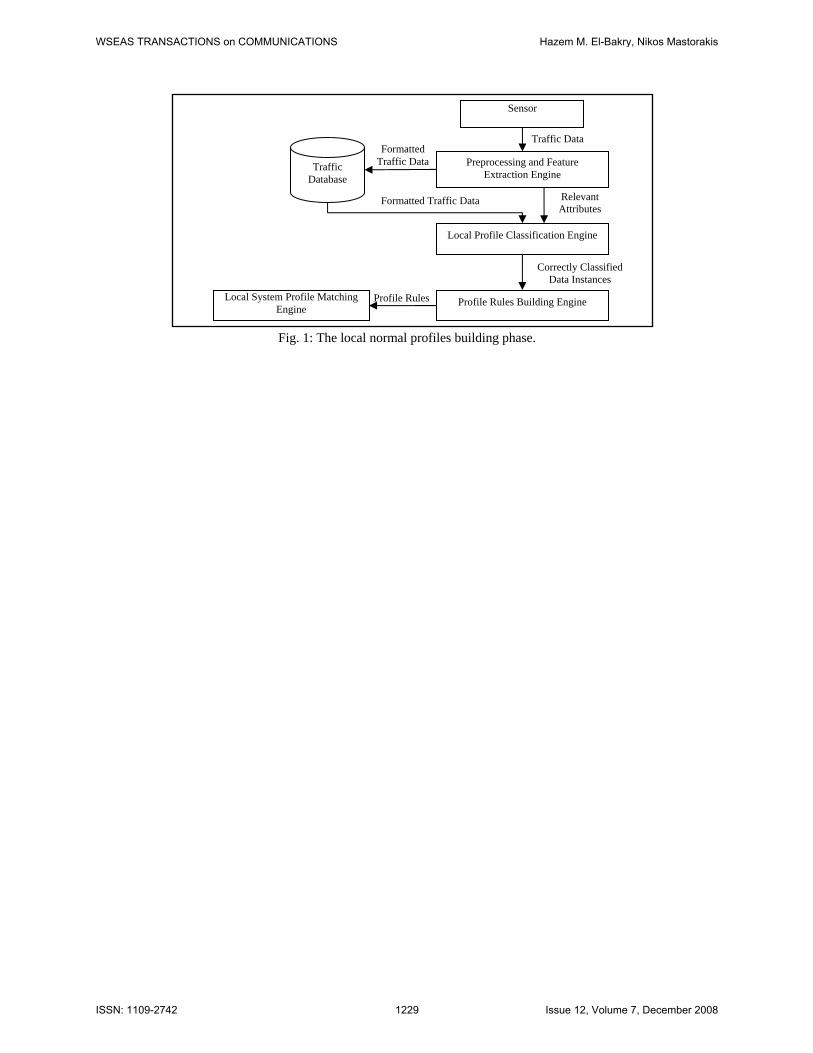
3.1 The Normal Profiles Building Phase This phase is concerned with constructing the classifiers that can discriminate and predict the local systems behaviors. These classifiers are then used to construct the rules that describe normal systems profiles. This phase, which is depicted in Fig. 1, will be implemented in each local site in the EGN because the system behavior is expected to vary among the local sites. The EGN should be isolated from the external traffic activity for a predefined period of time to ensure that the data represents normal local traffic. The operations of this phase are carried out through the following components:
Sensors and Preprocessing Engines: A sensor collects traffic data from the local site and dumps this data to a preprocessing and feature extraction engine. This engine formats the data into instances or records at a suitable level of granularity (e.g. packet, connection, or session levels) and applies an attribute relevance analysis technique in order to extract the attributes that are most discriminating of the data. These formatted data records are stored in a traffic database.
Local Profile Classification Engine: This engine takes the formatted data records and the relevant attributes and applies a classification algorithm to categorize the data records based on the values of relevant attributes. The resulting classifier can be validated over a consecutive period of time during which the system is still operating in isolation of the external activity.
Profile Rules Building Engine: After the classifier reaches an acceptable level of accuracy, it is used by the profile rules building engine to construct the set of rules that represent the local normal system profile, and these rules are stored in the local system profiles matching engine (a component in the real time detection phase). The correctly classified data instances are stored in the profile database for further usage by the IDS.
3.2 The Real-Time Detection Phase The detection phase is concerned with discovering the existence of known and unknown intrusions. A number of components interact together and exchange information to achieve the real-time detection of intrusions. These components are distributed over two conceptual layers: the global layer, in which the IDS filters out the known intrusions already defined by the intrusion detection industry, and it operates together with the central security mechanisms for the EGN as a whole. The local layer includes the IDS components that will reside in the local sites. The function of this layer is to filter out the normal traffic previously defined for each local site, so that only anomalous traffic is subject for detailed analysis. The organization of these components is illustrated in Fig. 2, and their functions are detailed as follows:
3.2.1 Sensor and Preprocessing Engine The sensor collects traffic data at predefined short intervals and dumps this data to a preprocessing engine , which formats the data into records at a suitable level of granularity. This preprocessed data records (instances) are passed to the global known-attacks detection engine.
3.2.2 Global Known-Attacks Detection Engine This engine receives preprocessed data instances and matches the data instances against the known attacks. If an intrusion is detected, it is reported to the global response engine and the data instances of that intrusion are labeled accordingly and stored in the attacks database. Otherwise, the data instances are passed to the local system profile-matching engine.
3.2.3 Local System Profile-Matching Engine This engine includes the classification rules of normal profiles that were produced during the normal profile building phase. It matches the data instances received from the global known-attacks detection engine against these rules. If a data instance does not match the profile, it is passed to the local anomaly detection engine. Otherwise, data instances that match the profile are labeled as such and stored in the profiles database.
3.2.4 Local Anomaly Detection Engine This engine uses a clustering algorithm to build an initial set of clusters from the normal data instances obtained from the profiles database. The algorithm then measures the deviation of each unknown data instance from the clusters of normal instances. If the deviation is small then the data instance is considered normal, otherwise the widely deviating instances are considered high anomalies and reported to the local response engine and the global
WSEAS TRANSACTIONS on COMMUNICATIONS Hazem M. El-Bakry, Nikos Mastorakis
ISSN: 1109-2742 1224 Issue 12, Volume 7, December 2008

anomaly analysis engine. The processes of the local anomaly detection engine are outlined in Fig. 3.
3.2.5 Global Anomaly Analysis Engine
The global anomaly analysis engine, whose processes are depicted in Fig. 4, accepts anomalies from the many local sites and applies a clustering algorithm to determine the existence of new attacks or new profiles. The clustering algorithm first constructs a set of clusters based on known-attacks data instances obtained from the attacks database. The algorithm compares the highly anomalous instances with the attacks clusters. If anomalous instances are close to attack clusters or form new dense clusters within a short time window they are considered intrusions and sent to the global response engine. Otherwise, if the anomalous instances form new dense clusters over a long time window they are considered new profiles. the new cluster are used to construct rules defining the new attacks and profiles. the rules representing attacks are sent to the global known-attacks detection engine and the rules defining normal profiles are sent to the local system-profile matching engine so that both engines update their rules.
3.2.6 Global and Local Response Engines These engines receive known attacks and highly ranked anomalies, raise alarms, and perform any other actions that are dictated by the security policy of the system under supervision.
4. Clustering Algorithm The clustering algorithm is deployed in both the local anomaly detection engine and the global anomaly analysis engine. The clustering algorithm is incremental in the sense that it updates the clusters continuously as new instances are processed.
The clustering algorithm in the local anomaly detection engine, which is outlined in Fig. 5, measures the distance between a data instance and the clusters representing the normal instances, and this distance is compared with a similarity threshold. One of the following situations will occur:
1. Measured distance is greater than or equal to the similarity threshold of one of the clusters, which indicates that the data instance fits within that cluster, so it is given the label of those instances (or the label of the majority of the instances). 2. Measured distance is less than but very close (within a range) to the similarity threshold of one of the clusters. This may imply a slight deviation from the cluster behavior. The instance is considered to belong to the cluster and a counter is incremented that keeps a record of the reoccurrences of similar instances having this slight deviation. If this counter reaches a certain maximum, these instances are considered an update in the cluster behavior. The cluster's original density is updated with the new instances, which are labeled normal and added to the profiles database. 3. Measured distance is much less than the similarity thresholds of any of the clusters, implying a strong anomaly is encountered. Thus, it is ranked as high anomaly and forwarded to the local response engine. If after some time the number of that instance's occurrences exceeds a certain maximum, it is forwarded to the global anomaly analysis engine.
In the global anomaly analysis engine, the clustering algorithm constructs a set of clusters that represent attacks obtained from the attacks database. When the algorithm receives highly-ranked anomalous instances from the different local sites, it searches the
clustering space to find a cluster to which the anomalous instance is close. If such a cluster is found, the anomalous instance is labeled with the class name of that cluster and sent to the global response engine. If not, the anomalous instance is placed in a new cluster. One of three scenarios can arise with the placement of other anomalous instances within a new cluster: 1. Anomalous instances are grouped in that cluster within a short predetermined time interval and the cluster has a high density. These instances are considered to represent a new attack and sent to the global response engine. 2. Anomalous instances are grouped in that cluster over a long time interval and the cluster has a high density. These instances are considered normal instances of a new profile. 3. Anomalous instances are grouped in that cluster over a long time interval but the cluster has a low density. These instances are considered to represent a stealthy attack, and are forwarded to the global response engine.
This algorithm is outlined in Fig.6. As new clusters representing new attacks (both bursty and stealthy) and new profiles are created, they are passed to a sub-module that uses association rule mining to construct rules to define these new attacks and profiles.
5. Implementation Plan MEGNTID will be implemented in an experimental environment with no real EEGN traffic. Instead, we will use the DARPA 1999 dataset provided by Lincoln Laboratory [16]. The DARPA 1999 dataset was used to evaluate a number of IDSs. This dataset contains two weeks of attack-free traffic and three weeks of mixed traffic. Each week contains five days of network traffic collected both from inside the simulation network and at the outside perimeter. Only the outside dumps will be used in our experiments since they represent the traffic entering or leaving the network as a whole. The first day of the attack-free first week is used to compute the normal profile, while the first day of the forth week with mixed traffic will be replayed during the detection phase. The first day of the fifth week will be used to test the performance of MEGNTID and tune its operations. In order to demonstrate the validity of the system, we have chosen to filter the dump files so they contain only TCP connections. It is relatively easy to add separate modules to process UPD and ICMP packets.
The experiment is performed on an HP Compaq nx9030 laptop with 1.60 GHz processor speed and 256 MB RAM, and running Windows XP Professional with SP2. We have completed the normal profile building phase, which is very time-consuming since it involves preprocessing the data in a format suitable for the mining process. Initially, we could use an off-the-shelf sensor such as Windump or Ethereal. But they did not satisfy our need to put the data in a format acceptable for data mining analysis. This prompted us to extend the functionality of another sensor; JpcapDumper. The relevant features that were produced using attribute relevance analysis are: the packet timestamp, the source and destination addresses, the source and destination ports, the packet length, the packet flags, the time since last packet, the and windows size. The application of a simple association rule mining resulted in producing 37 effective rules that define the normal profile presented by 1247366 packets of attack-free data from Monday, week 1.
The real-time detection phase requires that monitoring be accompanied by real-time formatting of data for the purposes of analysis. Also, a source of contiguous traffic fed to the IDS is
WSEAS TRANSACTIONS on COMMUNICATIONS Hazem M. El-Bakry, Nikos Mastorakis
ISSN: 1109-2742 1225 Issue 12, Volume 7, December 2008

needed in order to represent the outbound traffic to and from the EEGN. This is achieved by replaying the DARPA outbound Monday trace of week 4. The distribution of normal and attack classes in Monday, week 4 is shown in Fig. 7. since the global detection layer involves comparing data to known attack signatures, we have collected 399 attack signatures from the Internet and formatted then as if-then rules.
6. Fast Intrusion Detection using Neural Networks Finding a certain intrusion, in the incoming serial data, is a searching problem. First neural networks are trained to classify intrusion from non intrusion examples and this is done in time domain. In intrusion detection phase, each position in the incoming matrix is tested for presence or absence of an intrusion. At each position in the input one dimensional matrix, each sub-matrix is multiplied by a window of weights, which has the same size as the sub-matrix. The outputs of neurons in the hidden layer are multiplied by the weights of the output layer. When the final output is high, this means that the sub-matrix under test contains an intrusion and vice versa. Thus, we may conclude that this searching problem is a cross correlation between the incoming serial data and the weights of neurons in the hidden layer. The convolution theorem in mathematical analysis says that a convolution of f with h is identical to the result of the following steps: let F and H be the results of the Fourier Transformation of f and h in the frequency domain. Multiply F and H* in the frequency domain point by point and then transform this product into the spatial domain via the inverse Fourier Transform. As a result, these cross correlations can be represented by a product in the frequency domain. Thus, by using cross correlation in the frequency domain, speed up in an order of magnitude can be achieved during the detection process [17]. Assume that the size of the intrusion code is 1xn. In intrusion detection phase, a sub matrix I of size 1xn (sliding window) is extracted from the tested matrix, which has a size of 1xN. Such sub matrix, which may be an intrusion code, is fed to the neural network. Let Wi be the matrix of weights between the input sub-matrix and the hidden layer. This vector has a size of 1xn and can be represented as 1xn matrix. The output of hidden neurons h(i) can be calculated as follows:
⎟⎟⎠
⎞⎜⎜⎝
⎛+∑
== ib(k)I(k)
n
1k iWgih (1)
where g is the activation function and b(i) is the bias of each hidden neuron (i). Equation 1 represents the output of each hidden neuron for a particular sub-matrix I. It can be obtained to the whole input matrix Z as follows:
⎟⎟⎟
⎠
⎞
⎜⎜⎜
⎝
⎛∑−=
++=n/2
n/2k i bk) Z(uk)(iWg(u)ih (2)
Eq.2 represents a cross correlation operation. Given any two functions f and d, their cross correlation can be obtained by:
⎟⎟⎠
⎞⎜⎜⎝
⎛∑∞
∞−=+=⊗
nn)d(n)f(xf(x)d(x) (3)
Therefore, Eq. 2 may be written as follows [17]:
( )ibZiWgih +⊗= (4)
where hi is the output of the hidden neuron (i) and hi (u) is the activity of the hidden unit (i) when the sliding window is located at position (u) and (u) ∈ [N-n+1].
Now, the above cross correlation can be expressed in terms of one dimensional Fast Fourier Transform as follows [19]:
( ) (( )iW*FZF1FZiW •−=⊗ ) (5)
Hence, by evaluating this cross correlation, a speed up ratio can be obtained comparable to conventional neural networks. Also, the final output of the neural network can be evaluated as follows:
⎟⎟⎠
⎞⎜⎜⎝
⎛∑=
+=q
1iob)u(ih (i)oWgO(u) (6)
where q is the number of neurons in the hidden layer. O(u) is the output of the neural network when the sliding window located at the position (u) in the input matrix Z. Wo is the weight matrix between hidden and output layer. The complexity of cross correlation in the frequency domain can be analyzed as follows:
1- For a tested matrix of 1xN elements, the 1D-FFT requires a number equal to Nlog2N of complex computation steps [18]. Also, the same number of complex computation steps is required for computing the 1D-FFT of the weight matrix at each neuron in the hidden layer.
2- At each neuron in the hidden layer, the inverse 1D-FFT is computed. Therefore, q backward and (1+q) forward transforms have to be computed. Therefore, for a given matrix under test, the total number of operations required to compute the 1D-FFT is (2q+1)Nlog2N.
3- The number of computation steps required by FTDNNs is complex and must be converted into a real version. It is known that, the one dimensional Fast Fourier Transform requires (N/2)log2N complex multiplications and Nlog2N complex additions [18]. Every complex multiplication is realized by six real floating point operations and every complex addition is implemented by two real floating point operations. Therefore, the total number of computation steps required to obtain the 1D-FFT of a 1xN matrix is:
ρ=6((N/2)log2N) + 2(Nlog2N) (7)
which may be simplified to:
ρ=5Nlog2N (8)
4- Both the input and the weight matrices should be dot multiplied in the frequency domain. Thus, a number of complex computation steps equal to qN should be considered. This means 6qN real operations will be added to the number of computation steps required by FTDNNs.
5- In order to perform cross correlation in the frequency domain, the weight matrix must be extended to have the same size as the input matrix. So, a number of zeros = (N-n) must be added to the weight matrix. This requires a total real number of computation steps = q(N-n) for all neurons. Moreover, after computing the FFT for the weight matrix, the conjugate of this matrix must be obtained. As a result, a real number of computation steps = qN should be added in order to obtain the conjugate of the weight
WSEAS TRANSACTIONS on COMMUNICATIONS Hazem M. El-Bakry, Nikos Mastorakis
ISSN: 1109-2742 1226 Issue 12, Volume 7, December 2008

matrix for all neurons. Also, a number of real computation steps equal to N is required to create butterflies complex numbers (e-jk(2Πn/N)), where 0<K<L. These (N/2) complex numbers are multiplied by the elements of the input matrix or by previous complex numbers during the computation of FFT. To create a complex number requires two real floating point operations. Thus, the total number of computation steps required for FTDNNs becomes:
σ=(2q+1)(5Nlog2N) +6qN+q(N-n)+qN+N (9) which can be reformulated as:
σ=(2q+1)(5Nlog2N)+q(8N-n)+N (10)
6- Using sliding window of size 1xn for the same matrix of 1xN pixels, q(2n-1)(N-n+1) computation steps are required when using CTDNNs for certain intrusion detection or processing (n) input data. The theoretical speed up factor η can be evaluated as follows:
N n)-q(8N N) 1)(5Nlog(2q 1)n-1)(N-q(2n
2 ++++
=η (11)
Time delay neural networks accept serial input data with fixed size (n). Therefore, the number of input neurons equals to (n). Instead of treating (n) inputs, the proposed new approach is to collect all the incoming data together in a long vector (for example 100xn). Then the input data is tested by time delay neural networks as a single pattern with length L (L=100xn). Such a test is performed in the frequency domain as described in section II. The combined intrusion in the incoming data may have real or complex values in a form of one or two dimensional array. Complex-valued neural networks have many applications in fields dealing with complex numbers such as telecommunications, speech recognition and image processing with the Fourier Transform [20,21]. Complex-valued neural networks mean that the inputs, weights, thresholds and the activation function have complex values. In this section, formulas for the speed up ratio with different types of inputs (real /complex) will be presented. Also, the speed up ratio in case of a one and two dimensional incoming input matrix will be concluded. The operation of FTDNNs depends on computing the Fast Fourier Transform for both the input and weight matrices and obtaining the resulting two matrices. After performing dot multiplication for the resulting two matrices in the frequency domain, the Inverse Fast Fourier Transform is determined for the final matrix. Here, there is an excellent advantage with FTDNNs that should be mentioned. The Fast Fourier Transform is already dealing with complex numbers, so there is no change in the number of computation steps required for FTDNNs. Therefore, the speed up ratio in case of complex-valued time delay neural networks can be evaluated as follows:
1) In case of real inputs
A) For a one dimensional input matrix Multiplication of (n) complex-valued weights by (n) real inputs requires (2n) real operations. This produces (n) real numbers and (n) imaginary numbers. The addition of these numbers requires (2n-2) real operations. The multiplication and addition operations are repeated (N-n+1) for all possible sub matrices in the incoming input matrix. In addition, all of these procedures are repeated at each neuron in the hidden layer. Therefore, the number of
computation steps required by conventional neural networks can be calculated as:
θ=2q(2n-1)(N-n+1) (12)
The speed up ratio in this case can be computed as follows:
N n)-q(8N N) 1)(5Nlog(2q
1)n-1)(N-2q(2n
2 ++++
=η (13)
B) For a two dimensional input matrix Multiplication of (n2) complex-valued weights by (n2) real inputs requires (2n2) real operations. This produces (n2) real numbers and (n2) imaginary numbers. The addition of these numbers requires (2n2-2) real operations. The multiplication and addition operations are repeated (N-n+1)2 for all possible sub matrices in the incoming input matrix. In addition, all of these procedures are repeated at each neuron in the hidden layer. Therefore, the number of computation steps required by conventional neural networks can be calculated as:
θ=2q(2n2-1)(N-n+1) 2 (14)
The speed up ratio in this case can be computed as follows:
N )n-q(8N )N log1)(5N(2q
1)n-1)(N-2q(2n222
22
22
++++
=η (15)
2) In case of complex inputs
A) For a one dimensional input matrix Multiplication of (n) complex-valued weights by (n) complex inputs requires (6n) real operations. This produces (n) real numbers and (n) imaginary numbers. The addition of these numbers requires (2n-2) real operations. Therefore, the number of computation steps required by conventional neural networks can be calculated as:
θ=2q(4n-1)(N-n+1) (16)
The speed up ratio in this case can be computed as follows:
N n)-q(8N N) 1)(5Nlog(2q
1)n-1)(N-2q(4n
2 ++++
=η (17)
B) For a two dimensional input matrix Multiplication of (n2) complex-valued weights by (n2) real inputs requires (6n2) real operations. This produces (n2) real numbers and (n2) imaginary numbers. The addition of these numbers requires (2n2-2) real operations. Therefore, the number of computation steps required by conventional neural networks can be calculated as:
θ=2q(4n2-1)(N-n+1)2 (18)
The speed up ratio in this case can be computed as follows:
N )n-q(8N )N log1)(5N(2q 1)n-1)(N-2q(4n
2222
2
22
++++
=η (19)
An interesting point is that the memory capacity is reduced when using FTDNN. This is because the number of variables is reduced
WSEAS TRANSACTIONS on COMMUNICATIONS Hazem M. El-Bakry, Nikos Mastorakis
ISSN: 1109-2742 1227 Issue 12, Volume 7, December 2008

compared with CTDNN. The neural algorithm presented here can be inserted very easily in any Anti-Intrusion gateway software.
7. Conclusion The intrusion detection system is an essential part of the overall security infrastructure, especially when the system to be protected is as vital and sensitive as the E-Government Network. This paper presented a architecture for an intrusion detection system that is based on data mining techniques. This architecture distributes the functions of the intrusion detection system (data collection, analysis, and response) over two layers, a global central layer and a local layer. The IDS gradually filters out the known traffic behavior (intrusive and normal) in order to focus the analysis on data not seen before by the system. This is intended to reduce the rate of false alarms while preserving the secure state of the system. The probability of evading the intrusion detection system can be reduced as the stealthy intrusions are taken into account during the analysis. Classification is used to build normal profiles offline, and clustering is used to build clusters of online activity data instances and discover the existence of new intrusions and normal profiles. This work will be extended by building a prototype of the global anomaly analysis engine and the local anomaly detection engine and implementing the clustering algorithm. A new approach for fast attack detection has been presented. Such strategy has been realized by using a new design for time delay neural networks. Theoretical computations have shown that FTDNNs require fewer computation steps than conventional ones. This has been achieved by applying cross correlation in the frequency domain between the incoming serial data and the input weights of time delay neural networks. Simulation results have confirmed this proof by using MATLAB. Furthermore, the memory complexity has been reduced when using the fast neural algorithm. In addition, this algorithm can be combined in any Anti-attack gateway software.
References [1] R. Bace and P. Mell, "Intrusion Detection Systems" NIST Special
Publication, November 2001. [2] K. Julisch, "Data Mining for Intrusion Detection: A Critical Review",
Applications of Data Mining in Computer Security, Kluwer Academic Publisher, Boston, 2002.
[3] W. Lee, "Applying Data Mining To Intrusion Detection: The Quest For Automation, Efficiency, And Credibility", SIGKDD Explorations, Volume 4, Issue 2, December 2002.
[4] L. Ertöz, E. Eilertson, A. Lazarevic, P. Tan, P. Dokas, V. Kumar, and J. Srivastava, "Detection and Summarization of Novel Network Attacks Using Data Mining", Technical Report, 2003.
[5] M. Hossain and S. M. Bridges, "Adaptive Intrusion Detection With Data Mining", In Proceedings of the 2003 IEEE international conference on systems, man & cybernetics (SMC'03) Washington, D.C., October 2003.
[6] W. Lee, S. Stolfo, P. Chan, E. Eskin, W. Fan, M. Miller, S. Hershkop, and J. Zhang, "Real Time Data Mining-based Intrusion Detection", In DARPA Information Survivability Conference and Exposition II, June 2001.
[7] W. Lee, R. A. Nimbalkar, K. K. Yee, S. B. Patil, P. H. Desai, T. T. Tran, and S. J. Stolfo, "A Data Mining And CIDF Based Approach
For Detecting Novel And Distributed Intrusions", In Proceedings of the 3rd International Workshop on Recent Advances in Intrusion Detection, October 2000.
[8] X. Li and N. Ye, "Decision tree classifiers for computer intrusion detection", Journal of Parallel and Distributed Computing Practices, Volume 4, No. 2, 2001.
[9] D. Barbara, N. Wu, and S. Jajodia, “Detecting Novel Network Intrusions Using Bayes Estimators”, Proceedings Of the First SIAM Int. Conference on Data Mining (SDM 2001), Chicago, 2001.
[10] R. Smith, A. Bivens, M. Embrechts, C. Palagiri, and B. Szymanski, "Clustering Approaches for Anomaly Based Intrusion Detection", to be submitted to The First Annual Walter Lincoln Hawkins Graduate Research Conference, Troy, New York, October 2002.
[11] M. H. Arshad and P. K. Chan, "Identifying Outliers via Clustering for Anomaly Detection", Technical Report, 2003.
[12] L. Portnoy, E. Eskin, and S. Stolfo, "Intrusion Detection With Unlabeled Data Using Clustering", In ACM Workshop on Data Mining Applied to Security (DMSA 2001), November 2001.
[13] X. Li and N. Ye, "Grid and Dummy Cluster Based Learning of Normal and Intrusive Clusters for Computer Intrusion Detection", Quality and Reliability Engineering International, Vol. 18, No. 3, 2002.
[14] H. Shah, J. Undercoffer and A. Joshi, "Fuzzy Clustering for Intrusion Detection", Proceedings of the 12th IEEE International Conference on Fuzzy Systems, April 2003.
[15] Y. Guan, N. Belacel, and A. A. Ghorbani, "Y-means: a clustering method for Intrusion detection", Canadian Conference on Electrical and Computer Engineering, Montreal, Canada, May 2003.
[16] Lincoln Laboratory ID Evaluation Website, MIT, http://www.ll.mit.edu/IST/ideval/index.html.
[17] H. M. El-Bakry, "New Faster Normalized Neural Networks for Sub-Matrix Detection using Cross Correlation in the Frequency Domain and Matrix Decomposition," Applied Soft Computing journal, vol. 8, issue 2, March 2008, pp. 1131-1149.
[18] J. W. Cooley, and J. W. Tukey, "An algorithm for the machine calculation of complex Fourier series," Math. Comput. 19, 297–301 (1965).
[19] R. Klette, and Zamperon, "Handbook of image processing operators, " John Wiley & Sonsltd, 1996.
[20] A. Hirose, “Complex-Valued Neural Networks Theories and Applications”, Series on innovative Intellegence, vol.5. Nov. 2003.
[21] S. Jankowski, A. Lozowski, M. Zurada, “ Complex-valued Multistate Neural Associative Memory,” IEEE Trans. on Neural Networks, vol.7, 1996, pp.1491-1496.
[22] A. M. Riad, M. M. Fahmy and M. A. El-Sharkawy, " An Architecuture for Mining the Egyptian E-Government Network traffic for Intrusion Detection", International Conference on Information and Communication Technology (ICICT 2005), pp. 593-603, Information Technology Institute, Cairo, Egypt, December, 2005.
[23] A. M. Riad and M. M. Fahmy, " Intrusion Detection System Based on Data Mining techniques", Egyption Informatics Journal, Faculty of Computers and Information, Vol. 7, No 2, Cairo Univ., December 2006.
WSEAS TRANSACTIONS on COMMUNICATIONS Hazem M. El-Bakry, Nikos Mastorakis
ISSN: 1109-2742 1228 Issue 12, Volume 7, December 2008
Sensor
Fig. 1: The local normal profiles building phase.
Preprocessing and Feature Extraction Engine
Correctly Classified Data Instances
Local Profile Classification Engine
Formatted Traffic Data
Traffic Data
Profile Rules Building Engine
Traffic Database
Relevant Attributes
Formatted Traffic Data
Local System Profile Matching Engine
Profile Rules
WSEAS TRANSACTIONS on COMMUNICATIONS Hazem M. El-Bakry, Nikos Mastorakis
ISSN: 1109-2742 1229 Issue 12, Volume 7, December 2008

GlobalSensor
U n l a b e l e d T r a f f i c D a t a
Formatted Traffic Data
Traffic Data
Known Attacks
Preprocessing Engine
Layer of Intrusion Detection System
Global Response Engine
Highly Suspicious Anomalies
Known Attacks
New Attacks Rules
Global Known-Attacks Detection Engine
Global Anomaly Analysis Engine
Attacks Database
High-R
anked Anom
alies
New Normal Profile Rules
Local Site n
Local Layer of Intrusion Detection System
Normal Data Records
Local System-Profile Matching Engine
Local Response Engine
Normal Records
High-Ranked Anomalies
Anomalous Data Records
Local Anomaly Detection Engine Normal Profile
Database
Local Site 1
Fig. 2. The architecture of the real-time detection phase.
WSEAS TRANSACTIONS on COMMUNICATIONS Hazem M. El-Bakry, Nikos Mastorakis
ISSN: 1109-2742 1230 Issue 12, Volume 7, December 2008
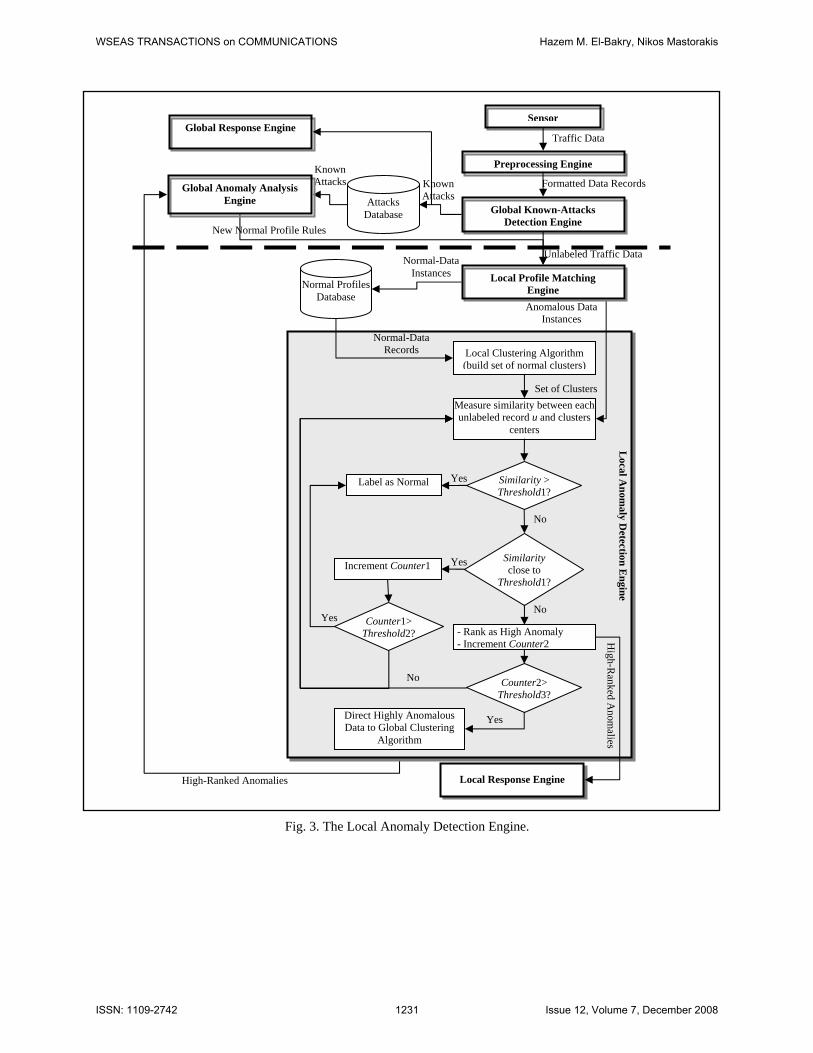
Fig. 3. The Local Anomaly Detection Engine.
Unlabeled Traffic Data
Global Response Engine
Local Response Engine
Known Attacks
Measure similarity between each unlabeled record u and clusters
centers
Local Clustering Algorithm (build set of normal clusters)
Set of Clusters
Similarity > Threshold1?
Yes
No
Similarity close to
Threshold1?
Label as Normal
Increment Counter1 Yes
- Rank as High Anomaly - Increment Counter2
NoCounter1>
Threshold2?Yes
Counter2> Threshold3?
Direct Highly Anomalous Data to Global Clustering
Algorithm
High-Ranked Anomalies
High-R
anked Anom
alies
Normal-Data Records
Yes
Local A
nomaly D
etection Engine
New Normal Profile Rules
Global Anomaly Analysis Engine
Sensor
Traffic Data
Local Profile Matching Engine
Global Known-Attacks Detection Engine
Preprocessing Engine
Known AttacksAttacks
Database
Normal Profiles Database
Anomalous Data Instances
Normal-Data Instances
Formatted Data Records
No
WSEAS TRANSACTIONS on COMMUNICATIONS Hazem M. El-Bakry, Nikos Mastorakis
ISSN: 1109-2742 1231 Issue 12, Volume 7, December 2008
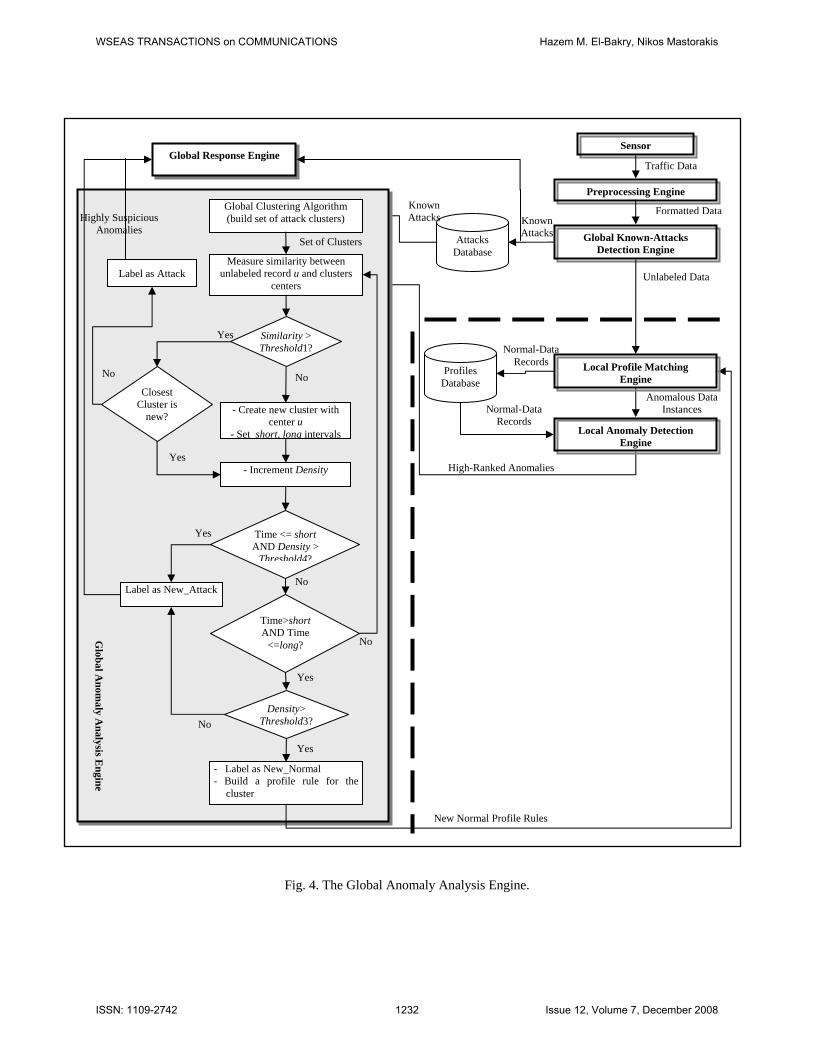
Fig. 4. The Global Anomaly Analysis Engine.
Global Response Engine
Formatted DataKnown Attacks
Local Anomaly Detection Engine
High-Ranked Anomalies
Normal-Data Records
New Normal Profile Rules
Global Clustering Algorithm (build set of attack clusters)
Measure similarity between unlabeled record u and clusters
centers
Similarity > Threshold1?
- Create new cluster with center u
- Set short, long intervals
Time <= short AND Density >
Threshold4?
Density> Threshold3?
- Label as New_Normal - Build a profile rule for the
cluster
Set of Clusters
Label as New_Attack
Yes
Yes
Yes
Yes
No
No
No
Global A
nomaly A
nalysis Engine
Sensor
Local Profile Matching Engine
Global Known-Attacks Detection Engine
Traffic Data
Preprocessing Engine
Unlabeled Data
Known AttacksAttacks
Database
Profiles Database
Anomalous Data Instances
Normal-Data Records
Highly Suspicious Anomalies
Label as Attack
Closest Cluster is
new?
- Increment Density Yes
No
Time>short AND Time
<=long? No
WSEAS TRANSACTIONS on COMMUNICATIONS Hazem M. El-Bakry, Nikos Mastorakis
ISSN: 1109-2742 1232 Issue 12, Volume 7, December 2008

The clustering algorithm in local anomaly detection engine: • Input: a data instance d, a set of clusters C representing normalcy, a
closeness range r, and a similarity threshold S. • Algorithm:
– Measure distance (d, Ci) for i = 1, …, n. – If (distance (d, Ci) ≥ S), d fits within Ci, so it is given the label of Ci (or
its majority label). – If (distance (d, Ci) < S),
• If (S - distance (d, Ci) < r), d is considered deviation from normal cluster Ci,
• counter1++ • If (counter1>threshold)
• Ci = Ci + { d } • Compute new Ci representative
• Else If (S - distance (d, Ci) >> r), d is considered an anomaly, • A = A + { d } • Send A to local response engine • counter2++ • If (counter2>threshold)
• Send A to global anomaly analysis engine
Fig. 5. The clustering algorithm in local anomaly detection engine.
The clustering algorithm in global anomaly analysis engine:• Input: an anomaly cluster As for site s, a set of clusters CA representing
known attacks, and a similarity threshold S. • Algorithm:
– Initialize time windows short, long – For each u ∈ As, Measure distance (u, CA). – If (distance (u, CA) ≥ S), u fits within CA, so it is given the label of CA
(or its majority label). • CA = CA + { u } • Send u to global response engine
– Else If (distance (u, CA) < S), • Create a new cluster CAnew • CAnew = CAnew +{ u } • densityCAnew ++
– For each CAnew • If (Time ≤ short AND densityCAnew > threshold)
• CAnew is a new attack, CA = CA + { CAnew } • Else If (Time > short AND Time ≤ long)
• If (densityCAnew > threshold) • Label CAnew as new normal profile
• Else • CAnew is a new stealthy attack, CA = CA + { CAnew }
Fig. 6. The clustering algorithm in global anomaly analysis engine.
WSEAS TRANSACTIONS on COMMUNICATIONS Hazem M. El-Bakry, Nikos Mastorakis
ISSN: 1109-2742 1233 Issue 12, Volume 7, December 2008

1155843
8835 36 1092 429 186 183 21 10370
150000
300000
450000
600000
750000
900000
1050000
1200000
Normal ps
send
sshtr
ojan
xsno
op
gues
stelne
t
ftpwrite
ports
weepse
cret
Class
# of
pac
kets
Fig.7. Normal vs. attack classes in week 4 of the DARPA 1999 dataset.
WSEAS TRANSACTIONS on COMMUNICATIONS Hazem M. El-Bakry, Nikos Mastorakis
ISSN: 1109-2742 1234 Issue 12, Volume 7, December 2008