network intrusion detection: monitoring, simulation and
TRANSCRIPT

University of Central Florida University of Central Florida
STARS STARS
Electronic Theses and Dissertations, 2004-2019
2005
Network Intrusion Detection: Monitoring, Simulation And Network Intrusion Detection: Monitoring, Simulation And
Visualization Visualization
Mian Zhou University of Central Florida
Part of the Computer Sciences Commons, and the Engineering Commons
Find similar works at: https://stars.library.ucf.edu/etd
University of Central Florida Libraries http://library.ucf.edu
This Doctoral Dissertation (Open Access) is brought to you for free and open access by STARS. It has been accepted
for inclusion in Electronic Theses and Dissertations, 2004-2019 by an authorized administrator of STARS. For more
information, please contact [email protected].
STARS Citation STARS Citation Zhou, Mian, "Network Intrusion Detection: Monitoring, Simulation And Visualization" (2005). Electronic Theses and Dissertations, 2004-2019. 520. https://stars.library.ucf.edu/etd/520

Network Intrusion Detection: Monitoring, Simulation andVisualization
by
Mian ZhouB.E. Beijing University, 1998
M.S. University of Central Florida, 2001
A dissertation submitted in partial fulfillment of the requirementsfor the degree of Doctor of Philosophy
in the School of Computer Sciencein the College of Engineering and Computer Science
at the University of Central FloridaOrlando, Florida
Summer Term2005
Major Professor:Sheau-Dong Lang

c© 2005 by Mian Zhou

Abstract
This dissertation presents our work on network intrusion detection and intrusion sim-
ulation. The work in intrusion detection consists of two different network anomaly-based
approaches. The work in intrusion simulation introduces a model using explicit traffic gen-
eration for the packet level traffic simulation.
The process of anomaly detection is to first build profiles for the normal network activity
and then mark any events or activities that deviate from the normal profiles as suspicious.
Based on the different schemes of creating the normal activity profiles, we introduce two
approaches for intrusion detection. The first one is a frequency-based approach which creates
a normal frequency profile based on the periodical patterns existed in the time-series formed
by the traffic. It aims at those attacks that are conducted by running pre-written scripts,
which automate the process of attempting connections to various ports or sending packets
with fabricated payloads, etc. The second approach builds the normal profile based on
variations of connection-based behavior of each single computer. The deviations resulted
from each individual computer are carried out by a weight assignment scheme and further
used to build a weighted link graph representing the overall traffic abnormalities. The
functionality of this system is of a distributed personal IDS system that also provides a
iii

centralized traffic analysis by graphical visualization. It provides a finer control over the
internal network by focusing on connection-based behavior of each single computer.
For network intrusion simulation, we explore an alternative method for network traffic
simulation using explicit traffic generation. In particular, we build a model to replay the
standard DARPA traffic data or the traffic data captured from a real environment. The
replayed traffic data is mixed with the attacks, such as DOS and Probe attack, which can
create apparent abnormal traffic flow patterns. With the explicit traffic generation, every
packet that has ever been sent by the victim and attacker is formed in the simulation model
and travels around strictly following the criteria of time and path that extracted from the
real scenario. Thus, the model provides a promising aid in the study of intrusion detection
techniques.
iv

Dedicated to my parents.
v

Acknowledgments
My deepest thanks to my advisor Dr. Sheau-Dong Lang for his guidance, encouragement
and support, I am very fortunate to have an opportunity to work with him during my long
Ph.D. time.
During my research, I have benefited from interactions with many people. I would like
to thank Dr. Morgan Wang for many illuminating discussions.
Most of all, I am deeply grateful to my parents for supporting my study for over twenty
years. Also, I would like to thank my husband Jiangjian Xiao, who gives his endless support
and encouragement and I would not have come this far if without him.
vi

Table of Contents
LIST OF TABLES . . . . . . . . . . . . . . . . . . . . . . . . . . . . . . . . . . . xi
LIST OF FIGURES . . . . . . . . . . . . . . . . . . . . . . . . . . . . . . . . . . xii
CHAPTER 1 INTRODUCTION . . . . . . . . . . . . . . . . . . . . . . . . . 1
1.1 PROBLEM STATEMENT . . . . . . . . . . . . . . . . . . . . . . . . . . . . 3
1.2 OUR APPROACH FOR NETWORK INTRUSION DETECTION AND SIM-
ULATION . . . . . . . . . . . . . . . . . . . . . . . . . . . . . . . . . . . . . 4
1.3 DISSERTATION OVERVIEW . . . . . . . . . . . . . . . . . . . . . . . . . . 6
CHAPTER 2 SECURITY OF THE INTERNET . . . . . . . . . . . . . . . 7
2.1 PENETRATION FROM THE PERSPECTIVE OF ATTACKERS . . . . . . 7
2.2 ATTACK TAXONOMY . . . . . . . . . . . . . . . . . . . . . . . . . . . . . 9
2.3 INTRUSION DETECTION BACKGROUND AND TAXONOMY . . . . . . 17
2.3.1 Data Collection . . . . . . . . . . . . . . . . . . . . . . . . . . . . . . 19
CHAPTER 3 RELATED WORK . . . . . . . . . . . . . . . . . . . . . . . . . 22
3.1 INTRUSION DETECTION . . . . . . . . . . . . . . . . . . . . . . . . . . . 22
vii

3.1.1 Host-based Intrusion Detection . . . . . . . . . . . . . . . . . . . . . 23
3.1.2 Attack Type Specific Intrusion Detection . . . . . . . . . . . . . . . . 25
3.1.3 Network-based Intrusion Detection . . . . . . . . . . . . . . . . . . . 32
3.1.4 Data Mining Approach for Network Intrusion Detection . . . . . . . . 34
3.2 INTRUSION TRAFFIC SIMULATION AND MODELING . . . . . . . . . . 37
3.2.1 Simulators . . . . . . . . . . . . . . . . . . . . . . . . . . . . . . . . . 40
CHAPTER 4 MINING NETWORK TRAFFIC FOR INTRUSION PAT-
TERNS . . . . . . . . . . . . . . . . . . . . . . . . . . . . . . . . . . . . . . . . . . 41
4.1 IMPLEMENTATION OF NITA . . . . . . . . . . . . . . . . . . . . . . . . . 42
4.2 A FREQUENCY-BASED APPROACH FOR INTRUSION DETECTION . 45
4.2.1 Motivation and Goal . . . . . . . . . . . . . . . . . . . . . . . . . . . 46
4.2.2 Frequency Analysis of Time-series . . . . . . . . . . . . . . . . . . . . 48
4.2.3 Results on Synthetic Data . . . . . . . . . . . . . . . . . . . . . . . . 55
4.2.4 Summary . . . . . . . . . . . . . . . . . . . . . . . . . . . . . . . . . 68
4.3 MORE EXPERIMENTAL RESULTS BY NITA . . . . . . . . . . . . . . . . 69
4.3.1 PortSweep . . . . . . . . . . . . . . . . . . . . . . . . . . . . . . . . . 69
4.3.2 Unidentified Attack from Real Data . . . . . . . . . . . . . . . . . . . 72
4.3.3 GuessTelnet Attack . . . . . . . . . . . . . . . . . . . . . . . . . . . . 73
viii

CHAPTER 5 WEIGHTED LINK GRAPH: A DISTRIBUTED PERSONAL
IDS FOR LAN . . . . . . . . . . . . . . . . . . . . . . . . . . . . . . . . . . . . . . 76
5.1 MOTIVATION . . . . . . . . . . . . . . . . . . . . . . . . . . . . . . . . . . 77
5.2 RELATED WORK . . . . . . . . . . . . . . . . . . . . . . . . . . . . . . . . 79
5.3 CONNECTION-BASED BEHAVIOR ANALYSIS . . . . . . . . . . . . . . . 81
5.3.1 Weight Assignment . . . . . . . . . . . . . . . . . . . . . . . . . . . . 83
5.4 WEIGHTED LINK GRAPH . . . . . . . . . . . . . . . . . . . . . . . . . . . 89
5.4.1 System Functionality . . . . . . . . . . . . . . . . . . . . . . . . . . . 89
5.4.2 Graph Construction . . . . . . . . . . . . . . . . . . . . . . . . . . . 90
5.4.3 Graph Drawing . . . . . . . . . . . . . . . . . . . . . . . . . . . . . . 93
5.4.4 Weight Vectors . . . . . . . . . . . . . . . . . . . . . . . . . . . . . . 95
5.4.5 Intrusion Patterns . . . . . . . . . . . . . . . . . . . . . . . . . . . . 101
5.4.6 Possible Responses for Overweight . . . . . . . . . . . . . . . . . . . 103
5.5 WHY WEIGHT CHANGES . . . . . . . . . . . . . . . . . . . . . . . . . . . 104
5.6 EXPERIMENTAL RESULTS . . . . . . . . . . . . . . . . . . . . . . . . . . 106
5.6.1 The Size of Working Sets . . . . . . . . . . . . . . . . . . . . . . . . . 106
5.6.2 Swapping Rate . . . . . . . . . . . . . . . . . . . . . . . . . . . . . . 109
5.6.3 Stealthy Intrusions . . . . . . . . . . . . . . . . . . . . . . . . . . . . 113
5.7 CONCLUSIONS . . . . . . . . . . . . . . . . . . . . . . . . . . . . . . . . . 115
ix

CHAPTER 6 SIMULATION OF NETWORK INTRUSION . . . . . . . . 117
6.1 SIMULATION OF INTRUSION BY OPNET . . . . . . . . . . . . . . . . . 119
6.1.1 Simulation Models Using OPNET . . . . . . . . . . . . . . . . . . . . 120
6.1.2 Analysis of OPNET Simulation Results . . . . . . . . . . . . . . . . . 125
6.2 CONCLUSIONS . . . . . . . . . . . . . . . . . . . . . . . . . . . . . . . . . 130
CHAPTER 7 CONCLUSIONS . . . . . . . . . . . . . . . . . . . . . . . . . . . 132
7.1 SUMMARIES . . . . . . . . . . . . . . . . . . . . . . . . . . . . . . . . . . . 132
7.2 LIMITATIONS AND FUTURE WORK . . . . . . . . . . . . . . . . . . . . 134
REFERENCES . . . . . . . . . . . . . . . . . . . . . . . . . . . . . . . . . . . . . . 136
x

LIST OF TABLES
4.1 DOS and Probe Attacks in 1999 week 5 and week 4 DARPA evaluation data. 64
5.1 The connections with internal IP address collected in a week . . . . . . . . . 85
5.2 The connection observation between a desktop and an internal server: long-
wood.cs.ucf.edu . . . . . . . . . . . . . . . . . . . . . . . . . . . . . . . . . . 86
5.3 The algorithm for building G . . . . . . . . . . . . . . . . . . . . . . . . . . . 92
5.4 The algorithm for determine the size of screen set S . . . . . . . . . . . . . . 98
5.5 The components of a feature vector within a screen unit . . . . . . . . . . . 98
5.6 The session collected for bootStrap service for internal server: *.*.107.109 . . 100
5.7 The eight statistical features used for calculating W3 for UDP services. . . . 116
5.8 Column 2 is the Mahalanobis distance for traffic to a DNS server, column 3
is the Mahalanobis distance for Netbios Name services traffic. The first 10
sessions are normal ones while the last two are from a port sweep. . . . . . . 116
xi

LIST OF FIGURES
2.1 DDOS attack and RDDOS attack . . . . . . . . . . . . . . . . . . . . . . . . 13
2.2 Intrusion detection system taxonomy . . . . . . . . . . . . . . . . . . . . . . 17
4.1 The menu-based interface of the NITA . . . . . . . . . . . . . . . . . . . . . 42
4.2 The visualization results from the NITA . . . . . . . . . . . . . . . . . . . . 43
4.3 The feature selection panel of the NITA . . . . . . . . . . . . . . . . . . . . 44
4.4 Overall Structure of frequency-based detection . . . . . . . . . . . . . . . . 50
4.5 Va, Vb are the heights of valleys, W is width of peak, P is the height of peak,
N is the area between Va and Vb covered by the peak. . . . . . . . . . . . . . 55
4.6 The frequency pattern on inter-arrival time of each connection for Proc-
cessTable attack. . . . . . . . . . . . . . . . . . . . . . . . . . . . . . . . . . 58
4.7 The frequency pattern of Ping of death. (a) Frequency on inter-arrival time.
(b) Frequency on packets0.005 seconds. . . . . . . . . . . . . . . . . . . . . . 59
4.8 (a) The local frequency pattern on inter-arrival-time for the first 9 connections
of portsweep attack. (b) The global frequency pattern on inter-arrival time of
portsweep attack, which includes 18 connections. . . . . . . . . . . . . . . . 59
xii

4.9 The frequency pattern on inter-arrival time of each connection for Dictionary
attack. . . . . . . . . . . . . . . . . . . . . . . . . . . . . . . . . . . . . . . . 60
4.10 Frequency analysis on packet rates for sshprocessTable attack . . . . . . . . 62
4.11 The frequency pattern on inter-arrive time of each connection for sshProc-
cessTable attack. Connection 2 is the attack traffic. . . . . . . . . . . . . . . 63
4.12 The intrusion patterns analysis by NITA for portsweep attack, data source:
Monday,L1999w5, the duration of attack is about 222 seconds . . . . . . . . 70
4.13 The patterns analysis presented as (a) frequency on packet inter-arrival time,
(b) Distribution on packet size ports, (c) and (d) Distribution of ports in-
volved, where shows a wide range of ports have been explored compare to
normal traffic . . . . . . . . . . . . . . . . . . . . . . . . . . . . . . . . . . . 71
4.14 The intrusion patterns analysis by NITA for unknown sweep attack in the real
traffic, the duration of this attack is about 5 seconds . . . . . . . . . . . . . 72
4.15 The patterns analysis presented as (a) frequency on packet rate, (b) distribu-
tion on source ports, (c) distribution on destination ports . . . . . . . . . . . 73
4.16 The detailed drill down feature analysis suggests the attacker might have
launched 17 threads to request TCP connection with the victim, those 17
TCP connections have very similar statistical features with each other, such
as the number of packets sent, traffic load, duration, etc. . . . . . . . . . . . 74
xiii

4.17 The patterns presented as (a) and (b) frequency on packet rate and inter-
arrival time; (c) and (d) distribution of packet size and arrival time; (e) and
(f) distribution of ports involved . . . . . . . . . . . . . . . . . . . . . . . . 75
5.1 The connection categorization . . . . . . . . . . . . . . . . . . . . . . . . . . 83
5.2 The structure of working set for internal connections . . . . . . . . . . . . . 84
5.3 (a)The connections in a small LAN. (b)The layout using Spring Embedder
algorithm . . . . . . . . . . . . . . . . . . . . . . . . . . . . . . . . . . . . . 91
5.4 The circular layout (above) and the layout using Spring Embedder (below). . 93
5.5 The layout using Spring Embedder with edges’ thickness proportional to the
edges weight. . . . . . . . . . . . . . . . . . . . . . . . . . . . . . . . . . . . 94
5.6 The two shapes that indicate the attacks. If the attack is conducted slowly,
the over-weighted connections may not showed together in the graph within
a short time interval. (a) worms spreading. (b) IP sweep. . . . . . . . . . . . 103
5.7 The size of OUT-external . . . . . . . . . . . . . . . . . . . . . . . . . . . . 107
5.8 The normal size of OUT-internal with removal interval of 10 seconds. . . . . 108
5.9 Least frequently visited replacement with different removal intervals. . . . . . 108
5.10 Least recently visited replacement with different removal intervals. . . . . . . 109
5.11 The size of OUT-internal when sweep attacks with different speeds are present.109
5.12 A difficult case with legitimate FTP bulk data transfer which opens many ports.110
xiv
5.13 The Swap Rate of Screen Unit . . . . . . . . . . . . . . . . . . . . . . . . . 110
5.14 A common case of traffic between a workstation and an internal server, where
number of service vector involved is less than the FTP transfer. . . . . . . . 111
5.15 The swapping rate as the size of screen set increase. . . . . . . . . . . . . . . 112
5.16 The comparison of new connection rate α between Sweep attack and normal traffic.
(a) The top line is the an sweep attack, which scan ports selectively once found an
host is active. The middle line is also an sweep attack, which scan all the ports
once found an host is active. The bottom line corresponds to the new connection
rate of the normal traffic. (b) The swap rate γ of port scan (c) The comparison of
new connection rate α between stealth Sweep attack and normal traffic. (d) The
swap rate γ of a stealth port scan . . . . . . . . . . . . . . . . . . . . . . . . . 114
6.1 The network model simulating Dosnuke intrusion . . . . . . . . . . . . . . . 122
6.2 The packet generator (a) The node structure of the packet generator (b) The
attribute panel of ”pk generator” . . . . . . . . . . . . . . . . . . . . . . . . 123
6.3 Process domain and code domain (a) The structure of the virtual PC in pro-
cess domain (b) The code implemented for each process node. . . . . . . . . 124
6.4 IP address Distribution of data packets . . . . . . . . . . . . . . . . . . . . . 125
6.5 (a)The inbound traffic of the firewall (b) The overall network traffic during
the simulation period . . . . . . . . . . . . . . . . . . . . . . . . . . . . . . . 126
xv

6.6 The simulation model for ProcessTable attack(left) and The attribute panel of
the packet generator (right), with scripted packet inter-arrival times calculated
from pre-processing the source data . . . . . . . . . . . . . . . . . . . . . . . 127
6.7 The port access pattern of ProcessTable attack (a)Number of distinct port
connections to victim (b) Data traffic to Port 25 of the victim PC . . . . . . 128
6.8 Simulation time (a) OPNET simulation time of the Dosnuke attack (b) OP-
NET simulation time of the ProcessTable attack . . . . . . . . . . . . . . . . 129
xvi
CHAPTER 1
INTRODUCTION
Network security is an extremely broad area involving many fields of computer technology,
and the new security issues continue to emerge with the new computer technology. Although
there are different definitions for network security, it could be generally defined from the
following three aspects [48]:
• Confidentiality: prevention of unauthorized disclosure of information
• Integrity: prevention of unauthorized modification of information
• Availability: prevention of unauthorized withholding of information or resources
Loss of confidentiality happens when information is read or copied by someone not autho-
rized to do so. Confidentiality is a very important concern for many types of information,
such as personal private information, client’s financial records, research data, commercial
product specifications and military/government related information. It is often mandatory
for businesses in the areas of bank and loan, hospitals, medical research centers and psycho-
logical counseling to maintain the information confidentiality.
1

Loss of integrity happens when the information is modified unexpectedly, which could be
done either directly by an intruder or by the victims who are trapped by the intruder. The
information that is damaged or becomes inaccessible results in the loss of availability. This
often happens to Internet service providers. Their service becomes inaccessible when the
network is stuffed with attacking traffic and the servers are exhausted by malicious requests.
In order to maintain the confidentiality, integrity and availability of the network resources,
a variety of technologies have been created and developed to satisfy the different needs.
Gradually, they forms the branches fulfilling the whole network security technology. These
branches includes computer forensics, encryptions, intrusion detection/prevention, storage
and backup system, secure protocols, digital certification, secure network devices, firewalls,
authentications, hackers and attacks, etc.
Among different formats of violation of the network security, Internet attack becomes
a leading cause for the break-down of network system. Starting from the first automated
network attack, Morris at 1988, the number of reported attack incidents has increased from
6 in 1988 to 137,529 in 2003 [1]. The variety and the quality of the attack techniques have
bloomed in the recent years. The public accessibility of these techniques makes the actual
attacking action happen more easily and frequently . In the 1980s, intruders had to be system
experts to break into a computer, nowadays, ordinary Internet surfers can attack a network
using easily downloaded tools. Based on CERT, the number of reported vulnerabilities per
year increased by almost 1,500% from 1998 to 2002 and the number of reported computer
security incidents per year increased by almost 2,100% from 1998 to 2002 [1].
2

The existence of system vulnerabilities is unavoidable simply because of human nature.
As long as human being make mistakes, such as the misconfigured system, bugs in the codes,
poorly designed network architecture, security violations will continue to exist. In fact, many
of these system vulnerabilities are discovered only after being attacked. Predictably, the
battle between the defense and offense parts will be more intense and difficult in the future.
1.1 PROBLEM STATEMENT
We are interested in finding ways to detect the intrusions/attacks. More specifically, our
task is to develop a defense system that could detect the intrusions from the network traffic
without the prior knowledge on the intrusion signature. A common approach for detecting
the anomaly intrusions is to build the model for normal traffic and flag any deviations that
are potentially caused by intrusions. However, the overall Internet traffic is extremely erratic
and heavy for any efficient analysis. Our goal is to narrow down the global traffic into the
connection behaviors of a single host and to build a functional model for normal behaviors
in order to make the detection process more prompt without many false positives.
As we attempt to catch an attack by developing an appropriate model for normal traffic,
we also extend our attention to abnormal traffic created by an attack. Thus, the other goal
of this dissertation is to learn the abnormal traffic by simulating the attacks. Intrusion simu-
lation and modeling of DOS and worms have been recently studied in the demand of defense.
Nevertheless, the most current attack simulations focus on the analytical models, which can
3

not generate the explicit traffic at the packet level for the accurate attack simulation. In our
work, we intend to explore the possibility and soundness of simulating attack traffic at the
packet level using simulation software.
1.2 OUR APPROACH FOR NETWORK INTRUSION
DETECTION AND SIMULATION
Our work includes network intrusion detection and simulation. The contributions that we
have made for network intrusion detection are:
First, we proposed a frequency-based anomaly detection method. It searches for period-
ical patterns in the various time-sequence created by the attack traffic. The method aims
at denial of service attack, Probes and certain other types of attacks. We achieved the good
results with the experiments on DARPA 1999 synthetic data set.
Second, we proposed another novel distributed network anomaly detection system, which
is composed of end user agents and a centralized graphical analyzer. A user agent observes
the behavior change at the connection level of each computer, in particular, the appearance
of new connections and the sudden changes of the once trusted connections. A novel weight
assignment schema is developed within each local agent to quantitatively carry out the local
abnormalities in the format of node weight and link weight. The weight information is, then,
further sent to the central analyzer to build the weighted link graph. The graph generated
4

by the analyzer integrates those otherwise isolated connection abnormalities into a global
map to facilitate the understanding of the intrusion incidents within a LAN.
Therefore, the contributions made by our system are:
• First, our system distributes the intrusion detection process among different computers,
which effectively divide and digest each part of the network activities in parallel.
• Second, our system provides two layers of protection to a LAN, at the first layer,
each agent provides the local intrusion detection as an independent personal IDS, at
the second layer, the central analyzer automatically identifies the attacks that would
create the characteristic graph shapes, and further locates the source of these attacks.
• Finally, a novel weight assignment based on the connection behavior analysis is used
by each agent to report the abnormalities to the central analyzer. These abnormalities
are presented in the weighted link graph by the central analyzer using a spring-based
graph drawing tool, which make the intrusion visualization legible and meaningful.
For the network intrusion simulation, we built a simulation model to simulate the DOS
attack traffic using the explicit traffic generation. The explicit traffic simulation for intrusion
study has rarely been done in other works. Most approaches for intrusion simulation use
analytical traffic simulation, which use global parameters to control the simulation process
and does not provide the functionality to simulate every network packet and their logically
movement. Our work simulates the intrusions using explicit traffic which makes packet level
analysis possible.
5

1.3 DISSERTATION OVERVIEW
The reminder of the dissertation is organized as follows. Chapter 2 gives the necessary
background knowledge on the attack techniques as well as the defense techniques. We first
describe the common attacks and their taxonomy, then introduce the intrusion detection
background and the classification on detection approaches. Chapter 3 reviews the different
work in the area of intrusion detection and simulation. The work for intrusion detection
is organized into four categories: host-based, network-based, attack type oriented and data
mining approaches. Chapter 4.2 presents a frequency-based intrusion detection strategy for
anomaly NID (network intrusion detection). We give the experimental evaluation result using
DARPA 1999 dataset. Chapter 5 introduces a distributed personal IDS, which combines
the traffic visualization and connection-based behavior analysis for the purpose of intrusion
detection. Chapter 6 presents a new approach for the network intrusion simulation, which
uses explicit traffic generation technique to simulate the DOS attack. Chapter 7 gives an
overview on the challenges faced by today’s IDS. In conclusion, we summarize our work and
point out the limitations and future directions.
6

CHAPTER 2
SECURITY OF THE INTERNET
2.1 PENETRATION FROM THE PERSPECTIVE OF
ATTACKERS
We do not have to necessarily share all the perspectives of a hacker; nevertheless, attempting
to understand them is no doubt helpful for the defense. A typical attacking process involves
several phases. First, the attacker will select the potential targets that could be broken into
by scanning IPs. The scanners could fall into two categories. One is used to target at known
system or application vulnerabilities, the other is used for fingerprinting a host, which is
normally launched at the very beginning of an attack to identify the system configuration of
a remote host. Once the necessary system information is collected, the attacker will look for
the known vulnerabilities of this system and use the corresponding exploit to break in. In
the second phase, after breaking into a host, the attacker will first promote his/her system
privileges to the highest level in order to fully control the victim. Then the attacker will
collect any valuable information from the host, and set up a backdoor or a trojan/worm to
7

secretly monitor the compromised host. The last step is to clean up crime scene, where the
attacker will clean up system logs, delete any installation files, and erase the traces due to
the attack action.
Once a host has been compromised, it is up to the attacker when to use it as a zombie
to launch future new attacks. The compromised host could act as a virus/worm transmitter
immediately, or could be kept for a while for future large-scale DDOS attacks toward other
targets. For such reason, personal home computers are less likely to become zombies for the
attacker’s future use, since they are less likely connected to Internet 24 hours a day. How-
ever, the compromising of personal home computers often results in the leaking of personal
confidential information.
The whole attacking process becomes more severe when it is conducted automatically
through a high speed connection, often causing the epidemic of worm spreading. When the
purpose of the attack is simply to make as many computers as possible lose their function-
ality, the clean up phase is skipped by the attacker, but the victim of the attack has been
compromised regardless.
8

2.2 ATTACK TAXONOMY
If we define the network attack as any behavior that is out of the bound of the expected
legal usage of a system through the network, the attacks could be commonly classified into
the following categories:
• Fingerprinting
Fingerprinting, strictly speaking, is not a attack. It is a preparing step to gain enough
system information before the actual attacks take place. The system being finger-
printed could be the operating system of one host or the whole LAN. For the later, the
network topology, the type of routers and the existing of the firewall are the valuable
information for the hackers too. There are different approaches for fingerprinting. Ac-
tive IP packet fingerprinting is to actively send out the carefully crafted packets to the
system, and identify the system information from the response. Passive IP packet fin-
gerprinting is to using sniffers to secretly capture the stream/packets from the target.
[105].
• Email attack
– Email Bombing
Similar to Email spamming, Email bombing could be described as repeatedly re-
ceiving a large amount of same garbage emails. one email is sent out to thousands
of users. The primary risk comes from the email server, when email servers are
9

busy with dealing thousands of trash mails, the normal email services for the users
are interrupted.
– Email imbedded malicious code or link
In most cases, this type of attacks have the executable script either in the email
attachment, or directly imbedded in Email content. By making use of the flaws
of email software, the executable scripts sometimes will be executed even the
email receiver did not open the attachment. The malicious script imbedded in
email content could be activated when the user read the email using browsers
or softwares that have bugs such as inappropriate handle of email MIME head.
The recent email imbedded malicious code is more tend to be associated with the
worms. Once a computer is infected by the malicious code, the next action of the
code is to spread itself to more users by automatically sending out the email. The
examples of such attacks include ”Melissa”and ”I LOVE YOU”, which used the
Outlook address book or any email address alike informaiton to spread.
• System flaw attack
There are more attacks directed at exploiting the system vulnerabilities than any other
type of attacks. Programming bugs are simply unavoidable. System vulnerability could
be roughly divided into four categories:
– Operating system related bugs, and security weakness.
– Application related bugs and security holes, such as an insecure database system.
10
– Firewall and routers related vulnerabilities.
– Basic Network architecture related bugs and misconfiguration.
The most common system attacks include buffer overflow, Unicode flaw, SQL flaw,
IDQ overflow, IIS bugs, Netbios bugs, Windows XP UPNP flaw, IPC invasion and
windows NULL session attack, etc. For the latest number of all kinds of flaws, go to
”http://cgi.nessus.orgpluginsdump.php3?viewby=family”, check out how many plug-
ins does the one of the best vulnerability scanner, Nessus, provides.
• VirusTrojan attack
In principle, a Trojan is no different from any other remote management tools which
use the server/client mode for communication. The difference of a Trojan is that it
must hide itself from the users of infected computers, and moreover, the advanced
trojans will try to stop the execution or installation of any anti-virus/Trojan software.
• Password attack
Password attack refers to illegal obtaining of any user passwords including system pass-
word, database password, password from the personal profile such as a login password
of a chatting tool, any key code for software installation,etc. Password attack could
be launched remotely in a bruteforce manner to guess a remote login user name and
password. Or it could happen after a user has broken in the system and stole the
password file and decrypted it later.
• DOS/DDOS attack
11

Classical Denial of Service attack could be described as attacks that send an abnormal
high volume of requests to the servers that cause the server resources exhaustion or
service disruption. The victim of a DDOS attack is a typically a service provider or a
government computer. DOS attacks have frequently been seen as the ultimate goal of
worms. Worms first try to infect as many machines as possible, and when the number
of zombies is significantly high to create disrupting traffic, the distributed DOS attack
will happen.
The variety and sophistication of today’s DOS attack is rapidly increasing. DOS at-
tack has been developed from the simplest direct flooding attacks to remote controlled
distributed reflective flooding attacks. In the simplest case, the attacker sends packets
directly from his/her own computer to the target with the amplification factor of one.
In the other words, for each packet sent by the attacker, one will be received by the
victim. Remote controlled DOS attack will not originate any traffic from attackers’
own machine, instead, attackers will use zombies(the host that has already been com-
promised and fully controlled) to launch the attack. Remote controlled DOS attack
is more efficient than simplest direct flooding when there are many zombies launching
attack simultaneously.
Distributed Reflective flooding makes use of reflectors to amplify each packet being
sent, thus further improve the attacking efficiency. The reflector is defined as any IP
host that will return packets if being sent to a packet [83]. For example, all web servers
12

and DNS servers will return an SYN ACK packet upon receiving an TCP ACK packet.
In the case of the amplification factor is 10, a stream rate of one packet per second sent
by the zombie to reflector will be amplified to 10 packets per second by the reflector.
Master
Zombie
Zombie
Zombie
zombie
DNS reflector
Mail server reflector
ICMP Reflector
Target
A m p l i f i e d a t t a c k t r a f f i c
A m p l i f i
e d a t t a
c k t r
a f f i c
A m p l i f i e d a t t a c k t r a f f i c
Zombie1
Zombie2
Zombie3
Master
Zombie8
Target
C o n t r o l t r
a f f i c t o
Z o m b i e s
C o n t r o l t r a f f i c t o
Z o m b i e s
A t t a c k f r o m z o m b i e s
A t t a c k
f r o m z o
m b i e s
.
.
.
DDOS Attack Reflective DDOS Attack
Figure 2.1: DDOS attack and RDDOS attack
Figure 2.1 illustrates the how the distributed flooding and distributed reflective flooding
attack work.
Except for the method of flooding, there is also DOS staving technique. This type of
DOS attack does not send the high rates of request to the victim so to exhaust the
victim’s resource. Instead, it sends out the low-rate sneaky TCP packet to exploit the
TCP retransmission time-out mechanism [59]. The effect of the attack is that normal
TCP transmissions will be dramatically slowed down due to the synchronization of TCP
flows under the timeout state. This is the latest finding and has not been deployed
13
by real world attackers. Nevertheless, the attacking action would be difficult to detect
since it does not create the apparent abnormal traffic volume.
• Worms
The definition for Internet Worms is “A program or algorithm that replicates itself over
a computer network and usually performs malicious actions, such as using up the com-
puter’s resources and possibly shutting down the system”. A distinct feature of worms
is that it could self-propagate from one host to thousands of other hosts. The recent
worms that have caused severe damages include Melissa in 1999, ”I LOVE YOU” in
2000, Code Red, Nimda in 2001, Simile in 2002, SQL Slammer and Blaster in 2003.
The common medias used by worms to transmit practically could be anything: email,
web browser, open services, modems, instant messenger, chat tools and macros. As far
as these applications have vulnerabilities, they will be explored and used by worms.
One of the important performance evaluators of a worm is its propagation speed. Once
a machine is infected, the nowadays’ worms will generate multiple threads to explore
the next group of potential targets. In the situation where the nearby networks are
highly homogenous, the spreading of worms will soon reach the epidemic level.
• Web imbedded malicious code attack
Web cheating is a very dangerous and sneaky attack method. Attacker does not expose
any way to break into the server itself, it uses passive attack method and aims at those
14

ordinary Internet surfers. Once the victims are trapped in malicious web pages, their
important personal information is damaged and stolen. This type of attack could be
further classified into two categories.
– Cross Site Scripting (CSS)
Cross Site Scripting most likely happens to the dynamic generated web pages–
those pages generated based on user inputs. If the web servers are not careful
in checking the user inputs, malicious users will input some crafted HTML codes
with imbedded scripts to break into the system. More than often, the user input
will be processed by the other applications before the response is returned as a
web page. Thus, any application bugs could potentially be used by the attacker
as well. An example of it is SQL injection. However, the ultimate target of the
attacker is not only the web servers, but also those who visit the web pages. If
those ordinary users trust the website before it is been compromised, they will
continue to download and click ”yes” to every pop-up window from that website
after it is compromised.
– Imitated web page cheating
The attackers set up faked web pages and make the users to visit their delicately
designed traps either by emailing the wrong link or advertising the link in the
chat room, sometimes by creating a wrong web index and providing it to a search
engine. One can imagine how dangerous it is to enter the personal information
and credit card number into a faked web page.
15

The other standard attack classification that is widely used and also used in our work is
by Kendall [55, 4]. The attacks are grouped into five major categories.
• Denial of service (DOS)
The example attacks include: Apache2 arppoison, Back, Crashiis, dosnuke, Land, Mail-
bomb, SYN Flood (Neptune), Ping of Death (POD), Process Table, selfping, Smurf,
sshprocesstable, Syslogd, tcpreset, Teardrop, Udpstorm.
• User to root (U2R)
U2R refers to a class of exploit in which the attacker breaks into the system as the nor-
mal user then eventually completely control the machine as the root user. the example
attacks include anypw, casesen, Eject, Ffbconfig Fdformat, Loadmodule, ntfsdos, Perl,
Ps, sechole, Xterm, yaga.
• Remote to local (R2L)
R2L refers to the exploits that start from remote network-based access which intend
to break into the machine and obtain the user account. Example attacks include:
Dictionary Ftpwrite Guest, Httptunnel, Imap, Named, ncftp, netbus, netcat, Phf,
ppmacro, Sendmail, sshtrojan, Xlock, Xsnoop
• Probes
The example attacks include: insidesniffer, Ipsweep, ls domain,Mscan, NTinfoscan
Nmap, queso, resetscan, Saint, Satan.
16

• data
The example attacks include: Secret.
2.3 INTRUSION DETECTION BACKGROUND AND
TAXONOMY
There are different approaches to the classification of the intrusion detections. Figure 2.2
gives an overview about the intrusion detection system taxonomy. These classifications often
used together to describe an IDS, for example, a network-based anomaly IDS.
Intrusion Detection System
Information/Data source Detection Method Behavior after detection System Structure
Host-based Network-based
Anomaly Detection Signature Detection
Passive Active
Distributed Centralized
Wireless
Time Aspect
Real Time Off-line
IDS IPS
Figure 2.2: Intrusion detection system taxonomy
Based on the methods used, intrusion detection systems are traditionally classified into
anomaly based and signature based intrusion detection. Signature based ID is also referred
as misuse detection, in which the signature of each known attack is modeled in a signature
17
library and if the incoming activity matches the pattern in the signature library, an alarm
will be raised. Signature based detection is not capable of detecting an unknown attack.
Anomaly detection, on the other hand, will model the normal profiles of the system. Any
deviation from the normal behavior will be labelled as suspicious activity. The advantage of
anomaly detection is that it could detect the unknown attack. However, one of the major
disadvantage of the anomaly detection is that the rate of the false alarm is much higher than
the misuse detection.
Regardless of the methods been used for intrusion detection, the IDS could be categorized
into host-based, network-based and wireless-based intrusion detection based on audit data
source.
A host-based IDS is deployed on a protected local system, either it is a workstation or
a server. HIDS monitors the logs and local activities such as running processes, a sequence
of DLL functions or anything that could possibly indicate the trace of a attacking, and
alarm the administrator if find any violations. The implementation of HIDS could be the
combination of signature and rule-based deduction.
Network-based intrusion detection system (NIDS) determines the presence of an intrusion
from the information/data collected from the network traffic. NIDS could also be divided
into signature-based and anomaly-based intrusion detection. Wireless-based IDS detects the
intrusion by analyzing the traffic between mobile entities such as laptop and palm PC.
IDS could also be divided into real-time IDS and off-line IDS based on whether the data
analyzing is done in real time or afterward.
18

Based on system structure, IDS is classified into centralized IDS and distributed IDS.
Centralized IDS collect the data together for the analysis. The location where the actual
analysis is carried out is independent of location of sensor or monitor. Whereas a distributed
IDS will conduct the data analysis at the place where the monitoring takes place. Usually
the number of analyzer is proportional to the number of each monitored components, either
it is a host or a subnet.
Based on the actions that an IDS system take after it detects an attack, IDS is classified
into passive IDS and active IDS. Some literature refers an IDS as a passive system and
an intrusion prevention system (IPS) as a active system. An Intrusion prevention system
is used to actively drop data packets or disconnect connections that contain unauthorise
data. Whereas an passive system only generate the alarms and do not attempt to stop
the attack. Commonly, Intrusion prevention technology is also treated as an extension of
intrusion detection technology. [19].
2.3.1 Data Collection
Data collection is normally a requirement for intrusion anomaly detection using data mining
approach. The type of data that is collected differs dramatically based on whether the
detection technique is host-based or network-based. The data for host-based detection is
especially technique dependent. For a host-based intrusion detection, the audit data mainly
19
comes from all sorts of logs and the user/application behaviors such as system calls, typed
command, DLL function calls etc.
There are a variety of techniques for network anomaly detection. The major approaches
include statistical and protocol analysis, neural network, clustering and other expert systems.
The primary audit data is traffic data. Depending on how to model the normal activity
patterns, the traffic data is reorganized and used differently in different approaches. For
the statistical approach, normal patterns could be built on the collections of traffic features
extracted from the packet level information. Except for the traffic data, other information
such as the network topology and routing tables obtained from routers could be used to
supplement the network-based IDS as well.
There are two methods to collect traffic data. One is to have sensors or sniffers installed
at each node or at the main network gateway, which we referred as passive data collection.
Another method is to ”actively” collect the data by sending packets out and measuring the
responses to the packets. However, active data collect may have significant impact on the
network. Most of the audit data used in our analysis work is collected passively due to the
resource constraint.
Some available public sources of data set are:
• DARPA 1998 and 1999 data sets [5]
• system call trace data from University of New Mexico [8].
• Solaris audit data using basic security module from Sun [17].
20

• Data set and virus file from Columbia university [3].
21

CHAPTER 3
RELATED WORK
In this chapter, we will review the related work in the areas of intrusion detection and
intrusion simulation.
3.1 INTRUSION DETECTION
Intrusion detection has been highlighted as an effective countermeasure for various attacks.
In this section, we review the detection techniques at three different levels. At the first level,
we go over the existing intrusion detection techniques from a general perspective, covering
host-based, network-based, and some type-specific detection techniques. At the next level,
we focus exclusively on the work of network-based techniques. Finally, we concentrate on
work which utilizes the techniques similar to what we use in our research.
22

3.1.1 Host-based Intrusion Detection
Data mining techniques have been widely used for both host-based and network-based intru-
sion detection. Schultz and Eskin in [92] developed a host-based approach which adapted the
data mining technique to detect the malicious executables. An executable file needs to re-
quest system resources to finish it task. System resources includes DLL files, DLL functions,
and other function calls within a DLL. The DLLs called by a malicious executable show
different patterns from those called by the normal executables. Beside the system resources,
the strings extracted from executable code and the binary byte sequences are also used to
distinguish malicious code from the normal ones.
Except for [92], other methods for detecting the abnormal behavior of malicious code
are reported in [44, 46, 58, 93]. These methods build normal profiles using the system
calls executed by programs; the difference lies in how to build the normal profile. The
earliest work in program behavior based intrusion detection is from Stephanie Forrest [44].
Their approach was to build a signature database with each signature composed of a short
sequence of system calls. An alarm is triggered if the execution of a program (application)
creates enough signatures that are different from the ones in the database. The success of this
method brings more attention to the use of system calls as the source for host-based intrusion
detection. Ghosh uses multiple machine learning techniques including neural network and
Elman network to ”learn” the normal program behavior from the system calls and to further
perform anomaly detection [46]. Ko employs another machine learning method: inductive
23

logic programming to build the normal program profile for anomaly detection [58]. Sekar and
Bendre proposed an automatic and efficient method to build a finite-state automaton which
distinguishes anomalous sequence of system calls from legitimate ones [93]. After that, there
was the work developed from mining on system calls to library calls for intrusion detection
[53], in which Joans adopted the technique in [44] to library calls at application level instead
of system calls at the operation system level for the anomaly intrusion detection.
Except for program behavior, the system logs and user behavior are also used for host-
based anomaly detection [23, 39].
Abad showed that many attacks leave traces in different logs, thus correlating the logs
could help to improve the precision of intrusion detection. The logs they used for experiment
include NetFlow log, firewall log, system log, TCPDUMP log, DNS log, authentication log,
web log, mail log and FTP log. Once again, data mining technique is applied to these logs
in generating the rules for intrusion detection [23].
In [39], Coull applied the technique from bioinformatics, specifically, a pare-wise sequence
alignment for the similarity match, to the problem of matching user signatures. A user’s
signature is a sequence of commands produced by a user. An attacker could be identified by
comparing his/her signature with legitimate user’s signature. Another early work that also
conducts the intrusion detection from the perspective of what an illegitimate user’s action
should be is [52]. The differences are that a user’s signature is represented by abstracted
actions instead of commands, and a snapshot of the system status under the effect of user
24

actions is defined as a state. By analyzing the state transitions, Ilgun [52] reported a host-
based intrusion detection system that makes use of user behaviors.
3.1.2 Attack Type Specific Intrusion Detection
In this section, we review the techniques that are specially designed for certain type of attacks
including DOS, worms, backdoor, and Probes.
3.1.2.1 DOS
DOS/DDOS attack has been a type of attack that cause relatively apparent traffic abnor-
mality. Due to its easy deployment and devastating outcome for the victim, DOS attack has
attracted a lot of attentions from the defenders as well as attackers. At the attacker side,
the technique of DOS is developed from a single launch to multiple launches, and finally to
reflexive multiple launches. At the defense side, a variety of techniques have been developed
to counter it [43, 112, 34, 96, 36, 68].
In [43], Feinstein and Schnackenberg detect the DOS by measuring the statistical prop-
erties of specific fields in the packet headers. Specifically, they took Entropy value and
Chi-square value of certain fields of packet header to measure the randomness of the distri-
25

bution of that field (such as source IP). Those values of DOS traffic would fall outside the
range of normal value from the legitimate traffic.
Using spectral analysis for the purpose of intrusion detection is appeared only in recent
years. Cheng [36] explores the fact that under the normal situation of the TCP protocol, a
source will wait to send the next group of packets until the it has received the acknowledge
on the last group of packets (group size is based on sliding windows size). Thus, the packets
are roughly transmitted every round-trip time. This is created by the fundamental behavior
of TCP: to be reliable. In the contrast, a DOS attacker would not care if the destination has
received the last packet and continue to send the packets regardlessly. Therefore, a normal
TCP flow will have stronger periodicity in the packet arrivals, while an abnormal TCP flow
will not. Based on this observation, Cheng applied power spectral density analysis on the
signal of packet arrivals, and the result of it indicates how strong the periodicity it. The
signal with less strong periodicity is marked as suspicious.
Gil and Poletto [47] proposed another DOS detection strategy that is based on the ob-
servation that during the attack, the packet rate of ongoing traffic is disproportional to that
of incoming traffic. By monitoring the packet rate at the routers as near as possible to the
attacker, their system, MULTOPS, is expected to stop the attack before they cause the ac-
tual harm. Gil and Poletto’s approach is essentially a network-based approach that employed
statistical analysis on network traffic for DOS attack. We will introduce more network-based
and statistical-based IDS in the following sections.
26

The countermeasures to DOS attack are not restricted to the context of general networks.
Morein [77] designed a DOS defense strategy with an overlay network as the background.
The original idea is from Keromytis [57]. As a novel application of the overlay network
in the area of network security, they proposed ”SOS”, which creates a new mechanism for
preventing the DOS attacks by making redundancies in the overlay. Different from the
traditional passive detection approach for a DOS attack, ”SOS” will not do anything when
detecting the malicious DOS traffic and will not attempt to disable the source of the attack.
Instead, SOS adopts the proactive approach which opens the door for the attacks, but tries
to moderate the attack effect and reduce the possibility of the success attacks by making
enough duplication of overlay nodes, namely SOAP, Beacon and Secret Servlet nodes, and
to eliminate the ”pinch’ points. In addition, they utilize the Chord routing mechanism to
quickly recover from the nodes failure upon the attack. Another DOS detection strategy
that is grounded on the overlay network is [25]. Andersen made modifications to SOS model
so that the new model is more reflexive and has better performance. A main improvement
is to separate the routing and the packet filtering. In the original SOS model, the filtering is
done by the routers that are set in the deny mode which protects the target from any other
traffic except for the traffic from the secret servlet (SS).
Other anti-DOS approaches focused on SYN flooding attack [68, 96, 85, 112]. A SYN
flooding will open many partially completed connections with a victim, the victim will even-
tually exhaust all its system resources by trying to allocate resources to each half-open con-
nection. Lemon’s approaches [68] for SYN attack is to let the system allocate the resource
27
only to the completed connections (after three-way hand shaking). Second, the receiver
would not allocate the resource but instead send a cryptographic secret ”SYN cookie” to
traffic initiator, where all the TCP options with initial SYN that should be kept by machine
is encoded in the cookie and sent to the network. The idea is to let network ”store” the
state, thus the machine could save the resources for storing the connection state.
The defense mechanisms in [68, 96] are implemented at the place close to or within the
victim machine. Therefore if the defenders are interested at the attack source even it could
come from zombies, the extra IP traceback method such as in [85] will be needed. An
alternative approach (FDS) is to defend the attack at the leaf routers that connect end host
to the Internet [112]. Wang argues that the number of SYN packets and FIN(RST) packets
in normal TCP is, if not equal, close. Whereas the difference between the number of SYNs
and FINS will dramatically increase in a SYN flooding attack. By counting the number of
those flags at the leaf router, they could detect the SYN flood. However, in order to find
the attack source and effectively detect the attack simultaneously, Wang’s FDS has to be
installed at the routers close to the attacker and at the routers close to the victim. Therefore
without the pre-knowledge about where the attacks might come from, the wide deployment
of FDS is required.
28

3.1.2.2 Internet Worms
The propagation of various worms on the Internet has caused widespread damage. Its com-
pletely autonomous spreading has created sensational and disruptive attacking effects as
evident from the recently appeared worms Code Red and Nimda [2]. The efforts of coun-
termeasures have been made in two aspects: First, to analyze the existing worms’spreading.
Second, to defend them [30, 109, 104, 97]. Unfortunately, the analysis conclusions are that
future worm spreading could be worse, and the current defense techniques are not effective
for future worms [78, 100, 35, 113].
In [100], Staniford and Paxson focused on the various target selection techniques that
appeared and could appear in the existing worms and future worms. The target selecting
method directly decides the epidemic speed of worm spreading. If a worm could generate the
target’s IP appropriately, by using the right random number generation algorithm to avoid
the repetition, it could dramatically increase its spreading effects. Staniford and Paxson, even
further proposed serval feasible techniques that, if deployed by the attacker, could increase
the scan rate more. The essential of those techniques, such as permutation scanning, hit-list
scanning, topologically aware, are avoiding the repetitions and invalidate IPs, and try to
infect the nearest host first.
Simulations of worm spreading are reported in [78, 35, 79]. Moore [78] built the simu-
late model with focuses on parameters of reaction time, containment strategy, deployment
scenario. Chen [35] modeled the worms’ propagation under the parameters of number of
29

vulnerable machine, size of hitlist, scanning rate, death rate and patching rate. Both of
their results showed that the spreading of a proper designed worm could be out of control.
On the defense side, Berk [30] observed that during the worm spreading, a relatively high
volume of ICMP host unreachable error messages will be generated than the normal situation
due to the random target IP selection. Thus, it is possible to detect a worm before it reaches
epidemic by monitoring these error messages. Williamson [109] made use of machine locality
property to design a mechanism that could restrict or slow down an already infected machine
from further spreading.
A network-based anomaly detection systems for worms is proposed by Toth and Kruegel’s
[104]. Their system architecture includes a firewall on each host, a traffic monitor for each
local network and a central analyzer. Each traffic monitor collects certain information from
the connection history, such as the number of connection attempts to non-existing host or
non-existing service, which is a good indication of worms presence.
Sidiroglou and Keromytis [97]’s approach is to automatically generate the patches for
the vulnerable software. Their system architecture includes a set of sensors, a detection
engine, a analysis engine for patch generation and also a software update component and a
actual sandbox that running the applications that are supposed to be protected. The patch
is generated heuristically. That is, the code is generated iteratively until a version of the
application that resistant to the worm is found.
30

3.1.2.3 Backdoor
In [115], Zhang suggests a method for the backdoor detection. Zhang argued that the
attackers who use the backdoor to control the victim would create some interactive traffic,
which has distinct characteristics on packet size, inter-arrival time from the normal traffic
flow. Therefore, they set up the algorithms for normal traffic flow that created by the
legitimate service such as SSH and FTP and look for deviations.
3.1.2.4 Probes
Probe is the first step that an attacker will take before breaking into a system. Port scan
(service querying), OS fingerprint, application vulnerability scan and network mapping are
all very common on the Internet nowadays. Smart [95] designed a fingerprint scrubber aims
at operating system probe(TCP/IP stack fingerprinting). In order to collect the system
information, the attacker will send carefully crafted packets to the remote target and watch
their responses. These packets make use of the ambiguity of network protocol, and cause
the different OSs give responses differently because of lack of standard. The attacker,then,
matches the returned responses with the a signature database to identify the remote system
type. In order to avoid this situation, a protocol scrubber is implemented at a gateway of
a LAN to the Internet. The scrubber will normalize (modify) the packet header at network
31

and transport level to avoid the ambiguity, thereby, prevent the target LAN from receiving
the ambiguous packets and system information leaking.
3.1.3 Network-based Intrusion Detection
Network-based anomaly detection system usually uses the information that could be directly
obtained from communication infrastructure for the anomaly detection. The network traffic
has been a major source for all kinds of information. The network-based intrusion tech-
niques could also be categorized into anomaly-based and signature-based. The examples of
signature-based intrusion techniques are [107, 90, 86]. In [107], a state transition model is
used as the signature to describe each type of attack scenario. The state transition model,
just like a string signature, is defined by the existing attack procedure, and also can be
modified and updated as the new attack emerge. The SNORT and BRO are two well-known
signature-based IDS. Both of them use a set of flexible rules to describe traffic and search
for known attacks patterns.
Another apparent signature is strings. String matching is a simple yet effective method
for known attack identification, and it is employed by IDS ranged from the very earliest
IDS to many current commercial IDS. String matching is a necessary step for the rule set
matching. An efficient string matching in heavily loaded fast networks is essential for the
good performance of a NIDS. Coit and Staniford [38], Sommer and Paxson [99] are two
examples that provide the different string matching enhancement. The first one use SNORT
32

for experimental evaluation while the second one took BRO for experimental evaluation. Coit
and Staniford used an adapted Boyer-Moore algorithm to speed up the string matching while
Sommer and Paxson use a context related string match method to increase the matching
precision.
Most of the network-based intrusion detection techniques, however, are anomaly-based.
A quite frequently used method by network anomaly-based IDS is to set up a statistical
model of normal network traffic. A deviation from the model will be marked as suspicious.
Those statistical models are built from different perspectives of the traffic analysis. Current
network anomaly systems such as NIDES [26], EMERALD [6], ADAM [28] and SPADE [15]
belong to this category.
ADAM is a statistical anomaly-based IDS developed by George Mason University, which
uses a rule-based data mining technique for network intrusion detection. ADAM builds a
normal profile by mining attack free data and ADAM also has a rule set, which is initialized
by user defined abnormal patterns and is constantly updated with the new rules. ADAM
obtains the good result when applied to DARPA evaluation data set.
Both NIDES and SPADE build the statistical model on the IP addresses and ports. For
example, SPADE uses SNORT as the engine and build the normal traffic model on the
number of connections observed from certain IP and port pairs. The less frequent IP port
pair is more likely to be flagged as suspicious. The drawback of SPADE is that it’s false
alarm rate is high on the traffic from less frequent IP-port pairs.
33

EMERALD are capable of both anomaly and misuse detection. It uses distributed
lightweight sensors to monitor and detect the anomalous and suspicious activity. The sen-
sors collect the information from both the traffic stream and the hosts. The decision engine,
which uses multiple machine learning techniques, will trigger an alarm in case of an abnormal
situation.
3.1.4 Data Mining Approach for Network Intrusion Detection
Data mining has been used for host-based and network-based intrusion detection as well as
anomaly-based and misuse-based intrusion detection. In this section, we will focus on the
data mining applications on network-based IDS.
Lee and Solfo [66, 67] explored application of different data mining techniques in the
area of intrusion detection. The main contribution of their 1999’s work [66] is that they
used multiple data mining techniques including classification, association rules and frequent
episodes to build a framework for intrusion detection. They also introduced a practical
feature construction system for the classification, which categorized the connection based
features into low-cost and high-cost features in terms of their computation time. Therefore,
the classification model could choose different features according to the time requirement.
The classification methods are basically rule-based algorithm such as RIPPER. Lee and
Solfo further extended their previous work in [67], where they applied association rules and
frequent episodes to network connection record to obtain additional features, then the classi-
34

fication algorithm, RIPPER, was applied on the labelled attack traffic to learn the intrusion
pattern. They also extended their cost-sensitive model by explicitly defining three cost levels
for features, the rule-sets that are formed by these features are also ”cost-sensitive”. Both
of these two work are for misuse detection and tested using DARPA dataset.
Barbara [29] applied association rules and classification for anomaly detection. Their
system, ADAM, first built a normal profile by mining on the attack free data, then use the
entire training data to look for the suspicious patterns that are not found in normal profiles.
Finally, a classifier is trained to identify if the suspicious pattern belongs to known attack,
unknown attack or normal event.
An alternative classification approaches that use fuzzy association rules is from [32].
Bridges and Vaughn used traditional rule-based expert system for misuse detection and made
contribution to anomaly detection by using fuzzy logic and genetic algorithms. They created
fuzzy association rules from the normal data set, and also built a set of fuzzy association
rules from the new unknown data set, and then compared the similarity between the two
group of rules. If the similarity is low, it indicates a possible intrusion in the new data set.
The genetic algorithm (GA) is used for tuning the membership function of the fuzzy sets
and to select the most relevant features. Basically, GA is used to give rewards to a high
similarity of normal data and reference data and penalize a high similarity of intrusion data
and reference data. By doing so, the similarity between fuzzy rules set of the normal data
set and the reference data set is going to slowly evolve to more, and the similarity between
fuzzy rules set of the intrusion data set and the reference data set is going to evolve to less.
35

Decision trees are another classification techniques that applied to intrusion detection
[98, 65]. For example, Sinclair and Pierce use genetic algorithm and decision trees for
intrusion detection. The decision tree is constructed by applying the ID3 [88] algorithm
on the organized data information, such as the tabular form of connection features and the
related label of wether they are intrusive. The constructed tree and genetic algorithms are
then used to generate rules for classifying the network connections.
The outlier detection scheme has been widely used for anomaly detection. A outlier could
be judged based on statistic features[72], distance [103], density [62] and clustering [41].
Mahoney and Chan extracted the traffic flow features from the packet headers and clustered
these features to build normal profiles, therefore any connection with deviate features from
all the clusters is the outlier. Similar to Mahoney, Taylor and Alves-Foss used even less
features that extracted from packet headers to build the clusters. Each feature is treated as
a variable, and each connection is abstracted to a point with multiple variables (features).
Thus, the nearest neighbor algorithm is applied to those connection points to compute the
distance for the outlier detection. Lazarevic’s work is yet another approach that abstracted
each connection to the points, traffic features to variables, and finally, applied the outlier
detection based on the density of the points.
Other data mining approaches such as neural network [91, 45], Bayesian classifiers are
also exploited for the intrusion detection. Most of the above work, however, use the DARPA
dataset for the model building, training and testing of the effectiveness of their metrologies.
As suggested in Mchugh’s 2001 critique [74], due to the unavoidable shortcoming of synthetic
36

data, they lack of the quality possessed by the real traffic data such as that the background
noise of synthetic data lack of variety and is generated with intrinsic regularity, thus cause
the biased results in data mining analysis. Ultimately, high false alarms will remain to be a
major challenge of the data mining approaches when applied to the real data.
3.2 INTRUSION TRAFFIC SIMULATION AND MODELING
There are two approaches for intrusion traffic simulations, one is to simulate the intrusions
in real environments, the other is to simulate the intrusions in an experimental environment.
For the first approach, real machines in a much smaller scaled network communicate to each
other. Each of them plays the different roles of attackers and victims. A typical example
of synthetic data is DARPA data set. For the second approach, a simulation software will
create the whole network environment in, perhaps, a single computer, and each network
entity is simulated, and so does the traffic. The two most well-known network simulation
softwares are NS2 [11] and OPNET [13].
There are two types of traffic generated by a network simulator. One is the background
analytical traffic, which is not composed by the individual packets ”generated” by each
network entity, but rather a high-level representation of the traffic. Typically, the background
traffic is specified by users with a set of characters, such as the load, throughput, durations.
The background traffic normally acts as the background noise for the explicit traffic. For
example, in the case that a user is interested in the performance of a server-client application,
37

she can decide to simulate the traffic between server and clients using explicit traffic while
using the background traffic to represent the big network traffic environment The users
should be able to use the background traffic to create the same impact as what the Internet
traffic brings to the explicit traffic, such as packet lost, packet delay etc.
The explicit traffic, on the other hand, is composed of individual packets generated by the
applications or the nodes within the simulated network. Unlike the background traffic that
indicates a the global level traffic abstraction, the explicit traffic could have every features of
a real traffic flow, the source and destination, every field of the packet header, and possibly
the payload, flow control mechanism, timeout, retransmission, collision etc. Thus, with the
hybird of explicit traffic and background, the users could, hopefully, simulate the real traffic
scenario without too many inconsistency.
Simulating the intrusion traffic using simulators is still a risky and difficult problems.
And not all the attacks could be simulated. Those application weakness oriented attacks
such as buffer overflow attacks, or any attack that does not cause the change of traffic
patterns would be difficult to simulate. The attacks that could be simulated are restricted
to DOS attack, probes and the propagation of worms. Nevertheless, successful simulation of
these attacks will be an important supplement for intrusion pattern studies, especially for
the propagation of worms, or any attacks that are contagious and have wide impact on the
large scaled network. Recently, because of the bloom of worms on the Internet, there has
been an urgent need to model worm-spreading behaviors.
38

Chen, Gao et al. [35] used analytical model to simulate the worm spreading. The
parameters of their model include number of vulnerable machine, size of hitlist, scanning
rate, death rate, and patching rate. The model from Staniford, Paxson and Weaver [100]
focused on the target selection behavior of the worms. They simulated the several random
IP generation strategy, and observe the worm spreading effect under the different strategy.
They eventually testified the possibility of ”Warhol worm” [113] by simulating the effect of
worms that use efficient target selection strategy.
Moore and Shannon et al. [78] modeled the behavior of the worms under parameters of
reaction time, containment strategy, and deployment scenario. They simulate the Code Red
epidemic with some effects of containment measures. Their simulator seems use an analytical
simulation approach. Zou, Gong and Towsley [116] is another work that modeled Code Red
propagation in an attempt to better match observed behavior. They use numerical solutions
to differential equations for their modeling.
All of above simulation approaches are based on analytical methods, in the sense that is
no explicit traffic flow generated for worm spreading. The intrusion traffic is characterized
by global level parameters. Simulation using explicit traffic is fundamentally difficult due to
the high requirement on the simulators.
39

3.2.1 Simulators
One of the requirements for simulation is to have good tools. Part of this dissertation is to
introduce a simulation model using the simulator OPNET for DOS attacks. Some related
works that also use OPNET to simulate the attack are [84, 64, 89]. OPNET is a commercial
product that is designed for any general network problems in the sense it is a network
simulator not a specifically intrusion simulator. We introduce some of the related existing
network simulator and intrusion simulator as follows:
• OPNET. A commercial product for general network simulation [13]
• NS2. A free simulator for general network simulation [11]
• NWS. A free simulator for network worms [22]
• Scalable Simulation Framework. A free modeler for network worms [16]
• Maisie A C-based discrete-event simulation models from UCLA [21]
40

CHAPTER 4
MINING NETWORK TRAFFIC FOR INTRUSION
PATTERNS
Up to today, many methods have been proposed for network-based intrusion detection. In
order to discover the intrusion patterns from the different perspective and consequently
improve the precision of detection, we combine multiple analysis methods and apply them
to the raw network traffic data to search for intrusion patterns. The methods used in our
work include the common known approaches such as connection analysis, traffic visualization,
communication topology analysis, and data mining method for outlier detection. In addition
to these common known methods, we introduce a new frequency-based approach for traffic
analysis, which serves as the central component of our intrusion detection analysis. As
the first part of our work in this dissertation, we first introduce the overall traffic analysis
procedure and the implementation of an integrated analysis tool: NITA (Network Intrusion
Traffic Analyzer). Then, we focus on the new method we proposed for intrusion analysis:
frequency-based approach.
41

Figure 4.1: The menu-based interface of the NITA
4.1 IMPLEMENTATION OF NITA
We developed NITA for offline analysis of traffic data. The analysis tool combined the
multiple methods to look for suspicious traffic pattern. The input could be either the text
file saved from Ethereal or the traffic file from TCPDump. The main methods applied by
the tool include connection analysis, frequency analysis which search for different types of
frequency pattern within the traffic, the graphical visualization for the character topology
such as tree-like and star-like showed by the worms and sweeps, and finally the data mining
analysis and visualization on extracted connection features such as packet size, port etc.
42
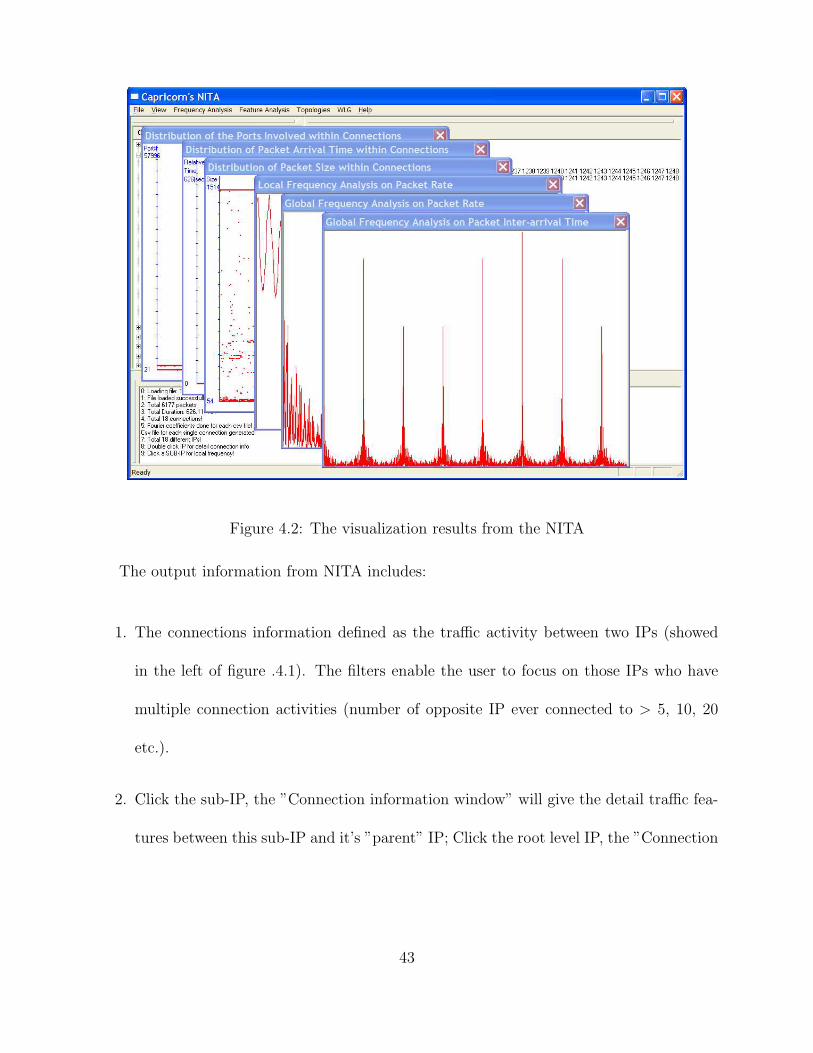
Figure 4.2: The visualization results from the NITA
The output information from NITA includes:
1. The connections information defined as the traffic activity between two IPs (showed
in the left of figure .4.1). The filters enable the user to focus on those IPs who have
multiple connection activities (number of opposite IP ever connected to > 5, 10, 20
etc.).
2. Click the sub-IP, the ”Connection information window” will give the detail traffic fea-
tures between this sub-IP and it’s ”parent” IP; Click the root level IP, the ”Connection
43

Figure 4.3: The feature selection panel of the NITA
information window” will give the detail statistical info for each of its connection ac-
tivities as shown in the right of figure .4.1).
3. Global Discrete Fourier Transform (DFT) and Local Discrete Fourier Transform anal-
ysis are applied on both the packet interval time and packet throughput for each root
IP, if there is a apparent frequency peak, then the traffic could be manipulated, thus
suspicious as shown in figure .4.2).
4. Visualization on pack size distribution, involved source and destination port, packet
arrival time and so on from connection history of a specific host or within a particular
connection (see figure .4.2).
44

5. The topology analysis includes the identification of tree-like, star-like, chain-like shape
from the traffic. The parameters such as the depth of the tree and the degree of the
star node are customizable.
6. The various features extracted from the connections history of a specific host, and also
the drill down session features of a particular connection within the connection history
as showed in figure .4.3. We build features into two layers, the first layer (the upper
part of figure .4.3 includes all the statistical traffic features between two IPs regardless
direction and are not separated by TCP connection. The drill-down layer further
clusters the traffic for a connection into sessions and further extracts session-based
statistical features.
Among the different functionalities implemented in NITA, the novel connection-based
frequency analysis has been used as a main methods for traffic analysis. We will introduce
this novel approach for intrusion detection in the following content.
4.2 A FREQUENCY-BASED APPROACH FOR INTRUSION
DETECTION
The frequency-based methodology is designed for intrusion pattern analysis. In particular,
it targets to DOS, Probe and certain password attack and is evaluated on the DARPA 1999
45

dataset. The experiment result suggests that it is effective on those type attacks that lasting
relatively long durations.
4.2.1 Motivation and Goal
We introduce a novel approach for network intrusion detection. Our new method aims at
but is not restricted to DOS attack, Probe and dictionary attack. Based on the observa-
tion that such kind of attacks are more likely manipulated using coded scripts, and that
a large amount of network packets are automatically generated and sent out to a target,
we adapt the frequency analysis techniques used in signal processing to the design of intru-
sion detection algorithms. Discrete Fourier transform (DFT) is applied to the time-series
created by network traffic to look for frequency pattern. We test the effectiveness of this
frequency-based detection strategy by Using DARPA data set [4]. The results indicate that
the proposed intrusion detection strategy is effective in detecting anomalous traffic data that
exhibit patterns over time. The new strategy does not depend on the prior knowledge of
attack signatures, thus it has the potential to be a useful supplement to existing signature
based IDS and firewall.
Many network attacks are executed by running pre-written scripts, which automate the
processes of attempting connections to various ports, sending packets with fabricated pay-
loads, etc. Based on this observation, we propose a new intrusion detection strategy, which
46

looks for traffic patterns, especially periodic patterns within the following listed features of
the traffic data.
• The inter-arrival time of the packets
• The packet rates (The packet throughput per unit time)
• The size of the packet payloads
• The time interval of the initial connection attempt (determined by the flags)
• The number of the distinct IP addresses reached during a time period,etc.
The first four measures are particularly relevant to the DOS, probe, and password guess-
ing attacks. The last measure may be observed when a worm or virus is spreading itself
from an infected computer to other computers. All these traffic measures could exhibit
certain patterns over time that distinguishes the attack traffic from the legitimate traffic.
Specifically we collect these traffic features within the connection history of each protected
computer maintained in a firewall.
The main intrusion detection strategy applies Discrete Fourier Transform (DFT) on the
collected traffic features to look for the patterns. We use data set from Lincoln lab for testing.
The TCPDUMP data are replayed and the new intrusion detection strategy is implemented
within the simulated network model for the testing.
47

4.2.2 Frequency Analysis of Time-series
We adapt the techniques of signal processing on time-series data to design intrusion detection
strategies. A time-series consists of a sequence of numbers each representing a data value at
some point in time. Examples of time series data include financial data, stock price, weather
data, network traffic throughput, etc [110]. In our research, we focus on three different kinds
of time-series on network traffic. The first one is the time series of packets throughput per
unit time. The second is the time-series of inter-arrival time of the packets. The last one
is the time-series of packet payload size. Our observation is that the attacks generated by
a brute force approach such as the DOS, probes, and password guessing, will create a large
number of net-work packets by the coded scripts, which may cause some regular patterns
in the traffic data. In addition, such attacks often use fabricated constant sized payloads.
Based on these patterns, we attempt to design an intrusion detection algorithm capable of
capturing anomalous traffic behaviors but not dependent on the specific intrusion or attack
signatures.
Before we apply our intrusion detection strategy, we use the technique introduced in
[109] to differentiate the ”clean and dirty” traffic so to reduce the amount of suspicious
traffic that need to be carefully examined by our IDS. The central idea from [109] is based
on the observation that under normal situation a machine will make a rather low rate of
outgoing connections to new or different machines, it is more likely to connect to the same
IP regularly than to different IPs [50] [51], which is referred as locality property of machine
48

interaction. Thus, a connection queue will be built where the traffic from familiar IP would
have higher priority than the traffic from newer IP. The higher rate of new connections made,
the lower priority will be these new connections. Our frequency-based intrusion detection
strategy will be used to watch those ”unfamiliar” connections.
There are four steps for our approach. First, we construct the connection history for
all those connections that from new IPs and recordcompute the traffic features including
the packet size, the inter-arrival be-tween packets and the packets throughput per unit
time within or among the connections. Second, considering the possible of huge amount
of data, we use compressed time series to speed up the next step’s analysis. In the third
step, we apply the DFT to the time series data generated and collect the resulted frequency
information. Both the global frequency patterns for all connections in connection history
and local frequency patterns for each single connection are computed using DFT. Finally, by
checking the sharp peak in the spectrum of DFT transform, we decide if the nice frequency
pattern exists in the network traffic. Figure .4.4 shows the overall structure of the intrusion
detection strategy. We will give the definition for the terminology we used and detail our
whole strategy at following subsections.
4.2.2.1 IP connection history
In our studies, a network connection includes all the network traffic (packets) sent between
two connected IP addresses in a certain time period, which has the following properties:
49

Connection - based traffic
Parse it into connections
Traffic Data
time sequence for each connection
time sequence for multiple connections
Local frequency pattern
Global frequency pattern
Generates the time - series data
Report attacks
DFT
Supplement analysis on the other traffic features
Feature analysis
Such as: distribution on ports, packet size, etc.
Format parsing: TCPDUMP or captured
traffic using sniffers
Figure 4.4: Overall Structure of frequency-based detection
• A pair of source and destination IP addresses
• A single protocol or a set of multiple protocols used at different times during the
connection
• A set of consecutive packets within a connection which are not necessarily sent or
received consecutively in terms of time by a machine
For each protected computer, we use a firewall to control the connection queue. The
firewall will pass connections from familiar IP, and maintain the history of recent new con-
nections, that is, connections from new IPs will be watched, and their frequency patterns
will be computed and recorded. For each connection within a connection history, all of three
types of time series are generated.
50

4.2.2.2 Frequency on Inter-arrival Time VS. Frequency on Packets Throughput
per Unit Time
To illustrate the necessariness of these two different types of frequency, imaging a simple
case, an attack is sending out big amount of packets to a target automatically, the goal of
the attack is to flood the machine or to probe the machine. The way of sending packets falls
into three categories. First, the packets are sent out very randomly, that is, the inter-arrival
time between any two consecutive packets would not consist any repeated periodic patterns.
Second, the packets are sent out with constant speed. Third, the packets are not sending
out with constant speed, but the periodic pattern exists in inter-arrival time. To illustrate
these three different time patterns, we give a simplified example at below.
Random Inter-arrival time sequence:
1 23 4 10 1000 45 320 12 33445 6 23 · · ·
Constant Inter-arrival time sequence:
5 5 5 5 5 4.9 5 5 5 5 5 · · ·
Periodic Inter-arrival time sequence:
6 7 3 23 6 7 3 23 6 7 3 23 6 7 3 23 · · ·
Each number in above sequence stands for a inter-arrival time between two consecutive
arrive packets. For the cases of constant inter-arrival time sequence, instead of applying DFT
on inter-arrival time, we apply DFT on data sequence of packets throughput per unit time
to get frequency pattern. The unit time is a self-adapt value depending on the duration of
51

the connection and the sending speed of the traffic. For periodic inter-arrival time sequence,
applying DFT on packets throughput per unit time would not find out the periodic pattern,
so DFT on periodic inter-arrival time sequence would be appropriate. For the perfectly
random inter-arrival time sequence, we would not have frequency pattern, it could be a
legitimate traffic or a manually operated attack, or an attack that exploits a specific flaw of
the system such as buffer overflow attack.
The idea behind this frequency pattern analysis is that the traffic with constant Inter-
arrival time is probably generated by the coded automated DOS, probe or dictionary attack,
which use the simple attack strategy, say, flooding a machine by sending a packet every
millisecond or make a guess on the password for a telnet service every one second. The
periodic inter-arrival time would be used by those more complicated attack which need
many packets to finish a subtask and these packets for the task are randomly generated, but
the subtask is repeated again and again within the whole attack process. We give examples
in the section 5 to illustrate the difference of these two types of frequency.
4.2.2.3 Frequency Extraction
For a given data sequence s(n) where n ¿ 0 is a discrete value representing the time, we
apply the DFT to compute the frequency information. Fourier Transform is a well known
tool used in signal processing. The DFT takes the original time series in the time domain,
52
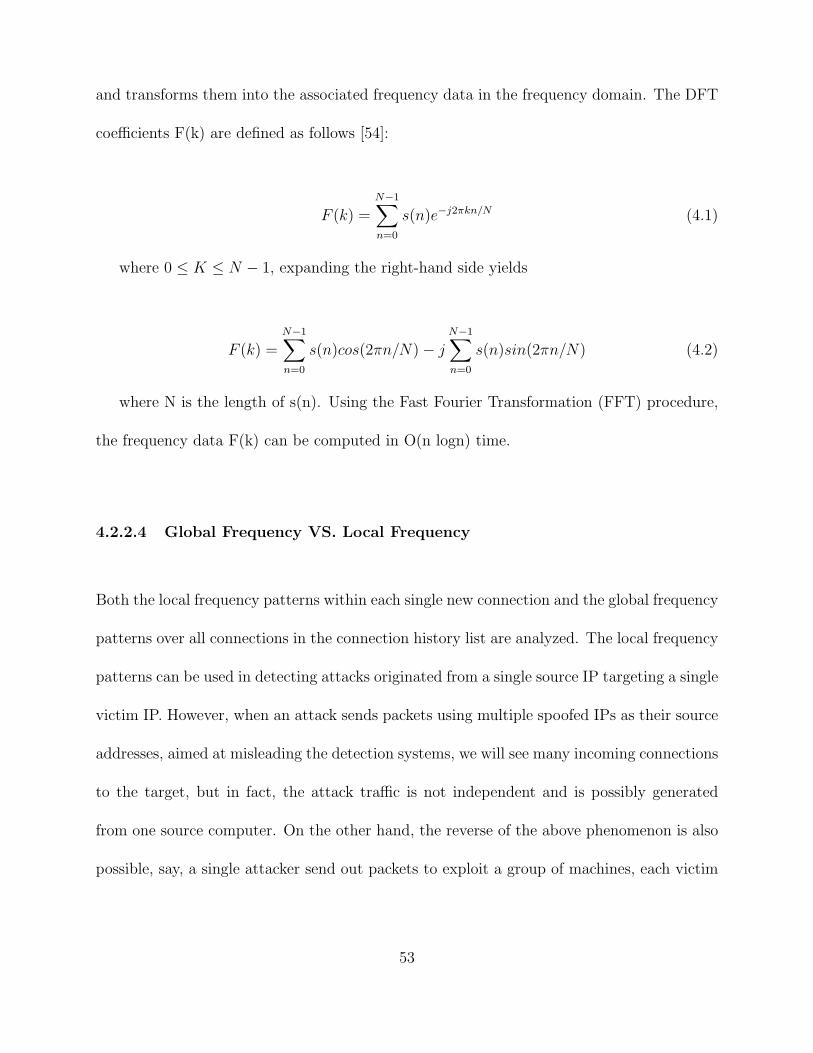
and transforms them into the associated frequency data in the frequency domain. The DFT
coefficients F(k) are defined as follows [54]:
F (k) =N−1∑
n=0
s(n)e−j2πkn/N (4.1)
where 0 ≤ K ≤ N − 1, expanding the right-hand side yields
F (k) =N−1∑
n=0
s(n)cos(2πn/N) − jN−1∑
n=0
s(n)sin(2πn/N) (4.2)
where N is the length of s(n). Using the Fast Fourier Transformation (FFT) procedure,
the frequency data F(k) can be computed in O(n logn) time.
4.2.2.4 Global Frequency VS. Local Frequency
Both the local frequency patterns within each single new connection and the global frequency
patterns over all connections in the connection history list are analyzed. The local frequency
patterns can be used in detecting attacks originated from a single source IP targeting a single
victim IP. However, when an attack sends packets using multiple spoofed IPs as their source
addresses, aimed at misleading the detection systems, we will see many incoming connections
to the target, but in fact, the attack traffic is not independent and is possibly generated
from one source computer. On the other hand, the reverse of the above phenomenon is also
possible, say, a single attacker send out packets to exploit a group of machines, each victim
53

only received a part of the exploit traffic. For this situation, the firewall installed in gateway
for whole LAN will record all the exploit traffic heading to different victim IPs. Both of these
two cases will need the global frequency analysis to detect the ”one to many” or ”many to
one” attack.
In real environments when connections are established between different pair of comput-
ers, the connection traffic from one connection is statistically unrelated to the connection
traffic from others. Therefore, there should be no frequency patterns existing over the differ-
ent connections. Based on this assumption, the local frequency patterns are used to identify
the uncoordinated attacks occurring in different connections.
4.2.2.5 Frequency Peak Recognition
To automate the whole process of frequency peak recognition, we designed a simple algorithm
to deter-mine if frequency peaks exist in a series of spectrum value of DFT coefficients
(referred as S-DFT). For example, human eyes could easily tell that both figure 2(a) and (b)
have apparent frequency peaks. In order to let a computer ”see” them, we first do Gussian
kernel smooth to S-DFT. Then, we detect the peakiness from the smoothed values using
computer vision recognition technique [101].
ζ = (1 −Va + Vb
2P) × (1 −
N
W × P) (4.3)
54

Figure 4.5: Va, Vb are the heights of valleys, W is width of peak, P is the height of peak, N
is the area between Va and Vb covered by the peak.
If ζ > γ , where γ is a experimental threshold and γ ∈ (0.7, 0.1) , then it is defined as a
sharp peak, where an apparent frequency is located.
4.2.3 Results on Synthetic Data
In this section, we give the detailed results for four different attacks. These four attacks are
ProcessTable, Ping of death, Portsweep and Dictionary at-tack. The first two belong to DOS
attacks; the other two belong to Probe and remote-to-root attack respectively. The detail
description of the attack could be found in [55]. The source of these attacks are Lincoln 1999
week 5 and week 4 data set (Abbreviated as L1999w5&w4 in remaining dissertation). Then
55

we report the overall experimental result of our frequency-based detection strategy on the
DOS and Probe attacks from L1999w5&w4.
For the simulation, we cut the data set of L1999w5&w4 into small pieces with a time win-
dow of roughly 10 to 30 minutes’ width. For each small data-set, we use our pro-processing
tools to parse out the number of distinct IPs involved in the traffic, and then the network
simulation model is automatically built accordingly. The structure of model is same as the
one showed in figure 3 except for the number of virtual PC are different. Our intrusion
detection algorithm is added into the firewall node.
4.2.3.1 ”Processtable” Attack and ”ping of death” Attack
The ProcessTable attack is TCP connection based at-tack, which may attack various network
services by launching a huge number of TCP/IP connections to a particular port in a short
period. For each incoming TCP/IP connection, the underlying Unix system allocates a new
process to handle it. Therefore, it is possible to completely fill a target machine’s process
table with multiple instantiations of network servers, eventually rendering the system lifeless
until the attack terminates or is killed by the system administrator [55].
In our simulation, we used the MIT/Lincoln Lab TCPDUMP file that contains the Pro-
cessTable attack packets, extracted the pertinent information using our pre-processing tools,
then set up the simulation in OPNET. There are slightly less than 2 minutes of data with a
56

total of 5526 data packets. We collected two statistical measures at the firewall node which
showed the existence of the attacks.
Our intrusion detection algorithm will build the connection history table for the target
computer ”zeno.eyrie.af.mil”. Initially, all connections will be treated as new connections.
Each record of a connection including all the statistical features of the connection, and
the identification of the connection: ”IP ad-dress”, and the DFT is applied to its packets
throughput or inter-arrival time. The variance of the packet size is calculated. Based on
the output from DFT coefficients, the frequency pattern of each connection is plotted in
Figure 7. There are a total of 12 connections in the connection history table. Five of them
have less than 20 packets and two of them have less than 40 packets. We plot the frequency
information of six connections that are long enough to bear meaningful DFT analysis.
From Figure 4.6 we could see that the figures for connection 0, 1 showed distinct frequency
peaks, whereas the rest of them don’t. In fact, the first connection is the processTable attack
that we expected to find, and surprisingly, we found out that the second one is a Probe attack,
which probes the targets’ ports ranging from 1794 to 2631. We identify the probe attacker’s
IP ad-dress as ”hobbes.eyrie.af.mil (172.16.112.20)”.
There is time when the attack packets are sent out roughly at constant speed, and we
could tell the frequency from the packets throughput per unit time,but the inter-arrival time
sequence would be close to a straight line, and won’t reflect any frequency pattern. In Figure
4.7, we plot both two type of frequency for Ping of Death attack, which comes from Lincoln
1999, Monday of week5 data set. The Figure 4.7 a is the DFT on inter-arrival time, and
57
Connection 0 Co n nection 1 Connection 2
Connection 3 Co n nection 4 Connection 5
Figure 4.6: The frequency pattern on inter-arrival time of each connection for ProccessTable
attack.
4.7 b is the DFT on packets per unit time. Observed that the original inter-arrival time
sequence are all around 0.0012 second, which means that frequency analysis on packets per
unit time is more appropriate.
4.2.3.2 The Portsweep Attack
The source data for Portsweep traffic is from Tues-day data of L1999w5 outside data. The
attacker send small amount of packets to each of 38 different destinations. The local fre-
quency pattern for each separate connection doesn’t reveal much info as we showed below
in figure 4.8.a. Since the attacking process to each target last very short (about 3 seconds)
58

(a) (b)
Figure 4.7: The frequency pattern of Ping of death. (a) Frequency on inter-arrival time. (b)
Frequency on packets0.005 seconds.
(a) (b)
Figure 4.8: (a) The local frequency pattern on inter-arrival-time for the first 9 connections
of portsweep attack. (b) The global frequency pattern on inter-arrival time of portsweep
attack, which includes 18 connections.
59

Connection 0 Co n nection 1 Connection 2
Connection 3 Co n nection 4 Connecti on 5
Figure 4.9: The frequency pattern on inter-arrival time of each connection for Dictionary
attack.
and using small amount of packets (around 10 packets), there is no obvious peak in local
frequency pattern except for that all the local frequency pattern are very similar to each
other. However, the global frequency pattern of all the separate connections that oriented
by the same IP (attacker) showed obviously sharp peak as in figure 4.8.b. All the variances of
packet size for each separate connection are zero except for the connection with 192.168.1.20,
which has variance of 10.63. We identified that the IP: 195.73.151.50 is suspicious attacker.
60

4.2.3.3 Dictionary Attack
Except for the DOS an Probe attack, some other type of attacks such as the Dictionary
attack, which belongs to the type of remote-to-root attack, also falls into the scripted at-
tack category. Figure 4.9 is the frequency pattern for the dictionary attack, data orig-
inally from Monday of L1999w5 TCPDUMP data. There are totally 11 connections to
victim: marx.eyrie.af.mil. We give our experimental result on their frequencies in Figure
4.9. There is an obvious frequency pattern showing for connection 1. The variance of
packet size is 0.117088, the sending speed is very high, 5265 packets sent out in 834.067566
seconds. We confirmed that this connection is a password guessing attack, which tried dif-
ferent username/password combinations to the telnet service. We identified the presence
of an attack without the prior knowledge of the attack signature. The attack source IP is
linux1.eyrie.af.mil, and no global frequency patterns showed for other attacks.
figure 4.10 and figure 4.11 showed frequency analysis result both on packet rates and
inter-arrival time for sshProcesstable attack. In this case, periodic pattern is found in both
packet rates and inter-arrival times. However, not all the attacks will last long enough to
show any regular periodic pattern. In the next section, we give the overall experiment result
for DOS and Probe attacks in 1999 week 4&5 DARPA data.
61

1 2 3
4 5 6
Figure 4.10: The frequency pattern on packets rates of each connection for sshProccessTable
attack. Connection 2 is the attack traffic.
62

1 2 3
4 5 6
Figure 4.11: The frequency pattern on inter-arrive time of each connection for sshProc-
cessTable attack. Connection 2 is the attack traffic.
4.2.3.4 Experiments Results with DOS and Probes Attacks in 1999 Lincoln
Evaluation Data
We studied variety of the DOS and Probe attacks from L1999w5&w4 data. We listed the
attacks on which we have done experiment. Since our frequency-based approach is sensitive
to the attack duration and whether attack is automatically conducted, we didn’t include
those manual attacks and the attacks which have very short attack time (the number of
packets for attack are very few) such as ls domain and smurf. We did not include the wrong
labeled attack: arppoison and insidesniffer, as well.
63

Table 4.1: DOS and Probe Attacks in 1999 week 5 and week 4 DARPA evaluation data.
AttackName Type Manual? Duration Frequency found?
Pod(pingofdeath) DOS man 0:00:06 Y packetsunit time
Dosnuke DOS auto 0:16:41 Y inter-arrival time
Apach2 DOS man 0:11:00 Y packetsunit time
Syslogd DOS auto 0:15:01 N
Neptune(SYN flood) DOS auto 0:06:51 Y inter-arrival time
Crashiis DOS auto 0:00:06 N totally only two connections to vic-
tim:172.16.112.100,and each connection
has only 7 and 5 packets
Selfping DOS auto 0:03:03 Y packetsunit time
ProcessTable DOS auto 0:02:02 Y inter-arrival time
sshprocessTable DOS auto 0:00:8-0:00:50 Y inter-arrival time & packetsunit time
Back DOS auto 0:05:00-0:20:38 Y packets/unit time
Udpstorm DOS auto 0:15:00 N
mailbomb DOS auto 0:04:27 Y packets/unit time
Dict RLA auto 0:00:10-0:08:40 Y inter-arrival time
Guesstelnet RLA auto 0:03:19 Y inter-arrival time & packetsunit time
Ipsweep Probes auto 0:00:01 × 6 N single packet sent to each IP from
different sources IP
Portsweep Probes auto 0:04:00 Y inter-arrival time & packetsunit time
queso Probes auto 0:00:01 × 7 Y inter-arrival time (Big time gap exists
in the middle of the attack though)
tcpreset Probes auto 0:10:38 Y packetsunit time
nmap Probes auto 0.04:24 Y packetsunit time & inter-arrival time
teardrop Probes auto 0:15:01 Y packetsunit time & inter-arrival time
satan Probes auto 0:02:12 Y packetsunit time
ntinfoscan Probes auto 0:16:09 N
64

Table .4.1 listed all the attacks, which include eight Probes, eleven DOS attacks and also
two RemotetoLocal Attacks. The unit time used for frequency analysis is simply defined as
µ = 0.1 × (T/n) (4.4)
where stands for unit time, T is the duration of a connection or multiple connections
depends on whether it is local frequency or global frequency as mentioned before, and n is
the number of packets.
Our detection algorithm failed on four attacks: Ip-sweep, crashii, syslogd and ntinfoscan.
The data sources for the first three attacks are from Monday, L1999w5 data. The ntinfoscan
is from Thursday, L1999w5 data. Among them, Ipsweep attack is conducted by sending a
single packet to each target IP from different source IP, which is contrary to what we expect
that the attack is oriented from the same IP; The crashii attack sent only seven and five
packets to the victim IPs in two separated connections, which are not long enough to bear
frequency analysis. Syslogd, ntinfocan and Udpstorm are three automatic attacks with long
attack durations, and we could not identify any frequency from the traffic data.
An interesting aspect is that we were able to detect certain DOS attack even when they
are manual attacks. ping of death and apache2 attack are from Monday, week five data
set, which labelled as manual attack. The apache2 attacks created huge amount of traffic:
53931 packets are sent out in 603.971863 seconds. Ping of death attack sent out 91 packets
in 30.114 seconds. They both showed frequency pattern in the local connections. The
65

reasonable explanation for it is that the traffic sent out in the attacks is mostly processed
automatically without much human interaction involved.
For all these attacks, our detection strategy does not need any prior-knowledge on attack
signature. And the false alarm rate is fairly low. We choose three-hour’s data from Monday
of L1999w5 data set, the traffic starts from 17:19 end at 20:19, totally seven different attacks
included in this period of time. We have two false negatives on syslogd and udpstorm attacks
and two false positives reported among 245 connections. The miss alarm rate is lower than
1%. The two false positives are listed as follows:
src: 192.168.1.30 dst:172.16.0.1 ALARM ON at Apr 5, 1999 17:19:24.551463000
src: 192.168.1.90 dst:192.168.1.10 ALARM ON at Apr 5, 1999 17:19:30.054918000
After further checking the original packet information, we found out that both of these
two connections actually used Network Time Protocol for time synchronization. The packets
within the traffic would include information, such as,
Network Time Protocol
Flags: 0x1b
00.. .... = Leap Indicator: no warning (0)
..01 1... = Version number: NTP Version 3 (3)
.... .011 = Mode: client (3)
Peer Clock Stratum: secondary reference (5)
Peer Polling Interval: 6 (64 sec)
66
Peer Clock Precision: 0.000004 sec
Root Delay: 0.0023 sec
Clock Dispersion: 0.0211 sec
Reference Clock ID: 192.168.1.10
Reference Clock Update Time: 1999-04-05 21:18:26.0564 UTC
Originate Time Stamp: 1999-04-05 21:18:26.0549 UTC
Receive Time Stamp: 1999-04-05 21:18:26.0564 UTC
Transmit Time Stamp: 1999-04-05 21:19:30.0544 UTC
However, the periodic legitimate traffic does exist commonly in the real network envi-
ronment. For example, the traffic sent by a router, which broadcasts to lists of its subset
machines periodically, thus shows frequency pattern. The detail of Internet routing protocols
could be found in [94]. Besides, as we mentioned before, certain network synchronization
applications would create periodic traffic, and DNS service sometimes would create traffic
with frequency pattern as well. For most of these legitimate periodic traffic, both the sender
and receiver belongs to the insiders of LAN, and the traffic happens routinely. By the result,
they should be filtered out as trusty IP due to the locality strategy mentioned before, and
immune from the false alarm under our detection algorithms. Nevertheless, it would remain
to be a tricky problem when these trusty machines are already compromised and try to infect
the others.
67

4.2.4 Summary
In all, we proposed a time-series frequency mining technique for detecting automated, scripted
network attacks, which typically exhibit frequency patterns over time. The technique is
based on the sound theory of Fourier analysis from signal processing research. We used the
DARPA datasets in our simulation studies; the experimental results demonstrated that the
frequency-based intrusion detection algorithm is effective in, but not limited to, detecting
the DOS and probe attacks that typically run from pre-written scripts and have relatively
long duration.
4.2.4.1 Limitations and Reality
Our frequency-based anomaly detection is effective when evaluated using the DARPA syn-
thetic data. However, as mentioned in the related work [74], due to the unavoidable short-
coming of synthetic data, they lack of the quality possessed by the real traffic data. The
background noise of synthetic data lacks of variety and the overall traffic is often generated
with intrinsic regularity because of the absence of user interaction. Therefore, it is possible
that the synthetical attack traffic will create the periodical patterns while it is seldom the
case in the the real world.
Ideally, an IDS should be evaluated with the real data in a real network environment.
Nevertheless, it is difficult to have real attack traffic reappeared over and over. The privacy
68
concerns on the personal information leaking often prevent the share of the traffic details.
The packet payload has to be stripped off before it could be used for analysis. Thus, synthetic
data still remains a primary data source for many researchers.
4.3 MORE EXPERIMENTAL RESULTS BY NITA
As the final section of chapter 4, we report additional experimental results generated by
NITA for different attacks.
4.3.1 PortSweep
The right frame of Figure 4.12 shows a general connection information. Notice that the
number of port involved in the connection is abnormal compare to the normal connection.
Figure fig:nitaportsweep1 further shows the distribution of packet size, distribution of source
port and destination port, the frequency analysis on packet inter-arrival time for the same
connection. From the visualization panel, both the apparent periodical pattern in the packet
inter-arrival time and the destination ports confirmed that this is a port scan attack.
69
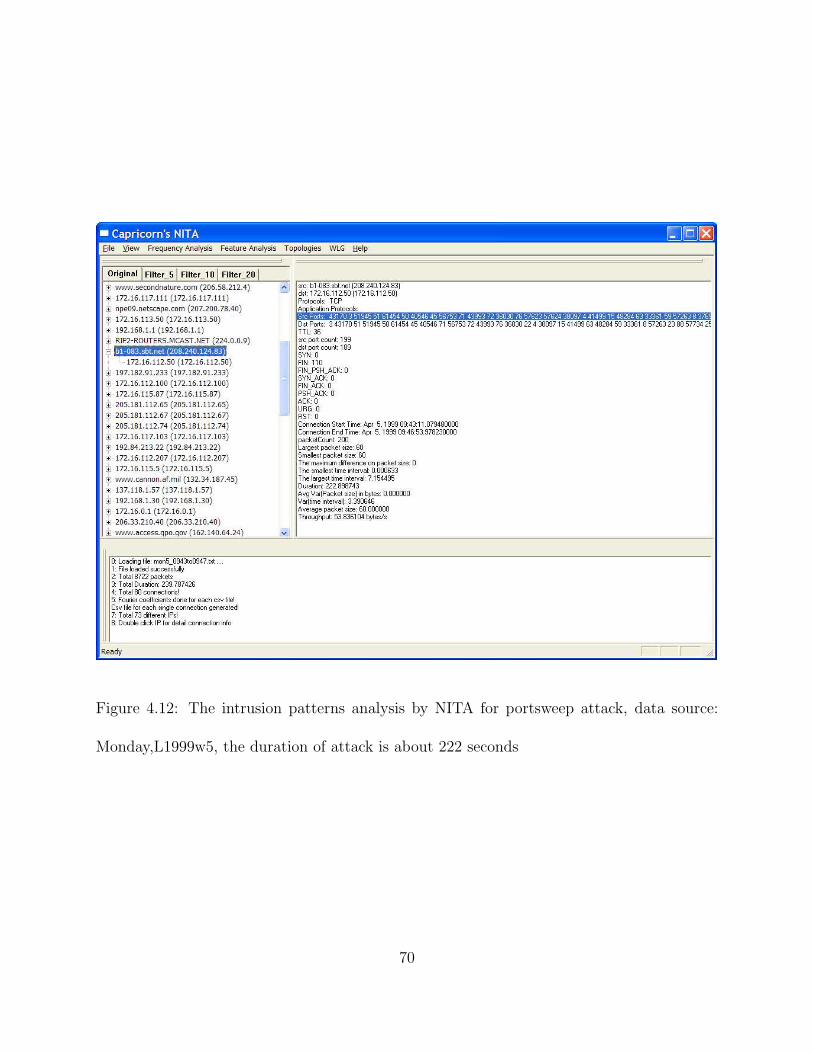
Figure 4.12: The intrusion patterns analysis by NITA for portsweep attack, data source:
Monday,L1999w5, the duration of attack is about 222 seconds
70

(a) (b)
(c) (d)
Figure 4.13: The patterns analysis presented as (a) frequency on packet inter-arrival time,
(b) Distribution on packet size ports, (c) and (d) Distribution of ports involved, where shows
a wide range of ports have been explored compare to normal traffic
71

Figure 4.14: The intrusion patterns analysis by NITA for unknown sweep attack in the real
traffic, the duration of this attack is about 5 seconds
4.3.2 Unidentified Attack from Real Data
Data source: UCF’s Computer Services and Telecommunications Department (collected from
computer science build third floor) Time:2/20/04, 10:05 AM-10:07AM. Unknown sweep at-
tack shown in Figure 4.14 and 4.15
72

(a) (b) (c)
Figure 4.15: The patterns analysis presented as (a) frequency on packet rate, (b) distribution
on source ports, (c) distribution on destination ports
4.3.3 GuessTelnet Attack
The attack results from GuessTelnet in Figure 4.16 and Figure 4.17. The traffic trace is from
DARPA data: Monday,L1999w5, the duration of attack is about 160 seconds.
73

Figure 4.16: The detailed drill down feature analysis suggests the attacker might have
launched 17 threads to request TCP connection with the victim, those 17 TCP connec-
tions have very similar statistical features with each other, such as the number of packets
sent, traffic load, duration, etc.
74

(a) (b)
(c) (d)
(e) (f)
Figure 4.17: The patterns presented as (a) and (b) frequency on packet rate and inter-arrival
time; (c) and (d) distribution of packet size and arrival time; (e) and (f) distribution of ports
involved
75

CHAPTER 5
WEIGHTED LINK GRAPH: A DISTRIBUTED
PERSONAL IDS FOR LAN
While a firewall installed at the perimeter of a local network provides the first line of defense
against the hackers, many intrusion incidents are the results of successful penetration of the
firewalls. Once a hacker has successfully penetrated the firewalls, the compromise of a single
computer would open Pandora’s box to the entire network. The second part of our work
proposes an IDS that provides a finer control over the internal network. The system focuses
on the variations of connection-based behavior of each single computer, and uses a weighted
link graph to represent the overall traffic abnormalities.
The functionality of our system is of a distributed personal IDS system that also provides
a centralized traffic analysis by graphical visualization. We use a novel weight assignment
schema for the local detection within each end agent. The local abnormalities are quantita-
tively carried out by the node weight and link weight and further sent to the central analyzer
to build the weighted link graph. Thus, we distribute the burden of traffic processing and
visualization to each agent and make it more efficient for the overall intrusion detection. As
76

the LANs are more vulnerable to inside attacks, our system is designed as a reinforcement
to prevent corruption from the inside.
5.1 MOTIVATION
A firewall system defines a single point of entry and exit for the traffic between a local
network and the Internet. Every packet must be checked by the firewall before it has the
chance to reach an inside machine. While a firewall provides the first line of defense against
hackers, many severe intrusion incidents have resulted from the failure of a firewall to capture
the malicious packets. This is inevitable, because it is difficult for a firewall to recognize new
exploits without knowing their signatures. Moreover, the high volume of traffic that must
be processed quickly often prevents the implementation of sophisticated anomaly-detection
algorithms within the firewall itself.
Because LANs are vulnerable against inside attacks, once a hacker successfully penetrates
the firewall, the compromise of a single computer puts the entire network at risk. First of
all, many firewalls tend to pay more attention to inbound traffic, and they have a less-strict
filtering policy for outbound traffic. Thus, it is easy for a hacker to set up backdoors by
having connections initiated from the inside. Second, many LANs contain public servers such
as web servers, DNS and email servers that must be exposed to the Internet. There is always
a chance that someone will discover a new vulnerability and gain unauthorized access to these
servers. Therefore, the connections between the servers and the other internal computers
77

need to be supervised in case of compromise of the servers. If an IDS could provide finer
control over the internal traffic activities, it would greatly reduce the overall security risk.
Many inside attacks are difficult to detect without a personal IDS. For example, when a
hacker successfully penetrates the firewall and takes control of one inside computer, he/she
would try to obtain the information of the entire network and identify more potential targets.
Hence, attacks such as backdoors and stealth scans that originated from the compromised
computer become a good choice for inside hacking activities. These attacks may not cause
apparent harms or abnormalities to the users and the network. To prevent such attacks,
personal firewalls, e.g. [20, 10], have been recommended for installation on every inside
workstation within a network.
We propose a distributed personal IDS, which is a network-based anomaly detection
system that composes of end-user agents and a centralized analyzer. A user agent builds
the normal profiles based on variations of connection-based behavior of each single host,
which is primarily decided by the user behaviors and the services provided by and to the
local machines. The deviations resulted from each individual host are carried out by a local
weight assignment scheme and further used by the central analyzer to build a weighted link
graph representing the overall network abnormalities.
78

5.2 RELATED WORK
The distributed IDS [63, 104, 60, 61] have two basic functional blocks: one consists of the
agents that are scattered around the network, and the other is the centralized analyzer.
Different detection schemes have been used by the agents for local intrusion detection. In
[104], each end agent collects the information such as the number of connection attempts to
a non-existing host or non-existing service for the indication of a worm’s presence. The local
agent in [63] uses sub-agents to collect suspicious patterns (or signatures) from both network
and host. Thus, the local detection approach in [63] is a combination of a network-based and
a host-based approach. Krugel [60, 61] used a local agent to collect the intrusion signatures,
and then detected the correlated attack by processing them in a centralized fashion.
In our work, the method applied in the local agent is an anomaly-based approach, which
is based on abnormal machine behavior analysis [109, 30]. The idea in [109] is to defeat
the spreading of worms/viruses; for example, a host affected by a worm has fundamentally
different behavior from a normal host. Both [109] and [30] are anomaly-based approaches
that are specific to worm detection. [75] further extend the idea from [109] into a general
locality analysis that applies to normal behavior of benign users of computer systems. We
substantialize the locality analysis into a local weight assignment strategy for inside-attack
detection. Additionally, we propose a visualization schema to integrate the otherwise isolated
abnormalities into a weighted link graph to facilitate global network administration.
79

The distributed IDS [63, 104, 60, 61] have two basic functional blocks, one is the agents
that are scattered around the network, and the other one is the centralized analyzer. Different
detection schemes have been used by the agents for local intrusion detection. In [104], each
end agent collects the information such as the number of connection attempts to non-existing
host or non-existing service for the indication of worms presence. The local agent in [63]
use sub-agents to collect suspicious patterns (or signatures) from both network and host.
Krugel [60, 61] used a local agent to collect the intrusion signatures, and then detected the
correlated attack by processing them in a centralized fashion.
For the central analyzer, our approach is different from the above methods by using
visualization technique, where the abnormalities are visualized in a graphical environment
in an attempt to highlight the possible correlations. [106, 82, 42] also proposed different ways
to visualize the entire network activities for the purpose of intrusion detection. However,
they integrated all the traffic processing and intrusion detection on the central processor,
which requires a high volume computational ability and network bandwidth to process the
data. Our approach decentralizes this burden to every local agent and only visualize the
reported abnormal behaviors, which can gain a better performance for a moderate scale
local network.
80
5.3 CONNECTION-BASED BEHAVIOR ANALYSIS
For the outgoing connections, if this host is a desktop, the connections will have locality
properties under normal activity. That is, a user is more likely to make connections with
recently-visited machines [51], and the connection rate is relatively low. This observation
has been used in [109] to defeat the spread of worms, since a machine infected by a worm
will demonstrate the pattern of a high volume of connection attempts to different IPs with
a much higher rate.
For the incoming connections, a desktop would rarely receive connection requests from
an external IP unless it provides certain services to the public. Meanwhile, a desktop would
regularly communicate with servers on the internal network. Most of this traffic comes from
the servers that provide notification services such as broadcasts from the routers. If there
are no changes to the physical configuration of these servers or the network infrastructure,
regular services are expected to create predictable connection patterns.
Figure 5.1 and Table 5.1 are the observations on the traffic of randomly selected local
hosts located in our Computer Science Department, with observation time spanning roughly
a month. We record the traffic with different duration ranging from days to minutes, and
classify them into four categories. As shown in Figure 5.1(a) and (b), the incoming traffic
from external sources is completely blocked by the firewall. The incoming traffic from internal
sources is minimal if we ignore the broadcast traffic. The dominant traffic is outgoing traffic.
Outgoing traffic to internal destinations makes up only a small percentage of all outgoing
81

traffic. Table 5.1 is the complete list of the internal IPs to which connections have been made
within a period of a week. The number of internal IPs that have been contacted by this
desktop is very small; certain internal servers have been regularly reached, and some of the
internal IPs are coming from organizations within the university other than the Computer
Science Department. Considering that each different organization is responsible for managing
its own systems and is out of the scope of the local LAN, by excluding those IPs from the
internal IP set, we can achieve greater predictability on the internal IP set. The chaos comes
from external outgoing traffic compared to the other three categories.
Based on the above observations, we propose a local defense strategy implemented within
each agent to measure quantitatively the connection behavior deviations for each individual
host.
The concept of connection used in our design is defined as a burst of packet flow exchanged
between “host IP” pairs, which may include multiple sessions marked by unique “client,server
port” pairs. A connection using TCP protocol ends only when all the TCP sessions are closed.
A connection using both TCP and UDP protocols ends when both TCP and UDP sessions
are closed. For sessions using connectionless protocols such as UDP or ICMP, since they
do not have explicit signals to mark the beginning and end of the data flow like TCP does,
we use a simple timeout scheme [37] to mark the end of a UDP session. If, after a fixed
inter-connection gap, there are no more new packets coming to a existing session, then the
session will be counted as closed.
82

O_Internal I_Internal O_External I_External0
50
100
150
200
250
Number of different IP addresses reached from each connection category
Num
ber
of d
iffer
ent I
P a
ddre
sses
TCPUDPOther
O_Internal I_Internal O_External I_External0
500
1000
1500
2000
Number of sessions from each connection category
Num
ber
of s
essi
ons
TCPUDPOther
(a) (b)
Figure 5.1: (a) Number of sessions created from 4 connection categories. (b) Number of
different IP addresses reached for 4 connection categories.
5.3.1 Weight Assignment
Each local agent uses link weight and node weight to represent the degree of connection ab-
normality. Conceptually, each node denotes an internal host that is monitored by an agent,
each link denotes a connection between two internal nodes, and each node and link are as-
sociated with a node weight vector and a link weight vector respectively. The node weight
has three components that indicates the machine behaviors from 3 connection categories,
namely, outgoing external, outgoing internal, incoming internal connection. While the node
weight indicates the connection levels’ behavior of a machine, the link weight further inves-
tigate the services within each single connection between internal nodes. The link weight
83

Host1's IP
Host2's IP
Host3's IP
Host4's IP
Host5's IP
Working set for internal IP addresses
V a
r i a b
l e s
i z e
w i t h
f i x e
d r
e m o
v a l
Screen Unit1
F e
a t u
r e
V e
c t o
r
O u
t l i e
r A
n a
l y s i
s
… …
. .
Screen Unit1
F e
a t u
r e
V e
c t o
r
Screen Unit2
O u
t l i e
r a
n a l
y s i s
F e
a t u
r e
V e
c t o
r
O u
t l i e
r A
n a
l y s i
s
Screen Unit1
F e
a t u
r e
V e
c t o
r
Screen Unit2
O u
t l i e
r a
n a l s
y i s
F e
a t u
r e
V e
c t o
r
O u
t l i e
r a
n a l y
s i s
Screen Unit3
F e
a t u
r e
V e
c t o
r
O u
t l i e
r a
n a l y
s i s
Figure 5.2: The structure of working set for internal connections
also has three components that are determined by (1) the newness of a connection; (2) the
services change for one connection; and (3) the traffic pattern change of services.
The local agent maintains three working sets: OUT-internal for outgoing internal connec-
tions, IN-internal for incoming internal connections, and OUT-external for outgoing external
connections. Each working set keeps a list of IP entries with which a local host has recently
been connected. For each IP entry in IN-internal and OUT-internal, we track down the re-
lated service patterns and screen them for abnormalities. The incoming external connections
to a workstation are explicitly prohibited and considered as illegitimate. No further analysis
is applied to incoming external connections.
The local agent operates discriminately in regard to the three working sets. Conceptually,
OUT-internal and IN-internal have the structure shown in Figure 5.2. For each IP entry in
the working set, which corresponds to the connection between the local host and the remote
84
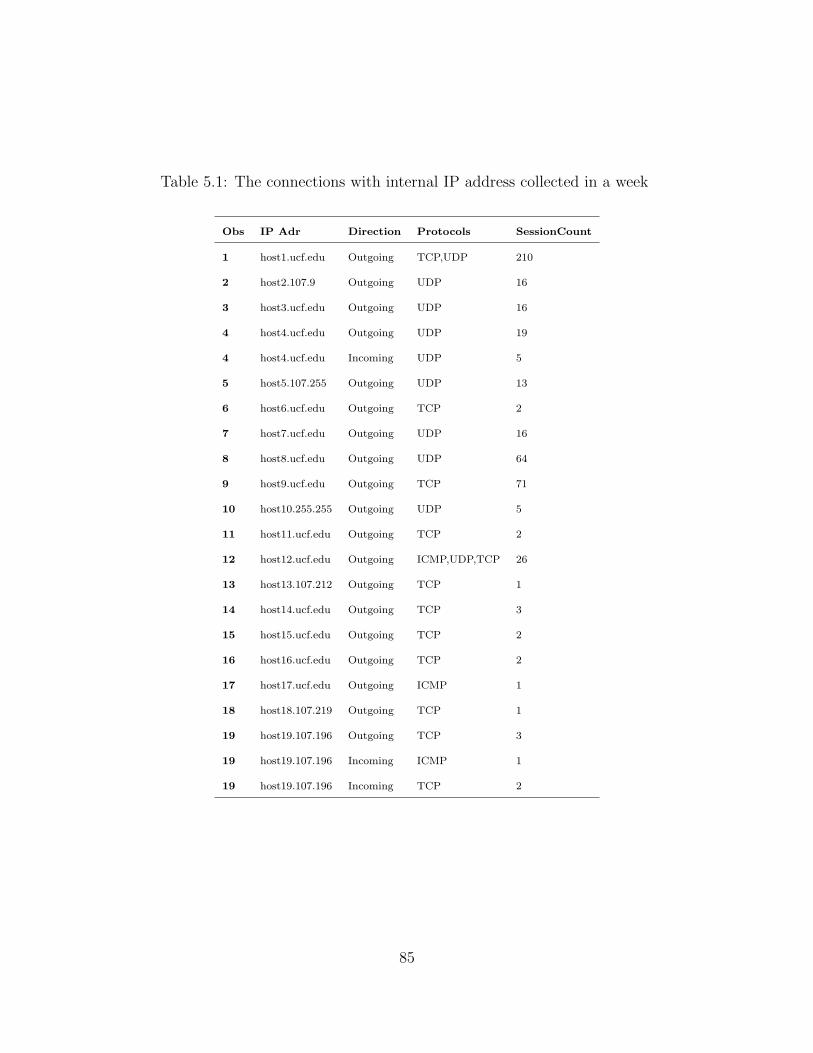
Table 5.1: The connections with internal IP address collected in a week
Obs IP Adr Direction Protocols SessionCount
1 host1.ucf.edu Outgoing TCP,UDP 210
2 host2.107.9 Outgoing UDP 16
3 host3.ucf.edu Outgoing UDP 16
4 host4.ucf.edu Outgoing UDP 19
4 host4.ucf.edu Incoming UDP 5
5 host5.107.255 Outgoing UDP 13
6 host6.ucf.edu Outgoing TCP 2
7 host7.ucf.edu Outgoing UDP 16
8 host8.ucf.edu Outgoing UDP 64
9 host9.ucf.edu Outgoing TCP 71
10 host10.255.255 Outgoing UDP 5
11 host11.ucf.edu Outgoing TCP 2
12 host12.ucf.edu Outgoing ICMP,UDP,TCP 26
13 host13.107.212 Outgoing TCP 1
14 host14.ucf.edu Outgoing TCP 3
15 host15.ucf.edu Outgoing TCP 2
16 host16.ucf.edu Outgoing TCP 2
17 host17.ucf.edu Outgoing ICMP 1
18 host18.107.219 Outgoing TCP 1
19 host19.107.196 Outgoing TCP 3
19 host19.107.196 Incoming ICMP 1
19 host19.107.196 Incoming TCP 2
85

Table 5.2: The connection observation between a desktop and an internal server: long-wood.cs.ucf.edu
Obs Protocol Remote Port) Remote TTL Session Count Service
1 TCP 80 63 1 HTTP
2 TCP 443 63 75 SSL
3 UDP 53 254 1 DNS
4 TCP 80 63 1 DNS
4 TCP 443 63 30 SSL
5 UDP 53 254 1 DNS
6 UDP 53 254 2 DNS
7 UDP 53 254 3 DNS
8 UDP 53 254 6 DNS
9 UDP 53 254 3 DNS
10 UDP 53 254 6 DNS
host with that IP, we further investigate its connection properties. As an example, Table 5.2
records the detailed session information between a desktop and an internal server during a
certain period. There are 3 different types of traffic flow between two internal hosts: DNS
service, web service and SSL service. Thus, for each type of service, a simple feature vector
and an attached outlier analysis unit are used to record and screen the service. We refer to
the feature vector and the outlier analysis unit together as a screen unit. The number of
screen units for each IP entry is heterogenous. In the case of the connection shown in Table
2, the number of screen units set up so far for this IP entry would be three.
The working set for outgoing external traffic, OUT-external, does not have a screen unit to
track down each single connection. Compared to internal connections, external connections
86
are much more complicated and unpredictable. Furthermore, the amount of traffic created
is relatively large, and the screening process for outgoing external traffic is expensive and
unnecessary. The goal of our intrusion detection system is to detect and visualize inside
hosts and attacks. The OUT-external is designed as a ”variable working set with constant
removal” [75]. That is, the size of OUT-external is not fixed. A new external address that is
not found in the OUT-external will be added, and at fixed intervals, the least recently used
entry is removed from the working set. At any given time, if the size of OUT-external is above
some threshold, this indicates the violation of locality and consequently the node weight is
changed. The fixed interval is decided by the normal outgoing connection rate, which is
affected by user behavior. Two seconds is observed by Williamson [109] as a reasonable
allowed rate under normal behavior.
The working set for outgoing internal connections, OUT-internal, also uses variable size
with fixed removal. At fixed intervals, the least frequently visited IP address will be replaced.
In addition, each internal connection entry in the working set is also associated with a link
weight. The determination of the link weight depends on the following factors: whether the
IP has been found in the working set; the appearance of a new pattern or service that does not
fit into a previous screen unit; and detection of outliers for a trusted IP with trusted services.
Typically, a sneaky fingerprinting attack or backdoor between two local hosts will be expected
to increase the link weight. The thresholds for the indication of violation of locality for OUT-
external and OUT-internal is different. Basically, we expect thOUT−external > thOUT−internal
and tOUT−external < tOUT−internal , where th denotes the threshold for the size of the working
87

set, and t denotes the removal interval for the working set. In the practical implementation,
their value for a specific host is decided by training on the normal traffic. A certain period
of time might be required for them to reach the stable state. In section 5, we show the
experimental results for those thresholds, taking ordinary workstations from our department
LAN as examples.
The working set for incoming internal connections, IN-internal, has more likelihood than
the others to capture malicious fingerprinting, backdoors and other illegitimate break-ins
targeted to the local host. The convenience brought to users by the LAN, such as Windows
resource sharing and peer-to-peer applications, comes at the cost of exploitable vulnerabilities
in the machines on the LAN. The approach adopted by many personal firewall products
such as the Microsoft XP firewall or ZoneAlarm is to block silently all incoming connection
requests, or pop up a window asking for the user’s permission. To accomplish legitimate file
sharing between local hosts often requires both users temporarily to turn off their personal
firewalls. In our case, since the incoming connection is unrelated to local user behavior,
locality cannot be used as the indicator for the local host’s abnormal behavior. Conceptually,
we split the IN-internal into two sets: one set for user-confirmed connections and one for
unconfirmed new connections. If an incoming connection cannot be found in the confirmed
set, it will be added to the new set. A user proved new connection is added to confirmed
set. For the connection in the confirmed set, if it has a property change such as new services
that cause the link weight to increase, it will be switched back to the new connection set.
88

At any time, as long as the new set is not empty, the third component within a node weight
vector will be set to 1.
When it detects abnormal node weight or link weight, an agent can either initiate an
automated local response to cut off the suspicious connections or first notify the central ana-
lyzer, where all the abnormalities are under the scrutiny of network administrators through
visualization.
5.4 WEIGHTED LINK GRAPH
In this section, we gives a top-down explanation of our distributed IDS, started from the
visualization process of the central analyzer, to the detailed weight vector assignment in
the local agent. We formalize this system by a weighted link graph, and illustrate how to
visualize and monitor the abnormal behavior of the connections associated with the attacks.
5.4.1 System Functionality
The system is composed of a set of end-user agents and a centralized analyzer. The end-user
agents are deployed at each individual computer to capture the variations in connection
behavior for the host, while a centralized analyzer is used to collect the information from
each agent and monitor the global intrusion incidents. The central analyzer is responsible
89

for building a graph that visualizes the logical connections grid of the local network. The
weight vector from the agent will score the abnormality of nodes and edges of this graph.
The deployment of agents, eg. how many agents are installed to either cover the whole LAN
or a subset of LAN, will essentially decide how complete a central analyzer can recover the
logical connection grid.
5.4.2 Graph Construction
Using graph theory, our system can be represented by a weighted link graph G = 〈V , E ,Ψ ,Φ〉,
where V is the node set of G, E is the link (or edge) set of G, Ψ is the set of node weights
for the nodes, and Φ is the set of link weights for the links. Each node, vi ∈ V, denotes an
internal host. Each link, evi,vj∈ E , denotes a logical connection between two nodes vi and
vj. After collecting weight information from the agents, a weighted link graph is constructed
at the centralized analyzer. The information sent by a agent includes two parts: the first
part is the node weight, and the second part is a list of “over-weighted” link weight vectors
and the corresponding end-point IP addresses from OUT-internal and IN-internal.
Installing an agent on every computer will create redundant link weight information. In
addition, the central analyzer is able to map a remote node from the list of over-weighted
links, which is illustrated in Algorithm 5.3. For an average-sized LAN with hundreds of
hosts, some of the hosts may not experience frequent connection activity; thus, by changing
the deployment of the agents on the LAN, the analyzer can create the graph to cover certain
90

(a) (b)
Computer
Computer
Computer
Computer
Computer
Computer
Computer
Computer
Computer
Computer
Computer
Computer
Computer
Computer
Computer
Computer
Computer
Computer Computer Computer
Server Server Server
Router Router
Figure 5.3: (a)The connections in a small LAN. (b)The layout using Spring Embedder
algorithm
parts of the network accordingly. On the other hand, if we want to install the agents to
cover as much of the network as possible, the “minimum vertex cover” can be used to solve
this problem.
In graph theory, a vertex cover of a graph is a set of vertices (nodes) that covers all the
edges (links). That is, every edge is incident to at least one vertex in the set. The problem of
minimum vertex cover is to find a smallest set of such nodes. In our case, we can assume the
network topology is a complete graph, then find its minimum vertex cover and selectively
install the agents only on the nodes in the minimum set.
Initially, the node set of the graph only includes the host with the agent, thus |V| = N ,
N is the number of agents. The size of edge set is zero: |E| = |Φ| = 0. For each node
vi ∈ V, the node weight vector ψvi= [0, 0], where ψvi
∈ Ψ and |Ψ | = N . Then, as an agent
reports the new node weight and over-weighted links to the analyzer, the graph G will first
update the node weight; then for each over-weighted link, if the end host of this link can be
91

Table 5.3: The algorithm for building G
For each ai ∈ Aupdate the Ψvi
, where vi = aifor each over-weighted link hj of ai, where hj ∈ Hai
,if find IPhj
= IPviwhere vi ∈ V
update eai,hj
update Φai,hj
elseCreate new node u for IPhj
, V = V ∪ uadd eai,uupdate Φai,u
found in the current node set V (matching IP address), the graph G will update the edge
and associated weight. Otherwise, a new node will be created and added to V , and then the
edge will be added and its weight set to the new link weight.
The detailed algorithm for updates of G upon receiving the information from an agent
ai ∈ A, where A ⊆ V , is shown in table 5.3. Let Haidenote the set of the over-weighted
link for the agent ai, IPvidenote the IP address of node vi, and IPhj
denote the IP address
of the node that has an over-weighted connection (hj) with ai.
The information update from the agents to the analyzer is an asynchronous process.
There are two schema for when to update the information. First, each agent could send the
information periodically. Second, the update process could be triggered by the emerge of
new situations; for example, the change of a link weight vector or the node weight vector.
92

132.170.107.167
132.170.107.167
Figure 5.4: The circular layout (above) and the layout using Spring Embedder (below).
5.4.3 Graph Drawing
To create an aesthetic layout of the graph so that a human can intuitively comprehend
the structure of the graph and consequently help to stop an intrusion incident, we use the
Spring Embedder algorithm for graph drawing. Spring Embedder [40] is perhaps the best
known force-directed graph drawing technique. It has been widely used for network traffic
analysis such as connections between web sites [76] and Internet traffic visualization [80].
Conceptually, the Spring Embedder algorithm considers the graph drawing problem as an
energy minimization problem, where each edge is replaced by a spring and each vertex is
replaced by a charged particle. The particles will repel each other, and the springs will
93

Figure 5.5: The layout using Spring Embedder with edges’ thickness proportional to the
edges weight.
attract their end points when stretched. Thus, if we put the vertices of a graph at random
places, the vertices will be moved by the forces and become stable when the overall system
energy is minimized. The resulted graph will have a nice layout where the number of crossing
edges is minimized and the nodes have a reasonable distance from each other.
Figure 5.3.b is the graphical representation of the connections in a small LAN using Spring
Embedder algorithm. The original layout is shown in figure 5.3.a. The first layout represents
the connection status with better comprehensibility compared to the second one. Figure 5.4
shows a weighted link graph with intrusions present. There are two types of layout for the
graph: one is circular, and the other one is the result from Spring Embedder, taking the
circular layout as the original input. The latter gives a clearer layout for an administrator
94

to understand intrusion incidents. Figure 5.5 shows the final picture constructed by the
central analyzer when considering the edges’ weight. It is generated by the free software
Netdraw [33], where the edges’ thickness is proportional to their weight and the node weight
is represented by different colors.
The overall time complexity of the Spring Embedder algorithm is O(n3), where n is
the number of vertices, which means the algorithm is limited to a graph with few hundred
nodes. Thus, Spring Embedder would not scale up well to large graphs especially when our
visualization process also needs dynamic update with adding or removing of vertices and
edges. As a future work, multi-scale graph drawing could be considered as alternative for
our graph drawing since the edges in our graph are suppose to be sparse, which may make
multi-scale method such as Hall’s model [49] applicable.
5.4.4 Weight Vectors
Each agent in IDS will keep two types of weight vectors. The first is the node weight vector. A
node weight vector is defined as ψ = [α, β, γ]. The first two components, which indicate how
frequently a host communicates with a stranger (new IP), are straightforwardly determined
by whether there is any violation of locality from the outgoing working sets: exOUT and
primeOUT. The value for each component is 0 if there is no violation, 1 otherwise. γ works
differently for primeIN: When the size of unconfirmed set is not zero, γ is set to 1, otherwise
it is zero. Hence a node weight vector of [0, 0, 0] would indicate a relatively normal host. In
95

case of a sweep attack, worm or DOS attack, whether the monitored host is a victim or a
controlled attacker can be determined based on the node weight.
5.4.4.1 Link Weight Vector
The link weight vector is only for internal connections and is composed by three components,
such that for each link evi,vj, the weight vector φvi,vj
= [w1, w2, w3]. w1 defines slightly
different for two internal working set. For a connection with remote IP address ρ in working
set OUT-internal, w1 is defined as:
w1 =
1 if ρ is not found in the working set
0 otherwise
For the connections in working set IN-internal, w1 is defined as:
w1 =
1 if ρ is in the unconfirmed set
0 if ρ is in the confirmed set
The next step is to test whether a link has sudden change in terms of services. We use
w2 to indicate how well the service flows fit with previous services stored in the screen unit.
The feature vector we used to indicate the service type is shown in Table 5.5. These features
are a reliable indication of the service type. For example, if a flow between a desktop and
a server is using the UDP protocol with a well-known port, e.g., DNS (53) with constant
remote TTL value, it is very likely that the DNS service is a regular service provided by a
internal server. The discovery of an anomalous feature vector could be either an attack or
96

unusual but not necessarily intrusive network behaviors that should be of interest for the
network security analyst. We treat the set of screen units as another special working set,
but with fixed size. The size of the screen set is large enough to cover legitimate services
that are normally expected from this connection. For example, the traffic shown in Figure
5.2 would need 3 screen units to cover its normal activities. When a new service appears,
the least recently used service is replaced with the new one if the size of the screen unit has
reached the limit. Hence, w2 is defined as the swapping rate with which the replacement
happens.
Based on observations of illegitimate port scans, regardless of whether they are sneaky
or aggressive, we have the following observations for the pattern of malicious probes. Thus
it is not difficult to design a real-time algorithm to automatically determine the size for the
screen set.
1. No Payload involved
2. Number of packet from Source < a small number (most of case is under 3)
3. No responses from destination, or negative responses (such as RST) from destination.
The algorithms that automatically decide the right size for screen set is illustrated in
table 5.4. Initially, V is the set of all unidentified feature vector, S is the set of legitimate
feature vector, T designates a empirical value of time.
Once the traffic flow/session is clustered into an existing screen unit based on the feature
vector, we further investigate if the trusted service has the same characteristics as before.
97

Table 5.4: The algorithm for determine the size of screen set S
For a packet P with feature vector vp
if (vp is new)update vp.hasPayloadvp.numberSrcPk = 1vp.numberDstPk = 0record vp.startT ime, vp.endT ime = vp.startT ime
else if (vp is not new)if P is from Source
vp.numberSrcPk + +if P is from Destination
vp.numberDstPk + +Update vp.NegativeReponse
update vp.hasPayloadupdate vp.endT ime
For all vp ∈ V , if vp.Duration > T checkif (vp.hasPayload == true and vp.numberDstPk 6= 0 and vp.NegativeResponse == false)if (vp.hasPayload == false and vp.numberSrcPk ≥ 3 and vp.NegativeResponse == false)S= S ∪ vp
size(S)++
Table 5.5: The components of a feature vector within a screen unit
Feature for primeOUT Feature for primeIN
Protocol Protocol
Remote Ports Local Ports
TTL TTL
98

The outlier analysis unit is responsible for a fine-scaled data mining process. The third
component w3 of the link weight is the indication of how well the flow pattern of current
service matches the previous ones.
5.4.4.2 Outlier Detection
Outlier detection is one of the major approaches for anomaly detection. An outlier is defined
as a data point, in our case, a session, that deviates from the rest of the sessions based on
some measure. The basic schema is to identify normal behavior, construct a useful set of
features, then apply the outlier detection algorithm to the unidentified data. In our case,
the input domain for outlier detection is a fine-scaled domain in which the traffic has already
been divided into connections, the connection traffic is further clustered into service flows,
and each session flow that belongs to the same service is the basic input data unit to which
we apply the outlier detection algorithm. Therefore, we expect the outlier detection to be
both efficient and accurate. Table 5.6 shows the statistics generated by typical UDP traffic
between a desktop and an internal server in our LAN with time spanning a week. Notice
that certain features such as source/destination packet rate, source/destination throughput,
source/destination average packet size and packet variance are very close to each other at
any given time.
To determine the value of w3 for UDP-based internal traffic, we use Mahalanobis distance
to compare a new feature vector with the old ones [102]. Mahalanobis distance is used to
99

Table 5.6: The session collected for bootStrap service for internal server: *.*.107.109
Dst
Port
Src
Bytes
Dst
Bytes
Duration
(sec)
Src
PkRate
Dst
PkRate
Src
Thr
Dst
Thr
Src
Avg
Pksz
Dst
Avg
Pksz
Src
Var
Pksz
Dst
Var
Pksz
67 5190 5814 4200.2316 0.003571 0.004047 1.235646 1.384209 346 342 0 0
67 3114 3078 2400.1931 0.00375 0.00375 1.297396 1.282397 346 342 0 0
67 3806 3762 3000.121 0.003667 0.003667 1.268615 1.253949 346 342 0 0
67 91344 91656 78900.935 0.003346 0.003397 1.157705 1.161659 346 342 0 0
67 89614 89946 77402.393 0.003346 0.003398 1.157768 1.162057 346 342 0 0
67 99994 100206 85810.631 0.003368 0.003414 1.165287 1.167757 346 342 0 0
67 2768 2736 2100.3292 0.003809 0.003809 1.317889 1.302653 346 342 0 0
67 85808 86184 74101.459 0.003347 0.003401 1.15798 1.163054 346 342 0 0
67 704 684 300.0627 0.006665 0.006665 2.346176 2.279524 352 342 0 0
67 1730 1710 1200.1352 0.004166 0.004166 1.441504 1.424839 346 342 0 0
100

determine the similarity of a set of values from an unknown sample to a set of values measured
from a collection of known samples. It measures distances in multidimensional spaces by
taking the distribution of the known samples into account; thus it is superior to Euclidean
distance for our purposes.
Mahalanobis distance is calculated using the following formula:
D2(x) = (x − µ)S−1(x − µ)′
where x ∈ Rp is the new vector from unknown samples, µ ∈ R
p is the mean vector of the
known samples and S−1 ∈ Rp×p is the inverse covariance matrix of the known samples. Thus,
for UDP traffic the value of w3 is calculated as
w3 =
1 if D2(xn) ≥ (1000 × D̄2)
D(xn)
1000×D̄if (10 × D̄2) < D(xn) < (1000 × D̄2)
0 otherwise
where xn is the feature vector of a new connection, and D̄2 is the mean D2(x) of the normal
connections.
5.4.5 Intrusion Patterns
Once the central analyzer receives the new weight information from the agents, the weighted
link graph G will be updated in real time. Then, within the graph, the central analyzer is
101

responsible for identifying interesting topologies that can lead to interrelated attacks. For
example, trees may indicate worms, stars may be related with IP sweeps or DOS attack,
chains may be the track of controlled backdoor with proxies. For each of these abnormal
shapes, corresponding shape detector can recognize them as the potential attacks and trigger
the alarm. We will not describe the detail algorithms for recognizing these special topologies,
since they have been well established in the graph theory.
If a worm is spreading in the local network, it will create many unique connections that
are distinct from the normal connection activities within a network [109, 104, 100]. However,
the effects of a fast propagated worm and a stealth worm are different in a graph. In Figure
5.6.a, the worm begins on host A, then initiates connections to host B and C which cause
them to be infected. The two abnormal connections 1 and 2 are reported to the analyzer
and shown in the same graph since they occur closely in time. Nevertheless, if enough time
passes before the abnormal connections 3, 4, 5 and 6 from host B and C, the tree topology
might be segmented in time. Especially when there are other ongoing attacks involving host
A B and C, the graph might be updated due to new situation before forming a complete tree
for the worms. On the other hand, for a fast propagated worm, the connections 3-6 will be
added to the graph together with the previous two abnormal connections before the graph’s
time stamp is updated. It is same situation for a star topology as showed in figure 5.6.b
when the connections are isolated in time and mixed with other attacks, e.g. the connection
1 and 2 is mixed with ’unknown’ attack.
102

A
B
E
F
D
G
H
2
3
4
5
6
( a )
1
A
B
E
F
C
D
G
H
1
2
3 4
5
7
( b )
….
Time interval 1 Time interval 2
unkown
Time interval 1
Figure 5.6: The two shapes that indicate the attacks. If the attack is conducted slowly,
the over-weighted connections may not showed together in the graph within a short time
interval. (a) worms spreading. (b) IP sweep.
To deal with shape segmentation, one possible solution is to let the analyzer keep a series
of snapshot of the graph, which records the recent history of graph shape. Conceptually,
it is similar like the people using cameras to take the snapshot of a moving object. Then,
by reassemble each snapshot together, we can identify the moving trend. The idea is used
to solve more sophisticated slow attacks, it may require a more powerful machine for the
central analyzer to keep up with the performance.
5.4.6 Possible Responses for Overweight
The countermeasures to the attacks are either prompted directly by the agent itself, or by
the command from the central analyzer to the agent.
103

Upon the increase of node weight and link weight, an agent have several choices based on
the different situations. One possible response is to set up threshold values for node weight
and link weight. For those over-weighted links, either silently block the future connections
or simply ask the computer user to decide whether to allow the future connection from/to a
certain suspicious IP. If a node is severely over-weighted, it indicates that the possibility of
this node being attacked is much higher. Therefore, the agent should either shut down all
the network activities or ask the user for the decision.
In the case that the central analyzer identifies the attack, it sends command to the every
agent that involved in the attack. The victim and attacking machines, then, can shut down
the connection simultaneously to stop the attack.
5.5 WHY WEIGHT CHANGES
We listed some of the commonly reasons that possibly cause the changes that we discussed.
Suppose the entity being monitored is machine A,
• new internal IP address from B
possible causes:
1. physical Move of B, or physical move of node A (from one network session to
another, thus making new friends such as DNS server,routing service...)
2. New machines have been setup or new services have been recently added to this IP
104

node.
3. This is a spoofed internal IP, or a internal node B with this IP is truly compromised
4. It has not contacted with A for quite a while.
• new external IP address from B
possible causes:
1. Change address of service provider.
2. Switch of users of A causes different personal activities.
3. This is a spoofed IP, or a node with this IP is attacking A
• new services within same connection
possible causes for the changes:
1. node type changed, such as a DNS server turns to a web server
2. New services added to the node, such as a web server added a FTP service
3. New software installed on the node, for example, the user just installed a yahoo
messenger
4. Physical topology change, one machine is moved from one network session to an-
other.
5. node being hacked/attacked
6. User’s behavior is weird.( The time is changed from daytime to midnight)
• Same service features, but new traffic flow patterns
105

possible causes for the changes:
1. available bandwidth changed (change due to less competition for bandwidth)
2. physical transmission medium upgraded, (including wire, router change,blah blah)
3. application upgraded/bug fixed with better/worse running time, and activities
patterns.
4. B has been compromised, the old service is been hijacked.
5.6 EXPERIMENTAL RESULTS
The experiment environment is the local network of our Computer Science Department. The
network consists of over one hundred desktops and several servers. The implementation of
the local detection mechanism uses the publicly-available packet sniffer pacanal [14].
5.6.1 The Size of Working Sets
The size for the working set OUT-external under normal traffic is shown in Figure 5.7.
Figure 5.7(a) shows the size of OUT-external with fixed removal interval of 2 seconds; each
line corresponds to one snapshot, all of them using the least-recently-visited replacement
strategy and with the same removal interval. The size of OUT-external tends to be zero or
1 when there is no user activity present, and the size reaches a maximum of 6 at the peak
106

0 50 100 150−1
0
1
2
3
4
5
6
7
8
9
10S
ize
of O
UT
−ex
tern
al
Duration in seconds
The size of OUT−external with removal interval 2 seconds
Observation 1Observation 2Observation 3Observation 4Observation 5Observation 6
0 50 100 150
0
5
10
15
20
25
30
Siz
e of
OU
T−
exte
rnal
Duration in seconds
The size of OUT−external with different removal intervals
Fixed Removal Interval: 2 secondsFixed Removal Interval: 4 secondsFixed Removal Interval: 5 secondsFixed Removal Interval: 8 seconds
(a) (b)
Figure 5.7: The normal size of OUT-external. (a) With removal interval of 2 seconds. (b)
With different removal intervals.
of user activity. Figure 5.7(b) shows the size of OUT-external with least-recently-visited
removal but different removal intervals; each line corresponds to the size of OUT-external
with removal interval from 2 to 8 seconds. The size of OUT-external reaches a maximum of
20 when the removal interval is 8 seconds.
Based on our experiment, the threshold for the working set of outgoing external traffic
can be a small number, around 10 with a removal interval of 2 seconds. On the other hand,
the size of OUT-internal and IN-internal is even smaller under normal traffic. Figures 5.8,
5.9 and 5.10 show the normal size of OUT-internal using removal interval of at least 10
seconds. Figure 5.8 is the size of OUT-internal when removing the least recently visited or
least frequently visited IP every 10 seconds. The three lines in Figure 5.9 represent the size
107

0 50 100 150 200 250 300 350 400 450 500 5500
1
2
3
4
5
6
7
8
9
10
Siz
e of
OU
T−
inte
rnal
Duration in seconds
The size of OUT−internal with removal interval 10 seconds
Observation 1 with least frequently visited replacementObservation 2 with least frequently visited replacementObservation 3 with least recently visited replacementObservation 4 with least recently visited replacement
Figure 5.8: The normal size of OUT-internal
with removal interval of 10 seconds.
0 50 100 150 200 250 300 350 400 450 500 5500
1
2
3
4
5
6
7
8
9
10
Siz
e of
OU
T−
inte
rnal
Duration in seconds
The size of OUT−internal with removal interval from 10 to 30 seconds
Remove the least frequently visited IP every 10 seconds, Remove the least frequently visited IP every 20 secondsRemove the least frequently visited IP every 30 seconds
Figure 5.9: Least frequently visited replace-
ment with different removal intervals.
of OUT-internal with removal intervals of 10, 20, and 30 seconds respectively and the least-
frequently-visited replacement strategy. The same goes for 5.10 but with the least-recently-
visited removal strategy. The worst case as shown in the picture is when we replace the least
recently visited IP every 30 seconds. Thus, compared to the threshold and removal interval
used for OUT-external, our experiment suggests a smaller threshold and a bigger removal
interval for OUT-internal. Our experiment results also suggest that using least-frequently-
visited removal is better than least-recently-visited removal. A reasonable explanation is
that, compared to the outgoing external traffic, certain internal network services do not
involve user interactions and are thus less affected by the user behavior; consequently, they
are less affected by locality.
Figure 5.11 is the size of OUT-internal under the sweep attack created by nmap [9].
Using aggressive or normal speed, the exceeding of the working set threshold is very obvious,
108

0 50 100 150 200 250 300 350 400 450 500 5500
1
2
3
4
5
6
7
8
9
10
Siz
e of
OU
T−
inte
rnal
Duration in seconds
The size of OUT−internal with removal interval from 10 to 30 seconds
Remove the least recently visited IP every 10 seconds, Remove the least recently visited IP every 20 secondsRemove the least recently visited IP every 30 seconds
Figure 5.10: Least recently visited replace-
ment with different removal intervals.
0 50 100 150 200 250 3000
5
10
15
20
25
30
35
40
Siz
e of
OU
T−
inte
rnal
Duration in seconds
The size of OUT−internal with sweep attack in different speeds (removal interval 10 seconds)
Normal trafficWith aggressive nmap scanWith normal nmap scanWith sneaky nmap scan
Figure 5.11: The size of OUT-internal
when sweep attacks with different speeds are
present.
as shown in the picture. However, a sneaky sweep does not create any changes in the size of
the working set compared to normal traffic. Therefore, a sneaky sweep is undetectable using
node weight.
5.6.2 Swapping Rate
Figure 5.13 shows the number of changes per 10 seconds for the screen unit set of a internal
server, assuming the size of the screen unit set is 1. The normal services provided include
FTP and SSH. We investigate FTP traffic because a normal FTP bulk data transfer will
open more remote ports on the server side than the other kinds of services as shown in Figure
5.12 . Thus, we compare the swapping rate of normal FTP traffic with the port scan traffic
109

FTP Bulk Data Transfer Sessions
Figure 5.12: A difficult case with legitimate FTP bulk data transfer which opens many ports.
0 100 200 300 400 500 600 700 800 900 10000
50
100
150
200
250
300
Num
ber
of c
hang
es p
er 1
0 se
cond
s
Duration in seconds
Number of changes with working set size of 1
Normal traffic with FTP Bulk dataNormal traffic with FTP Bulk dataNormal port scanPolite port scanSneaky port scanParanoid port scan
0 100 200 300 400 500 600 700 800 900 10000
1
2
3
4
5
6
7
8
Num
ber
of c
hang
es p
er 1
0 se
cond
s
Duration in seconds
Number of changes with working set size of 1
Normal traffic with FTP Bulk dataNormal traffic with FTP Bulk dataSneaky port scanParanoid port scan
(a) (b)
Figure 5.13: The number of changes on the content of screen unit set. (a) Normal traffic
and port scan traffic. (b) Zoom in picture of (a) with normal traffic and sneaky port scan.
110

Figure 5.14: A common case of traffic between a workstation and an internal server, where
number of service vector involved is less than the FTP transfer.
created by nmap with screen set size of 1. As shown in Figure 5.13.(a) the swapping rate
created by port scan with normal speed is much higher than the one created by normal FTP
traffic. On the other hand, as shown in Figure 5.13.(b), the highest swapping rate caused by
a paranoid port is close to the swapping rate caused by FTP bulk data transfer, when the
size of working set is 1.
As another example, Figure 5.14 shows the services between a workstation and an internal
server, where the number of service vector involved is less than the FTP transfer, and is more
common in the reality. Figure 5.15 shows the swapping rate of this normal traffic comparing
with the stealthy port scan with the size of working set increase from 2 to 5. As showed in
Figure 5.15 (a) and (b), when the size of screen set increases to 3, there will be no swapping
111

(d) (c)
(a) (b)
Figure 5.15: The swapping rate as the size of screen set increase.
112

for the normal services, which means that with the right size of screen set, we have chance
to capture the sneaky scan. At the other hand, the swapping of service vector will not go
away for the sneaky port scan when the size of screen unit is increased, the swapping will
disappear temporally at the beginning of scans, but eventually they will come back as more
new ports being scanned. The sneaky scan will be not distinguishable from normal traffic
unless the attacker only interested in a very small range of ports.
5.6.3 Stealthy Intrusions
It is easy to detect a host which is conducting an aggressive attack to others. As showed in
figure 5.16.(a) and 5.16.(b), either it is an IP sweep or port scan, they will cause the node
weight dramatically increase, thus distinguish themselves from normal traffic. In addition
to node weight, the attack will also cause the appearance of new links and the star-shape
in the weighted link graph. However, it is not the case for the stealth attack as showed in
figure 5.16.(c) and 5.16.(d), where we can not tell an attack by the node weight since they
are conducted with low rate, e.g.0.0025 packet per second. The link weight is easy to catch
both of them if they are connected to/from a new IP. For the worst situation if the attacker
is a once trusted computer for the victim and possibly are having the same static feature (w2
will not increase), then we shall expect the third component of link weight: w3 capture the
sudden pattern change since it is difficult for an attacker to manipulate the statistical traffic
features to camouflage the attack traffic with the normal ones. The statistical features we
113

(a) (b)
(d) (c)
IP sweep 1
Normal traffic
IP sweep 2
Stealthy IP sweep
Normal traffic
port sweep with packet rate > 9 pps
Stealthy port sweep with packet rate < 6 pps
Undistinguishable from normal traffic
Undistinguishable from normal traffic
Figure 5.16: The comparison of new connection rate α between Sweep attack and normal traffic.
(a) The top line is the an sweep attack, which scan ports selectively once found an host is active.
The middle line is also an sweep attack, which scan all the ports once found an host is active. The
bottom line corresponds to the new connection rate of the normal traffic. (b) The swap rate γ of
port scan (c) The comparison of new connection rate α between stealth Sweep attack and normal
traffic. (d) The swap rate γ of a stealth port scan
114

used for the test to decide w3 are showed in table 5.7. We test the value of w3 for the stealth
port sweep attack, which is mixed with normal traffic, and has the spoofed IP and the same
static features as the legitimate traffic.
Table 5.7 lists the features used for outlier detection for UDP services. Table 5.8 shows
the Mahalanobis distance for sessions created by a DNS service and a Netbios name service.
Clearly the last two elements are outliers; they are created by the port sweep traffic. The
Mahalanobis distance of the last two sessions are enormously different from the normal ones.
5.7 CONCLUSIONS
The performance of our system relies on training using the normal traffic to accurately de-
termine the threshold and removal intervals of working sets. Different network environments
may require different parameters for determining the node weight to reflect the true state
of computer behavior. In this sense, our IDS is a supervised system that needs a training
period to achieve stable performance.
In all, we have proposed a distributed personal IDS with a central graphical analyzer.
We use a novel weight assignment schema for the local detection within each end agent. The
local abnormalities are quantitatively detected using the node weight and link weight and
further sent to the central analyzer to build the weighted link graph. The system is aims to
provide the double protection besides the firewall to prevent the inside corruptions.
115

Statistical features
Source Variance of packet size
Destination Variance of packet size
Source packet rate
Destination packet rate
Source Average packet size
Destination Average packet size
Source Throughput in bytes per second
Destination Throughput in bytes per second
Table 5.7: The eight statistical features used
for calculating W3 for UDP services.
Session DNS MD NBNS MD
1 8.0813 5.9591
2 1.6949 1.8598
3 4.1784 8.0522
4 2.5378 0.8481
5 4.1862 2.6391
6 7.7474 1.1290
7 0.9066 0.529
8 1.3826 4.6739
9 8.1000 6.8543
10 6.1849 2.2098
11 1.9710e+015 1.3341e+015
12 2.067e+015 1.9641e+015
Table 5.8: Column 2 is the Mahalanobis dis-
tance for traffic to a DNS server, column 3
is the Mahalanobis distance for Netbios Name
services traffic. The first 10 sessions are nor-
mal ones while the last two are from a port
sweep.
116
CHAPTER 6
SIMULATION OF NETWORK INTRUSION
Intrusion detection algorithms are typically effective in detecting intrusions of known signa-
tures, but poor in detecting new attacks. Studying and testing a new intrusion detection
algorithm against a variety of intrusive activities under realistic background traffic is an in-
teresting and difficult problem. Such studies can be performed either in a real environment
or in a simulated environment [111]. We now briefly summarize these two approaches of
simulating intrusion and their relative merits, followed by a description of our approach.
• Simulation in Real Environments
In this approach many real users produce significant background traffic by using a
variety of network services, e.g., mail, telnet, etc. This background traffic is collected
and recorded, and intrusive activities can be emulated by running exploit scripts. The
advantage of this approach is that the background traffic is sufficiently realistic, which
eliminates the need of analyzing and simulating the patterns of normal user activities.
However, the following drawbacks have been reported [111]: ” The testing environment
may be exposed to the attacks from the Internet, in addition to the simulated attacks. ”
117

The inaccuracy of the results may increase if the background traffic contains unexpected
intrusive data originated from outside sources. ” Normal system operations could be
interrupted by simulated attacks.
• Simulation in Experimental Environments
Most researchers perform testing and studies in experimental or simulated environ-
ments, due to the high risk of performing tests in a real environment [111]. In this
approach realistic background traffic can be generated in the following three ways. (1)
employing humans to manually perform whatever occurs in a real environment. (2)
using simulation scripts to generate data conforming to the statistical distributions of
background traffic in a real environment. (3) collecting from a real environment and
replicating in the simulated environment.
The disadvantages of studying intrusions in simulated environments include:
– The overload of manually producing background traffic involving many users can
be very high.
– The behaviors of real users are difficult to model, and there are no standardized
statistical distributions of the background traffic.
118
6.1 SIMULATION OF INTRUSION BY OPNET
We use OPNET to build the simulated network environment. The network traffic source
comes from the MIT/Lincoln Lab TCPDUMP files, which contain intrusion traffic simulating
various network attacks [5]. Alternatively, we could use software tools such as NMAP [?]
and our own scanners to generate attacks while running a network sniffer such as Ethereal
[7] to capture the network traffic, with the attack and network sniffing activities all occurring
in a controlled lab environment. The captured Ethereal file which includes the attack data
and normal user data if desired, can be used in our intrusion simulation experiment.
For both the TCPDUMP file and Ethereal file, we use our own pre-processing tools to ex-
tract the traffic information that is necessary for OPNET simulation. Our tools can parse the
TCPDUMP file and Ethereal file, extracting the data packet headers, the flag information,
and the time distribution. The OPNET software provides an ACE (ApplicationCharacterizationEnvironment
module which can be used to import packet traces into simulation, supporting packet for-
mats of various sources including TCPDUMP files [12]. We are using our approach because
of the flexibility of selecting parts of the data packets and slicing large data files into more
manageable pieces prior to simulation.
119

6.1.1 Simulation Models Using OPNET
We are using OPNET for our research because of the several benefits it offers. OPNET
provides a GUI for the topology design, which allows for realistic simulation of networks,
and has a performance data collection and display module.. Another advantage of using
OPNET is that it has been used extensively and there is wide confidence in the validity
of the results it produces. OPNET enables realistic analysis of performance measures and
the effectiveness of intrusion detection techniques. In a similar work, OPNET was used in
a performance study of an intrusion detection system using statistical preprocessing and
neural network classification [114]. One of our research goals is to study techniques that
can speed up OPNET simulation for large data files suspected of intrusion attacks.
6.1.1.1 Generating Intrusion Data
We first use the Dosnuke attack as an example to illustrate the process of our intrusion
simulation. Dosnuke is a type of the denial-of-service attacks which sends Out-Of-Band
data (MSG OOB) to port 139 (NetBIOS) of a Windows NT system, causing the victim
to crash (blue screens the machine) [3]. The attack can be detected by searching the sniffed
data for a NetBIOS handshake followed by NetBIOS packets with the ”urg” flag set. We used
the data of the TCPDUMP outside file (1999/week5/Mondaydataset) from MIT/Lincoln
Lab which contains Dosnuke attack packets [5].
120
6.1.1.2 Customizing Data Packet Format
We defined our own packet format in the OPNET simulation. The packet corresponds to
the IP header, which includes the IP addresses, port numbers, the flags, and a few other
fields.
6.1.1.3 Pre-processing Source Traffic File
Before we could build the simulated network model using OPNET, we need to first pre-
process the TCPDUMP file (orEtherealfile) to extract pertinent information, including:
• The packet inter-arrival times, which are saved as a list of double-type values.
• The time duration, which is the time difference between the first packet and the last
packet of the traffic source.
• A list of the distinct IP addresses in the traffic source.
6.1.1.4 Building Network Models
Figure 6.1 shows the OPNET model for simulating the Dosnuke attack. There are 10 virtual
PC nodes arranged into two columns in the figure: PC 0 - 4 on the left side and PC 5 9
on the right side. The top node in the center column is the ”generator”, which prepares the
121

Figure 6.1: The network model simulating Dosnuke intrusion
packets extracted from the traffic source. Once a packet is ready, it is given to its source PC
node, and from there it will be sent to the destination PC node through the hub (located at
the bottom of the center column). There is no delay between the generator and the end PC
nodes, so the traffic flow is consistent with the captured traffic source.
The number of the virtual PCs is the outcome of pre-processing the source traffic file.
Since there are 10 distinct IP addresses in the source, the model uses 10 PC nodes connected
to each other through a hub. Node 0 (the top node in the right side column) is the ”hacker”,
and node 1 (below node 0 in the figure) is the ”victim” of the Dosnuke attack. There is
a ”firewall” node between the victim and the hub which we use to capture suspicious data
packets to or from the victim using the Dosnuke attack’s signature.
The node domain of the ”generator” is shown in Figure 6.2.a. There is a generator
module (pk generator) configured to use a script file of inter-arrival times for generating the
122

packets. The script file is the result of pre-processing the traffic source. Figure 6.2.b shows
the attribute panel of pk generator
(a) (b)
Figure 6.2: The packet generator (a) The node structure of the packet generator (b) The
attribute panel of ”pk generator”
Within the ”dispatch” module of the generator node in Figure 6.2.a, the traffic source file
is parsed and the next data packet extracted. Whenever a packet arrives from ”pk generator”,
its fields are set according to the corresponding values of the data packet from the source
traffic, e.g., the destination, flags, etc. Then, the packet is sent to the PC node correspond-
ing to the source IP address. Thus, the packet arrival time and its contents will match the
information as in the original traffic source.
Figure 6.3.a depicts the process domain for each virtual PC, which supports the packet
streams in and out. Figure 6.3.b is the code domain of each process node. We also set up
a firewall between the hub and the victim of the dosnuke attack. The firewall uses a simple
123

(a) (b)
Figure 6.3: Process domain and code domain (a) The structure of the virtual PC in process
domain (b) The code implemented for each process node.
signature-based detection which looks for packets sent to port 139 (NetBIOS) of the victim
PC with the ”urg” flag set in the packet header.
The pre-processing tools we developed can be reused for simulating other types of in-
trusion attacks. To demonstrate, we also simulated the ProcessTable DOS attack using the
MIT/Lincoln Lab TCPDUMP files. We needed to set up a network in OPNET using 20
PC nodes because there are 20 distinct IP addresses involved in the traffic source. We also
modified the intrusion detection logic of the firewall node using the new attack’s signature,
and added the corresponding statistical measures to the OPNET simulation. The results of
the simulations are described in the following section.
124
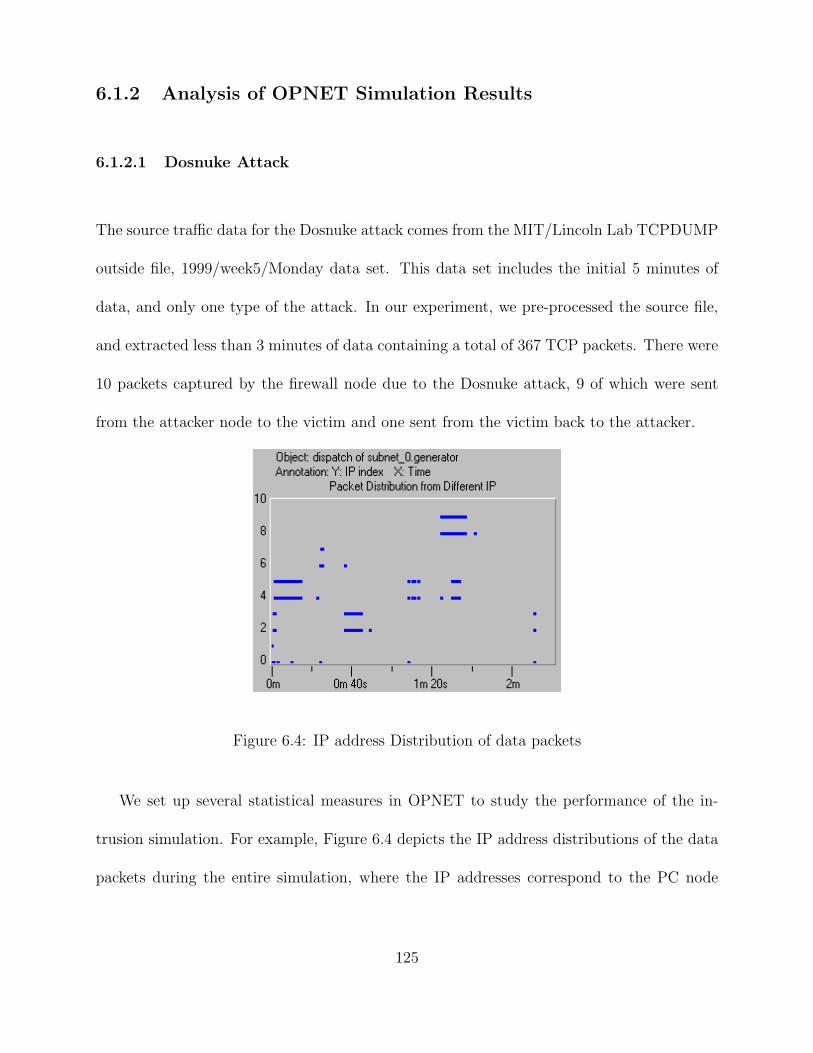
6.1.2 Analysis of OPNET Simulation Results
6.1.2.1 Dosnuke Attack
The source traffic data for the Dosnuke attack comes from the MIT/Lincoln Lab TCPDUMP
outside file, 1999/week5/Monday data set. This data set includes the initial 5 minutes of
data, and only one type of the attack. In our experiment, we pre-processed the source file,
and extracted less than 3 minutes of data containing a total of 367 TCP packets. There were
10 packets captured by the firewall node due to the Dosnuke attack, 9 of which were sent
from the attacker node to the victim and one sent from the victim back to the attacker.
Figure 6.4: IP address Distribution of data packets
We set up several statistical measures in OPNET to study the performance of the in-
trusion simulation. For example, Figure 6.4 depicts the IP address distributions of the data
packets during the entire simulation, where the IP addresses correspond to the PC node
125

numbers 0 - 9 of the y-axis. The figure clearly demonstrates patterns of consecutive accesses
to the same IP addresses during several short intervals of the simulation although these
accesses are irrelevant to the Dosnuke attack.
(a) (b)
Figure 6.5: (a)The inbound traffic of the firewall (b) The overall network traffic during the
simulation period
Figure 6.5.a depicts the rates of data packets captured by the firewall. The occurrences
of the packets and the times of their arrivals are clearly shown in the figure - there were a few
rapid arrivals in the beginning, followed by 3 more at later times. This figure demonstrates
the occurrences of the Dosnuke attack and its capture by the firewall.
We also collected statistics of the overall network traffic, which is depicted in Figure
6.5.b, although this performance measure seems irrelevant to the Dosnuke attack.
126

6.1.2.2 The ProcessTable Attack
To demonstrate the reusability of our pre-processing tools and to demonstrate our intrusion
simulation methodology, we also simulated the ProcessTable DOS attack. The simulation
model is showed in figure 6.6. This attack aims at filling up the process table of the underlying
operating system, rendering the system lifeless until the attack terminates or when the system
administrator kills the attacking processes [55]. The ProcessTable attack can be detected
by recording a large number of connections to a particular port of the victim node during a
short period of time.
Figure 6.6: The simulation model for ProcessTable attack(left) and The attribute panel of
the packet generator (right), with scripted packet inter-arrival times calculated from pre-pro-
cessing the source data
In our simulation, we used the MIT/Lincoln Lab TCPDUMP file that contains the Pro-
cessTable attack packets, extracted the pertinent information using our pre-processing tools,
then set up the simulation in OPNET. There are slightly less than 2 minutes of data with
127

a total of 5526 data packets. We collected two statistical measures at the firewall node
attempting to detect and identify the ProcessTable attack.
(a) (b)
Figure 6.7: The port access pattern of ProcessTable attack (a)Number of distinct port
connections to victim (b) Data traffic to Port 25 of the victim PC
Figure 6.7.a depicts the number of distinct port connections to the victim PC during
simulation. It can be seen very clearly that there are 3 jumps in the graph, indicting rapid
increases of port connections to the victim during 3 distinct time intervals.
The ProcessTable attack can also be directed at a particular port of the victim. Fig-
ure 6.7.b depicts the network traffic directed to Port 25 of the victim during simulation.
The graph displays two peaks: the first occurred around the one-minute mark; the second
started after one minute 20 seconds and lasted to the end. Thus, the two figures 6.7.a and
6.7.b clearly demonstrated data packets that are suspicious of the ProcessTable (or similar)
attacks.
128
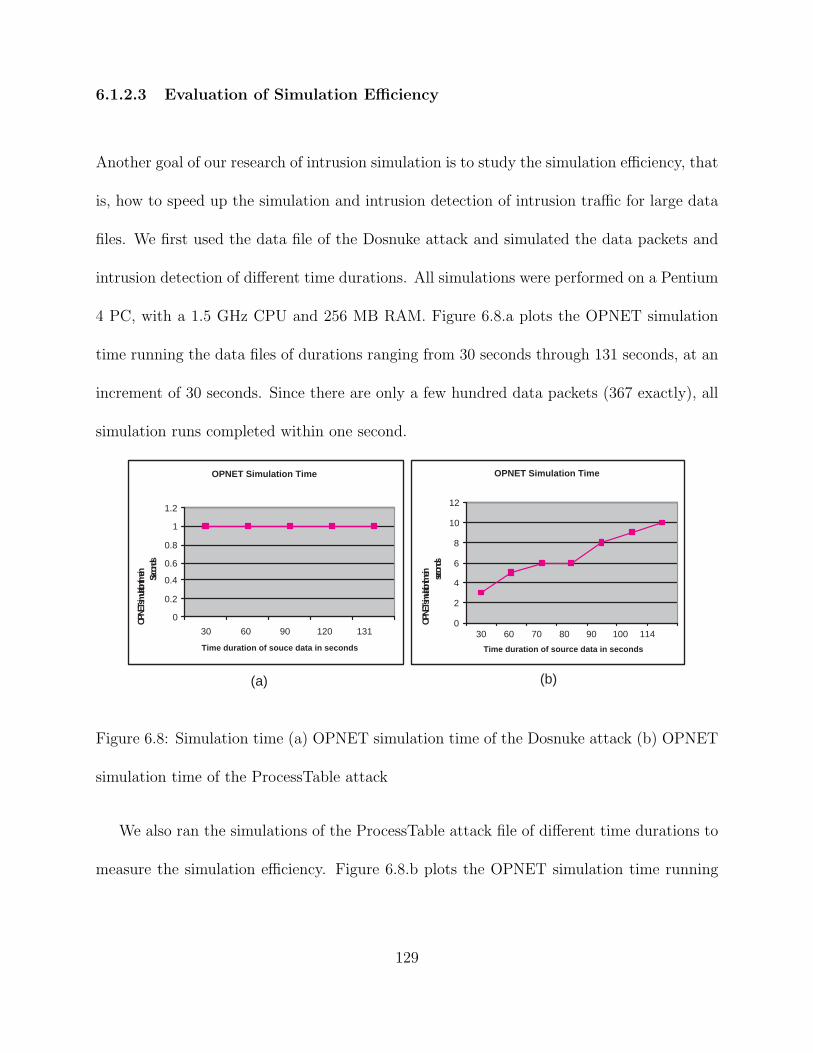
6.1.2.3 Evaluation of Simulation Efficiency
Another goal of our research of intrusion simulation is to study the simulation efficiency, that
is, how to speed up the simulation and intrusion detection of intrusion traffic for large data
files. We first used the data file of the Dosnuke attack and simulated the data packets and
intrusion detection of different time durations. All simulations were performed on a Pentium
4 PC, with a 1.5 GHz CPU and 256 MB RAM. Figure 6.8.a plots the OPNET simulation
time running the data files of durations ranging from 30 seconds through 131 seconds, at an
increment of 30 seconds. Since there are only a few hundred data packets (367 exactly), all
simulation runs completed within one second.
(a) (b)
OPNET Simulation Time
0
0.2
0.4
0.6
0.8
1
1.2
30 60 90 120 131
Time duration of souce data in seconds
O P
N E
T s
i m u l
a t i o
n t i m
e i n
S
e c o n
d s
OPNET Simulation Time
0
2
4
6
8
10
12
30 60 70 80 90 100 114
Time duration of source data in seconds
O P
N E
T s
i m u l
a t i o
n t i m
e i n
s e
c o n d
s
Figure 6.8: Simulation time (a) OPNET simulation time of the Dosnuke attack (b) OPNET
simulation time of the ProcessTable attack
We also ran the simulations of the ProcessTable attack file of different time durations to
measure the simulation efficiency. Figure 6.8.b plots the OPNET simulation time running
129

the data files of durations ranging from 30 seconds through 114 seconds, at an increment of
30 seconds. There are a total of 5526 data packets in the entire file (114 seconds). We notice
that the simulation time increases approximately linearly as the time duration of the source
file increases. Thus, the simulation efficiency can become a significant factor when we try to
quickly detect intrusions that involve large data files.
6.2 CONCLUSIONS
We explored the possibility of using simulator for the modeling and simulation of DOS
attacks. Our contributions are:
- First, using a standard external TCPDUMP data, we could replay its traffic on a
abstracted simulation model. The model is built to emulate the logical local network
environment that extracted from this external TCPDUMP data.
- We are able to use the explicit traffic to simulate the packet level signature of DOS
attack. The signature such as the SYN flag created in a SYN flood attack, and the
port accessed, protocol used etc. Most of the other simulations can not simulate the
explicit packet level traffic.
- Our simulation could simulate the attack behavior in terms of its time factor. Specif-
ically, the packet sending process is controlled in a manner that the interarrival time
and duration is proportional to timing pattern of the real attack.
130

Our simulation model emphasizes on the traffic flow distribution as well as the simple
signatures from the packet header. We can not simulate the damaged host caused by ma-
licious code, which is difficult for any simulation that is done by simulators. However, the
simulator we used is able to provide the statistical measures on the different aspects of the
traffic, which may provide an alternative way to simulating the shutting down of a network
entity by specifying the maximum sustainable traffic load.
The attacks we simulated are restricted to the DOS, Probe and Worms. One shortcoming
of our approach is that we are unable to simulate the attack effect on the host. And we can
not simulate the attack signatures that are included in the packet payload. One future
work is to simulate the worm spreading using the explicit traffic generation. To simulate
the propagation of worms requires a much bigger network environment which may involve
enormous numbers of network nodes. To manually build such a model is no longer possible; a
possible substitution is to find an automated way to build the model by parsing the network
profile description. Another requirement for efficient simulation of worm propagation is the
timing issue. The propagation speed of the worm in the simulated environment should be
consistent to the real propagation time, which may take a longer duration than a DOS
attack’s duration.
131

CHAPTER 7
CONCLUSIONS
7.1 SUMMARIES
We proposed two novel techniques for network intrusion detection (NID), we also proposed
a novel method for network intrusion simulation.
For NID, first, we proposed a frequency-based intrusion detection technique for anomaly
detection, which looks for periodical patterns in the time-series created by the traffic flow.
The main method used in frequency extraction is discrete Fourier Transformation. The
designed system is finally tested on the DARPA 1999 data sets, with emphasis on DOS
and Probe attacks. However, the frequency-based IDS, while obtained good results on the
DARPA data sets, would be limited for detecting real attacks.
Our second contribution to intrusion detection is a distributed personal IDS for the LAN.
While a firewall installed at the perimeter of a local network provides the first line of defense
against the hackers, many intrusion incidents are the results of successful penetration of the
firewalls. We proposed an IDS that provides a finer control over the internal network. The
132

system focuses on the variations of connection-based behavior of each single computer, and
uses a weighted link graph to represent the overall traffic abnormalities. The functionality
of our system is of a distributed personal IDS system that also provides a centralized traffic
analysis by graphical visualization.
The architecture of our distributed IDS is composed of the end user agents and a central
analyzer. The connection classification mechanism is implemented within each agent, it is
fundamentally a behavior-based analysis that is oriented to a single computer. In particular,
we use node weight and link weight to represent the appearance of new connection and the
sudden change in traffic features of once trusted connection. A computer’s behavior change,
then, is captured by the node weight and link weight, and is sent to the central analyzer for
further analysis on interrelated attack patterns such as worms and IP sweep. While the end
user agent provides the on-spot analysis and prevention for the possible abnormalities of a
single computer, the central analyzer provides further analysis and detection to ensure that
corruption from the inside LAN would not happen.
For intrusion simulation, we used the simulator OPNET to simulate the DOS attack
traffic. The simulation model uses explicit traffic generation that makes the packet level
traffic flow simulation possible. With the packet level simulation, we can have more control
over simulating the intricate attack characteristic. We replay the DOS attack from DARPA
TCPDUMP data in our model to realize the attack scenario. As we could study the flow
traces and traffic features of a DOS attack, the model is also valuable for the simulation
133

of worms spreading. Our future work is to extend our work to simulation worms spreading
using traffic that generated at the packet level.
7.2 LIMITATIONS AND FUTURE WORK
As the final conclusions, we point out some limitations of our distributed personal IDS and
suggest possible improvements as future work.
One limitation of our distributed IDS is that we can not detect the attack from the
external IPs. Since our system is mainly designed for inside network activities, connections
between an external computer and an inside computer will not be specifically monitored like
what we do for internal connections. Second, the performance of our system relies on training
using normal traffic to accurately determine the threshold and removal intervals of working
sets. Different network environments may require different parameters for determining the
node weight to reflect the true state of computer behavior. Thus, a training period is needed
before the system’s performance reaches the steady state.
The IDS implementation would be different for a server, because a server would have
fundamentally different connection behaviors from a workstation. Moreover, different types
of servers would behave differently. For example, the design of a server’s working set can not
rely on the “locality” because the dominant traffic for a server is from incoming connections
134

of different sources. Therefore, it is necessary to have alternative designs when the server
monitoring is required for the intrusion detection.
One possible improvement is to investigate better outlier detection strategies regarding
network traffic with different service types. For example, TCP services are more likely to
have user interactions involved comparing to UDP services; thus, the patterns created are
more irregular and the density distribution in the pattern space is not as even as that of the
UDP service flow. Consequently, different feature sets and outlier detection methods may
need to be considered. Another possible improvement is to explore better graph drawing
algorithms for visualization, which adapt to realtime graph updates especially when the
graph contains over a hundred vertices.
135

List of References
[1] Carnegie Mellon Software Engineer Institute CERT coordication Center. ”CERTCCstattistics 1998-2003.” 16 Apr 2003. URL http://www.cert.orgstats.
[2] CERT, ”Code Red II: Another worm Exploiting Buffer Overflow in IIS Indexing ServiceDLL”, Incident Note IN-2001-09, 2001. http://www.cert.org/incident notes/IN-2001-09.html
[3] http://www.cs.columbia.edu/ids/mef/software
[4] DARPA Intrusion Detection Evaluation Database, athttp://www.ll.mit.edu/IST//ideval/docs/1999/attackDB.html.
[5] DARPA Intrusion Detection Evaluation project, athttp://www.ll.mit.eduISTidevaldata19991999 data index.html
[6] EMERALD intrusion detection system, at http://www.sdl.sri.com/projects/emerald,2001.
[7] Gerald Combs, Ethereal - Network Protocol Analyzer, http://www.ethereal.com/
[8] New Mexico Dataset at http://www.cs.unm.edu/ immsec/systemcalls.htm
[9] Nmap Security, http://www.insecure.org/nmap/.
[10] Norton Anti-Virus, 2002, http://www.symantec.com.
[11] NS2-the Network Simulator, ns-2 http://www.isi.edu/nsnam/ns/
[12] OPNET online documentation 8.0.C, OPNET Technologies, Inc., Washington DC.
[13] OPNET, http://www.opnet.com.
[14] Pacanal, http://www.codeproject.com/csharp/pacanal.asp.
[15] SPADE, Silicon Defense, http://www.silicondefense.com/software/spice/
[16] SSF.App.Worm, A Network Worm Modeling Package for SSFNet, Michael Liljenstamhttp://www.cs.dartmouth.edu/ mili/research/ssf/worm/
136

[17] Sun Microsystems SunShield Basic Security Module Guide at http://www.sun.com
[18] Webopedia, http://www.webopedia.com/TERM/w/worms.html.
[19] Wikipedia “intrusionprevension system”, URL: http://en.wikipedia.orgwikiIntrusion-pevention system.
[20] ZoneAlarm, Zone alarm personal firewall, http://www.zonelabs.com.
[21] http://may.cs.ucla.edu/projects/maisie/
[22] http://www.users.qwest.net/ eballen1/nws/#B15, Bruce Ediger.
[23] C. Abad, J. Taylor, C. Sengul, W. Yurcik, Y. Zhou, K. Rowe, “Log correlation forIntrusion Detection: A Proof of Concept”, ACSAC 2003.
[24] J. Allen, A. Christie, W. Fithen, J. Mchugh, J.Pickle, E.Stoner, ”State of the Practiceof Intrusion Detection technologies”, Technical report, CMU/SEI 99TR028.
[25] D. G. Andersen, ”Mayday: Distributed Filtering for Inernet Services”, Proceedings ofUSENIX Symposium on Internet Technologies and Systems (USITS), 2003.
[26] D. Anderson, ”Detecting unusual program behavior using the statistical component ofthe Next-generation Intrusion Detection Expert System (NIDES)”, Computer ScienceLaboratory SRI-CSL 95-06 May 1995.
[27] M. Almgren, H. Debar, M.Dacier,”A Light Weight Tool for Detecting Web ServerAttacks”, Proceedings of NDSS, 2000.
[28] D. Barbar, N. Wu, S. Jajodia, ”ADAM: Dectecting Intrusions by Data mining”, Pro-ceedings of the 2001 IEEE, workshop on information Assurance and Security. 2001.
[29] D. Barbara, et al., “ADAM: A testbed for exploring the Use of Data Mining in IntrusionDetection”, SIGMOD Record 2001.
[30] V. Berk, G. Bakos, ”Designing a Framework for Active Worm Detection on GlobalNetworks”, Proceedings of the First IEEE International Workshop on InformationAssurance, 2003.
[31] K. Bharat, B. Chang, M. Henzinger, M.Ruhl, ”Who links to whom: Mining Linkagebetween Web sites” IEEE 2001.
[32] S. Bridges, R. Vaughn, “Fuzzy Data Mining and Genetic Algorithms Applied to In-trusion Detection”, NISSC 2000.
[33] S. P. Borgatti, NetDraw: Graph Visualization Software. Harvard: Analytic Technolo-gies 2002.
137

[34] J. D. Cabrera, L. Lewis, X. Qin, W. Lee, R. Prasanth, B. Ravichandran, R. Mehra,“Proactive Detection of Distributed Denial of Service Attacks using MIB traffic vari-ables - A feasibility Study”, 7th IFIP/IEEE International Symposium on IntegratedNetwork Management, May 2001.
[35] Z. Chen, L. Gao, K. Kwiat, “Modeling the Spread of Active Worms”, Proceedings ofIEEE INFOCOM 2003.
[36] C. Cheng, H. T. Kung, K. Tan, “Use of spectral Analysis in Defense Anaginst DosAttacks”, IEEE GLOBECOM 2002.
[37] K. Claffy, H. Braun, G. Polyzos, “A Parameterizable Methodology for Internet TrafficFlow Profiling”, Proceedings of Cooperative Association for Internet Data Analysis,1995.
[38] C. J. Coit, S. Staniford, J. McAlerney, “Towards Faster String matching for Intrusiondetction”, IEEE 2001.
[39] S. Coull, j. Branch, B. Szymanski, E. Breimer, “Intrusion Detection: A BioinfomaticsApproach” Proceedings of 19th Annual Computer Security Applications Conference,Las Vegas, December, 2003.
[40] P. Eades,“A Heuristic for Graph Drawing”. Congressus Numerantium 42. pp. 149-60.1984.
[41] E. Eskin, “A Geometric Freamwork for Unsupervised Anomaly Detection: DetectingIntrusion in Unlabeled Data”, Applications of Data Mining in Computer Security,Kluwer, 2002.
[42] R. Erbacher, K. Walker, D. Frincke,“Intrusion and Misuse Detection in Large-ScaleSystems”, Computer Graphics and Applications I, page 38-48,IEEE 2002.
[43] L. Feinstein, D. Schnackenberg, R. Balupari, D. Kindred, “Statistical Approaches toDDos Attack Detection and Response” Proceedings of DARPA infomation Survivabil-ity Conference and Exposition, IEEE, 2003.
[44] S. Forrest, S. A. Hofmeyr, A.Somayaji, “Computer immunology”. Communications ofthe ACM, 40(10):88-96, October 1997.
[45] A. K. Ghosh, A. Schwartzbard, “A Study in Using Neural networks for Anomaly andMisuse Detection”, Ghosh, 1999.
[46] A. K. Ghosh, A. Schwartzbard, M. Schatz, “Learning Program Behavior Profiles forIntrusion Detection”, 1st USENIX Workshop on Intrusion Detection and NetworkMonitoring, 1999.
138

[47] T. M. Gil, M. Poletto, “MULTOPS: a data-structure for bandwidth attack detection”,10th Usenix Security Symposium, 2001.
[48] Dieter Gollman, Computer Security 1st Edition, John Wiley & Son Ltd, ISBN 0-471-97844-2, 1999.
[49] K. M. Hall, “An r-dimensional Quadratic Placement Algorithm”, Management Science17(1970), 219-229.
[50] L. Heberlein, G. Dias, K. Levitt, B. Mukherjee, J. Wood, and D. Wolber, “A networksecurity monitor”, IEEE Symposium on Security and Privacy, 1990.
[51] S. A. Hofmeyr, “A Immunological Model of DistributedDetection and its Applicationto Computer Security”, PhD thesis, Department of Computer Science, University ofNew Mexico, Apr. 1999.
[52] K. Ilgun, R. A. kemmerer, P. A. Porras, “State Transition Analysis: A rule-BasedIntrusion Detection Approach” IEEE Transactions on software engineering, VOL 21,No 3, March 1995.
[53] A. K. Jones, Y. Lin “Application Intrusion Detection using Language Library Calls”17th Annual Computer Security Applications Conference (ACSAC’01) December 10 -14, 2001.
[54] Kyoji Kawagoe, Tomohiro Ueda, “A similarity search method of Time series data withcombi-nation of Fourier and wavelet Transforms”, IEEE TIME’02, 2002.
[55] K. Kendall, “A Database of Computer Attacks for the Evaluation of Intrusion Detec-tion Systems”, Master’s Thesis, Massachusetts Institute of Technology, 1998.
[56] G. S. Kc, A. D. Keromytis, V. Prevelakis, “Countering Code-injection Attacks withInstruction-Set Randomization” CCS ACM October 2003.
[57] A. D. Keromytis, V. Misra, D. Rubenstein, “SOS: Secure overlay Services”, SIGCOMM2002.
[58] C. Ko, “Logic Induction of Valid Behavior Specifications for Intrusion Detection”,Proceedings of the 2000 IEEE Symposium on Security and Privacy , IEEE 2000.
[59] A. Kuzmanovic and E. W. Knightly “Low-Rate TCP-Targeted Denial of Service At-tacks” ACM SIGCOMM, 2003.
[60] C. Krgel, T. Toth, “Distributed Pattern Detection for Intrusion Detection”, Proceed-ings of the Network and Distributed System Security Symp. (NDSS 2002), Feb. 2002.
139

[61] C. Krgel, T. Toth, C. Kerer,“Decentralized Event Correlation for Intrusion Detection”,Proceedings of the 4th Intl. Conf. on Information Security and Cryptology (ICISC2001), Dec. 2001.
[62] A. Lazarevic, “A comparative Study of Anomaly Detection Schemes in Network In-trusion Detection”, SIAM 2003.
[63] C. Li, Q. Song, C. Zhang, “MA-IDS Architecture for Distributed Intrusion Detectionusing Mobile Agents”, Proceedings of the 2nd International Conference on InformationTechnology for Application 2004.
[64] J. Li, C. Manikopoulos, “Modeling Distributed Denial of service Attacks using OPNETModeler”, Proceedings of OPNETWORKS, 2002.
[65] Xiangyang Li, Nong Ye, “Decision tree classifiers for computer intrusion detection”,Real-time system security, ACM 2003.
[66] W. Lee, S. J. Stolfo, K.W.Mok, “Mining in a Data-flow Environment: Experience inNetwork Intrusion Detection”, Proceedings of the Fifth International Conference onKnowledge Discovery and Data Mining (KDD), ACM 1999.
[67] W. Lee, S. Stolfo, “Adaptive Intrusion Detection: a Data Mining Approach”, ArtificialIntelligence Review, 2000.
[68] J. Lemon, “Resisting SYN flood DOS attacks with a SYN cache”, Proceedings ofUSENIX BSDCon’2002, February.
[69] K. Levitt, M. Bishop, GrIDS design, http://seclab.cs.ucdavis.edu/arpa/grids/design.html.
[70] David J. Marchette, Computer Intrusion Detection and Network Monitoring, SpringerVerlag, 2001.
[71] M. V. Mahoney, “Network traffic Anomaly Detection Based on Packet Byte”, SAC,ACM 2003.
[72] M. Mahoney, P. Chan, “Learning Nonstationary Models of normal Network Traffic forDetecting Novel Attacks”, 8th ACM KDD, 2002.
[73] Computer intrusion detection and network monitoring: a statistical viewpoint. DavidJ. Marchette. New York: Springer, 2001.
[74] J. Mchugh, “Testing intrusion Detection Systems: A critique of the 1998 and 1999DARPA Intrusion Detection System Evaluation as performed by Lincoln laboratory”,ACM transactions on Information and System Security, Vol.3, No.4, ACM 2001.
[75] J. McHugh and C. Gates, “Locality: A New Paradigm for Thinking About NormalBehavior and Outsider Threat”, ACM New Security Paradigms Workshop 2004.
140

[76] P. J. Mutton and P. J. Rodgers. “Spring Embedder Preprocessing for WWW Visual-ization”, Proceedings of Information Visualization 2002. IVS, IEEE. pp. 744-749. July2002.
[77] W. G. Morein, A. Stavrou, D. L. Cook,“Using Graphic Turning Test to Counter An-tomated DDOS Attacks Against Web Servers” CCS ACM 2003.
[78] D. Moore, C. Shannon, G. M. Voelker, S. Savage, “Internet Qurantine: Requirementfor Containing Self-Propagation Code”, INFOCOM IEEE 2003.
[79] D. Moore, C. Shanning, and K. Claffy. Code-Red: a case study on the spread and vic-tims of an Internet worm. In Proceedings of the 2nd Internet Measurement Workshop(IMW), pages 273-284, November 2002.
[80] Oliver Niggemann, Benno Stein, and Jens Tlle. Visualization of Traffic Structures.In Proceedings of the IEEE International Conference on Communications (ICC 01),Helsinki, June 11-15, Piscataway, NJ, June 2001, IEEE.
[81] Stephen Northcutt, Judy Novak, Network Intrusion Detection: An Analyst’s Hand-book, 2nd ed., New Riders, 2000.
[82] K. Nyarko, T. Capers, C. Scott, K. Osias, “Network Intrusion Visualization withNIVA, an Intrusion Detection Visual Analyzer with Haptic Integration”, Proceedingsof the 10th Symp. On Haptic Interfaces For Virtual Envir. & Teleoperator Systs.(HAPTICS’02) IEEE 2002.
[83] V. Paxson, “An analysis of using Reflectors for distributed denial-of-service attacks”ACM SIGCOMM, July 2001.
[84] M. V. Padmaraj, V. Venkataraghavan, S. Nair, “Simulation of Network Security Pro-tocols”, Proceedings of OPNET WORKS, 2002.
[85] K. Park, H. Lee, “On the Effectiveness of probabailistic packet making for IP Tracebackunder Denial of Service Attack”, Proceedings of IEEE INFOCOM 2001, March 2001.
[86] V. Paxon. ”Bro: A system for detecting network intruders in real-time.” proceedingsof 7th USENIX Security Symp 1998.
[87] M. Qin, K. Hwang, “Anomaly Intrusion Detection by Internet Datamining of TrafficEpisodes”, ACM Transactions on Information and System Security (TISSec), March1, 2004.
[88] J. Ross Quinlan. C4.5 Programs for Machine Learning Morgan Kaufmann Publishers,SanMateo,CA 1993.
[89] S. Razak, M. Zhou, S. Lang, “Network Intrusion Simulation Using OPNET” Proceed-ings of OPNETWORKS, 2002.
141

[90] M. Roesch,“Snort: lightweight intrusion detection for networks”, USENIX 1999.
[91] J. Ryan, M. Lin, “Intrusion Detection with Neural networks”, NIPS, 1998.
[92] M. G. Schultz, E. Eskin, E. Zadok, “Data mining Methods for Detection of NewMalicious Excutables”, Proceedings of the 2001 IEEE Symposium on Security andPrivacy, IEEE 2001.
[93] R. Sekar, M. Bendre, D. Dhurjati, “A Fast Automaton-Based Methods for DetectingAnomalous Program Behavior”, Proceedings of the IEEE Symposium on Security andPrivacy, IEEE 2001.
[94] John P. Slone, editor, Hand Book of Local Area Networks, CRC Press LLC, 1999.
[95] M. Smart, G. R. Malan, F. Jahanian, “Defeating TCP/IP Stack Fingerprinting”, Pro-ceedings of the 9th USENIX Security Symposium, August 2000.
[96] C. Schuba, I. V. Krsul, M. Kuhn, E. H. Spafford, A. Sundaram, D. Zamboni,“Analysisof a Denial of Service Attack on TCP”, Proceedings of IEEE Symposium on Securityand Privacy, May 1997.
[97] S. Sidiroglou, A. D. Keromytis , “A Network Worm Vaccine Architecture”, 12th In-ternational Workshop on Enabling Technologies: Infrastructure for Collaborative En-terprises June 2003.
[98] C. Sinclair, L. Pierce, S.Marzner, “An Application of Machine learning to NetworkIntrusion Detection”, Proceedings of the 15th Annual Computer Security ApplicationsConference 1999.
[99] R. Sommer, V. Paxson, “Enhancing Byte-Level network Intrusion Detection Signatureswith Context”, CCS’03 ACM 2003.
[100] S. Staniford, V. Paxson, N.Weave, “How to 0wn the internet in your spare time”,USENIX, 2002.
[101] Mubarak Shah, Fundamentals of Computer Vision, unpublished manual script, 1997.
[102] G. Taguchi and R. Jugulum, The Mahalanobis-Taguchi Strategy, Press of John Wiley& sons, 2002.
[103] C. Taylor, J. Alvee-Foss, “NATE - Network Analysis of Anomalous Traffic Events, ALow-Cost Approach”, Proceedings of New Security Paradigms Workshop, 2001.
[104] T. Toth, C. Kruegel, “Connection-history Based Anomaly Detection”, In Proceedingsof the 2002 IEEE Workshop on Information Assurance and Security. June, 2002.
142

[105] Chris Trowbridge, Sans technique report at URL http://rr.sans.orgintrusion detectionsystem“an overview of Remote Operating System Fingerprinting”.
[106] J. Tlle, O. Niggemann, “Supporting Intrusion Detection by Graph Clustering andGraph Drawing”, International Symposium on Recent Advances in Intrusion Detection(RAID) 2000.
[107] G. Vigna, R. A. Kemmerer, “NetSTAT: A Network-based Intrusion Detection Ap-proach”, 14th Annual Computer Security Applications Conference December 1998.
[108] C. Warrender, S. Forrest, B. Pearlmutter, “Detecting Intrusion Using System Calls:Alternative Data Models” 1999 IEEE Symposium on Security and Privacy May 09 -12, 1999.
[109] M. M. Williamson, “Throttling Viruses: Restricting propagation to defeat maliciousmobile code”, 18th Annual Computer Security Ap-plications Conference, 2002.
[110] Yi-Leh Wu, D. Agrawal, A. E. Abbadi, “A Com-parison of DFT and DWT Based Sim-ilarity Search in Time-Series Databases”, ACM CIKM Int 7 Conference on Informationand Knowledge Management, Nov 611. pp 488-495, 2000.
[111] Tao Wan, Xue Dong Yang, “IntruDetector: A Software Platform for Testing NetworkIntrusion Detection Algorithms”, http://www.acsac.org2001papers54.pdf .
[112] H. Wang, D. Zhang, K. G. Shin “Detcting SYN Flooding Attacks” IEEE INFOCOM2002.
[113] N. C. Weaver, “A Warhol Worm: An Internet plague in 15 minutes!”, SAN technicalreport 2003.
[114] Zheng Zhang, Jun Li, C.N. Manikopoulos, Jay Jorgenson, Jose Ucles, “HIDE: A Hierar-chical Network Intrusion Detection System Using Statistical Preprocessing and NeuralNetwork Classification”, in Proceedings of 2001 IEEE Man Systems and CyberneticsInformation Assurance Workshop, 2001.
[115] Y. Zhang, V. Paxson, “Detecting Backdoors”, Proceedings of the 9th USENIX SecuritySymposium, August 2000.
[116] C. Zou, W. Gong, D. Towsley, “Code Red Worm Propagation Modeling and Analysis”,9th ACM Conference on Computer and Communication Security (CCS’02) November18-22, 2002 http://tennis.ecs.umass.edu/ czou/research/codered.pdf
[117] M. Zhou, S. Lang, “Weighted Link Graphs: A Distributed IDS for Secondary IntrusionDetection and Defense”, SPIE Defense and Security Symposium 2005.
143

[118] M. Zhou, S. Lang, “Mining Frequency Content of Network Traffic for Intrusion De-tection”, Proceedings of the IASTED International Conference on Communication,Network, and Information Security (CNIS 2003), pp 440-101 Dec 2003.
144