a rain sensing scheme based on the structural properties
TRANSCRIPT
A Rain Sensing Scheme Based on the Structural
Properties of the Vehicle Rooftop
A Project Report
submitted by
AKHIL NATH C.K.
in partial fulfilment of the requirements
for the award of the degree of
MASTER OF TECHNOLOGY
DEPARTMENT OF ELECTRICAL ENGINEERINGINDIAN INSTITUTE OF TECHNOLOGY MADRAS.
MAY 2019

THESIS CERTIFICATE
This is to certify that the thesis titled A Rain Sensing Scheme Based on the Struc-
tural Properties of the Vehicle Rooftop, submitted by Akhil Nath C.K., to the Indian
Institute of Technology, Madras, for the award of the degree of Master of Technology,
is a bona fide record of the research work done by him under our supervision. The
contents of this thesis, in full or in parts, have not been submitted to any other Institute
or University for the award of any degree or diploma.
Dr. Boby GeorgeResearch GuideProfessorDept. of Electrical EngineeringIIT-Madras, 600 036
Place : Chennai
Date : 5th May 2019

ACKNOWLEDGEMENTS
I wish to express my sincere and deep sense of gratitude and heartfelt thanks to my
project guide Dr. Boby George for his inspiring guidance, timely advice, constant en-
couragement and motivation throughout my project. It has been a very enriching and
enjoyable experience to work with him.
I deeply appreciate the valuable suggestions and help offered by Dr. Bharath Bhikkaji
for sharing his insightful ideas pertaining to this project.
I take immense pleasure in acknowledging research scholars Anish Babu and Anil
in the Measurements and Instrumentation Laboratory, for spending their invaluable time
with me, in discussing about the project and answering my queries.
I would also like to thank all the teaching and non-teaching staffs, especially Mrs.
Rekha and Mr. B.Umaithanu Pillai of the Electrical department for extending all the
support and cooperation to me throughout.
I am grateful to my friends Muhammed Jaifer and Ashima Narang for sharing their
invaluable knowledge during various stages of this project.
I also thank my friends Ashima, Shekhar, Ratheesh and Gopal for the invaluable
discussions and memorable times in lab.
Last but not the least, I thank God Almighty for giving me the strength, knowledge,
ability and opportunity to undertake this research study and to persevere and complete
it satisfactorily. Without his blessings, this achievement would not have been possible.
i
ABSTRACT
KEYWORDS: Rainfall; Acoustics; Microphone; Sound Analysis; Automobile;
Wiper control.
Smart and intelligent devices are the most salient features that have been evolving in
automobile industry in these recent years, to enhance the customer comfort and safety.
One such application is windshield wiper control. Due to inefficient sensing and cost
constraints, most of the vehicles still utilizes the traditional manual wiper control sys-
tem. During rainy season, it requires constant attention of the driver to adjust the wiper
speed based on rain intensity. So an automated and smart wiper control system is a
good solution, so that the driver can be at comfort and can pay full attention on to road
while driving in such environments.
This project discusses about the analysis of sound generated by the rainfall on the
roof of the vehicle, for the detection of rain. It uses a microphone and/or sound ana-
lyzer to capture the sound generated by the rain drops falling on the metallic body of
the automobiles and further analyze the audio data for rain detection. Experiments are
carried out in laboratory to analyze the impact of an impulse force acting on the ve-
hicle rooftop. Also a comparison study is done by analyzing the impact of rain drops
falling on rooftop. Envelop of the frequency response of audio samples from various
experiments are studied to detect the presence of rainfall on vehicle.
ii

TABLE OF CONTENTS
ACKNOWLEDGEMENTS i
ABSTRACT ii
LIST OF TABLES v
LIST OF FIGURES vi
ABBREVIATIONS vii
1 INTRODUCTION 1
1.1 General . . . . . . . . . . . . . . . . . . . . . . . . . . . . . . . . 1
1.2 Background . . . . . . . . . . . . . . . . . . . . . . . . . . . . . . 2
1.3 Objective and scope of the project . . . . . . . . . . . . . . . . . . 3
1.4 Organisation of the thesis . . . . . . . . . . . . . . . . . . . . . . . 3
2 SIMULATION STUDY 5
2.1 Rain drops and its impact . . . . . . . . . . . . . . . . . . . . . . . 5
2.2 Simulation Settings . . . . . . . . . . . . . . . . . . . . . . . . . . 6
2.3 Simulation Results . . . . . . . . . . . . . . . . . . . . . . . . . . 8
3 MICROPHONE BASED SOUND ANALYZER 12
3.1 Polar patterns . . . . . . . . . . . . . . . . . . . . . . . . . . . . . 12
3.2 Types of microphones . . . . . . . . . . . . . . . . . . . . . . . . . 13
3.2.1 Dynamic microphones . . . . . . . . . . . . . . . . . . . . 13
3.2.2 Condenser microphones . . . . . . . . . . . . . . . . . . . 14
3.2.3 Ribbon microphones . . . . . . . . . . . . . . . . . . . . . 14
3.3 ZOOM H1 recorder . . . . . . . . . . . . . . . . . . . . . . . . . . 15
4 EXPERIMENTS & RESULTS 17
4.1 LabVIEW data acquisition . . . . . . . . . . . . . . . . . . . . . . 17
iii

4.1.1 Virtual Instrument . . . . . . . . . . . . . . . . . . . . . . 18
4.2 Knocking experiment . . . . . . . . . . . . . . . . . . . . . . . . . 20
4.3 Laboratory experiments . . . . . . . . . . . . . . . . . . . . . . . . 22
4.3.1 Initial experimental setup . . . . . . . . . . . . . . . . . . . 22
4.3.2 Rain drop experiment . . . . . . . . . . . . . . . . . . . . . 23
4.4 Real time rain data analysis . . . . . . . . . . . . . . . . . . . . . . 25
4.4.1 Rain intensity measurement . . . . . . . . . . . . . . . . . 25
5 CONCLUSION & FUTURE SCOPE 28
5.1 Conclusion . . . . . . . . . . . . . . . . . . . . . . . . . . . . . . 28
5.2 Future scope of the project . . . . . . . . . . . . . . . . . . . . . . 29
A STFT ANALYSIS 30

LIST OF TABLES
2.1 Properties of metal sheet used in Simulation . . . . . . . . . . . . . 7
3.1 Technical specification of Zoom H1 recorder . . . . . . . . . . . . 16
v
LIST OF FIGURES
1.1 Tranditional manual wiper control system . . . . . . . . . . . . . . 1
1.2 Resistive type rain sensor (Joshi et al., 2013) . . . . . . . . . . . . . 2
1.3 Optical type rain sensor on windshield . . . . . . . . . . . . . . . . 3
2.1 Impact force results observed for different release heights: (a) H = 1 m,(b) H = 2 m, (c) H = 3 m, and (d) H = 4 m (Fu and Li, 2018) . . . . 6
2.2 Simulation setup in Ansys software . . . . . . . . . . . . . . . . . 7
2.3 Magnitude response of vibration obtained in simulation . . . . . . . 9
2.4 Time domain impulse response of a second order underdamped system 11
2.5 Impulse magnitude spectrum of a second order underdamped system 11
3.1 Polar patterns of microphones (Briones, 2015) . . . . . . . . . . . . 12
3.2 Dynamic microphone and its working (Poole, 2016) . . . . . . . . . 14
3.3 Working of a condenser microphone (Poole, 2016) . . . . . . . . . 14
3.4 Working of a ribbon microphone (Poole, 2016) . . . . . . . . . . . 15
3.5 Zoom H1 digital recorder . . . . . . . . . . . . . . . . . . . . . . . 15
4.1 Microphone interfaced with PC and data acquisition . . . . . . . . . 17
4.2 Signal conditioning circuitry in LabVIEW . . . . . . . . . . . . . . 19
4.3 Response of test input used to check the impulse response of car rooftop 20
4.4 Time domain response of a single knock on the rooftop . . . . . . . 21
4.5 Envelop of magnitude response of the waveform in Fig. 4.3 . . . . 21
4.6 Initial experimental setup made in Laboratory . . . . . . . . . . . . 23
4.7 Experiment setup to study the impact of water drops . . . . . . . . . 24
4.8 Envelop of magnitude response obtained from raindrop experiment . 24
4.9 Envelop of magnitude response obtained from actual rainfall data . . 25
4.10 Envelop of magnitude response obtained during (a) Light rainfall and(b) Heavy rainfall . . . . . . . . . . . . . . . . . . . . . . . . . . . 26
A.1 LabVIEW program to obtain the STFT spectrum of audio signals . . 31
A.2 STFT spectrum of the rainfall audio . . . . . . . . . . . . . . . . . 31
vi
ABBREVIATIONS
LabVIEW Laboratory Virtual Instrument Engineering Workbench
DAQ Data Acquisition
USB Universal Serial Bus
PC Personal Computer
ADC Analog to Digital Converter
DFT Discrete Fourier Transform
FFT Fast Fourier Transform
STFT Short Time Fourier Transform
vii

CHAPTER 1
INTRODUCTION
1.1 General
Automobile industry is one of the most dynamic industries in the world in terms of tech-
nology. In recent years, researchers in this field are trying hard to develop technologies
to enhance customer satisfaction and safety. Also while purchasing any vehicle, cus-
tomers are more interested to have the latest technologies including voice command
recognition, smart air conditioning, automatic headlamps etc., so that drivers attention
from the road is not distracted. Also, we believe that driver-less vehicle’s are the future
of this industry. In these fast changing technology era, utmost care must be taken while
designing the systems, as any malfunction of some of these devices can cost lives of
many. One such application which involves distraction of driver off the road and needs
technology improvements is the windshield wiper system.
Figure 1.1: Tranditional manual wiper control system
In tropical countries like India, people experience prolonged and heavy rainy season.
Driving vehicles in such environments is itself a difficult task as the vision may not be
very clear. So, with the traditional wiper control systems as shown in Fig. 1.1, driver
constantly needs to adjust the wiper motor speed manually based on the rain intensity
and this can cause distraction off the road. Such distractions can end up in devastating
accidents. To eliminate such situations, several technologies have been developed over
the years for smart sensing of rain in automobiles.
1.2 Background
Researchers have constantly put efforts in developing rain sensing techniques for Au-
tomobiles in the past. However each of such configurations developed has its own
limitations when it comes to practical situations. Commonly used technologies for rain
sensing in Automobile industry are:
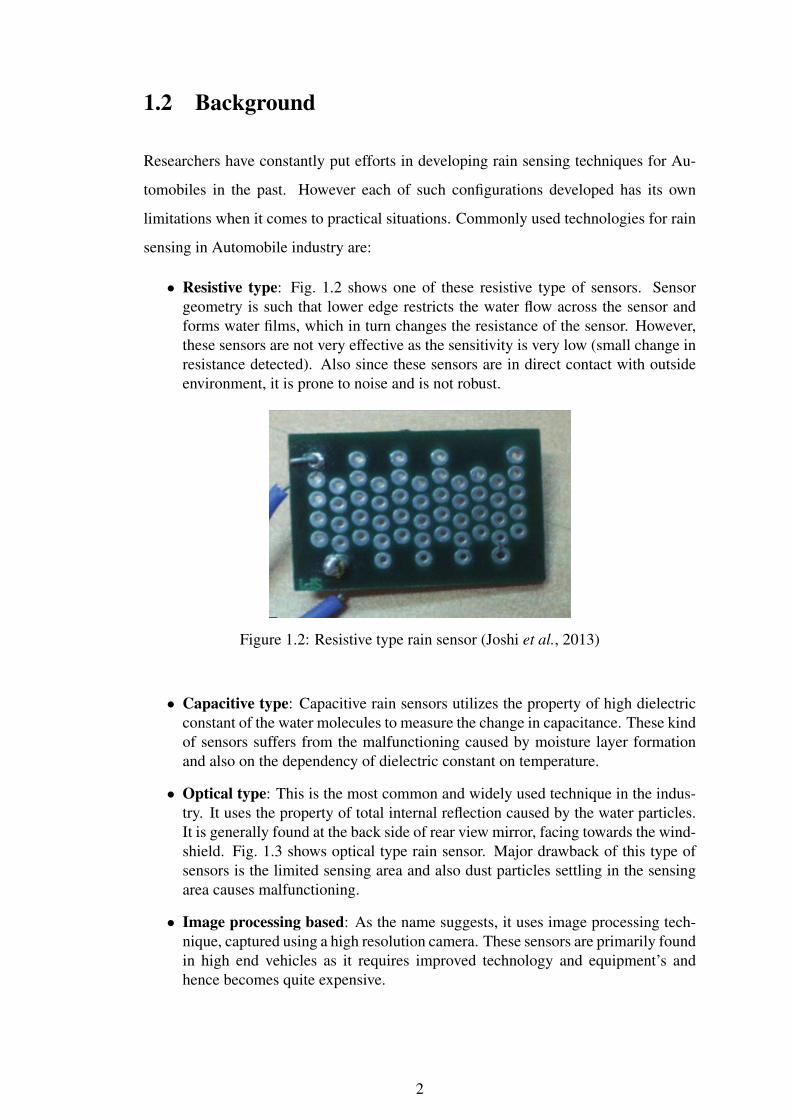
• Resistive type: Fig. 1.2 shows one of these resistive type of sensors. Sensorgeometry is such that lower edge restricts the water flow across the sensor andforms water films, which in turn changes the resistance of the sensor. However,these sensors are not very effective as the sensitivity is very low (small change inresistance detected). Also since these sensors are in direct contact with outsideenvironment, it is prone to noise and is not robust.
Figure 1.2: Resistive type rain sensor (Joshi et al., 2013)
• Capacitive type: Capacitive rain sensors utilizes the property of high dielectricconstant of the water molecules to measure the change in capacitance. These kindof sensors suffers from the malfunctioning caused by moisture layer formationand also on the dependency of dielectric constant on temperature.
• Optical type: This is the most common and widely used technique in the indus-try. It uses the property of total internal reflection caused by the water particles.It is generally found at the back side of rear view mirror, facing towards the wind-shield. Fig. 1.3 shows optical type rain sensor. Major drawback of this type ofsensors is the limited sensing area and also dust particles settling in the sensingarea causes malfunctioning.
• Image processing based: As the name suggests, it uses image processing tech-nique, captured using a high resolution camera. These sensors are primarily foundin high end vehicles as it requires improved technology and equipment’s andhence becomes quite expensive.
2

Figure 1.3: Optical type rain sensor on windshield
1.3 Objective and scope of the project
Humans are able to sense rain with the help of just vision or audio. Anyone who has
traveled in car during rainy seasons might have noticed that the sound generated by
rainfall on the car roofs dominates any other surrounding sounds. Hence, the motive
behind this project is to utilize the sounds thus generated to detect the rainfall.
The main objective of this project is to detect the rainfall on automobiles (cars) by
analyzing the sound generated, by the raindrops falling on the metallic body, captured
with the help of a sound recorder or microphone.
1.4 Organisation of the thesis
Chapter 1 gives an introduction to the need of smart and intelligent technologies in the
automobile industry, especially the smart windshield with an automatic wiper control. It
explains the various existing technologies in the field and its drawbacks. It also provides
the primary objective of this project.
Chapter 2 discusses the researches and studies happened in this field. Also it deals
with the simulation done to test the effect of rainfall on the car rooftop, its settings and
results obtained.
Chapter 3 describes various properties of microphone to be considered while select-
ing for a particular application. Also, it briefly describes the features of microphone
3

used in this project.
Chapter 4 explains the experimental setup made in laboratory and its testing and
discusses the results obtained. It also covers the results obtained during real time rainfall
and a comparison study of results obtained during experimental study and real time
situation.
Chapter 5 provides a summary of the results observed and the conclusion of the
work carried out. It also includes the future scope of the project.
4
CHAPTER 2
SIMULATION STUDY
2.1 Rain drops and its impact
To detect the intensity of rainfall based on sound generated and to design the automation
of wiper control, it is necessary to understand the effect of rainfall on car body. It is
the rain drops falling that makes rain. Therefore in order to understand effect of rain in
overall, it is important to perceive the effect of a single drop on car rooftop.
Also, to analyze the sound generated by some object, it is very much required to
understand the basic principle behind the sound generation. Sound is generated when
an object vibrates. This vibrating object causes the near by medium to vibrate and the
longitudinal waves thus generated in the medium hits the ear drum of our ears and we
can hear the sound. So, the sound generated by rainfall inside the car can be reckoned
to be the result of the vibrations of car body caused by the force exerted by rain drops.
Experiments were carried out in past to study the rain load induced on surfaces. Fu
and Li (2018) in their paper calculated the rain load based on single raindrop impinging
experiment. In their experiment, force exerted by water drops falling from various
heights was measured with the help of a piezoelectric transducer. Fig. 2.1 shows the
results obtained in the experiment. From the results, it is very much evident that the
force exerted by water drops is similar to that of a impulse force of small duration.
Even though the amplitude of force varies, its shape and duration is almost the same
when released from different heights.
So studying the sound generated by rainfall hitting the car body can be understood
better by simulating the vibration caused by the force induced by falling rain drops
(impulse vibration response).
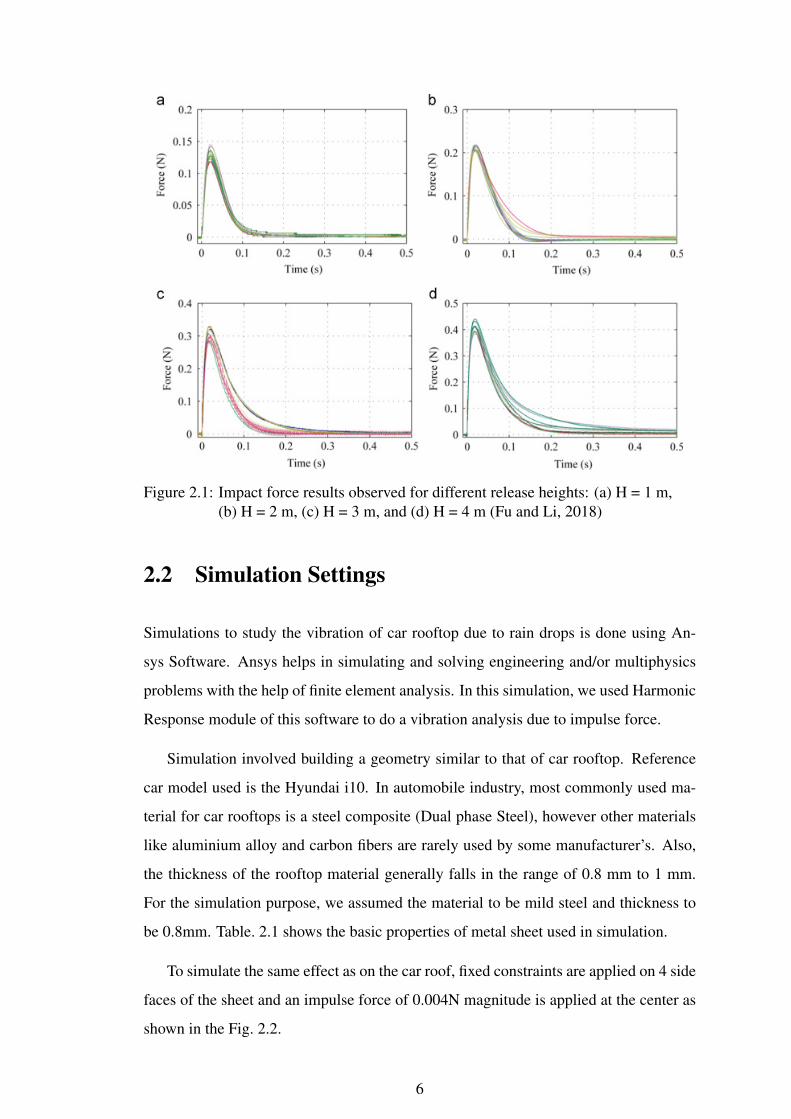
Figure 2.1: Impact force results observed for different release heights: (a) H = 1 m,(b) H = 2 m, (c) H = 3 m, and (d) H = 4 m (Fu and Li, 2018)
2.2 Simulation Settings
Simulations to study the vibration of car rooftop due to rain drops is done using An-
sys Software. Ansys helps in simulating and solving engineering and/or multiphysics
problems with the help of finite element analysis. In this simulation, we used Harmonic
Response module of this software to do a vibration analysis due to impulse force.
Simulation involved building a geometry similar to that of car rooftop. Reference
car model used is the Hyundai i10. In automobile industry, most commonly used ma-
terial for car rooftops is a steel composite (Dual phase Steel), however other materials
like aluminium alloy and carbon fibers are rarely used by some manufacturer’s. Also,
the thickness of the rooftop material generally falls in the range of 0.8 mm to 1 mm.
For the simulation purpose, we assumed the material to be mild steel and thickness to
be 0.8mm. Table. 2.1 shows the basic properties of metal sheet used in simulation.
To simulate the same effect as on the car roof, fixed constraints are applied on 4 side
faces of the sheet and an impulse force of 0.004N magnitude is applied at the center as
shown in the Fig. 2.2.
6

Table 2.1: Properties of metal sheet used in Simulation
Material used Mild steelDensity 7870 kg/m3
Dimension 1.5m x 1.2m x 0.8mmYoung’s Modulus of elasticity 2.05 x 10¹¹ Pa
Poisson’s ratio 0.29Car model approximation Hyundai i10
Figure 2.2: Simulation setup in Ansys software
7

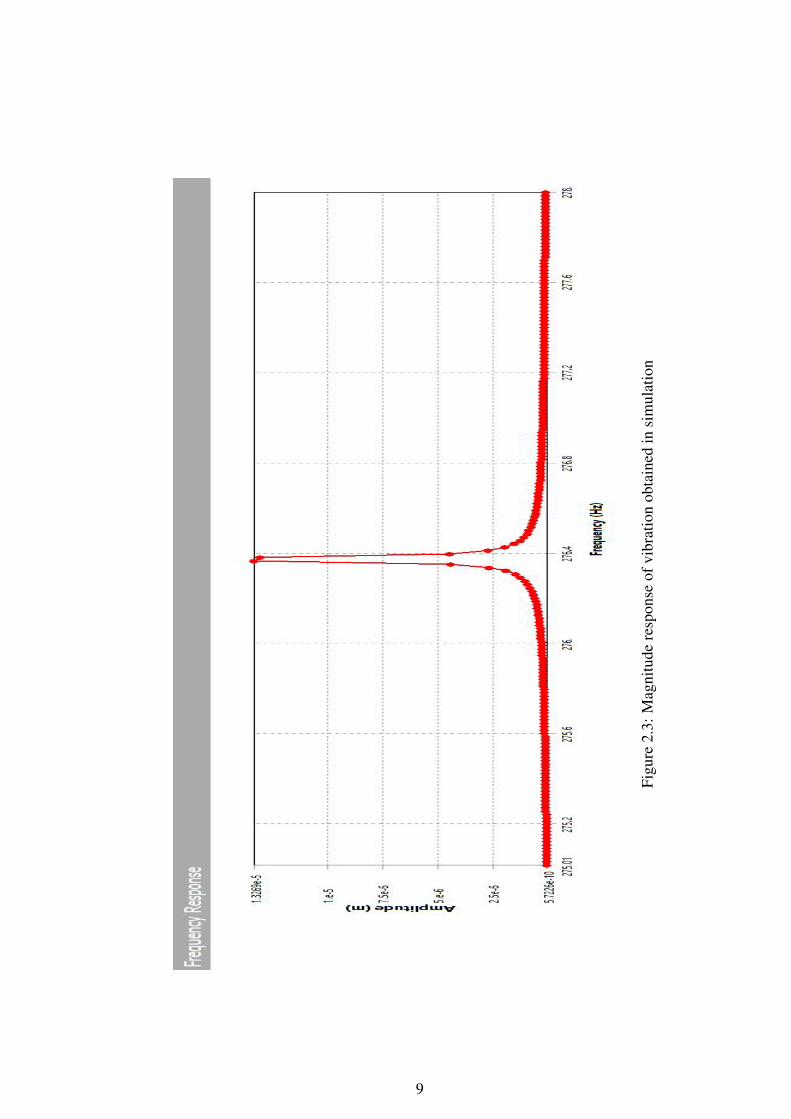
2.3 Simulation Results
Simulation results showed a peak at around 276 Hz when the frequency sweep was done
from 0 Hz to 1000 Hz. To have a closer look at the peak, frequency sweep was done
from 275 Hz to 278 Hz. Simulation result obtained from Ansys software is shown in
Fig. 2.3. Plot gives the magnitude response of vibration caused by the impulse force
acting on the metal sheet. As observed from the plot, there is a peak in the response
obtained at approximately 276.4 Hz. Also, a phase change of 180 degrees is observed
at the same frequency where the peak occurred in magnitude plot, which in turn is a
clear indication that the system is vibrating at its resonant frequency.
Resonance is a phenomenon that occurs when a periodic force is applied on a system
at a frequency that is equal or nearly equal to one of the natural frequencies of the system
itself. This causes the system to oscillate with larger amplitude than when the force is
applied at other frequencies. Cantilever structures are generally treated as second order
systems. The system under study can also be considered as a beam supported on all
four side faces and hence can be approximated as second order.
Order of the system is defined by the number of independent energy storage ele-
ments in the system, and intuitively by the highest order of the linear differential equa-
tion that describes the system. A system whose input-output relation is defined by a
second order differential equation is called a Second Order System. Differential equa-
tion describing a typical second order system (mass-spring-damper system) is given by
Eqn. 2.1 and the generalized transfer function of such systems in Laplace domain is
given by Eqn. 2.2.
Mx+ Cx+Kx = f (2.1)
where,
x is acceleration,
x is velocity,
x is displacement,
M is mass of the system,
C is damping coefficient,
8
Figu
re2.
3:M
agni
tude
resp
onse
ofvi
brat
ion
obta
ined
insi
mul
atio
n
9

K is spring constant, and
f is external or excitation force.
X(s)
F (s)=
Aω2n
s2 + 2ζωn + ω2n
(2.2)
where,
A is system gain,
ωn is natural frequency of the system, and
ζ is damping ratio ( 0<ζ<1 for underdamped systems).
Comparing the Eqn. 2.1 and Eqn. 2.2, we get the relation shown in Eqn. 2.3 and it
clearly indicates that the natural frequency is inversely proportional to the square root
of mass of the system.
ωn =
√K
M(2.3)
Typical time response of a underdamped second order system excited by an im-
pulse force is shown in Fig. 2.4 and the corresponding magnitude spectrum is shown in
Fig. 2.5
From the magnitude spectrum, it can be clearly noted that when a second order
system is excited by an impulse input, its response is maximum at its natural resonant
frequency and is similar to the magnitude response obtained in simulation.
10
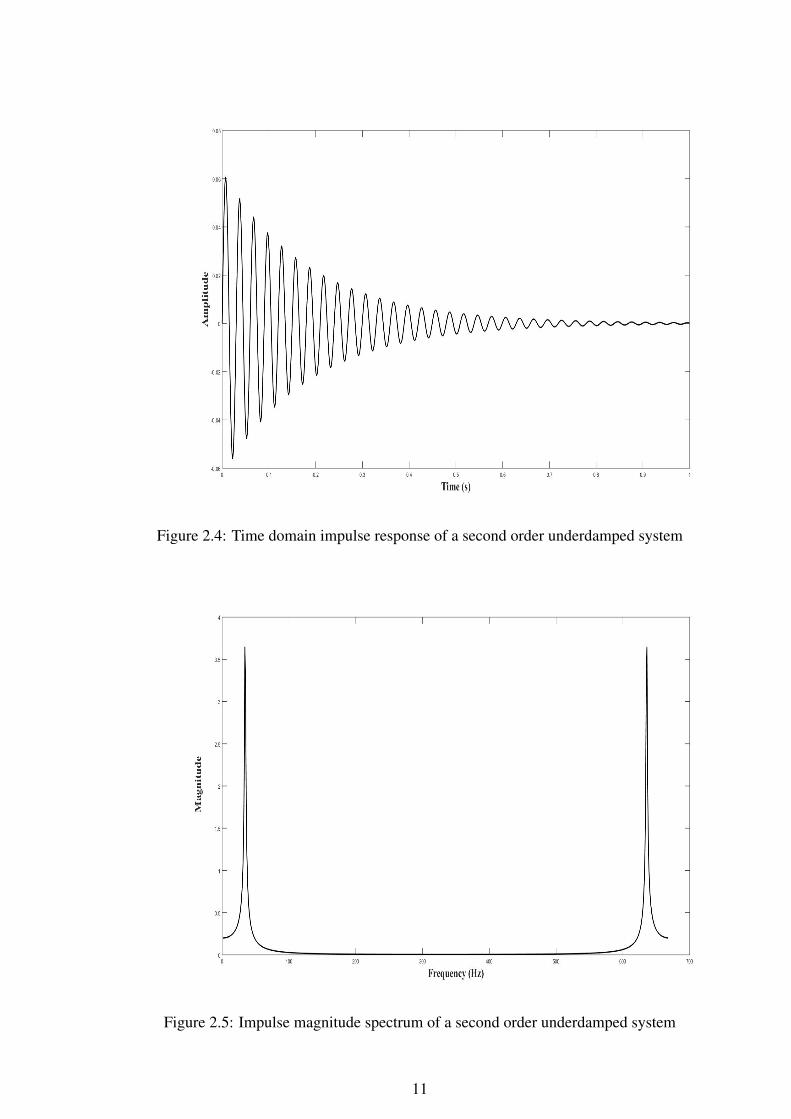
Figure 2.4: Time domain impulse response of a second order underdamped system
Figure 2.5: Impulse magnitude spectrum of a second order underdamped system
11

CHAPTER 3
MICROPHONE BASED SOUND ANALYZER
An experiment involving sound or audio data acquisition requires a well designed mi-
crophone to serve the purpose. Selecting the suitable microphone is done based on
some of the characteristics discussed below.
3.1 Polar patterns
Polar patterns describe the positions of the microphone which the diaphragms listen to
and those positions to which they are blocked. Understanding these patterns helps in
selecting the right mics that captures the sound we need and blocks unwanted noises.
Most commonly found polar patterns are Cardioid type, Super/Hyper Cardioid type,
Bi-directional type, Omnidirectional type and Shotgun microphone. Fig. 3.1 shows the
polar patterns of different microphones.
Figure 3.1: Polar patterns of microphones (Briones, 2015)

Cardioid mics are unidirectional and captures only the sound from its front facing
side and blocks everything else. It helps in isolating a particular sound source from its
other surrounding noises. Also these are the most popular type of mics used. Compared
to cardioid type mics, Super/Hyper cardioid mics have their capture area in front side
slightly narrower, however its sensitivity to noise from the back side makes it slightly
prone to external noises while capturing the audio from a focused source. On the other
side, bi-directional mics as the name indicates, is sensitive to both front and back faces,
but blocks the sides. Bi-directional ones are used when recording of two different in-
struments or sound sources are required. Omnidirectional mics captures the signal from
all directions. They have non-directional design and hence zero rejection. Shotgun mics
has a tube like structure that makes the polar pattern even more narrower and directional
than Super/Hyper cardioid mics in their front side. Its tighter pattern makes it suitable
for long range pickup.
3.2 Types of microphones
Based on the working principle, microphones are mainly of 3 types: Dynamic, Con-
denser and Ribbon microphones. Characteristics of each are described below.
3.2.1 Dynamic microphones
Basic working principle of Dynamic mic is electro magnetic induction. It uses a moving
coil magnetic diaphragm. When the sound waves hits the diaphragm, it starts vibrating
along with the coil attached to it. The coil that is vibrating in the magnetic field, creates a
current which in turn is converted into electric signals. These electric signals are used to
operate amplifiers. These types of mics are generally used to capture loud surroundings
as it can handle high pressures. Fig. 3.2 shows a typical dynamic microphone and its
working principle.
13

Figure 3.2: Dynamic microphone and its working (Poole, 2016)
3.2.2 Condenser microphones
Condenser mics work based on the change in capacitance caused by diaphragm move-
ment. It contains a diaphragm and a back plate that are kept together to work like a
capacitor and when the sound waves hits the diaphragm, it vibrates to produce a change
in capacitance which is sensed to produce audio signals. They have improved sound
quality due to the technology used and hence are used for precision sound recording.
Fig. 3.3 shows the working of a condenser microphone.
Figure 3.3: Working of a condenser microphone (Poole, 2016)
3.2.3 Ribbon microphones
Ribbon mics uses a metal ribbon which is made of a material called duraluminium.
This ribbon is placed in between two poles of magnets to produce voltages and picks
up the velocity of air, and hence are suitable for higher frequency audio signals. Due
to their high sensitivity, the high end gets rolled off when the sound source is very near
to microphone. These type of mics are not commonly used in present day situations.
14
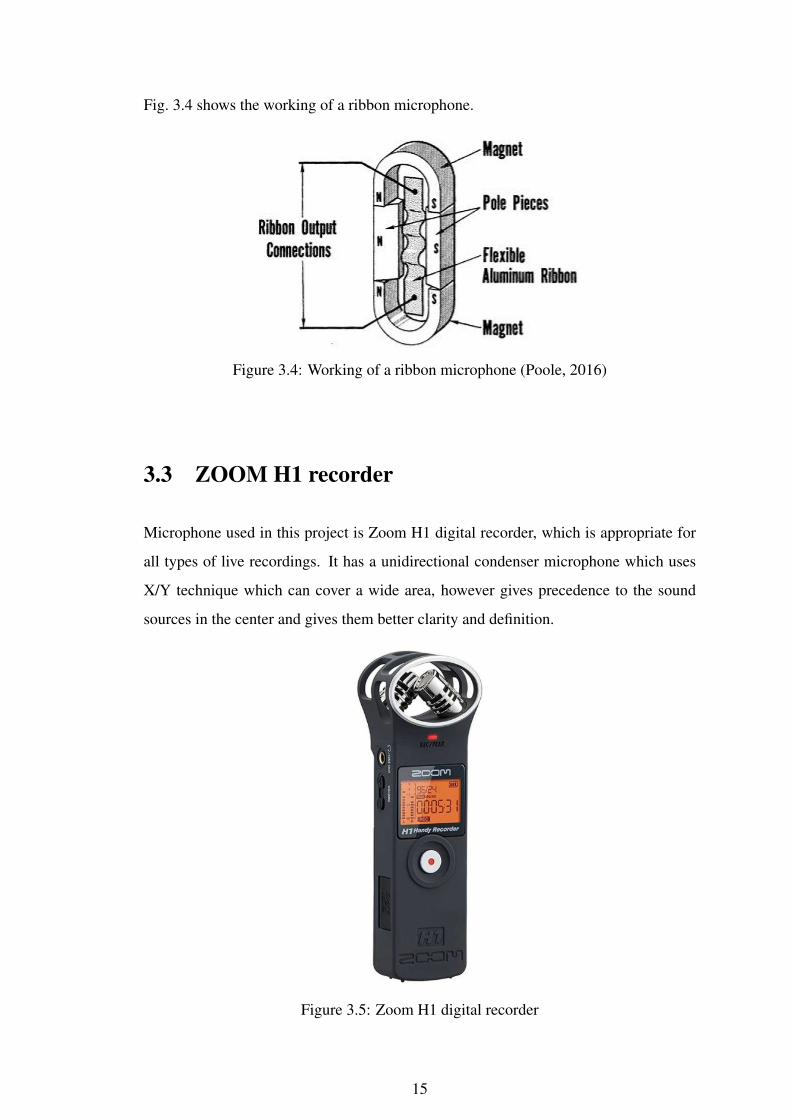
Fig. 3.4 shows the working of a ribbon microphone.
Figure 3.4: Working of a ribbon microphone (Poole, 2016)
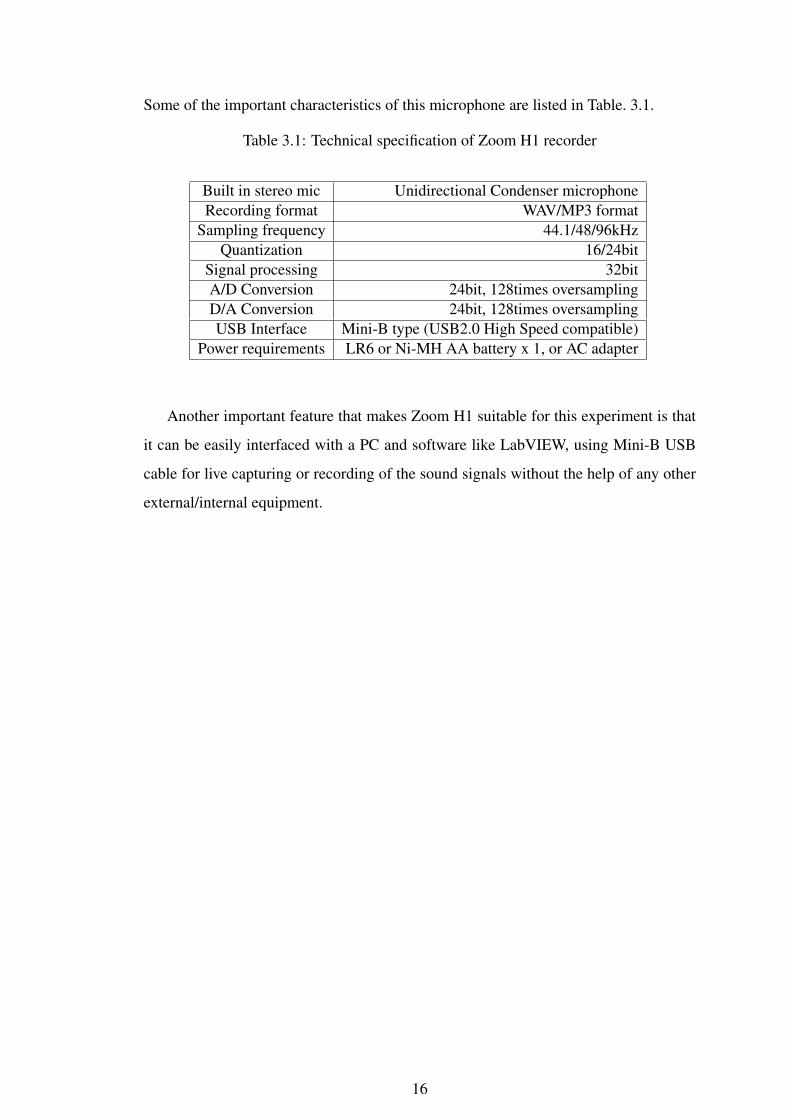
3.3 ZOOM H1 recorder
Microphone used in this project is Zoom H1 digital recorder, which is appropriate for
all types of live recordings. It has a unidirectional condenser microphone which uses
X/Y technique which can cover a wide area, however gives precedence to the sound
sources in the center and gives them better clarity and definition.
Figure 3.5: Zoom H1 digital recorder
15
Some of the important characteristics of this microphone are listed in Table. 3.1.
Table 3.1: Technical specification of Zoom H1 recorder
Built in stereo mic Unidirectional Condenser microphoneRecording format WAV/MP3 format
Sampling frequency 44.1/48/96kHzQuantization 16/24bit
Signal processing 32bitA/D Conversion 24bit, 128times oversamplingD/A Conversion 24bit, 128times oversamplingUSB Interface Mini-B type (USB2.0 High Speed compatible)
Power requirements LR6 or Ni-MH AA battery x 1, or AC adapter
Another important feature that makes Zoom H1 suitable for this experiment is that
it can be easily interfaced with a PC and software like LabVIEW, using Mini-B USB
cable for live capturing or recording of the sound signals without the help of any other
external/internal equipment.
16

CHAPTER 4
EXPERIMENTS & RESULTS
4.1 LabVIEW data acquisition
Data acquisition (DAQ) is the process of sampling the electrical or real world physical
signals and converting the samples into a digital equivalent that can be analyzed using
a PC. Primary components of DAQ system are the sensors, signal conditioning circuit
and an ADC. LabVIEW is a system design software which uses a visual programming
language commonly used for data acquisition and Industrial automation.
Microphone Zoom H1, which is used in this project as the primary sound sensor or
recorder, is interfaced with PC (i.e. LabVIEW) using mini-B USB cable. It allows us
to analyze the surrounding sounds in real time with the help of LabVIEW software.
Figure 4.1: Microphone interfaced with PC and data acquisition
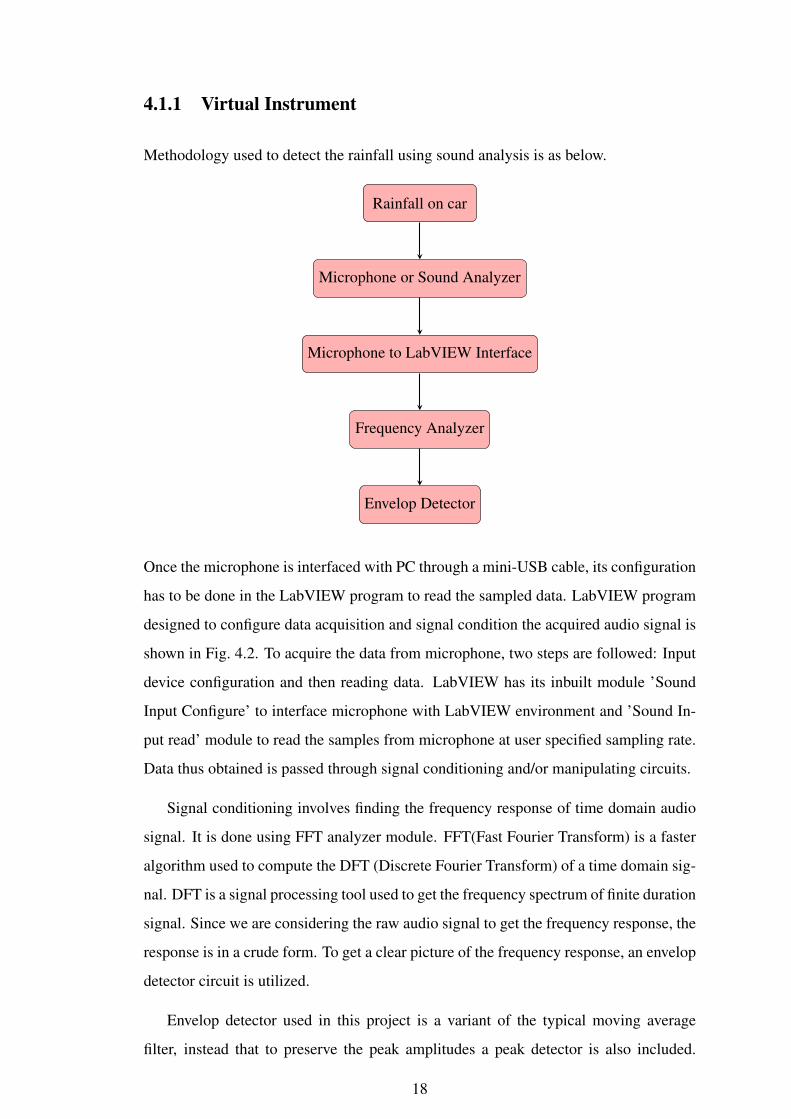
4.1.1 Virtual Instrument
Methodology used to detect the rainfall using sound analysis is as below.
Rainfall on car
Microphone or Sound Analyzer
Microphone to LabVIEW Interface
Frequency Analyzer
Envelop Detector
Once the microphone is interfaced with PC through a mini-USB cable, its configuration
has to be done in the LabVIEW program to read the sampled data. LabVIEW program
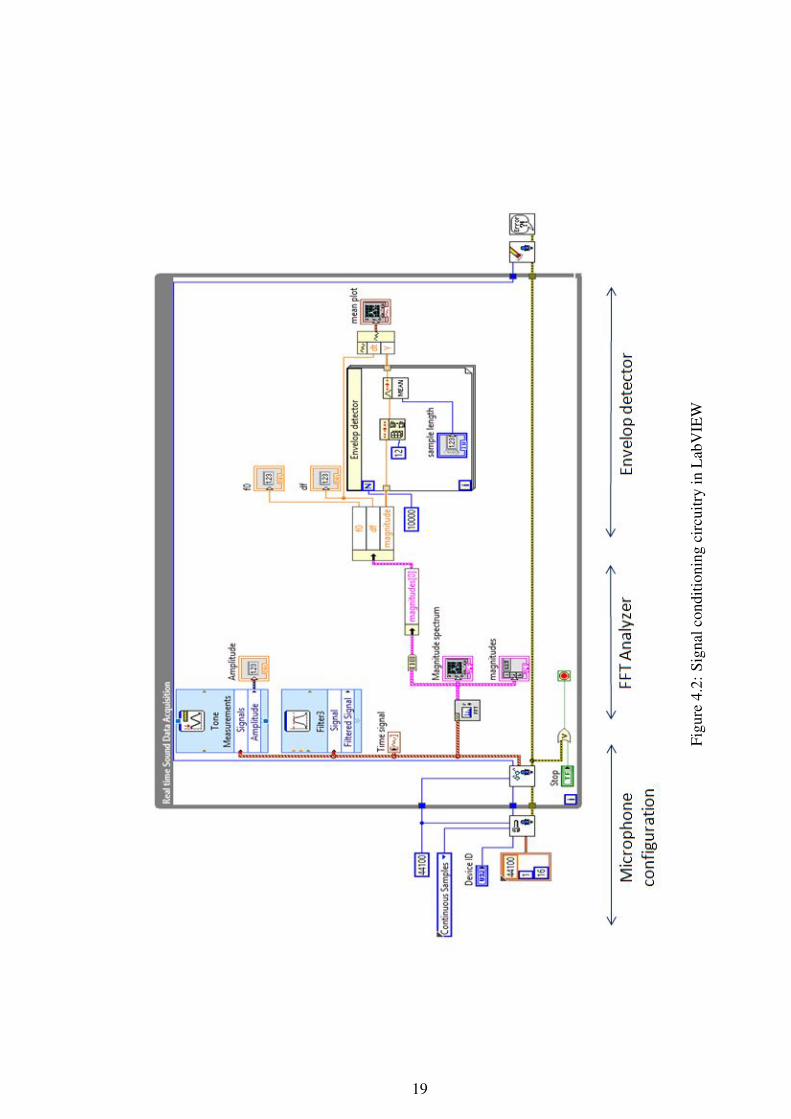
designed to configure data acquisition and signal condition the acquired audio signal is
shown in Fig. 4.2. To acquire the data from microphone, two steps are followed: Input
device configuration and then reading data. LabVIEW has its inbuilt module ’Sound
Input Configure’ to interface microphone with LabVIEW environment and ’Sound In-
put read’ module to read the samples from microphone at user specified sampling rate.
Data thus obtained is passed through signal conditioning and/or manipulating circuits.
Signal conditioning involves finding the frequency response of time domain audio
signal. It is done using FFT analyzer module. FFT(Fast Fourier Transform) is a faster
algorithm used to compute the DFT (Discrete Fourier Transform) of a time domain sig-
nal. DFT is a signal processing tool used to get the frequency spectrum of finite duration
signal. Since we are considering the raw audio signal to get the frequency response, the
response is in a crude form. To get a clear picture of the frequency response, an envelop
detector circuit is utilized.
Envelop detector used in this project is a variant of the typical moving average
filter, instead that to preserve the peak amplitudes a peak detector is also included.
18
Figu
re4.
2:Si
gnal
cond
ition
ing
circ
uitr
yin
Lab
VIE
W
19
The envelop detector designed as shown in Fig. 4.2, consists of a peak detector and a
mean calculator. Frequency spectrum array that is fed into this detector is considered
as a group of samples whose length is user defined. Peak detector collects the peak
value from each group of samples and the mean calculator further calculates the mean
of sample groups, output by peak detector, and thereby giving the envelop of input
frequency response graph.
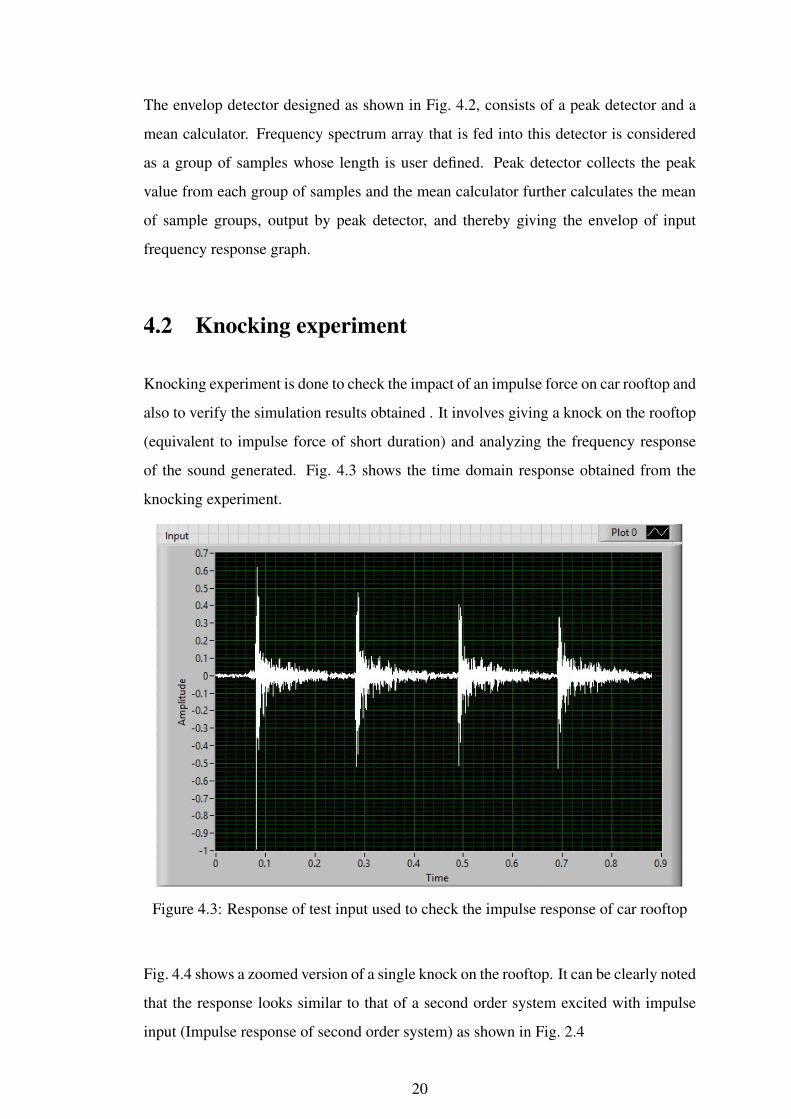
4.2 Knocking experiment
Knocking experiment is done to check the impact of an impulse force on car rooftop and
also to verify the simulation results obtained . It involves giving a knock on the rooftop
(equivalent to impulse force of short duration) and analyzing the frequency response
of the sound generated. Fig. 4.3 shows the time domain response obtained from the
knocking experiment.
Figure 4.3: Response of test input used to check the impulse response of car rooftop
Fig. 4.4 shows a zoomed version of a single knock on the rooftop. It can be clearly noted
that the response looks similar to that of a second order system excited with impulse
input (Impulse response of second order system) as shown in Fig. 2.4
20
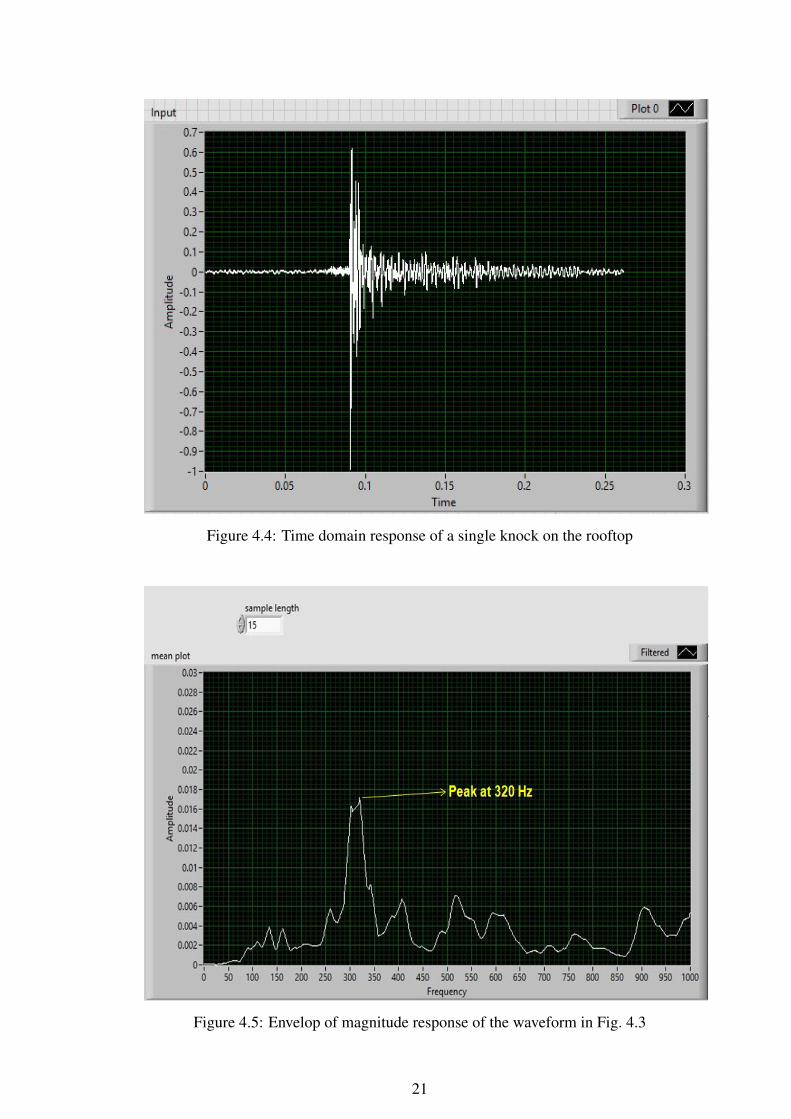
Figure 4.4: Time domain response of a single knock on the rooftop
Figure 4.5: Envelop of magnitude response of the waveform in Fig. 4.3
21
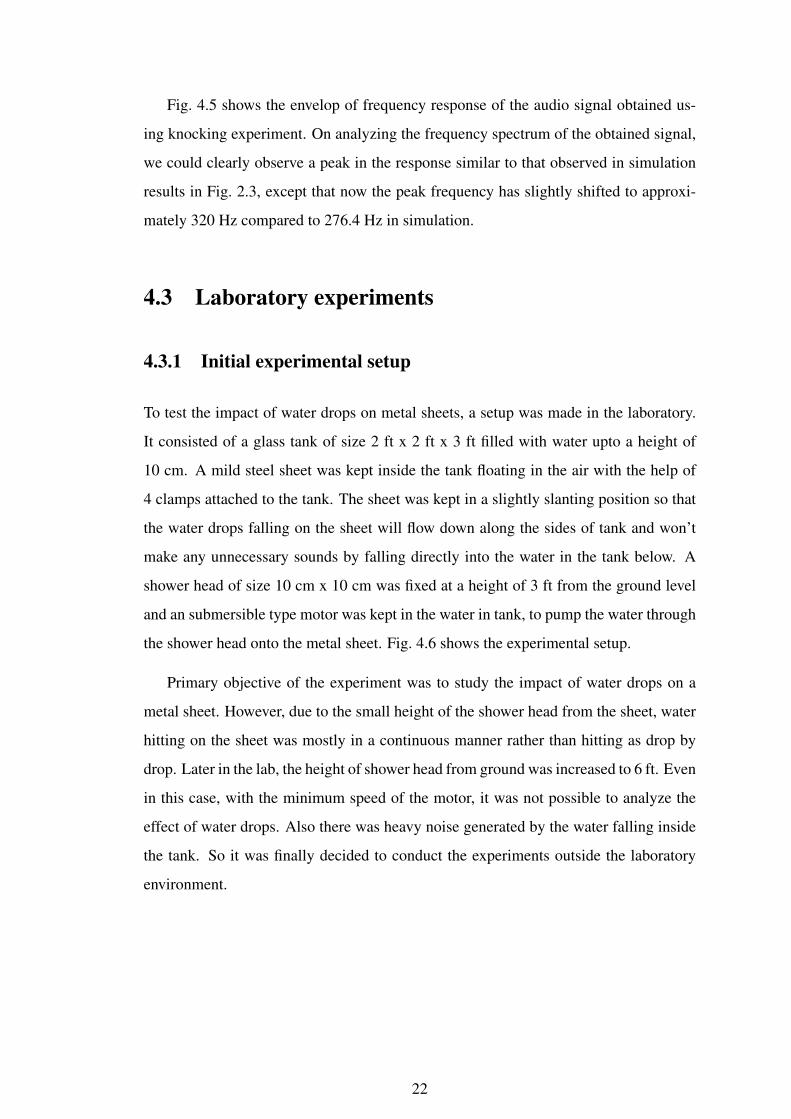
Fig. 4.5 shows the envelop of frequency response of the audio signal obtained us-
ing knocking experiment. On analyzing the frequency spectrum of the obtained signal,
we could clearly observe a peak in the response similar to that observed in simulation
results in Fig. 2.3, except that now the peak frequency has slightly shifted to approxi-
mately 320 Hz compared to 276.4 Hz in simulation.
4.3 Laboratory experiments
4.3.1 Initial experimental setup
To test the impact of water drops on metal sheets, a setup was made in the laboratory.
It consisted of a glass tank of size 2 ft x 2 ft x 3 ft filled with water upto a height of
10 cm. A mild steel sheet was kept inside the tank floating in the air with the help of
4 clamps attached to the tank. The sheet was kept in a slightly slanting position so that
the water drops falling on the sheet will flow down along the sides of tank and won’t
make any unnecessary sounds by falling directly into the water in the tank below. A
shower head of size 10 cm x 10 cm was fixed at a height of 3 ft from the ground level
and an submersible type motor was kept in the water in tank, to pump the water through
the shower head onto the metal sheet. Fig. 4.6 shows the experimental setup.
Primary objective of the experiment was to study the impact of water drops on a
metal sheet. However, due to the small height of the shower head from the sheet, water
hitting on the sheet was mostly in a continuous manner rather than hitting as drop by
drop. Later in the lab, the height of shower head from ground was increased to 6 ft. Even
in this case, with the minimum speed of the motor, it was not possible to analyze the
effect of water drops. Also there was heavy noise generated by the water falling inside
the tank. So it was finally decided to conduct the experiments outside the laboratory
environment.
22
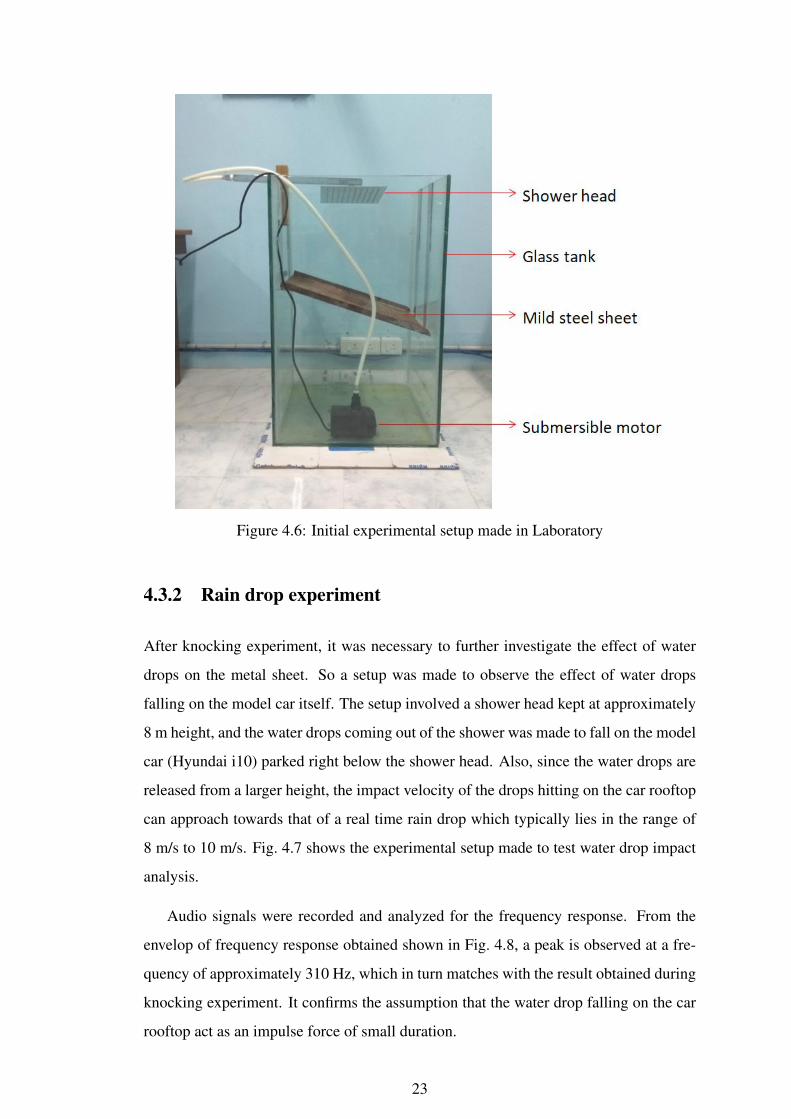
Figure 4.6: Initial experimental setup made in Laboratory
4.3.2 Rain drop experiment
After knocking experiment, it was necessary to further investigate the effect of water
drops on the metal sheet. So a setup was made to observe the effect of water drops
falling on the model car itself. The setup involved a shower head kept at approximately
8 m height, and the water drops coming out of the shower was made to fall on the model
car (Hyundai i10) parked right below the shower head. Also, since the water drops are
released from a larger height, the impact velocity of the drops hitting on the car rooftop
can approach towards that of a real time rain drop which typically lies in the range of
8 m/s to 10 m/s. Fig. 4.7 shows the experimental setup made to test water drop impact
analysis.
Audio signals were recorded and analyzed for the frequency response. From the
envelop of frequency response obtained shown in Fig. 4.8, a peak is observed at a fre-
quency of approximately 310 Hz, which in turn matches with the result obtained during
knocking experiment. It confirms the assumption that the water drop falling on the car
rooftop act as an impulse force of small duration.
23
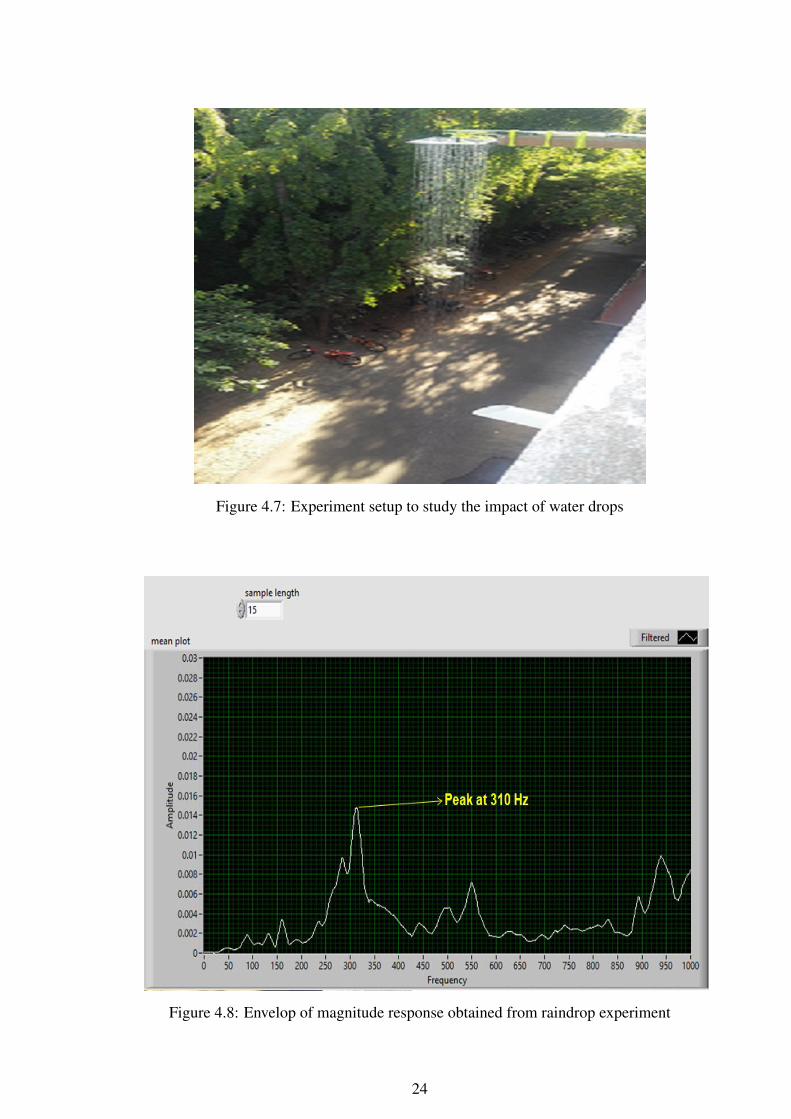
Figure 4.7: Experiment setup to study the impact of water drops
Figure 4.8: Envelop of magnitude response obtained from raindrop experiment
24
4.4 Real time rain data analysis
To study the effect of water drops during actual rainfall conditions, several samples
of audio were collected. Samples were collected from inside the car during rainfall,
while in parked situation and also while on running situation to compare and observe
the impacts.
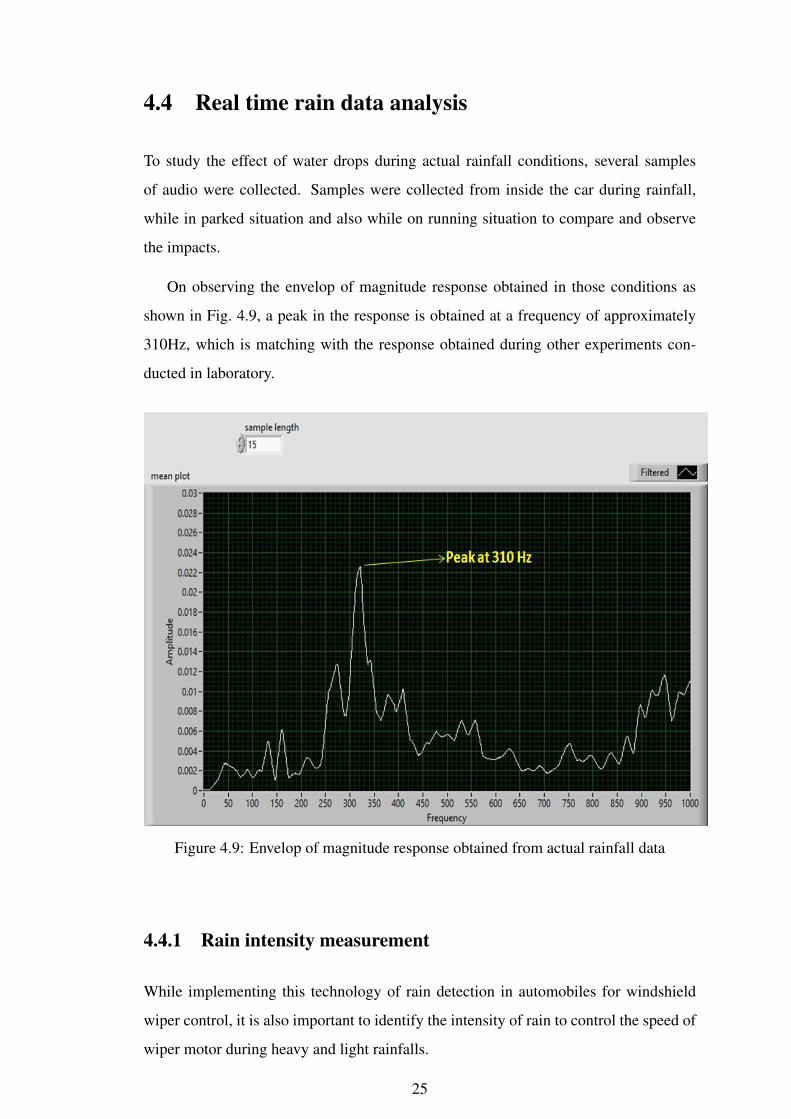
On observing the envelop of magnitude response obtained in those conditions as
shown in Fig. 4.9, a peak in the response is obtained at a frequency of approximately
310Hz, which is matching with the response obtained during other experiments con-
ducted in laboratory.
Figure 4.9: Envelop of magnitude response obtained from actual rainfall data
4.4.1 Rain intensity measurement
While implementing this technology of rain detection in automobiles for windshield
wiper control, it is also important to identify the intensity of rain to control the speed of
wiper motor during heavy and light rainfalls.
25

(a)
(b)
Figure 4.10: Envelop of magnitude response obtained during (a) Light rainfall and(b) Heavy rainfall
26

Audio samples recorded during actual rain situation included the signals during light
and heavy rainfall as well and the obtained magnitude response is shown in Fig. 4.10a
and Fig. 4.10b respectively. On analyzing the observed magnitude response envelopes,
there is a peak in the response at a frequency of approximately 310 Hz in both the cases,
however it is worth noting that the amplitude in both cases are giving a clear indication
of the intensity of rainfall. As the intensity of the rainfall increases, a good change in
the peak amplitude is observed and hence the amplitude can be used as a measure of
the rainfall intensity.
27

CHAPTER 5
CONCLUSION & FUTURE SCOPE
5.1 Conclusion
From the Ansys simulation results, impulse force acting on a metal sheet structure
(structure similar in geometry and properties of that of the rooftop of the model car)
showed a peak in the magnitude of vibration at a frequency around 276.4 Hz. Com-
paring with the experimental results from knocking experiment, time domain signal
obtained was similar to the response of a second order system to an impulse input and
its magnitude response showed a peak at frequency around 320 Hz. Audio signals
from the rain drop experiment and actual rainfall condition also gave a similar mag-
nitude response with a peak at frequency around 310 Hz. The small variation in the
peak frequency obtained in simulation and the real time experiments must be due to
the assumptions made while selecting the physical properties of the metal sheet used in
simulation. Also the actual rooftop geometry does not exactly resemble to that of a rect-
angle as simulated. And if we consider the system to be of second order, the resonant
frequency is inversely proportional to the square root of mass of the object. So, even
small changes in the geometry of metal sheet effects the mass of the sheet and hence
have a direct influence on the resonant frequency. From these observations, it can be
concluded that the raindrop hitting the metal body act as an impulse force and the sheet
vibrates at its resonant frequency. Hence, by knowing the resonant frequency of the car
rooftop and by sensing the presence of this frequency in the audio signal obtained, it
can be used to detect the rainfall.
From the results obtained during heavy and light rainfalls, it can be observed that
there is a significant change in the amplitude of the peak response in both cases, which
in turn gives a direct measure of the rainfall intensity.

5.2 Future scope of the project
The future scope of this project is to convert the presence of the targeted frequency into
an analog signal using a DAQ module and thereby controlling the wiper motor. Also,
with proper calibration of the amplitude, the model can also be used for approximating
the intensity of rainfall and hence to control the wiper speed based on rain intensity. This
model can be experimented to be used as a general purpose rainfall detection system,
with proper sound proofing techniques and a high sensitive diaphragm.
29

APPENDIX A
STFT ANALYSIS
Short Time Fourier Transform (STFT) is a commonly used signal processing tool which
helps in analyzing the frequency response of small sections of a signal which changes
over time. It divides a longer duration of signal into small sections of equal duration
and then compute the fourier tranform of each smaller sections. STFT uses a window
function of fixed length which moves over the actual signal to divide into small sections.
Eqn A.1 shows the mathematical formulation to obtain STFT of a signal x[n].
X(m,ω) =+∞∑
n=−∞
x[n]w[n−m]e−jωn (A.1)
where, w[n] is the window function used.
STFT is used in this project to analyze the audio samples obtained during real time
rainfall conditions. Program designed in LabVIEW to obtain the STFT spectrum is
shown in Fig. A.1.
STFT plots the spectrum of frequency versus time and indicates amplitude with the
help of different colour codes. On analyzing the results obtained in Fig. A.2, the peak
in the magnitude is observed again at 310 Hz (indicated by the light blue line) while
other frequencies are having minimal presence (indicated by black or dark blue), which
again confirms the results previously obtained.
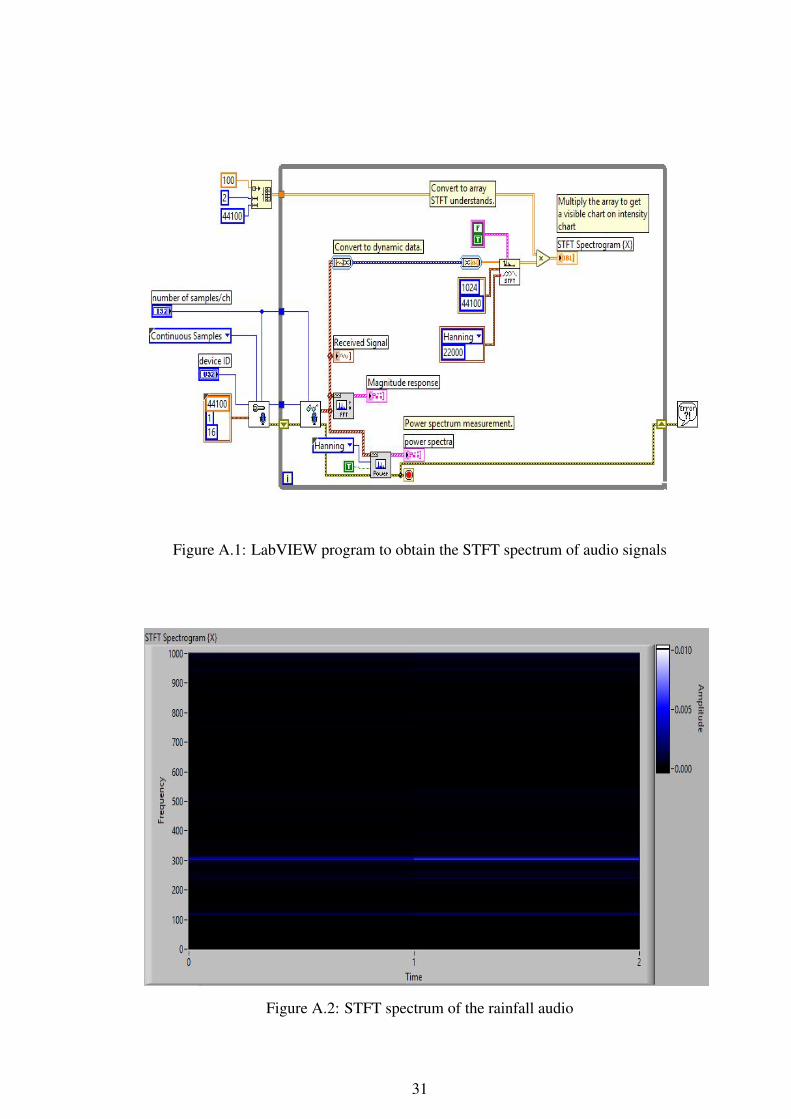
Figure A.1: LabVIEW program to obtain the STFT spectrum of audio signals
Figure A.2: STFT spectrum of the rainfall audio
31
REFERENCES
1. Briones, A. (2015). The different types of mics and their uses. URL https://www.gearank.com/articles/types-of-mics.
2. Choi, K. N., Omni-directional rain sensor utilizing scattered light reflection by waterparticle on automotive windshield glass. In SENSORS, 2011 IEEE. 2011. ISSN 1930-0395.
3. Ferroudj, M., A. Truskinger, M. Towsey, L. Zhang, J. Zhang, and P. Roe, Detec-tion of rain in acoustic recordings of the environment. In D.-N. Pham and S.-B. Park(eds.), PRICAI 2014: Trends in Artificial Intelligence. Springer International Publish-ing, Cham, 2014. ISBN 978-3-319-13560-1.
4. Fu, X. and H.-N. Li (2018). Effect of raindrop size distribution on rain load and itsmechanism in analysis of transmission towers. International Journal of Structural Sta-bility and Dynamics, 1850115.
5. Joshi, M., K. Jogalekar, D. N. Sonawane, V. Sagare, and M. A. Joshi, A noveland cost effective resistive rain sensor for automatic wiper control: Circuit modellingand implementation. In 2013 Seventh International Conference on Sensing Technology(ICST). 2013. ISSN 2156-8073.
6. P. Guo, Y. and J. E. Ffowcs Williams (1991). Theoretical study on drop impact soundand rain noise. Journal of Fluid Mechanics, 227, 345 – 355.
7. Poole, I. (2016). Microphone types. URL https://www.electronics-notes.com/articles/audio-video/microphones/microphone-types.php.
8. Roy, P. and N. Ganesan (1995). Transient response of a cantilever beam subjected toan impulse load. Journal of Sound and Vibration - J SOUND VIB, 183, 873–880.
9. Trono, E. M., M. L. Guico, N. J. C. Libatique, G. L. Tangonan, D. N. B. Baluyot,T. K. R. Cordero, F. A. P. Geronimo, and A. P. F. Parrenas, Rainfall monitoringusing acoustic sensors. In TENCON 2012 IEEE Region 10 Conference. 2012. ISSN2159-3450.
32

CURRICULUM VITAE
NAME : AKHIL NATH C K
DATE OF BIRTH : 29.04.1993
PLACE OF BIRTH : Vatakara, Kozhikode, Kerala
EDUCATION : B.Tech in Electronics and
Instrumentation Engineering from
Amrita School of Engineering,
Coimbatore
EMPLOYMENT : Nil
ADDRESS : No. 9, 7th cross Kamarajar Street,
K.K.Pudur, Coimbatore, Tamil Nadu
EMAIL ID : [email protected]