a quick guide to understanding business in greater vancouver
TRANSCRIPT
DataScienceCompetition,CityOfVancouverBusinessLicencesWewillbeansweringquestionsregardingthebusinesslicensedatamadeavailablebytheCityOfVancouverfoundhere: http://data.vancouver.ca/datacatalogue/businessLicence.htmMoreimportantly,ourquestionsspecificallyanalyzehowBusinessTypeandLocalAreaaffectthebehaviorofbusinessesinGreaterVancouverwithrespecttotheirageandprobabilityoffailure.
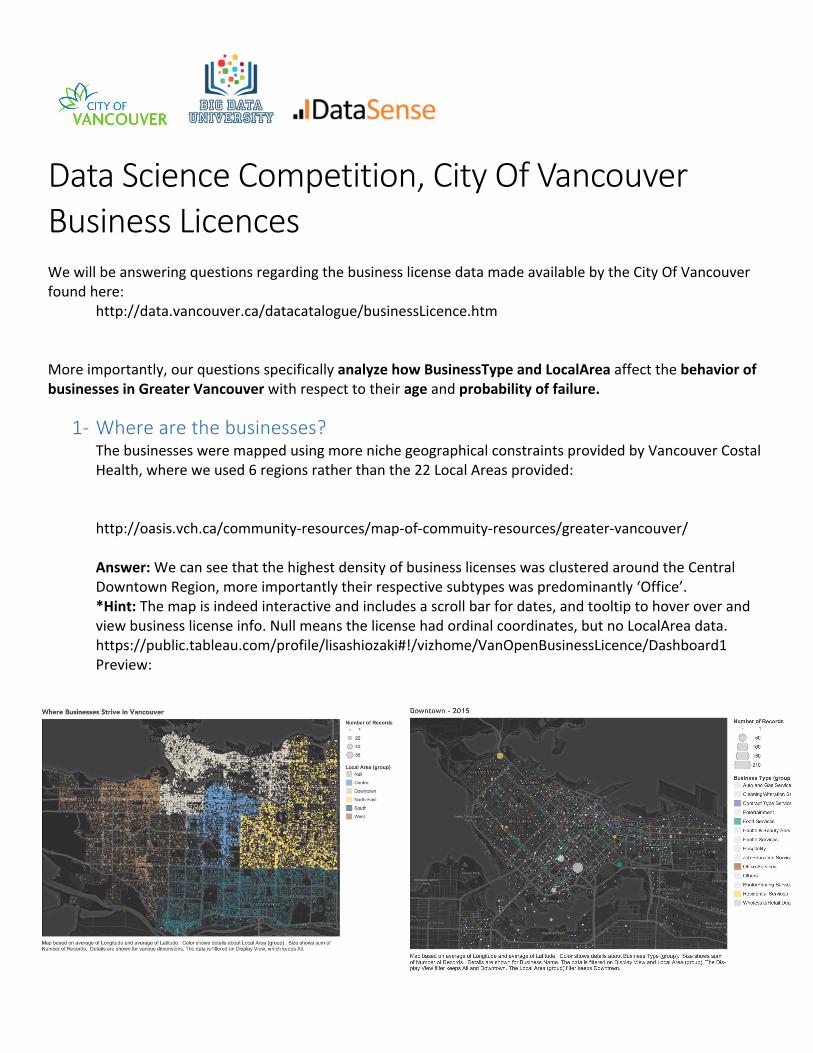
1- Wherearethebusinesses?ThebusinessesweremappedusingmorenichegeographicalconstraintsprovidedbyVancouverCostalHealth,whereweused6regionsratherthanthe22LocalAreasprovided: http://oasis.vch.ca/community-resources/map-of-commuity-resources/greater-vancouver/Answer:WecanseethatthehighestdensityofbusinesslicenseswasclusteredaroundtheCentralDowntownRegion,moreimportantlytheirrespectivesubtypeswaspredominantly‘Office’.*Hint:Themapisindeedinteractiveandincludesascrollbarfordates,andtooltiptohoveroverandviewbusinesslicenseinfo.Nullmeansthelicensehadordinalcoordinates,butnoLocalAreadata.https://public.tableau.com/profile/lisashiozaki#!/vizhome/VanOpenBusinessLicence/Dashboard1Preview:

2- Whatarethemostcommontypesandareasofbusiness?Inferences:Inordertoformamoreconcreteanswer,hereweinferthattheamountoflicencesissuedperBusinessTypeorAreaimplybusinessactivity.Answer:Inagreementwithabovemap,themostcommontypeis‘Office’andtheareais‘Downtown’

3- IstherearelationbetweenBusinessTypeandtheamountofdayslicensed?Inference:GiventhatBusinessType=’Office’andLocalArea=’Central/Downtown’havethemostbusinesslicenses,wearetotestforthesimplestofrelations,alinearregression.TheamountofdayslicencediscomputedasthedifferencebetweentheExpiredDateandtheIssuedDate.ThedaysarethenaggregatedbyBusinessTypeorLocalAreaaccordingly.ExplanatoryVariable:BusinessType(x) Wherey=β0+β1[x] Andy=DaysLicensed
Answer:TheansweristhereisindeedarelationbetweenBusinessTypeandDaysLicensedasgivenbythenegligibleProb(F-statistic).However,thepredictivevalueoftheabovelinearmodelisrelativelylowduetotheR-Squaredvalueof0.102.

4- Wherearethemostbusinessesfailingandwhattypes?Inferences:Inordertoquantitativelydepictfailure,theamountof“GoneOutOfBusiness”statusesforeachLocalAreaorBusinessTypewasaggregated.ThatnumberwasthendividedbythetotalnumberoflicensesforitsrespectiveLocalAreaorBusinessTypetoyieldaratio.Theratiowasthenexpressedasa%.Answer:WithrespecttoLocalArea,the%Failureisrelativelyevenlydistributedamongstthetop10failingareasat~10%.Meanwhile,thespreadwasmoreintriguingforBusinessType.TheLocalAreawiththemost‘GoingoutofBusiness”licensestatuseswasRenfrew/Collingwood,whiletheBusinessTypewiththemost‘GoingoutofBusiness”licensestatuseswasPublicMarket-Daily.