a quantitative theory of immediate visual recognition -...
TRANSCRIPT

A quantitative theory of immediate visual recognition
Thomas Serre, Gabriel Kreiman∗, Minjoon Kouh, Charles Cadieu†,Ulf Knoblich and Tomaso Poggio
Center for Biological and Computational LearningMcGovern Institute for Brain Research
Computer Science and Artificial Intelligence LaboratoryBrain and Cognitive Sciences Department
Massachusetts Institute of Technology
March 18, 2007
Abstract
Human and non-human primates excel at visual recognition tasks. The primate visualsystem exhibits a strong degree of selectivity while at the same time being robust to changesin the input image. We have developed a quantitative theory to account for the computa-tions performed by the feedforward path in the ventral stream of the primate visual cortex.Here we review recent predictions by a model instantiating the theory about physiologicalobservations in higher visual areas. We also show that the model can perform recognitionon datasets of complex natural images at a level comparable to psychophysical measure-ments on human observers during rapid categorization tasks. In sum, the evidence sug-gests that the theory may provide a framework to explain the first 100-150 milliseconds ofvisual object recognition. The model also constitutes a vivid example of how computationalmodels can interact with experimental observations in order to advance our understandingof a complex phenomenon. We conclude by suggesting a number of open questions, pre-dictions and specific experiments for visual physiology and psychophysics.
∗Current address: Children’s Hospital Boston, Harvard Medical School†Current address: Redwood Ceter for Theoretical Neuroscience and Helen Wills Neuroscience Institute, Univer-
sity of California, Berkeley
1
1 Introduction
The primate visual system rapidly and effortlessly recognizes a large number of diverse ob-jects in cluttered, natural scenes. In particular, it can easily categorize images or parts of them,for instance as an office scene or a face within that scene, and identify a specific object. Thisremarkable ability is evolutionarily important since it allows us to distinguish friend from foeand identify food targets in complex, crowded scenes. Despite the ease with which we see,visual recognition – one of the key issues addressed in computer vision – is quite difficult forcomputers. The problem of object recognition is even more difficult from the point of view ofneuroscience, since it involves several levels of understanding from the information process-ing or computational level to circuits and biophysical mechanisms. After decades of work indifferent brain areas ranging from the retina to higher cortical areas, the emerging picture ofhow cortex performs object recognition is becoming too complex for any simple qualitative“mental” model.
A quantitative, computational theory can provide a much needed framework for summa-rizing and integrating existing data and for planning, coordinating and interpreting new ex-periments. Models are powerful tools in basic research, integrating knowledge across severallevels of analysis – from molecular to synaptic, cellular, systems and to complex visual behav-ior. In this paper, we describe a quantitative theory of object recognition in primate visual cor-tex that (1) bridges several levels of understanding from biophysics to physiology and behaviorand (2) achieves human level performance in rapid recognition of complex natural images. Thetheory is restricted to the feedforward path of the ventral stream and therefore to the first 100-150 ms of visual recognition; it does not describe top-down influences, though it should be, inprinciple, capable of incorporating them.
In contrast to other models that address the computations in any one given brain area (suchas primary visual cortex) or attempt to explain a particular phenomenon (such as contrast adap-tation or a specific visual illusion), we describe here a large-scale neurobiological model thatattempts to describe the basic processes across multiple brain areas. One of the initial key ideasin this and many other models of visual processing (Fukushima, 1980; Perrett and Oram, 1993;Mel, 1997; Wallis and Rolls, 1997; Riesenhuber and Poggio, 1999) comes from the pioneeringphysiological studies and models of Hubel and Wiesel (1962).
Following their work on striate cortex, they proposed a hierarchical model of cortical orga-nization. They described a hierarchy of cells within the primary visual cortex: at the bottomof the hierarchy, the radially symmetric cells behave similarly to cells in the thalamus and re-spond best to small spots of light. Second, the simple cells which do not respond well to spotsof light but require bar-like (or edge-like) stimuli at a particular orientation, position and phase(i.e., white bar on a black background or dark bar on a white background). In turn, complexcells are also selective for bars at a particular orientation but they are insensitive to both thelocation and the phase of the bar within their receptive fields. At the top of the hierarchy, hy-percomplex cells not only respond to bars in a position and phase invariant way like complexcells, but are also selective for bars of a particular length (beyond a certain length their responsestarts to decrease). Hubel & Wiesel suggested that such increasingly complex and invariant ob-ject representations could be progressively built by integrating convergent inputs from lowerlevels. For instance, position invariance at the complex cell level could be obtained by pool-ing over simple cells at the same preferred orientation but at slightly different positions. Themain contribution from this and other models of visual processing (Fukushima, 1980; Perrettand Oram, 1993; Mel, 1997; Wallis and Rolls, 1997; Riesenhuber and Poggio, 1999) has been toextend the notion of hierarchy beyond V1 to extrastriate areas and show how this can explainthe tuning properties of neurons in higher areas of the ventral stream of the visual cortex.
2

A number of biologically-inspired algorithms have been described (Fukushima, 1980; Le-Cun et al., 1998; Ullman et al., 2002; Wersing and Koerner, 2003), i.e., systems which are onlyqualitatively constrained by the anatomy and physiology of the visual cortex. However, therehave been very few neurobiologically plausible models (Perrett and Oram, 1993; Olshausenet al., 1993; Mel, 1997; Wallis and Rolls, 1997; Riesenhuber and Poggio, 1999; Thorpe, 2002;Amit and Mascaro, 2003) that try to address a generic, high-level computational function suchas object recognition by summarizing and integrating a large body of data from different levelsof understanding. What should a general theory of biological object recognition be able to ex-plain? It should be constrained to match data from anatomy and physiology at different stagesof the ventral stream as well as human performance in complex visual tasks such as objectrecognition. The theory we propose may well be incorrect. Yet it represents a set of claims andideas that deserve to be either falsified or further developed and refined.
The scope of the current theory is limited to “immediate recognition”, i.e., to the first 100-150ms of the flow of information in the ventral stream. This is behaviorally equivalent to consider-ing “rapid categorization” tasks for which presentation times are fast and back-projections arelikely to be inactive (Lamme and Roelfsema, 2000). For such tasks, presentation times do notallow sufficient time for eye movements or shifts of attention (Potter, 1975). Furthermore, EEGstudies (Thorpe et al., 1996) provide evidence that the human visual system is able to solve anobject detection task – determining whether a natural scene contains an animal or not – within150 ms. Extensive evidence shows that the responses of inferior temporal (IT) cortex neuronsbegin 80-100 ms after onset of the visual stimulus (Perrett et al., 1992). Furthermore, the neuralresponses at the IT level are tuned to the stimulus essentially from response onset (Keyserset al., 2001). Recent data (Hung et al., 2005) show that the activity of small neuronal popula-tions in IT (around 100 randomly selected cells) over very short time intervals from responseonset (as small as 12.5 ms) contains surprisingly accurate and robust information supportingvisual object categorization and identification tasks. Finally, rapid detection tasks, e.g., animalvs. non-animal (Thorpe et al., 1996), can be carried out without top-down attention (Li et al.,2002). We emphasize that none of these rules out the use of local feedback – which is in factused by the circuits we propose for the two main operations postulated by the theory (see sec-tion 2) – but suggests a hierarchical forward architecture as the core architecture underlying“immediate recognition”.
We start by presenting the theory in section 2: we describe the architecture of a modelimplementing the theory, its two key operations and its learning stages. We briefly review theevidence about the agreement of the model with single cell recordings in visual cortical areas(V1, V2, V4) and describe in more detail how the final output of the model compares to theresponses in IT cortex during a decoding task that attempts to identify or categorize objects(section 3). In section 4, we further extend the approach to natural images and show that themodel performs surprisingly well in complex recognition tasks and is competitive with some ofthe best computer vision systems. As an ultimate and more stringent test of the theory, we showthat the model predicts the level of performance of human observers on a rapid categorizationtask. The final section 5 discusses the state of the theory, its limitations, a number of openquestions including critical experiments, and its extension to include top-down effects andcortical back-projections.
3

2 A quantitative framework for the ventral stream
2.1 Organization of the ventral stream of visual cortex
Object recognition in cortex is thought to be mediated by the ventral visual pathway (Ungerlei-der and Haxby, 1994). Information from the retina is conveyed to the lateral geniculate nucleusin the thalamus and then to primary visual cortex, V1. Area V1 projects to visual areas V2and V4, and V4 in turn projects to IT, which is the last exclusively visual area along the ven-tral stream (Felleman and van Essen, 1991). Based on physiological and lesion experiments inmonkeys, IT has been postulated to play a central role in object recognition (Schwartz et al.,1983). It is also a major source of input to prefrontal cortex (PFC) which is involved in linkingperception to memory and action (Miller, 2000).
Neurons along the ventral stream (Perrett and Oram, 1993; Tanaka, 1996; Logothetis andSheinberg, 1996) show an increase in receptive field size as well as in the complexity of theirpreferred stimuli (Kobatake and Tanaka, 1994). Hubel and Wiesel (1962) first described simplecells in V1 with small receptive fields that respond preferentially to oriented bars. At the top ofthe ventral stream, IT cells are tuned to complex stimuli such as faces and other objects (Grosset al., 1972; Desimone et al., 1984; Perrett et al., 1992).
A hallmark of the cells in IT is the robustness of their firing over stimulus transformationssuch as scale and position changes (Perrett and Oram, 1993; Logothetis et al., 1995; Tanaka,1996; Logothetis and Sheinberg, 1996). In addition, as other studies have shown, most neuronsshow specificity for a certain object view or lighting condition (Hietanen et al., 1992; Perrettand Oram, 1993; Logothetis et al., 1995; Booth and Rolls, 1998) while other neurons are view-invariant and in agreement with earlier predictions (Poggio and Edelman, 1990). Whereasview-invariant recognition requires visual experience of the specific novel object, significantposition and scale invariance seems to be immediately present in the view-tuned neurons (Lo-gothetis et al., 1995) without the need of visual experience for views of the specific object at dif-ferent positions and scales, see also (Hung et al., 2005).
In summary, the accumulated evidence points to four, mostly accepted, properties of thefeedforward path of the ventral stream architecture: a) a hierarchical build-up of invariancesfirst to position and scale and then to viewpoint and other transformations; b) an increasingselectivity, originating from inputs from previous layers and areas, with a parallel increase inboth the size of the receptive fields and in the complexity of the optimal stimulus; c) a basicfeedforward processing of information (for “immediate recognition” tasks); d) plasticity andlearning probably at all stages with a time scale that decreases from V1 to IT and PFC.
2.2 Architecture and model implementation
The physiological data summarized in the previous section, together with computational con-siderations on image invariances, lead to a theory which summarizes and extends several pre-viously existing neurobiological models (Hubel and Wiesel, 1962; Poggio and Edelman, 1990;Perrett and Oram, 1993; Mel, 1997; Wallis and Rolls, 1997; Riesenhuber and Poggio, 1999) andbiologically motivated computer vision approaches (Fukushima, 1980; LeCun et al., 1998; Ull-man et al., 2002). The theory maintains that:
1. One of the main functions of the ventral stream pathway is to achieve an exquisite trade-off between selectivity and invariance at the level of shape-tuned and invariant cells inIT from which many recognition tasks can be readily accomplished; the key computa-tional issue in object recognition is to be able to finely discriminate between differentobjects or object classes while at the same time being tolerant to object transformations
4

such as scaling, translation, illumination, viewpoint changes, changes in context and clut-ter, non-rigid transformations (such as a change of facial expression) and, for the case ofcategorization, also to shape variations within a class.
2. The underlying architecture is hierarchical, with a series of stages that gradually increaseinvariance to object transformations and tuning to more specific and complex features.
3. There exist at least two main functional types of units, simple and complex, which repre-sent the result of two main operations to achieve selectivity (S layer) and invariance (Clayer). The two corresponding operations are a (bell-shaped) Gaussian-like TUNING ofthe simple units and a MAX-like operation for invariance to position, scale and clutter (toa certain degree) of the complex units.
2.2.1 Two basic operations for selectivity and invariance
The simple S units perform a TUNING operation over their afferents to build object-selectivity.The S units receive convergent inputs from retinotopically organized units tuned to differentpreferred stimuli and combine these subunits with a bell-shaped tuning function, thus increasingobject selectivity and the complexity of the preferred stimulus. Neurons with a Gaussian-likebell-shaped tuning are prevalent across cortex. For instance, simple cells in V1 exhibit a Gaus-sian tuning around their preferred orientation; cells in AIT are typically tuned around a partic-ular view of their preferred object. From the computational point of view, Gaussian-like tuningprofiles may be key in the generalization ability of the cortex. Indeed, networks that combinethe activity of several units tuned with a Gaussian profile to different training examples haveproved to be a powerful learning scheme (Poggio and Edelman, 1990).
The complex C units perform a MAX-like operation over their afferents to gain invariance toseveral object transformations. The complex C units receive convergent inputs from retinotopi-cally organized S units tuned to the same preferred stimulus but at slightly different positionsand scales and combine these subunits with a MAX-like operation, thereby introducing toler-ance to scale and translation. The existence of a MAX operation in visual cortex was proposedby (Riesenhuber and Poggio, 1999) from theoretical arguments (and limited experimental ev-idence (Sato, 1989)) and was later supported experimentally in both V4 (Gawne and Martin,2002) and V1 at the complex cell level (Lampl et al., 2004).
A gradual increase in both selectivity and invariance, to 2D transformations, as observedalong the ventral stream and as obtained in the model by interleaving the two key operations,is critical for avoiding both a combinatorial explosion in the number of units and the bindingproblem between features. Below we shortly give idealized mathematical expressions for theoperations.
Idealized mathematical descriptions of the two operations: In the following, we denote byy the response of a unit (simple or complex). The set of inputs to the cell (i.e., presynapticunits) are denoted with subscripts j = 1, . . . , N . When presented with a pattern of activityx = (x1, . . . , xN ) as input, an idealized and static description of a complex unit response y isgiven by:
y = maxj=1,...,N
xj (1)
5
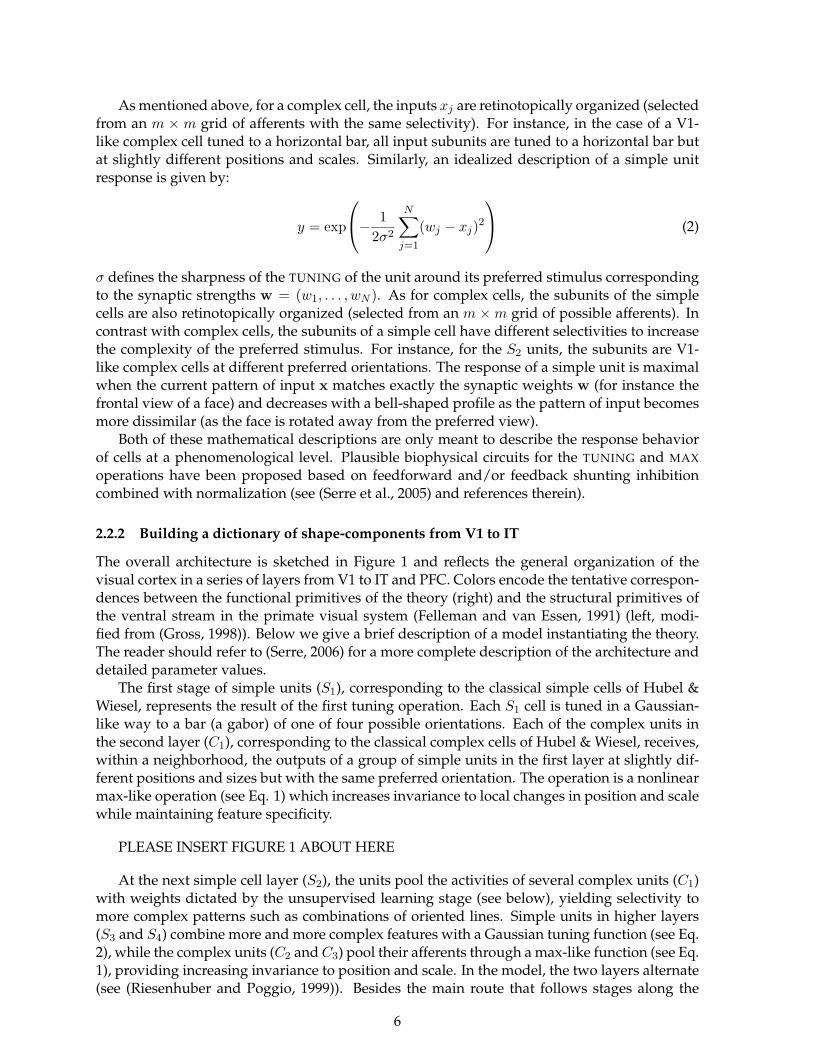
As mentioned above, for a complex cell, the inputs xj are retinotopically organized (selectedfrom an m × m grid of afferents with the same selectivity). For instance, in the case of a V1-like complex cell tuned to a horizontal bar, all input subunits are tuned to a horizontal bar butat slightly different positions and scales. Similarly, an idealized description of a simple unitresponse is given by:
y = exp
− 12σ2
N∑j=1
(wj − xj)2
(2)
σ defines the sharpness of the TUNING of the unit around its preferred stimulus correspondingto the synaptic strengths w = (w1, . . . , wN ). As for complex cells, the subunits of the simplecells are also retinotopically organized (selected from an m ×m grid of possible afferents). Incontrast with complex cells, the subunits of a simple cell have different selectivities to increasethe complexity of the preferred stimulus. For instance, for the S2 units, the subunits are V1-like complex cells at different preferred orientations. The response of a simple unit is maximalwhen the current pattern of input x matches exactly the synaptic weights w (for instance thefrontal view of a face) and decreases with a bell-shaped profile as the pattern of input becomesmore dissimilar (as the face is rotated away from the preferred view).
Both of these mathematical descriptions are only meant to describe the response behaviorof cells at a phenomenological level. Plausible biophysical circuits for the TUNING and MAX
operations have been proposed based on feedforward and/or feedback shunting inhibitioncombined with normalization (see (Serre et al., 2005) and references therein).
2.2.2 Building a dictionary of shape-components from V1 to IT
The overall architecture is sketched in Figure 1 and reflects the general organization of thevisual cortex in a series of layers from V1 to IT and PFC. Colors encode the tentative correspon-dences between the functional primitives of the theory (right) and the structural primitives ofthe ventral stream in the primate visual system (Felleman and van Essen, 1991) (left, modi-fied from (Gross, 1998)). Below we give a brief description of a model instantiating the theory.The reader should refer to (Serre, 2006) for a more complete description of the architecture anddetailed parameter values.
The first stage of simple units (S1), corresponding to the classical simple cells of Hubel &Wiesel, represents the result of the first tuning operation. Each S1 cell is tuned in a Gaussian-like way to a bar (a gabor) of one of four possible orientations. Each of the complex units inthe second layer (C1), corresponding to the classical complex cells of Hubel & Wiesel, receives,within a neighborhood, the outputs of a group of simple units in the first layer at slightly dif-ferent positions and sizes but with the same preferred orientation. The operation is a nonlinearmax-like operation (see Eq. 1) which increases invariance to local changes in position and scalewhile maintaining feature specificity.
PLEASE INSERT FIGURE 1 ABOUT HERE
At the next simple cell layer (S2), the units pool the activities of several complex units (C1)with weights dictated by the unsupervised learning stage (see below), yielding selectivity tomore complex patterns such as combinations of oriented lines. Simple units in higher layers(S3 and S4) combine more and more complex features with a Gaussian tuning function (see Eq.2), while the complex units (C2 and C3) pool their afferents through a max-like function (see Eq.1), providing increasing invariance to position and scale. In the model, the two layers alternate(see (Riesenhuber and Poggio, 1999)). Besides the main route that follows stages along the
6

hierarchy of the ventral stream step-by-step, there are several routes which bypass some of thestages, e.g., direct projections from V2 to posterior IT (bypassing V4) and from V4 to anteriorIT (bypassing posterior IT cortex). In the model, such bypass routes correspond, for instance, tothe projections from the C1 layer to the S2b and then C2b layers. Altogether the various layersin the architecture – from V1 to IT – create a large and redundant dictionary of features withdifferent degrees of selectivity and invariance.
Although the present implementation follows the hierarchy of Figure 1, the ventral stream’shierarchy may not be as strict. For instance there may be units with relatively complex recep-tive fields already in V1 (Mahon and DeValois, 2001; Victor et al., 2006). A mixture of cells withvarious levels of selectivity has also commonly been reported in V2, V4 and IT (Tanaka, 1996;Hegde and van Essen, 2006). In addition, it is likely that the same stimulus-driven learningmechanisms implemented for the S2 units and above operate also at the level of the S1 units.This may generate S1 units with TUNING not only for oriented bars but also for more complexpatterns (e.g., corners), corresponding to the combination of LGN-like, center-surround sub-units in specific geometrical arrangements. Indeed it may be advantageous for circuits in laterstages (e.g., task-specific circuits in PFC) to have access not only to the highly invariant andselective units of AIT but also to less invariant and simpler units such as those in V2 and V4.Fine orientation discrimination tasks, for instance, may require information from lower levelsof the hierarchy such as V1. There might also be high level recognition tasks that benefit fromless invariant representations.
2.2.3 Learning
Unsupervised developmental-like learning from V1 to IT: Various lines of evidence suggestthat visual experience, both during and after development, together with genetic factors, de-termine the connectivity and functional properties of cells in cortex. In this work, we assumethat learning plays a key role in determining the wiring and the synaptic weights for the modelunits. We suggest that the TUNING properties of simple units at various levels in the hierarchycorrespond to learning which combinations of features appear most frequently in images. Thisis roughly equivalent to learning a dictionary of image patterns that appear with high probabil-ity. The wiring of the S layers depends on learning correlations of features in the image whichare present at the same time (i.e., for S1 units, the bar-like arrangements of LGN inputs, for S2
units, more complex arrangements of bar-like subunits, etc).The wiring of complex cells, on the other hand, may reflect learning from visual experience
to associate frequent transformations in time, such as translation and scale, of specific complexfeatures coded by simple cells. The wiring of the C layers could reflect learning correlationsacross time: e.g., at the C1 level, learning that afferent S1 units with the same orientation andneighboring locations should be wired together because such a pattern often changes smoothlyin time (under translation) (Foldiak, 1991). Thus, learning at the S and C levels involves learn-ing correlations present in the visual world. At present it is still unclear whether these twotypes of learning require different types of synaptic learning rules or not.
In the present model we have only implemented learning at the higher level S areas (be-yond S1). Connectivity at the C level was hardwired based on physiology data. The goal ofthis learning stage is to determine the selectivity of the S units, i.e., set the weight vector w (seeEq. 2) of the units in layers S2 and higher. More precisely, the goal is to define the basic types ofunits in each of the S layers, which constitute a dictionary of shape-components that reflect thestatistics of natural images. This assumption follows the notion that the visual system, throughvisual experience and evolution, may be adapted to the statistics of its natural environment(Barlow, 1961). Details about the learning rule can be found in (Serre, 2006).
7
Supervised learning of the task-specific circuits from IT to PFC: For a given task, we assumethat a particular program or routine is set up somewhere beyond IT (possibly in PFC (Freedmanet al., 2002; Hung et al., 2005), but the exact locus may depend on the task). In a passive state (nospecific visual task is set) there may be a default routine running (perhaps the routine: what isout there?). Here we think of a particular classification routine as a particular PFC-like unit whichcombines the activity of a few hundred S4 units tuned to produce a high response to examplesof the target object and low responses to distractors. While learning in the S layers is stimulus-driven, the PFC-like classification units are trained in a supervised way. The concept of a classifierthat takes its inputs from a few broadly tuned example-based units is a learning scheme thatis closely related to Radial Basis Function (RBF) networks (Poggio and Edelman, 1990), whichare among the most powerful classifiers in terms of generalization ability. Computer simu-lations have shown the plausibility of this scheme for visual recognition and its quantitativeconsistency with many data from physiology and psychophysics (Poggio and Bizzi, 2004).
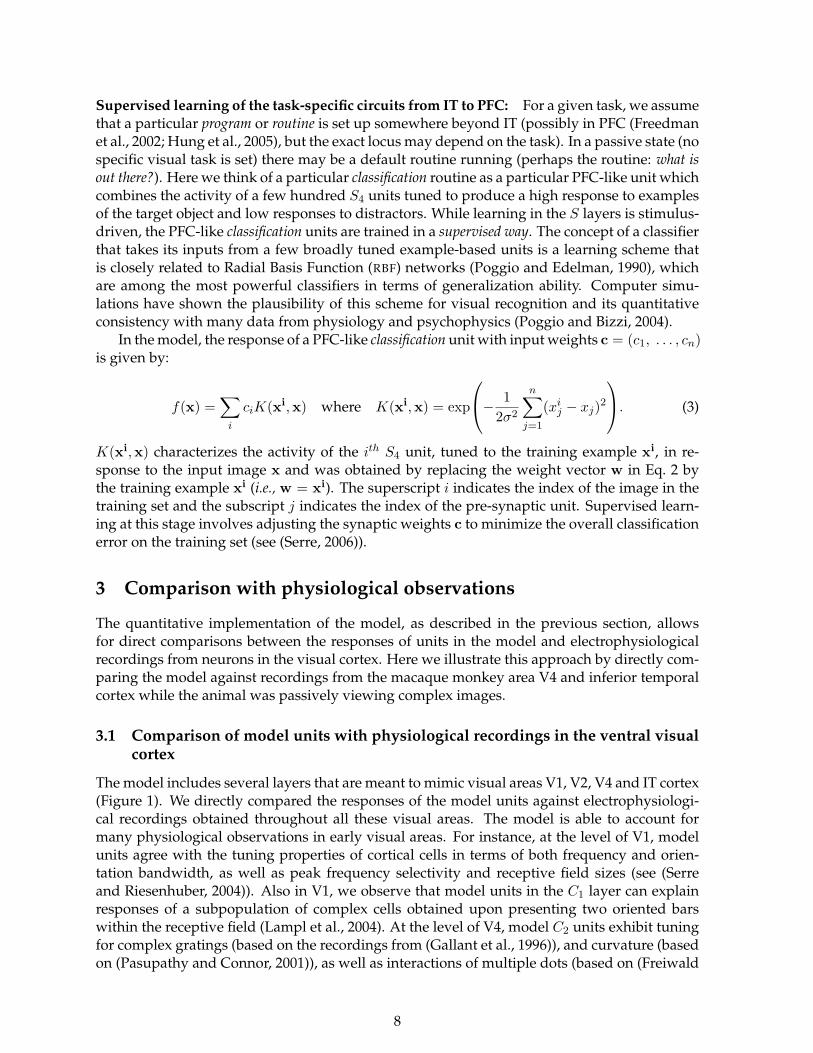
In the model, the response of a PFC-like classification unit with input weights c = (c1, . . . , cn)is given by:
f(x) =∑
i
ciK(xi,x) where K(xi,x) = exp
− 12σ2
n∑j=1
(xij − xj)2
. (3)
K(xi,x) characterizes the activity of the ith S4 unit, tuned to the training example xi, in re-sponse to the input image x and was obtained by replacing the weight vector w in Eq. 2 bythe training example xi (i.e., w = xi). The superscript i indicates the index of the image in thetraining set and the subscript j indicates the index of the pre-synaptic unit. Supervised learn-ing at this stage involves adjusting the synaptic weights c to minimize the overall classificationerror on the training set (see (Serre, 2006)).
3 Comparison with physiological observations
The quantitative implementation of the model, as described in the previous section, allowsfor direct comparisons between the responses of units in the model and electrophysiologicalrecordings from neurons in the visual cortex. Here we illustrate this approach by directly com-paring the model against recordings from the macaque monkey area V4 and inferior temporalcortex while the animal was passively viewing complex images.
3.1 Comparison of model units with physiological recordings in the ventral visualcortex
The model includes several layers that are meant to mimic visual areas V1, V2, V4 and IT cortex(Figure 1). We directly compared the responses of the model units against electrophysiologi-cal recordings obtained throughout all these visual areas. The model is able to account formany physiological observations in early visual areas. For instance, at the level of V1, modelunits agree with the tuning properties of cortical cells in terms of both frequency and orien-tation bandwidth, as well as peak frequency selectivity and receptive field sizes (see (Serreand Riesenhuber, 2004)). Also in V1, we observe that model units in the C1 layer can explainresponses of a subpopulation of complex cells obtained upon presenting two oriented barswithin the receptive field (Lampl et al., 2004). At the level of V4, model C2 units exhibit tuningfor complex gratings (based on the recordings from (Gallant et al., 1996)), and curvature (basedon (Pasupathy and Connor, 2001)), as well as interactions of multiple dots (based on (Freiwald
8

et al., 2005)) or the simultaneous presentation of two-bar stimuli (based on (Reynolds et al.,1999), see (Serre et al., 2005) for details).
PLEASE INSERT FIGURE 2 ABOUT HERE
Here we focus on one comparison between C2 units and the responses of V4 cells. Fig-ure 2 shows the side-by-side comparison between a model C2 unit and V4 cell responses to thepresentation of one-bar and two-bar stimuli. As in (Reynolds et al., 1999) model units were pre-sented with either 1) a reference stimulus alone (an oriented bar at position 1, see Figure 2A), 2)a probe stimulus alone (an oriented bar at position 2) or 3) both a reference and a probe stimulussimultaneously. We used stimuli of 16 different orientations for a total of 289 = (16 + 1)2 totalstimulus combinations for each unit (see (Serre et al., 2005) for details). Each unit’s responsewas normalized by the maximal response of the unit across all conditions. As in (Reynoldset al., 1999) we computed a selectivity index as the normalized response of the unit to the refer-ence stimulus minus the normalized response of the unit to one of the probe stimuli. This indexwas computed for each of the probe stimuli, yielding 16 selectivity values for each model unit.This selectivity index ranges from −1 to +1, with negative values indicating that the referencestimulus elicited the stronger response, a value of 0 indicating identical responses to refer-ence and probe, and positive values indicating that the probe stimulus elicited the strongestresponse. We also computed a sensory interaction index which corresponds to the normalizedresponse to a pair of stimuli (the reference and a probe) minus the normalized response to thereference alone. The selectivity index also takes on values from −1 to +1. Negative values in-dicate that the response to the pair is smaller than the response to the reference stimulus alone(i.e., adding the probe stimulus suppresses the neuronal response). A value of 0 indicates thatadding the probe stimulus has no effect on the neuron’s response while positive values indicatethat adding the probe increases the neuron’s response.
As shown in figure 2B, model C2 units and V4 cells behave very similarly to the presen-tation of two stimuli within their receptive field. Indeed the slope of the selectivity vs. sensoryinteraction indices is about 0.5 for both model units and cortical cells. That is, at the populationlevel, presenting a preferred and a non-preferred stimulus together produces a neural responsethat falls between the neural responses to the two stimuli individually, sometimes close to anaverage.1 We have found that such a “clutter effect” also happens higher up in the hierarchy atthe level of IT, see (Serre et al., 2005). Since normal vision operates with many objects appearingwithin the same receptive fields and embedded in complex textures (unlike the artificial exper-imental setups), understanding the behavior of neurons under clutter conditions is importantand warrants more experiments (see later section 3.2.4 and section 4.2).
In sum, the model can capture many aspects of the physiological responses of neurons alongthe ventral visual stream from V1 to IT cortex (see also (Serre et al., 2005)).
3.2 Decoding object information from IT and model units
We recently used a simple linear statistical classifier to quantitatively show that we could accu-rately, rapidly and robustly decode visual information about objects from the activity of smallpopulations of neurons in anterior inferior temporal cortex (Hung et al., 2005). In collabora-tion with Chou Hung and James DiCarlo at MIT, we observed that a binary response from theneurons (using small bins of 12.5 ms to count spikes) was sufficient to encode information with
1We only compare the response of the model units to V4 neurons when the monkey is attending away from thereceptive field location of the neuron. When the animal attends at the location of the receptive field the response tothe pairs is shifted towards the response to the attended stimulus.
9

high accuracy. This robust visual information, as measured by our classifiers, could in princi-ple be decoded by the targets of IT cortex such as prefrontal cortex to determine the class oridentity of an object (Miller, 2000). Importantly, the population response generalized across ob-ject positions and scales. This scale and position invariance was evident even for novel objectsthat the animal never observed before (see also (Logothetis et al., 1995)). The observation thatscale and position invariance occurs for novel objects strongly suggests that these two forms ofinvariance do not require multiple examples of each specific object. This should be contrastedwith other forms of invariance, such as robustness to depth rotation, which requires multipleviews in order to be able to generalize (Poggio and Edelman, 1990).
3.2.1 Read-out from C2b units is similar to decoding from IT neurons
We examined the responses of the model units to the same set of 77 complex object imagesseen by the monkey. These objects were divided into 8 possible categories. The model unitresponses were divided into a training set and a test set. We used a one-versus-all approach,training 8 binary classifiers, one for each category against the rest of the categories, and thentaking the classifier prediction to be the maximum among the 8 classifiers (for further details,see (Hung et al., 2005; Serre et al., 2005)). Similar observations were made when trying toidentify each individual object by training 77 binary classifiers. For comparison, we also trieddecoding object category from a random selection of model units from other layers of the model(see Figure 1). The input to the classifier consisted of the responses of randomly selected modelunits and the labels of the object categories (or object identities for the identification task). Datafrom multiple units were concatenated assuming independence.
We observed that we could accurately read out the object category and identity from modelunits. In Figure 3A, we compare the classification performance, for the categorization task de-scribed above, between the IT neurons and the C2b model units. In agreement with the experi-mental data from IT, units from the C2b stage of the model yielded a high level of performance(> 70% for 100 units; where chance was 12.5%). We observed that the physiological observa-tions were in agreement with the predictions made by the highest layers in the model (C2b, S4)but not by earlier stages (S1 through S2). As expected, the layers from S1 through S2 showed aweaker degree of scale and position invariance.
PLEASE INSERT FIGURE 3 ABOUT HERE
The classification performance of S2b units (the input to C2b units, see Figure 1) was qual-itatively close to the performance of local field potentials (LFPs) in IT cortex (Kreiman et al.,2006). The main components of LFPs are dendritic potentials and therefore LFPs are generallyconsidered to represent the dendritic input and local processing within a cortical area (Mitz-dorf, 1985; Logothetis et al., 2001). Thus, it is tempting to speculate that the S2b responses in themodel capture the type of information conveyed by LFPs in IT. However, care should be takenin this interpretation as the LFPs constitute an aggregate measure of the activity over manydifferent types of neurons and large areas. Further investigation of the nature of the LFPs andtheir relation with the spiking responses could help unravel the transformations that take placeacross cortical layers.
The pattern of errors made by the classifier indicates that some groups were easier to dis-criminate than others. This was also evident in the correlation matrix of the population re-sponses between all pairs of pictures (Serre et al., 2005; Hung et al., 2005). The units yieldedsimilar responses to stimuli that looked alike at the pixel level. The performance of the classi-fier for categorization dropped significantly upon arbitrarily defining the categories as randomgroups of pictures.
10

We also tested the ability of the model to generalize to novel stimuli not included in thetraining set. The performance values shown in Figure 3A are based on the responses of modelunits to single stimulus presentations that were not included in the classifier training and cor-respond to the results obtained using a linear classifier. Although the way in which the weightswere learned (using a support vector machine classifier) is probably very different in biology(see (Serre, 2006)), once the weights are established the linear classification boundary couldvery easily be implemented by neuronal hardware (see Eq. 3). Therefore, the recognition per-formance provides a lower bound to what a real downstream unit (e.g., in PFC) could, in theory,perform on a single trial given input consisting of a few spikes from the neurons in IT cortex.Overall, we observed that the population of C2b model units yields a read-out performancelevel that is very similar to the one observed from a population of IT neurons.
3.2.2 Extrapolation to larger object sets
One of the remarkable aspects of primate visual recognition is the large number of different ob-jects that can be identified. Although the exact limits are difficult to estimate, coarse estimatessuggest that it is possible to visually recognize on the order of 104 different concepts (Bieder-man, 1987). The physiological recordings were necessarily limited to a small set of objects dueto time constraints during a recording session. Here we show that this type of encoding canextrapolate to reading out object category in a set consisting of 787 objects divided into 20 cat-egories (the physiological observations and the model results discussed above were based on77 objects divided into 8 categories).
The population of C2b units conveyed information that could be decoded to indicate anobject’s category across novel objects. The classifier was trained with objects from 20 possiblecategories presented at different random locations and the test set included novel objects neverseen before by the classifier but belonging to the same categories. These results show that a rel-atively small neuronal population can in principle support object recognition over large objectsets. Similar results were obtained in analogous computer vision experiments using an evenlarger set known as the Caltech-101 object dataset (Serre et al., 2007b) where the model couldperform object categorization among 101 categories. Other investigators have also used mod-els that can extrapolate to large numbers of objects (Valiant, 2005) or suggested that neuronalpopulations in IT cortex can also extrapolate to many objects (Abbott et al., 1996; Hung et al.,2005).
The number of objects (or classes) that can be decoded at a given level of accuracy growsapproximately as an exponential function of the number of units. Even allowing for a strongredundancy in the number of units coding each type of feature, these results suggest that net-works of thousands of units could display a very large capacity. Of course the argument aboverelies on several assumptions that could well be wrong. However, at the very least, these obser-vations suggest that there do not seem to be any obvious capacity limitations for hierarchicalmodels to encode realistically large numbers of objects and categories.
3.2.3 Robustness in object recognition
Many biological sources of noise could affect the encoding of information. Among the mostdrastic sources of noise are synaptic failures and neuronal death. To model this, we consid-ered the performance of the classifier after randomly deleting a substantial fraction of the unitsduring testing. As shown for the experimental data in (Hung et al., 2005), the classifier perfor-mance was very robust to this source of noise.
As discussed in the introduction, one of the main achievements of visual cortex is the bal-ance of invariance and selectivity. Two particularly important forms of invariance are the ro-
11
bustness to changes in scale and position of the images. In order to analyze the degree ofinvariance to scale and position changes, we studied the responses of units at different stagesof the model to scaled (0.5× and 2×) and translated (2 degrees and 4 degrees) versions of theimages. The earlier stages of the model show a poor read-out performance under these trans-formations, but the performance of the C2b stage is quite robust to these transformations asshown in Figure 3A, in good agreement with the experimental data (Hung et al., 2005).
We also observed that the population response could extrapolate to novel objects withinthe same categories by training the classifier on the responses to 70% of the objects and testingits performance on the remaining 30% of the objects (Serre et al., 2005). This suggests anotherdimension of robustness, namely, the possibility of learning about a category from some exem-plars and then extrapolating for novel objects within the same category.
The results shown above correspond to randomly selecting a given number of units to trainand test the classifier. The brain could be wired in a very specific manner so that only neuronshighly specialized for a given task project to the neurons involved in decoding the informationfor that task. Pre-selecting the units (e.g., using those yielding the highest signal-to-noise ratio)yields similar results while using a significantly smaller number of units. Using a very specificset of neurons (instead of randomly pooling from the population and using more neurons fordecoding) may show less robustness to neuronal death and spike failures. The bias towardsusing only a specific subset of neurons could be implemented through selection mechanismsincluding attention. For example, when searching for the car keys, the weights from someneurons could be adjusted so as to increase the signal-to-noise ratio for specific tasks. This maysuggest that other concomitant recognition tasks would show weaker performance. In thiscase, the selection mechanisms take place before recognition by biasing specific populationsfor certain tasks.
3.2.4 Recognition in clutter
The decoding experiments described above as well as a large fraction of the studies reported inthe literature, involve the use of well-delimited single objects on a uniform background. Thisis quite remote from natural vision where we typically encounter multiple objects embeddedin different backgrounds, with potential occlusions, changes in illumination, etc.
Ultimately, we would like to be able to read out information from IT or from model unitsunder natural vision scenarios in which an everyday life image can be presented and we canextract from the population activity the same type and quality of information that a humanobserver can (in a flash). Here we show the degree of decoding robustness of objects thatare embedded in complex backgrounds (see also section 4 describing the performance of themodel in an animal vs. non-animal categorization task using objects embedded in complexbackgrounds).
We presented the same 77 objects used in Figure 3A overlayed on top of images containingcomplex background scenes (Figure 3B). We did not attempt to make the resulting imagesrealistic or meaningful in any way. While cognitive influences, memory and expectations playa role in object recognition, these high level effects are likely to be mediated by feedback biasingmechanisms which would indicate that a monitor is more likely to be found on an office deskthan in the jungle. However, the model described here is purely feedforward and does notinclude any of these potential biasing mechanisms. We used 4 different relative sizes of objectto background (ratio of object area to whole image area) ranging from 6 % to 69 %. The lattercondition is very similar to the single object situation analyzed above, both perceptually and interms of the performance of the classifier. The smaller relative size makes it difficult to detectthe object at least in some cases when it is not salient (see also section 4).
12

The classifier was trained on all objects using 20% of the background scenes and perfor-mance was evaluated using the same objects presented on the remaining novel backgroundscenes (we used a total of 98 complex background scenes with photographs of outdoor scenes).The population of C2b units allowed us to perform both object recognition (Figure 3B) andidentification significantly above chance in spite of the background. Performance dependedquite strongly on the relative image size (Figure 3B). The largest size (69%) yielded results thatwere very close to the single isolated object results discussed above (cf. Figure 3A). The smallrelative image size (6%) yielded comparatively lower results but the performance of C2b unitswas still significantly above chance levels both for categorization as well as identification.
Recognizing (and searching for) small objects embedded in a large complex scene, (e.g., search-ing for the keys in your house), constitutes an example of a task that may require additionalresources. These additional resources may involve serial attention which is likely to be de-pendent on feedback connections. Therefore, the model may suggest tasks and behaviors thatrequire processes that are not predominantly feedforward.
3.2.5 Reading-out from images containing multiple objects
In order to further explore the mechanisms for representing information about an object’s iden-tity and category in natural scenes, we studied the ability to read out information from themodel units upon presentation of more than one object. We presented two objects simulta-neously in each image (Figure 3C). During testing, the classifier was presented with imagescontaining multiple objects. We asked two types of questions: (i) what is the most likely objectin the image? and (ii) what are all the objects present in the image?
Training was initially performed with single objects. Interestingly, we could also train theclassifier using images containing multiple objects. In this case, for each image, the label wasthe identity (or category) of one of the objects (randomly chosen so that the overall training sethad the same number of examples for each of the objects or object categories). This is arguablya more natural situation in which we learn about objects since we rarely see isolated objects.However, it is possible that attentional biases to some extent “isolate” an object (e.g., whenlearning about an object with an instructor that points to it).
In order to determine the most likely object present in the image (question 1, above), theclassifier’s prediction was considered to be a hit if it correctly predicted either one of the twoobjects presented during testing. The population of C2b model units yielded very high perfor-mance reaching more than 90% both for categorization and identification with the single objecttraining and reaching more than 80% with the multiple object training. Given that in each trialthere are basically two possibilities to get a hit, the chance levels are higher than the ones re-ported in Figure 3A. However, it is clear that the performance of the C2b population responseis significantly above chance indicating that accurate object information can be read-out evenin the presence of another object. We also extended these observations to 3 objects and to 10objects (Serre et al., 2005), obtaining qualitatively similar conclusions.
Ultimately, we would like to be able to understand an image in its entirety, including adescription of all of its objects. Therefore, we asked a more difficult question by requiring theclassifier to correctly predict all the objects (or all the object categories) present in the image.During perception human observers generally assume that they can recognize and describeevery object in an image during a glimpse. However, multiple psychophysics studies suggestthat this is probably wrong. Perhaps one of the most striking demonstrations of this fallacyis the fact that sometimes we can be oblivious to large changes in the images (see for example(Simons and Rensink, 2005)). What is the capacity of the representation at-a-glance? There is noconsensus answer to this question but some psychophysical studies suggest that only a handful
13

of objects can be described in a brief glimpse of an image (on the order of 5 objects). After thisfirst glance, eye movements and/or attentional shifts may be required to further describe animage. We continue here referring to this rapid vision scenario and we strive to explain ourperceptual capabilities during the glance using the model. Thus, the goal is to be able to fullydescribe a set of about 5 objects that can be simultaneously presented in multiple backgroundsin a natural scenario.
For this purpose, we addressed our second question by taking the two most likely objects(or object categories) given by the two best classifier predictions (here the number of objectswas hard-wired). A hit from the classifier output was defined as a perfect match betweenthese predictions and the two objects present in the image. This task is much more difficult(compared to the task where the goal is to categorize or identify any of the objects in the image).The performance of the classifier was also much smaller than the one reported for the single-object predictions. However, performance was significantly above chance, reaching almost 40%for categorization (chance = 0.0357) and almost 8% for identification (chance = 3.4× 10⁻⁴).
Similar results were obtained upon reading out the category or identity of all objects presentin the image in the case of 3-object and 10-object images. Briefly, even in images containing 10objects, it is possible to reliably identify one arbitrary object significantly above chance fromthe model units. However, the model performance in trying to describe all objects in the imagedrops drastically with multiple objects to very low levels for 4-5 objects.
In summary, these observations suggest that it is possible to recognize objects from theactivity of small populations of IT-like model units under natural situations involving complexbackgrounds and several objects. The observations also suggest that, in order to fully describean image containing many objects, eye movements, feedback or other additional mechanismsmay be required.
4 Performance on natural images
For a theory of visual cortex to be successful, it should not only mimic the response propertiesof neurons and the behavioral response of the system to artificial stimuli like the ones typicallyused in physiology and psychophysics, but should also be able to perform complex categoriza-tion tasks in a real-world setting.
4.1 Comparison between the model and computer vision systems
We extensively tested the model on standard computer vision databases for comparison withseveral state-of-the-art AI systems (see (Serre, 2006; Serre et al., 2007b) for details). Such real-world image datasets tend to be much more challenging than the typical ones used in a neuro-science lab. They usually involve different object categories and the systems that are evaluatedhave to cope with large variations in shape, contrast, clutter, pose, illumination, size, etc. Giventhe many specific biological constraints that the theory had to satisfy (e.g., using only biophys-ically plausible operations, receptive field sizes, range of invariances, etc) it was not clear howwell the model implementation described in section 2 would perform in comparison to systemsthat have been heuristically engineered for these complex tasks.
Surprisingly we found that the model is capable of recognizing complex images (see (Serreet al., 2007b)). For instance, the model performs at a level comparable to some of the bestexisting systems on the CalTech-101 image database of 101 object categories (Fei-Fei et al., 2004)with a recognition rate of about 55% (chance level < 1%, see (Serre et al., 2007b) and also
14

the extension by (Mutch and Lowe, 2006)).2 Additionally, Bileschi & Wolf have developedan automated real-world Street Scene recognition system (Serre et al., 2007b) based in parton the model described in section 2. The system is able to recognize seven different objectcategories (cars, bikes, pedestrians, skies, roads, buildings, and trees) from natural images ofstreet scenes despite very large variations in shape (e.g., trees in summer and winter, SUVs aswell as compact cars under any view point).
4.2 Comparison between the model and human observers
Finally, we tested whether the level of performance achieved by the model was sufficient toaccount for the level of performance of human observers. To test this hypothesis, in the sameway as an experimental test of Newton’s second law requires choosing a situation in which fric-tion is negligible, we looked for an experimental paradigm in which recognition has to be fastand cortical back-projections are likely to be inactive. Ultra-rapid object categorization (Thorpeet al., 1996) likely depends only on feedforward processing (Thorpe et al., 1996; Thorpe andFabre-Thorpe, 2001; Keysers et al., 2001; Li et al., 2002; VanRullen and Koch, 2003) and thussatisfies our criterion. Here we used a backward masking paradigm (Bacon-Mace et al., 2005)in addition to the rapid stimulus presentation to try to efficiently block recurrent processingand cortical feedback loops (Enns and Lollo, 2000; Lamme and Roelfsema, 2000; Breitmeyerand Ogmen, 2006).
Human observers can discriminate a scene that contains a particular prominent object, suchas an animal or a vehicle, after only 20 ms of exposure. Evoked response potential componentsrelated to either low-level features of the image categories (e.g., animal or vehicles) or to theimage status (animal present or absent) are available at 80 and 150 ms respectively. Theseexperimental results establish a lower bound on the latency of visual categorization decisionsmade by the human visual system, and suggest that categorical decisions can be implementedwithin a feedforward mechanism of information processing (Thorpe et al., 1996; Thorpe andFabre-Thorpe, 2001; Keysers et al., 2001; Li et al., 2002; VanRullen and Koch, 2003).
4.2.1 Predicting human performance during a rapid categorization task
In collaboration with Aude Oliva at MIT, we tested human observers on a rapid animal vs. non-animal categorization task (see (Serre et al., 2007a) for details). The choice of the animal cat-egory was motivated by the fact that 1) it was used in the original paradigm by Thorpe andcolleagues (Thorpe et al., 1996) and 2) animal photos constitute a rich class of stimuli exhibitinglarge variations in texture, shape, size, providing a difficult test for a computer vision system.
We used an image dataset that was collected by Antonio Torralba and Aude Oliva and con-sisted of a balanced set of 600 animal and 600 non-animal images (see (Torralba and Oliva,2003)). The 600 animal images were selected from a commercially available database (CorelPhotodisc) and grouped into four categories, each category corresponding to a different viewing-distance from the camera: heads (close-ups), close-body (animal body occupying the whole im-age), medium-body (animal in scene context) and far-body (small animal or groups of animals inlarger context). One example from each group is shown in Figure 4.
To make the task harder and prevent subjects from relying on low-level cues such as image-depth, the six hundred distractor images were carefully selected to match each of the fourviewing-distances. Distractor images were of two types (three hundred of each): artificial ornatural scenes (see (Serre et al., 2007a) for details).
2These benchmark evaluations relied on an earlier partial implementation of the model which only included thebypass route from S1 → C2b.
15

During the experiment, images were briefly flashed for 20 ms, followed by an inter-stimulusinterval (i.e., a blank screen) of 30 ms, followed by a mask (80 ms, 1/f noise). This is usuallyconsidered a long stimulus onset asynchrony (SOA = 50 ms) for which human observers areclose to ceiling performance (Bacon-Mace et al., 2005). On the other hand, based on latencies invisual cortex, such an SOA should minimize the possibility of feedback and top-down effectsin the task: we estimated from physiological data (see (Serre et al., 2007a)) that feedback signalsfrom say, V4 to V1 or IT/PFC to V4, should not occur earlier than 40 − 60 ms after stimulusonset. Human observers (nh = 24) were asked to respond as fast as they could to the presenceor absence of an animal in the image by pressing either of two keys.
Before we could evaluate the performance of the model, the task-specific circuits from ITto PFC (see section 2) had to be trained. These task-specific circuits correspond to a simplelinear classifier that reads out the activity of a population of high-level model units analogousto recordings from anterior IT cortex (see section 3). The training for these task-specific circuitswas done by using (nm = 20) random splits of the 1,200 stimuli into a training set of 600 imagesand a test set of 600 images. For each split, we learned the synaptic weights of the task-specificcircuits of the model by minimizing the error on the training set (see (Serre et al., 2007a)) andevaluated the model performance on the test set. The reported performance corresponds to theaverage performance from the random runs.
The performance of the model and of human observers was very similar (see Figure 4).As for the model, human observers performed best on “close-body” views and worst on “far-body” views. An intermediate level of performance was obtained for “head” and “medium-far” views. Overall no significant difference was found between the level of performance ofthe model and human subjects. Interestingly, the observed dependency between the level ofperformance and the amount of clutter in the images (which increases from the close-body tothe far-body condition) for both human observers and the model seems consistent with theread-out experiment from IT neurons (for both the model and human observers) as describedin section 3.
Importantly, lower stages of the model (C1 units) alone could not account for the results(see (Serre et al., 2007a)). Additionally, performing the equivalent of the lesioning of V4 inthe model, (i.e., leaving the bypass routes (C2b units as the only source of inputs to the finalclassifier, see Figure 1) also resulted in a significant loss in performance (this was true evenafter retraining the task-specific circuits thus accounting for a “recovery” period). This lesionexperiment suggests that the large dictionary of shape-tuned units in the model (from V1 toIT) with different levels of complexity and invariance learned from natural images is key inexplaining the level of performance.
PLEASE INSERT FIGURE 4 ABOUT HERE
Beyond comparing levels of performance, we also performed an image-by-image compar-ison between the model and human observers. For this comparison, we defined an index of“animalness” for each individual image. For the model, this index was computed by calcu-lating the percentage of times each image was classified as an animal (irrespective of its truelabel) for each random run (nm = 20) during which it was presented as a test image. For hu-man observers we computed the number of times each individual image was classified as ananimal by each observer (nh = 24). This index measures the confidence of either the model(nm = 20) or human observers (nh = 24) in the presence of an animal in the image. A per-centage of 100% (correspondingly 0%) indicates a very high level of confidence in the presence(absence) of an animal. The level of correlation for the animalness index between the modeland human observers was 0.71, 0.84, 0.71 and 0.60 for heads, close-body, medium-body and
16

far-body respectively (p < 0.01 for testing the hypothesis of no correlation against the alterna-tive that there is a non-zero correlation). This suggests that the model and human observerstend to produce consistent responses on individual images.
Additionally, to further challenge the model, we looked at the effect of image orientation(90◦ and 180◦ in-the-plane rotation): Rousselet et al. previously suggested that the level of per-formance of human observers during a rapid categorization task tends to be robust to imagerotation (Rousselet et al., 2003). We found that the model and human observers exhibited asimilar degree of robustness (see (Serre et al., 2007a)). Interestingly, the good performance ofthe model on rotated images was obtained without the need for retraining the model. Thissuggests that according to the dictionary of shape-tuned units from V1 to IT in the model (andpresumably in visual cortex), an image of a rotated animal is more similar to an image of anupright animal than to distractors. In other words, a small image patch of a rotated animal ismore similar to a patch of an upright animal than to a patch of image from a distractor.
4.2.2 Discussion: Feedforward vs. feedback processing
As discussed earlier, an important assumption for the experiment described above is that withan SOA of 50 ms, the mask leaves sufficient time to process the signal and estimate firing ratesat each stage of the hierarchy (i.e., 20-50 ms, see (Tovee et al., 1993; Rolls et al., 1999; Thorpe andFabre-Thorpe, 2001; Keysers et al., 2001; Hung et al., 2005)) yet selectively blocks top-downsignals (e.g., from IT or PFC to V4 that we estimated to be around 40-60 ms), see (Serre et al.,2007a) for a complete discussion. The prediction is thus that the feedforward system should: 1)outperform human observers for very short SOAs (i.e., under 50 ms when there is not enoughtime to reliably perform local computations or estimate firing rates within visual areas), 2)mimic the level of performance of human observers for SOAs around 50 ms such that there isenough time to reliably estimate firing rates within visual areas but not enough time for back-projections from top-down to become active and 3) underperform human observers for longSOAs (beyond 60 ms) such that feedbacks are active.
We thus tested the influence of the mask onset time on visual processing with four experi-mental conditions, i.e., when the mask followed the target image a) without any delay (with anSOA of 20 ms), b) with an SOA of 50 ms (corresponding to an inter-stimulus interval of 30 ms),c) with an SOA of 80 ms or d) never (“no-mask” condition). For all four conditions, the targetpresentation was fixed to 20 ms as before. As expected, the delay between the stimulus and themask onset modulates the level of performance of the observers, improving gradually from the20 ms SOA condition to the no-mask condition. The performance of the model was superiorto the performance of human observers for the SOA of 20 ms. The model closely mimickedthe level of performance of human observers for the 50 ms condition (see Figure 4). The im-plication would be that, under these conditions, the present feedforward version of the modelalready provides a satisfactory description of information processing in the ventral stream ofvisual cortex. Human observers however outperformed the model for the 80 ms SOA and theno-mask condition.
5 Discussion
5.1 General remarks about the theory
We have developed a quantitative model of the feedforward pathway of the ventral stream invisual cortex – from cortical area V1 to V2 to V4 to IT and PFC – that captures its ability to learnvisual tasks, such as identification and categorization of objects from images. The quantitative
17

nature of the model has allowed us to directly compare its performance against experimentalobservations at different scales and also against current computer vision algorithms. In thispaper we have focused our discussion on how the model can explain experimental resultsfrom visual object recognition within short times at two very different levels of analysis: humanpsychophysics and physiological recordings in IT cortex. The model certainly does not accountfor all possible aspects of visual perception or illusions (see also extensions, predictions andfuture directions below). However, the success of the model in explaining experimental dataacross multiple scales and making quantitative predictions strongly suggests that the theoryprovides an important framework for the investigation of the feedforward path in visual cortexand the processes involved in immediate recognition.
An important component of a theory is that it should be falsifiable. In that spirit, we listsome key experiments and findings here that could refute the present framework. First, astrong dissociation between experimental observations and model predictions would suggestthat revisions need to be made to the model (e.g., psychophysical or physiological observationsthat cannot be explained or contradict predictions made by the model). Second, as stated inthe introduction, the present framework relies entirely on a feedforward architecture from V1to IT and PFC. Any evidence that feedback plays a key role during the early stages of immediaterecognition should be considered as hard evidence suggesting that important revisions wouldneed to be made in the main architecture of the model (Figure 1).
5.2 A wish-list of experiments
Here we discuss some predictions from the theory and an accompanying “wish list” of experi-ments that could be done to test, refute or validate those predictions. We try to focus on whatwe naively think are feasible experiments.
1. The distinction between simple and complex cells has been made only in primary visualcortex. Our theory and parsimony considerations suggest that a similar circuit is repeatedthroughout visual cortex. Therefore, unbiased recordings from neurons in higher visualareas may reveal the existence of two classes of neurons which could be distinguished bytheir degree of invariance to image transformations.
2. As the examples discussed in this manuscript illustrate, our theory can make quantitativepredictions about the limits of immediate recognition at the behavioral level (section 4)and also at the neuronal level (section 3). The biggest challenges to recognition includeconditions in which the objects are small relative to the whole image and the presenceof multiple objects, background, or clutter. It would be interesting to compare thesepredictions to behavioral and physiological measurements. This could be achieved byadding extra conditions in the psychophysical experiment of section 4 and by extendingthe read-out experiments from section 3 to natural images and more complex recognitionscenarios.
3. The theory suggests that immediate recognition may rely on a large dictionary of shape-components (i.e., common image-features) with different levels of complexity and invari-ance. This fits well with the concept of “unbound features”(Treisman and Gelade, 1980;Wolfe and Bennett, 1997) postulated by cognitive theories of pre-attentive vision. Im-portantly, the theory does not rely on any figure-ground segregation. This suggests that,at least for immediate recognition, recognition can work without an intermediate seg-mentation step. Furthermore, it also suggests that it is not necessary to define objects asfundamental units in visual recognition.
18

4. There is no specific computational role for a functional topography of units in the model.Thus, the strong degree of topography present throughout cortex, may arise from devel-opmental reasons and physical constraints (a given axon may be more likely to target twoadjacent neurons than two neurons that are far away; also, there may be a strong pres-sure to minimize wiring) as opposed to having a specific role in object recognition or thecomputations made in cortex.
5. The response of a given simple unit in the model can be described by Eq. 2. Thus, thereare multiple different inputs that could activate a particular unit. This may explain thesomewhat puzzling observations of why physiologists often find neurons that seem torespond to apparently dissimilar objects. Following this reasoning, it should be possibleto generate an iso-response stimulus set, i.e., a series of stimuli that should elicit similarresponses in a given unit even when the stimuli apparently look different or the shape ofthe iso-response stimulus set appear non-intuitive.
6. It is tempting to anthropomorphize the responses of units and neurons. This has beencarried as far as to speak of a neuron’s ”preferences”. The current theory suggests thatan input that gives rise to a high response from a neuron is at the same time simplerand more complex than this anthropomorphized account. It is simpler because it can berigorously approximated by specific simple equations that control its output. It is morecomplex because these weight vectors and equations are not easily mapped to wordssuch as “face neuron”, “curvature”, etc., and taken with the previous point, that visuallydissimilar stimuli can give rise to similar responses, the attribution of a descriptive wordmay not be unique.
7. There are many tasks that may not require back-projections. The performance of themodel may provide a reliable signature of whether a task can be accomplished duringimmediate recognition in the absence of feedback (e.g., the model performs well for im-mediate recognition of single objects on uncluttered backgrounds, but fails for attention-demanding tasks (Li et al., 2002)). As stated above, one of the main assumptions of thecurrent model is the feedforward architecture. This suggests that the model may notperform well in situations that require multiple fixations, eye movements and feedbackmechanisms. Recent psychophysical work suggests that performance on dual tasks canprovide a diagnostic tool for characterizing tasks that do or do not involve attention (Liet al., 2002). Can the model perform these dual tasks when psychophysics suggests thatattention is or is not required? Are back-projections and feedback required?
In addition to the predictions listed above, we recently discussed other experiments andpredictions which are based on a more detailed discussion of the biophysical circuits imple-menting the main operations in the model (see (Serre et al., 2005)).
5.3 Future directions
We end this article by reflecting on several of the open questions, unexplained phenomena andmissing components of the theory. Before we begin, we should note that visual recognitionencompasses much more than what has been attempted and achieved with the current theory.A simple example may illustrate this point. In the animal categorization task discussed in theprevious sections, humans make mistakes upon being pressed to respond promptly. Given 10seconds and no mask, performance would be basically 100%. As stated several times, the goalhere is to provide a framework to quantitatively think about the initial steps in vision, but it isclear that much remains to be understood beyond immediate recognition.
19

5.3.1 Open questions
How strict is the hierarchy and how precisely does it map into cells of different visual areas?For instance, are cells corresponding to S2 units in V2 and C2 units in V4 or are some cellscorresponding to S2 units already in V1? The theory is rather open about these possibilities: themapping of Figure 1 is just an educated guess. However, because of the increasing arborizationof cells and the number of boutons from V1 to PFC (Elston, 2003), the number of subunits to thecells should increase and thus their potential size and complexity. In addition, C units shouldshow more invariance from the bottom to the top of the hierarchy.
What is the nature of the cortical and subcortical connections (both feedforward and feed-back) to and from the main areas of the ventral visual stream that are involved in the model?A more thorough characterization at the anatomical level of the circuits in visual cortex wouldlead to a more realistic architecture of the model by better constraining some of the parameterssuch as the size of the dictionary of shape-components or the number of inputs to units in dif-ferent layers. This would also help refine and extend the existing literature on the organizationof visual cortex (Felleman and van Essen, 1991). With the recent development of higher res-olution tracers (e.g., PHA-L, biocytin, DBA), visualization has greatly improved and it is nowpossible to go beyond a general layout of interconnected structures and start addressing thefiner organization of connections.
What are the precise biophysical mechanisms for the learning rule described in section 2 andhow can invariances be learned within the same framework? Possible synaptic mechanismsfor learning should be described in biophysical detail. As suggested earlier, synaptic learningrules should allow for three types of learning: 1) the TUNING of the units at the S level bydetecting correlations among subunits at the same time, 2) the invariance to position and scaleat the C level by detecting correlations among subunits across time, and 3) the training of task-specific circuits (probably from IT to PFC) in a supervised fashion.
Is learning in areas below IT purely unsupervised and developmental-like as assumed inthe theory? Or is there task- and/or object-specific learning in adults occurring below IT inV4, V2 or even V1?
Have we reached the limit of what feedforward architectures can achieve in terms of per-formance? In other words, is the somewhat better performance of humans on the animalvs. non-animal categorization task (see section 4.2) over the model for SOAs longer than 80 msdue to feedback effects mediated by back-projections or can the model be improved to attainhuman performance in the absence of a mask? There could be several directions to follow inorder to try to improve the model performance. One possibility would involve experimentingwith the size of the dictionary of shape-components (that could be further reduced with fea-ture selection techniques for instance). Another possibility would involve adding intermediatelayers to the existing ones.
Are feedback loops always desirable? Is the performance on a specific task guaranteed toalways increase when subjects are given more time? Or are there tasks for which blocking theeffect of back-projections with rapid masked visual presentation increases the level of perfor-mance compared to longer presentation times?
20

5.3.2 Future extensions
Learning the tuning of the S1 units. In the present implementation of the model the tuning ofthe simple cells in V1 is hardwired. It is likely that it could be determined through the same pas-sive learning mechanisms postulated for the S2, S2b and S3 units (in V4 and PIT respectively),possibly with a slower time scale and constrained to LGN center-surround subunits. We wouldexpect the automatic learning from natural images mostly of oriented receptive fields but alsoof more complex ones, including end-stopping units (as reported for instance in (DeAngeliset al., 1992) in layer 6 of V1).
Dynamics of neuronal responses The current implementation is completely static, for a givenstatic image the model produces a single response in each unit. This clearly does not account forthe intricate dynamics present in the brain and also precludes us from asking several questionsabout the encoding of visual information, learning, the relative timing across areas, etc. Perhapsthe easiest way to solve this is by using simple single neuron models (such as an integrate-and-fire neuron) for the units in the model. This question is clearly related to the biophysics of thecircuitry, i.e., what type of biological architectures and mechanisms can give rise to the globaloperations used by the model. A dynamical model would allow us to more realistically com-pare to experimental data. For example, the experiments described in section 4 compare theresults in a categorization task between the model and human subjects. In the human psy-chophysics, the stimuli were masked briefly after stimulus presentation. A dynamical modelwould allow us to investigate the role and mechanisms responsible for masking. A dynamicalmodel may also allow investigation of time-dependent phenomena as well as learning basedon correlations across time.
Extensions of the model to other visual inputs There are many aspects of vision that arenot currently implemented in the model. These include color, stereo, motion and time-varyingstimuli. Initial work has been done to extend the model to the visual recognition of action andmotions (Giese and Poggio, 2003; Sigala et al., 2005). It is likely that the same units support-ing recognition of static images (the S4, view-tuned units in the model) show time sequenceselectivity.
Color mechanisms from V1 to IT should be included. The present implementation onlydeals with gray level images (it has been shown that the addition of color information in rapidcategorization tasks only leads to a mild increase in performance (Delorme et al., 2000). Morecomplex phenomena involving color such as color constancy and the influence of the back-ground and integration in color perception should ultimately be explained.
Stereo mechanisms from V1 to IT should also be included. Stereo and especially motionplay an important role in the learning of invariances such as position and size invariance via acorrelation-based rule such as the trace rule (Foldiak, 1991).
Extensions of the anatomy of the model Even staying within the feedforward skeleton out-lined here, there are many connections that are known to exist in the brain which are not ac-counted for in the current model. The goal of the model is to extract the basic principles used inrecognition and not to copy, neuron by neuron, the entire brain. However, certain connectivitypatterns may have important computational consequences. For example, there are horizontalconnections in cortex that may be important in modulating and integrating information acrossareas beyond the receptive field.
21

Beyond a feedforward model It has been known for many decades now that there are abun-dant back-projections in the brain. In the visual system, every area projects back to its inputarea (with the exception of the lateral geniculate nucleus in the thalamus which does not projectback to the retina). Some of these connections (e.g., from V2 to V1), may play a role even duringimmediate recognition. However, a central assumption of the current model is that long-rangebackprojections (e.g., from area IT to V1) do not play a role during the first 100 to 150 ms ofvision. Given enough time, humans make eye movements to scan an image and performancein many object recognition tasks can increase significantly over that obtained during fast pre-sentation.
Visual illusions A variety of visual illusions show striking effects that are often counterintu-itive and require an explanation in terms of the neuronal circuits. While in some cases specificmodels have been proposed to explain one phenomenon or another, it would be interesting toexplore how well the model (and thus feedforward vision) can account for those observations.A few simple examples include illusory contours (such as the Kanizsa triangle), long-rangeintegration effects (such as the Cornsweet illusion), etc. More generally, it is likely that earlyGestalt-like mechanisms – for detecting collinearity, symmetry, parallelism, etc – exist in V1or V2 or V4. They are not present in this version of the model. It is an open and interestingquestion how they could be added to it in a plausible way.
Acknowledgements
We would like to acknowledge Chou Hung and James DiCarlo for their contributions in thephysiology experiments described in section 3. We would like to acknowledge Aude Oliva forher contribution to the psychophysics experiments described in section 4. We thank TimotheeMasquellier for useful comments on this manuscript. This research was sponsored by grantsfrom: Office of Naval Research (DARPA) under contract No. N00014-00-1-0907, McGovernfellowship (GK), National Science Foundation (ITR) under contract No. IIS-0085836, NationalScience Foundation (KDI) under contract No. DMS-9872936, and National Science Foundationunder contract No. IIS-9800032
References
L.F. Abbott, E.T. Rolls, and M.T. Tovee. Representational capacity of face coding in monkeys.Cereb. Cortex, 6:498–505, 1996.
Y. Amit and M. Mascaro. An integrated network for invariant visual detection and recognition.Vis. Res., 43(19):2073–2088, 2003.
N. Bacon-Mace, M.J. Mace, M. Fabre-Thorpe, and S.J. Thorpe. The time course of visual pro-cessing: Backward masking and natural scene categorisation. Vis. Res., 45:1459–1469, 2005.
H.B. Barlow. Possible principles underlying the transformation of sensory messages. In W.A.Rosenblith, editor, Sensory Communication, pages 217–234. MIT Press, Cambridge, MA, 1961.
I. Biederman. Recognition-by-components: A theory of human image understanding.Psych. Rev., 94:115–147, 1987.
M.C. Booth and E. T. Rolls. View-invariant representations of familiar objects by neurons in theinferior temporal visual cortex. Cereb. Cortex, 8:510–523, 1998.
22
B. Breitmeyer and H. Ogmen. Visual Masking: Time Slices through Conscious and UnconsciousVision. Oxford University Press, 2006.
G.C. DeAngelis, J.G. Robson, I. Ohzawa, and R.D. Freeman. Organization of suppression inreceptive fields of neurons in cat visual cortex. J. Neurophysiol., 68(1):144–163, July 1992.
A. Delorme, G. Richard, and M. Fabre-Thorpe. Ultra-rapid categorisation of natural imagesdoes not rely on colour: A study in monkeys and humans. Vis. Res., 40:2187–2200, 2000.
R. Desimone, T. D. Albright, C. G. Gross, and C. Bruce. Stimulus-selective properties of inferiortemporal neurons in the macaque. J. Neurosci., 4(8):2051–2062, August 1984.
G.N. Elston. Comparative studies of pyramidal neurons in visual cortex of monkeys. In J.H.Kaas and C. Collins, editors, The primate visual system, pages 365–385. CRC Press, Boca Raton,FL, 2003.
J.T. Enns and V. Di Lollo. What’s new in masking? Trends in Cogn. Sci., 4(9):345–351, 2000.
L. Fei-Fei, R. Fergus, and P. Perona. Learning generative visual models from few trainingexamples: An incremental bayesian approach tested on 101 object categories. In Proc. IEEECVPR, Workshop on Generative-Model Based Vision, 2004.
D.J. Felleman and D.C. van Essen. Distributed hierarchical processing in the primate cerebralcortex. Cereb. Cortex, 1:1–47, 1991.
P. Foldiak. Learning invariance from transformation sequences. Neural Comp., 3:194–200, 1991.
D.J. Freedman, M. Riesenhuber, T. Poggio, and E.K. Miller. Visual categorization and the pri-mate prefrontal cortex: Neurophysiology and behavior. J. Neurophysiol., 88:930–942, 2002.
W.A. Freiwald, D.Y. Tsao, R.B.H. Tootell, and M.S. Livingstone. Complex and dynamic recep-tive field structure in macaque cortical area V4d. J. Vision, 4(8):184a, 2005.
K. Fukushima. Neocognitron: A self-organizing neural network model for a mechanism ofpattern recognition unaffected by shift in position. Biol. Cyb., 36:193–202, 1980.
J.L. Gallant, C.E. Connor, S. Rakshit, J.W. Lewis, and D.C. Van Essen. Neural responses topolar, hyperbolic, and cartesian gratings in area V4 of the macaque monkey. J. Neurophysiol.,76:2718–2739, 1996.
T.J. Gawne and J.M. Martin. Responses of primate visual cortical V4 neurons to simultaneouslypresented stimuli. J. Neurophysiol., 88:1128–1135, 2002.
M. Giese and T. Poggio. Neural mechanisms for the recognition of biological movements andaction. Nat. Rev. Neurosci., 4:179–192, 2003.
C.G. Gross. Brain Vision and Memory: Tales in the History of Neuroscience. MIT Press, 1998.
C.G. Gross, C. E. Rocha-Miranda, and D. B. Bender. Visual properties of neurons in inferotem-poral cortex of the macaque. J. Neurophysiol., 35:96–111, 1972.
J. Hegde and D. C. van Essen. A comparative study of shape representation in macaque visualareas V2 and V4. Cereb. Cortex, 2006.
23

J. K. Hietanen, D. I. Perrett, M. W. Oram, P. J. Benson, and W. H. Dittrich. The effects of lightingconditions on responses of cells selective for face views in the macaque temporal cortex.Exp. Brain Res., 89:157–171, 1992.
D.H. Hubel and T.N. Wiesel. Receptive fields, binocular interaction and functional architecturein the cat’s visual cortex. J. Physiol., 160:106–154, 1962.
C. Hung, G. Kreiman, T. Poggio, and J. DiCarlo. Fast read-out of object identity from macaqueinferior temporal cortex. Science, 310:863–866, November 2005.
C. Keysers, D. K. Xiao, P. Foldiak, and D. I. Perrett. The speed of sight. J. Cogn. Neurosci., 13:90–101, 2001.
E. Kobatake and K. Tanaka. Neuronal selectivities to complex object features in the ventralvisual pathway of the macaque cerebral cortex. J. Neurophysiol., 71:856–867, 1994.
G. Kreiman, C. Hung, T. Poggio, and J. DiCarlo. Object selectivity of local field potentials andspikes in the inferior temporal cortex of macaque monkeys. Neuron, 49:433–445, 2006.
V.A.F. Lamme and P.R. Roelfsema. The disctinct modes of vision offered by feedforward andrecurrent processing. Trends in Neurosci., 23:571–579, 2000.
I. Lampl, D. Ferster, T. Poggio, and M. Riesenhuber. Intracellular measurements of spatialintegration and the MAX operation in complex cells of the cat primary visual cortex. J. Neu-rophysiol., 92:2704–2713, 2004.
Y. LeCun, L. Bottou, Y. Bengio, and P. Haffner. Gradient-based learning applied to documentrecognition. Proc. of the IEEE, 86(11):2278–2324, November 1998.
F.F. Li, R. VanRullen, C. Koch, and P. Perona. Rapid natural scene categorization in the nearabsence of attention. Proc. Nat. Acad. Sci. USA, 99:9596–9601, 2002.
N.K. Logothetis and D.L. Sheinberg. Visual object recognition. Ann. Rev. Neurosci., 19:577–621,1996.
N.K. Logothetis, J. Pauls, and T. Poggio. Shape representation in the inferior temporal cortexof monkeys. Curr. Biol., 5:552–563, 1995.
N.K. Logothetis, J. Pauls, M. Augath, T. Trinath, and A. Oeltermann. Neurophysiological in-vestigation of the basis of the fMRI signal. Nature, 412:150–157, 2001.
L.E. Mahon and R.L. DeValois. Cartesian and non-cartesian responses in LGN, V1, and V2 cells.Vis. Neurosci., 18:973–981, 2001.
B.W. Mel. SEEMORE: Combining color, shape, and texture histogramming in a neurally in-spired approach to visual object recognition. Neural Comp., 9:777–804, 1997.
E.K. Miller. The prefrontal cortex and cognitive control. Nat. Rev. Neurosci., 1:59–65, 2000.
U. Mitzdorf. Current source-density method and application in cat cerebral cortex: Investiga-tion of evoked potentials and EEG phenomena. Physiol. Rev., 65:37–99, 1985.
J. Mutch and D. Lowe. Multiclass object recognition with sparse, localized features. In Proc.IEEE Conf. on Comput. Vision and Pattern Recognit., 2006.
24

H. Nakamura, R. Gattass, R. Desimone, and L.G. Ungerleider. The modular organization ofprojections from areas V1 and V2 to areas V4 and TEO in macaques. J. Neurosci., 13(9):3681–3691, 1993.
B.A. Olshausen, C.H. Anderson, and D.C. Van Essen. A neurobiological model of visual atten-tion and invariant pattern recognition based on dynamic routing of information. J. Neurosci.,13(11):4700–19, 1993.
A. Pasupathy and C.E Connor. Shape representation in area V4: Position-specific tuning forboundary conformation. J. Neurophysiol., 86(5):2505–2519, 2001.
D.I. Perrett and M. Oram. Neurophysiology of shape processing. Img. Vis. Comput., 11:317–333,1993.
D.I. Perrett, J.K. Hietanen, M.W. Oram, and P.J. Benson. Organization and functions of cellsresponsive to faces in the temporal cortex. Philos. Trans. Roy. Soc. B, 335:23–30, 1992.
T. Poggio and E. Bizzi. Generalization in vision and motor control. Nature, 431:768–774, 2004.
T. Poggio and S. Edelman. A network that learns to recognize 3D objects. Nature, 343:263–266,1990.
M.C. Potter. Meaning in visual search. Science, 187:565–566, 1975.
J. H. Reynolds, L. Chelazzi, and R. Desimone. Competitive mechanisms subserve attention inmacaque areas V2 and V4. J. Neurosci., 19:1736–1753, 1999.
M. Riesenhuber and T. Poggio. Hierarchical models of object recognition in cortex. Nat. Neu-rosci., 2:1019–1025, 1999.
E.T. Rolls, M.J. Tovee, and S. Panzeri. The neurophysiology of backward visual masking: In-formation analysis. J. Comp. Neurol., 11:300–311, 1999.
G.A. Rousselet, M.J. Mace, and M. Fabre-Thorpe. Is it an animal? Is it a human face? Fastprocessing in upright and inverted natural scenes. J. Vision, 3:440–455, 2003.
T. Sato. Interactions of visual stimuli in the receptive fields of inferior temporal neurons inawake macaques. Exp. Brain Res., 74(2):263–271, 1989.
E.L. Schwartz, R. Desimone, T.D. Albright, and C.G. Gross. Shape recognition and inferiortemporal neurons. Proc. Nat. Acad. Sci. USA, 80(18):5776–8, September 1983.
T. Serre. Learning a dictionary of shape-components in visual cortex: Comparison with neurons, hu-mans and machines. PhD thesis, Massachusetts Institute of Technology, Cambridge, MA, April2006.
T. Serre and M. Riesenhuber. Realistic modeling of simple and complex cell tuning in theHMAX model, and implications for invariant object recognition in cortex. AI Memo 2004-017 / CBCL Memo 239, MIT, Cambridge, MA, 2004.
T. Serre, M. Kouh., C. Cadieu, U. Knoblich, G. Kreiman, and T. Poggio. A theory of object recog-nition: computations and circuits in the feedforward path of the ventral stream in primatevisual cortex. AI Memo 2005-036 / CBCL Memo 259, MIT, Cambridge, MA, 2005.
T. Serre, A. Oliva, and T. Poggio. A feedforward architecture accounts for rapid categorization.Proceedings of the National Academy of Science, 2007a. in press.
25

T. Serre, L. Wolf, S. Bileschi, M. Riesenhuber, and T. Poggio. Robust object recognition withcortex-like mechanisms. IEEE Trans. on Pattern Analysis and Machine Intelligence, 29(3):411–426, 2007b.
R. Sigala, T. Serre, T. Poggio, and M. Giese. Learning features of intermediate complexity forthe recognition of biological motion. In Proc. of the Intern. Conf. Artif. Neural Ntw., 2005.
D.J. Simons and R.A. Rensink. Change blindness: past, present and future. Trends in Cogn. Sci.,9(1):16–20, 2005.
K. Tanaka. Inferotemporal cortex and object vision. Ann. Rev. Neurosci., 19:109–139, 1996.
S.J. Thorpe. Ultra-rapid scene categorisation with a wave of spikes. In Proc. of BiologicallyMotivated Computer Vision, 2002.
S.J. Thorpe and M. Fabre-Thorpe. Seeking categories in the brain. Science, 291:260–263, 2001.
S.J. Thorpe, D. Fize, and C. Marlot. Speed of processing in the human visual system. Nature,381:520–522, 1996.
A. Torralba and A. Oliva. Statistics of natural image categories. Network: Computat. Neural Syst.,14:391–412, 2003.
M.J. Tovee, E.T. Rolls, A. Treves, and R.P. Bellis. Information encoding and the response ofsingle neurons in the primate temporal visual cortex. J. Neurophysiol., 1993.
A. M. Treisman and G. Gelade. A feature-integration theory of attention. Cog. Psych., 12:97–136,1980.
S. Ullman, M. Vidal-Naquet, and E. Sali. Visual features of intermdediate complexity and theiruse in classification. Nat. Neurosci., 5(7):682–687, 2002.
L.G. Ungerleider and J.V. Haxby. ’What’ and ’where’ in the human brain. Curr. Op. Neurobiol.,4:157–165, 1994.
L.G. Valiant. Memorization and association on a realistic neural model. Neural Comp., 17:527–555, 2005.
R. VanRullen and C. Koch. Visual selective behavior can be triggered by a feed-forward process.J. Comp. Neurol., 15:209–217, 2003.
J.D. Victor, F. Mechler, M.A. Repucci, K.P. Purpura, and T. Sharpee. Responses of V1 neuronsto two-dimensional hermite functions. J. Neurophysiol., 95:379–400, 2006.
G. Wallis and E.T. Rolls. A model of invariant object recognition in the visual system. Prog.Neurobiol., 51:167–194, 1997.
H. Wersing and E. Koerner. Learning optimized features for hierarchical models of invariantrecognition. Neural Comp., 15(7):1559–1588, 2003.
J.M. Wolfe and S.C. Bennett. Preattentive object files: Shapeless bundles of basic features.Vis. Res., 37:25–44, 1997.
26

6 Figure Captions
Figure 1. Tentative mapping between structural primitives of the ventral stream in the pri-mate visual system (Felleman and van Essen, 1991) (left) and functional primitives of the theory.The model, which is feedforward (apart from local recurrent circuits), attempts to describe theinitial stage of visual processing, immediate recognition, corresponding to the output of the top ofthe hierarchy and to the first 150 milliseconds in visual recognition. Colors encode the tentativecorrespondences between model layers and brain areas. Stages of simple cells with Gaussian-like TUNING (plain circles and arrows), which provide generalization (Poggio and Bizzi, 2004),are interleaved with layers of complex units (dotted circles and arrows), which perform a MAX-like operation on their inputs and provide invariance to position and scale (pooling over scalesis not shown in the figure). Both operations may be performed by the same local recurrent cir-cuits of lateral inhibition (see text). It is important to point out that the hierarchy is probably notas strict as depicted here. In addition there may be cells with relatively complex receptive fieldsalready in V1. The main route from the feedforward ventral pathway is denoted with black ar-rows while the bypass route (Nakamura et al., 1993) is denoted with green arrows. Learning inthe simple unit layers from V2/V4 up to IT (including the S4 view-tuned units) is assumed tobe stimulus-driven. It only depends on task-independent visual experience-dependent tuningof the units. Supervised learning occurs at the level of the circuits in PFC (two sets of possiblecircuits for two of the many different recognition tasks – identification and categorization – areindicated in the figure at the level of PFC). Modified from (Serre et al., 2007a), Figure 1.
Figure 2. A quantitative comparison between model C2 units and V4 cells. A) Stimulus con-figuration (modified from Figure 1A in (Reynolds et al., 1999)): The stimulus in position 1 isdenoted as the reference and the stimulus in position 2 as the probe. As in (Reynolds et al., 1999)we computed a selectivity index (which indicates how selective a cell is to an isolated stimulusin position 1 vs. position 2 alone) and a sensory interaction index (which indicates how selec-tive the cell is to the paired stimuli vs. the reference stimulus alone), see text and (Serre et al.,2005) for details. B) Side-by-side comparison between V4 neurons (left, adapted from Fig. 5 in(Reynolds et al., 1999)) while the monkey attends away from the receptive field location and C2
units (right). Consistent with the physiology, the addition of a second stimulus in the receptivefield of the C2 unit moves the response of the unit toward that of the second stimulus alone,i.e., the response to the clutter condition lies between the responses to the individual stimuli.
Figure 3. A). Classification performance based on the spiking activity from IT neurons (black)and C2b units from the model (gray). The performance shown here is based on the categoriza-tion task where the classifier was trained based on the category of the object. A linear classifierwas trained using the responses to the 77 objects at a single scale and position (shown for oneobject by “TRAIN”). The classifier performance was evaluated using shifted or scaled versionsof the same 77 objects (shown for one object by “TEST”). During training, the classifier wasnever presented with the unit responses to the shifted or scaled objects. The left-most columnshows the performance for training and testing on separate repetitions of the objects at the samestandard position and scale (this is shown only for the IT neurons because there is no variabil-ity in the model which is deterministic). The second bar shows the performance after trainingon the standard position and scale (3.4 degrees, center of gaze) and testing on the shifted andscaled images. The dashed horizontal line indicates chance performance (12.5%, 1 out of 8possible categories). Error bars show standard deviatons over 20 random choices of the unitsused for training/testing. B). Classification performance for reading out object category as afunction of the relative size (area ratio) of object to background. Here the classifier was trained
27

using the responses of 256 units to the objects presented in cluttered backgrounds. The classifierperformance was evaluated using the same objects embedded in different backgrounds. Thehorizontal dashed line indicates chance performance obtained by randomly shuffling the ob-ject labels during training.C). Classification performance for reading out object category in thepresence of two objects. We exhaustively studied all possible pairs using the same 77 objects asin part A (see two examples on the upper left part of the figure). The classifier was trained withimages containing two objects and the label corresponded to the category of one of them. Dur-ing testing, the classifier’s prediction was considered to be a hit if it correctly categorized eitherof the objects present in the image. The dashed line indicates change performance obtained byrandomly assigning object labels during training.
Figure 4. Comparison between the model and human observers. Images showed either ananimal embedded in a natural background or a natural scene without any animals. Imageswere flashed for 20 ms followed by a 30 ms blank and a 80 ms mask. Human observers or themodel were queried to respond indicating whether an animal was present or not. The figureshows the accuracy as d′ (the higher the value of the d′, the better the performance), for themodel (red) and humans (blue) across 1, 200 animal and non-animal stimuli. The model is ableto predict the level of performance of human observers (overall 82% for the model vs. 80%for human observers). For both the model and human observers the level of performance ishighest on the close-body condition and drops gradually as the amount of clutter increases inthe image from close-body to medium-body and far-body. Modified from (Serre et al., 2007a),Figure 3A.
28

Categ. Ident.
S4
C1
S1
S2
S3
C3
S2b
C2b
C2
TG
AIT
35336
Complex cells
TUNING
Simple cells
MAX
Main routes
Bypass routes
PG
Co
rte
x
Ro
stra
l ST
SP
refr
on
tal
Co
rte
x
STP
FR
ON
TAL-
"WO
RK
ING
ME
MO
RY
"
DP VIP LIP 7a PP FST
PO V3A MT
TPO PGa IPa
V3
V4
PIT
LIP,
VIP
,DP,
7a
V2
,V3
,V4
,MT,
MS
T
TE
O,T
E
TE
,36
,35
MSTc
46 8 45 1211
13
TEa TEm
V2
V1
MSTp TF
classification
units

1
2
receptive field
fixation point
-1 0 1-1
0
1
Selectivity
Slope: 0.55
Model
Selectivity
Sens
ory
Inte
ract
ions
A) B)

TRAIN
TEST
3.4o
centerSize:
Position:3.4o
center1.7o
center6.8o
center3.4o
2o horz.3.4o
4o horz.
0
0.2
0.4
0.6
0.8
1C
lass
ifica
tion
perf
orm
ance
IT ModelA)
0.06 0.14 0.40 0.690
0.2
0.4
0.6
0.8
1
Area Ratio
Cla
ssifi
catio
n Pe
rfor
man
ce
B)B)
1 4 16 64 2560
0.2
0.4
0.6
0.8
1
Number of units
Cla
ssifi
catio
n pe
rfor
man
ce
C)C)

Head Close
-body
Far-
bod
Medium
-body
1.4
2.6
2.4
1.8
Perf
orm
ance
(d')
Model
Human