a quantitative analysis of trends in agricultural and food
TRANSCRIPT

A quantitative analysis of trends in agricultural and food global value chains
(GVCs)Background paper for
The State of Agricultural Commodity Markets (SOCO) 2020

A quantitative analysis of trends in agricultural and food global value chains (GVCs)
Background paper forThe State of Agricultural Commodity
Markets (SOCO) 2020
Rob DellinkSenior Expert
Food and Agriculture Organization of the United Nations
Edona Dervisholli Economist
Food and Agriculture Organization of the United Nations
Silvia NenciProfessor of Economics
Rome Tre University
Food and Agriculture Organization of the United NationsRome, 2020

Required citation:Dellink, R., Dervisholli, E. & Nenci, S. 2020. A quantitative analysis of trends in agricultural and food global value chains (GVCs). Background paper for The State of Agricultural Commodity Markets (SOCO) 2020. Rome, FAO. https://doi.org/10.4060/cb0729en
The designations employed and the presentation of material in this information product do not imply the expression of any opinion whatsoever on the part of the Food and Agriculture Organization of the United Nations (FAO) concerning the legal or development status of any country, territory, city or area or of its authorities, or concerning the delimitation of its frontiers or boundaries. The mention of specific companies or products of manufacturers, whether or not these have been patented, does not imply that these have been endorsed or recommended by FAO in preference to others of a similar nature that are not mentioned.
The views expressed in this information product are those of the author(s) and do not necessarily reflect the views or policies of FAO.
ISBN 978-92-5-133211-5© FAO, 2020
Some rights reserved. This work is made available under the Creative Commons Attribution-NonCommercial-ShareAlike 3.0 IGO licence (CC BY-NC-SA 3.0 IGO; https://creativecommons.org/licenses/by-nc-sa/3.0/igo/legalcode).
Under the terms of this licence, this work may be copied, redistributed and adapted for non-commercial purposes, provided that the work is appropriately cited. In any use of this work, there should be no suggestion that FAO endorses any specific organization, products or services. The use of the FAO logo is not permitted. If the work is adapted, then it must be licensed under the same or equivalent Creative Commons licence. If a translation of this work is created, it must include the following disclaimer along with the required citation: “This translation was not created by the Food and Agriculture Organization of the United Nations (FAO). FAO is not responsible for the content or accuracy of this translation. The original [Language] edition shall be the authoritative edition.”
Disputes arising under the licence that cannot be settled amicably will be resolved by mediation and arbitration as described in Article 8 of the licence except as otherwise provided herein. The applicable mediation rules will be the mediation rules of the World Intellectual Property Organization http://www.wipo.int/amc/en/mediation/rules and any arbitration will be conducted in accordance with the Arbitration Rules of the United Nations Commission on International Trade Law (UNCITRAL).
Third-party materials. Users wishing to reuse material from this work that is attributed to a third party, such as tables, figures or images, are responsible for determining whether permission is needed for that reuse and for obtaining permission from the copyright holder. The risk of claims resulting from infringement of any third-party-owned component in the work rests solely with the user.
Sales, rights and licensing. FAO information products are available on the FAO website (www.fao.org/publications) and can be purchased through [email protected]. Requests for commercial use should be submitted via: www.fao.org/contact-us/licence-request. Queries regarding rights and licensing should be submitted to: [email protected].
Cover photograph:©Istock/simongurney
| iii |
Abstract
Over the last decade, an increasing international fragmentation of production has affected both trade and production: these activities have become increasingly organized around what is commonly referred to as global value chains (GVCs). Increased fragmentation has brought with it challenges of tracing and measuring international divisions of labour, value added and so forth. In fact, conventional measures of trade only measure the gross value of exchanges between partners. They are not able to reveal how foreign producers, upstream in the value chain, are connected to final consumers at the end of the value chain.
The aim of this paper is to use a globally consistent set of country-level data on GVC participation and positioning in the agri-food sectors to distil global and regional trends in GVC participation between 1995 and 2015. It also focuses in on five selected countries – Brazil, Germany, Ghana, Nepal and Viet Nam – to illustrate how country-specific characteristics affect GVC participation trends as well as identify major differences across countries.
This is the first time such a detailed trend analysis has been carried out for the agricultural and food sectors, with near-universal regional coverage, and covering two decades. The authors suggest that the inter-temporal and cross-country trends identified in this paper can contribute to derive insights into development pathways for low- and middle-income countries, as well as identify how key characteristics of countries will affect the way it uses international trade to boost domestic agricultural productivity growth.


| v |
Contents
Abstract �������������������������������������������������������������������������������������������������������������������������������������������������������������������iii
1 Introduction ���������������������������������������������������������������������������������������������������������������������������������������������������������� 3
2 Measuring GVCs ��������������������������������������������������������������������������������������������������������������������������������������������������� 7
3 Trends in GVC participation ���������������������������������������������������������������������������������������������������������������������������������� 15
4 Selected country case studies ������������������������������������������������������������������������������������������������������������������������������� 27
5 Trends in GVC positioning ������������������������������������������������������������������������������������������������������������������������������������ 37
References �������������������������������������������������������������������������������������������������������������������������������������������������������������� 43
Annex I Details on the methodology ������������������������������������������������������������������������������������������������������������������������� 48
AnnexII Details on the EORA database ��������������������������������������������������������������������������������������������������������������������� 50

| vi |
FiguresFigure 1
Figure 2
Figure 3
Figure 4
Figure 5
Figure 6
Figure 7
Figure 8
Figure 9
Figure 10
Figure 11
Figure 12
Figure 13
Figure 14
Figure 15
Figure 16
Figure 17
Figure 18
Figure 19
Figure I�1 Borin and Mancini refinement of the Koopman et al. (2014) breakdown of aggregate exports ............................................................................................ 48
BoxesBox 1
Box 2
Box 3
Measuring trade in value added ...........................................................................................7
Stylized example of GVC participation ...................................................................................8
Example: From cocoa beans to chocolate ...............................................................................8
Evolution of global GVC participation rates ...........................................................................15
Composition of gross exports..............................................................................................17
Origin of foreign value added in 2015 at global level ............................................................18
GVC participation rates in 2015 by income group and continent. ............................................18
Export intensities and GVC participation rates in 2015 ...........................................................20
Backward and forward GVC linkages in 2015 by income group .............................................20
Population and GVC participation rates in 2015 ....................................................................21
Growth in income and growth in GVC participation levels between 1995 and 2015 by income group and continent ..........................................................................................22
Growth in exports and change in GVC participation rates .......................................................23
Growth rates of backward and forward GVC linkages between 1995 and 2015 .......................24
Global GVC Participation ..................................................................................................27
GVC Participation in Germany ...........................................................................................28
GVC Participation in Brazil ................................................................................................29
GVC Participation in Ghana ..............................................................................................31
GVC Participation in Viet Nam ...........................................................................................32
GVC Participation in Nepal ...............................................................................................33
GVC Positioning at global level ..........................................................................................37
GVC positioning in 2015 at regional level ...........................................................................38
GVC positioning in at country level ...................................................................................... .39

CHAPTER 1
INTRODUCTION


| 3 |
1 Introduction
The increasing international fragmentation of production that has occurred over the last decades has affected both trade and production: these activities have become increasingly organized around what is commonly referred to as global value chains (GVC). GVCs can be defined as the full range of activities – dispersed across different countries – that firms and workers engage in to bring a product from its conception to its end use (see Gereffi and Fernandez-Stark, 2016).1
The diffusion of GVCs has challenged the conventional wisdom on how we look at and interpret trade. Conventional measures of trade only measure the gross value of exchanges between partners. They are not able to reveal how foreign producers, upstream in the value chain, are connected to final consumers at the end of the value chain and are no longer a precise measure of how final demand in importing countries activates the exporters’ production (WTO, 2019).
Furthermore, when production is organized in sequential processing stages in different countries, intermediate goods and services cross borders several times along the chain, often passing through many countries more than once. This process leads to a significant amount of “double counting” in global trade. Consequently, the country of the final producer appears to capture most of the value of goods and services traded, whereas the role of countries providing inputs upstream is overlooked.
A GVC can therefore be studied and measured by tracing the value added along these production chains (Cattaneo et al., 2013; OECD and WTO, 2012).2 New relevant questions can also be answered by applying the value added approach such as assessing the level of country and sector participation and the country's position in the international sharing of production.
The aim of this paper is to use a globally consistent set of country-level data on GVC participation and positioning in the agri-food sectors to distil some major trends over time, as well as identify major differences across countries. This is the first time such a detailed trend analysis has been carried out for the agricultural and food sectors, with near-universal regional coverage, and covering two decades. The inter-temporal and cross-country trends identified in this paper can contribute to derive insights into development pathways for low- and middle-income countries, as well as identify how key characteristics of countries will affect the way it uses international trade to boost domestic agricultural productivity growth.
This paper is arranged as follows: Section 2 introduces the key terminology and explains the methodology used for the analysis; it also provides a brief summary of some of the main existing literature. Section 3 presents the main results: global and regional trends in GVC participation between 1995 and 2015. Section 4 dives deeper into the trends for five selected countries to illustrate how country-specific characteristics affect GVC participation trends. Finally, Section 5 looks at the global and regional trends for GVC positioning.
1 The first two sections of the report partially draw on Nenci (2020).2 Value added reflects the value of primary production factors such as capital, labour and land that is used by industries in producing goods and services. It is equivalent to the difference
between industry output and the sum of its intermediate inputs.


CHAPTER 2
Measuring GVCs


2 Measuring GVCs
Key terminologyA global value chain (GVC) refers to the series of stages of production of a commodity or service (the value chain) that encompass at least two international borders (Hummels, Ishii and Yi, 2001).
Trade in value added data can be used to measure how a country or a sector is involved in a GVC. Identifying the origin of the value added embedded in trade flows highlights that both domestic and foreign value added are combined to produce goods and services that are exported and which may be later embodied in other products or consumed as final goods and services. If imported inputs are embedded in exports, these inputs cross borders twice and thus are double-counted in the usual measurement of international trade (gross exports and gross imports). By splitting gross exports into domestic value added (the value of exports that was created by domestic production factors), foreign value added (the value of exports that were imported as inputs) and double-counted trade flows (that arise when intermediate commodities cross borders multiple times), Koopman, Wang and Wei (2014) provide a framework for consistently analysing the contribution of countries and sectors to international trade more precisely.
Vertical specialization reflects the “increasing interconnectedness of production processes in a vertical trading chain that stretches across many countries” (Hummels, Ishii and Yi, 2001). It is measured as the share of value of imported inputs in total exports, or more technically, foreign value added in exports over the sum of foreign and domestic value added in exports. Vertical specialization is equivalent to backward linkages in GVCs and represents the degree to which countries rely on imported inputs in their production of exported commodities. For example, farmers that produce wheat for the international market may import fertilizers to boost productivity.
Forward linkages in GVCs reflect the extent to which exported commodities are used later in the value chain to be further exported to a third country (or, less commonly, to be re-exported back to the home country). Forward linkages are measured as the value of intermediate exports sent indirectly through third countries to final destinations. A sector in a country that has many forward value chain linkages is said to be upstream, while a sector in a country with mostly backward linkages can be labelled as downstream.
GVC participation is then calculated as the sum of backward and forward linkages. All three measures are usually expressed as a rate by dividing by the value of gross exports (see section 2.3 for a detailed explanation).
Box 1 Measuring trade in value added
Calculating the value added parts of gross exports and imports does not only help with the measurement of global value chains, it also brings better insight in the welfare (or more precisely income and employment) effects of international trade: the foreign value added and double-counted parts of gross exports (and imports) inflate total trade flows, while they do not directly contribute to domestic economic growth (OECD and WTO, 2012). Measurement of trade flows in value added terms also aligns it with the national accounts and gross domestic product (GDP), which is also measured through value added rather than through gross output.
| 7 |

| 8 |
A quantitative analysis of trends in agricultural and food global value chains (GVCs)
Examples of agri-food GVCs
3 Note that in the example, some final consumption takes place in country B. This is labelled returned value added. It is not a major focus in this report, as these values tend to be very small in the agricultural and food sectors.
Box 3 Example: From cocoa beans to chocolate
Chocolate is a widely consumed product due to its exquisite flavour. Africa is the leading cocoa-producing region, representing 73 percent of global production. As of 2016, 60 percent of the global output was provided by the two leading producing countries, Cote d’Ivoire and Ghana, thus making cocoa supply highly concentrated in a limited amount of countries (Voora, Bermúdez and Larrea, 2019). Cocoa beans are unique due to the diversification of the end products. Once it’s harvested, cocoa offers many products through production and processing, including cocoa shells, mulch, cocoa pulps, and others. Similar to other industries, creating chocolate products involves a chain of production that has many links.
The illustration above displays the various stages of the value chain that the cocoa beans go through to create chocolate. Cote d’Ivoire farmers provide cocoa beans, which then are exported to the Netherlands. Companies in Germany import the cocoa beans from Cote d’Ivoire through the Netherlands and focus on manufacturing and processing cocoa beans, where the dairy and sugar supply chain is embedded in the process of making chocolate. Once the chocolate is made in Germany it is distributed. The chocolate is partly consumed domestically and partly exported to other countries, such as France.
In this chocolate GVC, the value of exports to France is made up of value-added from Cote d’Ivoire, the Netherlands, and Germany. For Cote d’Ivoire, the cocoa beans exports reflect domestic value-added. For the Netherlands, that imports cocoa beans, exports reflect domestic value added. For Germany, that imports the cocoa beans as an input, it reflects foreign value-added. At the same time, the processing industry in Germany adds value to this input by further processing it – this reflects domestic value-added for Germany. In this value chain, the forward linkages of GVC participation of the agriculture sector in Cote d’Ivoire are represented in the example by the exports of the processing industry in Germany to France. Germany has backward
linkages (imports of cocoa beans from the Netherlands), and forward linkages (exports of chocolate to France). The total GVC participation level of the food and beverages sector in Germany is the sum of the foreign value-added from Cote d’Ivoire and the Netherlands (backward linkages), plus the value-added generated in Germany that flows through to France (forward linkages).
Box 2 Stylized example of GVC participation
Resource
Country A
Value Added
Country A
Input
Country A
Value Added
Country B
Production
Country B
Value Added
Country C
Processing
Country C
Value Added
Country D
Distribution
Country D
Consumption
Country D
Consumption
Country B
As more than two countries are involved in global value chains, and vertically specialized as the parts of the production process of the final commodity are fragmented, with each part interconnected. When the producer in country B exports the agricultural commodity, the gross value of the exports by country B comprises (i) domestic value added generated in country B, plus (ii) the value of the resource, which is double-counted as its value was already reported as an export from country A to country B, and (iii) foreign value added from the input sourced in country A – this latter part is the backward linkage of the GVC participation of the agricultural sector in country B. The forward linkages of GVC participation of the agricultural sector in country B are represented in the example by the fact that the processing industry in country C, that imports the agricultural commodity from country B, itself exports to country D, after adding further value added. The producer in country B has thus provided foreign value added to the exports of the processing industry in country C. Total GVC participation of country B is then the sum of the foreign value added from country A, plus the value added generated in country B that flows through country C to country D.3
| 9 |
2. Measuring GVCs
Data and methodology The recent availability of new input-output data combined with bilateral trade statistics allows to allocate the value added embedded in trade flows to the countries and sectors of origin and destination and thus to decompose gross exports into various components. Specifically, multiregional input-output tables (MRIOs) provide a comprehensive map of international transactions of goods and services in a large dataset that combines the national input-output tables of various countries at a given point of time. Since the tables contain information on supply–use relations between industries and across countries, the vertical structure of international production sharing is identified and cross-border value flows for a country or region are measured (World Bank, 2017). Hence, these MRIO tables can be used in combination with long-established accounting relationships (Leontief, 1936) to pin down the links between the country-sector where the value of production originates and the market where it is absorbed in final demand (Borin and Mancini, 2019). Theoretically, the value-added generation process of every product in every country at every stage of production is tracked.
The analysis in this report uses the EORA MRIO tables (Lenzen et al., 2013). The benefit of EORA is that it has a higher country and time coverage than other sources.4 The EORA database provides a set of both national and global input-output tables, covering almost all countries in the world and a harmonized set of sectors for complete time series from 1990 to 2015.5 The EORA tables are particularly useful since they provide access to each country’s structure, function and information on the interactions between trading partners. Hence, the world trading system can be viewed consistently with all trade flows reconciled in economic terms.6
In order to get a comprehensive picture of a country (or sector) involvement in GVCs through the use of trade in value added data, this report uses the indicators calculated by Nenci (2020). Following the detailed methodology of Borin and Mancini (2019), Nenci (2020) uses the EORA MRIO tables to calculate some value added components of gross exports – namely domestic value added (DVA) and foreign value added (FVA) – and a measure of overall GVC participation (see Annex I for details).7
The domestic value added (DVA) is the value added exported in final or intermediate goods. This is part of the domestic content – the part of gross exports that originated in the country. The foreign value added (FVA) is the value added contained in intermediate inputs imported from abroad, exported in the form of final or intermediate goods. This is part of the foreign content – the part of gross exports that originated abroad.
The GVC participation index is given by the sum of a ‘backward’ component (the value of imported intermediate inputs in exports), and a ‘forward’ component (the value of intermediate exports sent indirectly through third countries to final destinations). Combining the two components, one can have a comprehensive assessment of the participation of a country in GVCs, both as a user of foreign inputs and supplier of intermediates used in other countries’ exports. The larger
4 Other common datasets based on MRIO tables include the TiVA database by OECD–WTO, the World Input-Output Database (WIOD) and the Global Trade Analysis Project (GTAP).5 EORA is available in several formats. In the version used here, “EORA26”, economic activities have been aggregated to a common 26-sector classification, according to the International
Standard Industrial Classification of Economic Activities (ISIC Rev.3), that is consistent across all countries covered. 6 Unfortunately, this comes at a (certain) cost of data reliability given the method by which the input-output tables have been constructed for countries where no official supply-use tables
are available. Consequently, some data errors are possible, mainly due to balancing issues. Specifically, as underlined by the data provider, the current EORA tables have been constructed with an emphasis on fulfilling balancing conditions for large countries, but less for small countries (see https://worldmrio.com/documentation/faq.jsp).
7 Borin and Mancini (2019) provide exhaustive and rigorous value-added decompositions of exports at the aggregate, bilateral and sectoral levels that are consistent with the framework developed by Koopman et al. (2014) and overcome some key shortcomings that affect the decomposition in the original framework and other previous attempts to obtain a bilateral counterpart.

| 10 |
A quantitative analysis of trends in agricultural and food global value chains (GVCs)
the indicator, the higher the intensity of involvement of a particular country (or sector) in GVCs.
To measure the positioning of a particular country (or sector) in GVCs, two indicators of GVC positioning are very popular in the literature: a measure of distance or upstreamness of a production sector from final demand (Fally, 2012; Antras et al., 2012; and Antras and Chor, 2018) and a measure of the distance or downstreamness of a given sector from the economy's primary factors of production (Fally, 2012). The upstreamness index measures how many stages of production are left before the goods or services produced by this industry reach final consumers (in this sense, it also indicates the “length” of GVCs). It takes as a point of reference the sources of final demand at the end of each production chain, and computes the upstreamness of the country-industry relative to final use. Larger values are associated with relatively higher levels of upstreamness of the output originating from one sector. The downstreamness index captures the downstreamness of each country-industry from where production processes commence, namely from sources of value-added to primary factors. It measures the distance of a given sector from the economy's primary factors of production (or sources of value-added). Hence, also this index provides an indication on the “length” of GVCs. Larger values are associated with relatively higher levels of downstreamness of an industry.
Nenci (2020) reports formal definitions and computation of GVC participation and positioning measures for the countries included in the EORA dataset. For mathematical definitions of the indicators used here and a more elaborate literature review, see Borin and Mancini (2019).
The dataset used in the calculations below comprises 181 countries for the period 1995–2015. The focus is on agriculture (ISIC codes 1, 2) and the food and beverages (ISIC codes 15, 16) sectors. Details of the sectoral specification are given in Annex II.
Existing literatureInternational trade has economic benefits as it increases global efficiency through the exploitation of comparative advantage. There is emerging evidence that global value chains are even more beneficial for income growth and productivity than traditional trade (Ignatenko, Raei and Mircheva, 2019). Constantinescu, Mattoo and Ruta (2019) find significant increases in labour productivity from GVC participation, especially backward linkages.
Participation in GVCs may enable greater competitiveness, better inclusion in trade and investment flows, and access to new types of production, upgrading towards higher value-added activities and socio-economic upgrading (FAO, 2016). Consequently, these can lead to increased employment, better-paying jobs, better-use of resources, and better governance. But the literature also highlights that the benefits of GVC participation are not automatic and that there is a large degree of heterogeneity.
GVC participation is not restricted to manufacturing, but also relevant for the agri-food sectors. Greenville, Kawasaki and Beaujeu (2017) highlight significant differences in GVC participation for specific subsectors depending on the nature of the commodities. Commodities with shorter value chains, such as perishables, ceteris paribus have lower GVC participation rates; high GVC participation rates can be expected for commodities where product standards are more important, that is, mostly high-value commodities. In some cases, these counteract each other, such as with fruits and vegetables. Balié et al. (2019a) show that developing countries, and point in case sub-Saharan African countries, are also actively participating in agricultural and food GVCs. GVCs allow even countries with limited resources or human capital to participate in, and benefit from, the global market as it is easier to penetrate an international market when

| 11 |
2. Measuring GVCs
production slices are thinner and more specialized.
The common wisdom is that the emergence of GVCs can represent a golden opportunity for supporting the ongoing transformations of developing countries, especially in agriculture and food markets, which could move from a subsistence-oriented and farm-centred system to a more commercialized, productive and off-farm centred one (for example, Balié et al., 2019b). Furthermore, a significant share of the growth in value added in agriculture (or any other sector) comes from its linkages to other economic sectors. Thus, increased GVC participation in the sectors that demand agricultural inputs may boost agricultural GVC participation and agricultural value added generation.
Despite the spreading of strategies for “joining the GVCs”, positive impacts on the domestic economy should not be taken for granted. Several empirical studies have observed significant effects only for middle- and high-income countries and insignificant results for developing countries. Among others, Fagerberg, Lundvall and Srholec (2018) find that minimal economic benefits have been observed for small or less developed countries that are characterized by low capabilities and low absorptive capacity.
Targeting specific “sophisticated” products or production stages is often the preferred strategy for “moving up the value chain” (Kowalski et al., 2015). This has been interpreted to imply that it may be beneficial to move away from the more upstream parts of the chain and has been used to justify policy objectives that seek to increase the domestic value added share. Indeed, this interpretation is in contrast with the principle of comparative advantage showing that the most profitable segments of the value chain should be jointly determined by the characteristics of the production process as well as the relative skills and resource endowments of firms and countries in question. In other words, what is important, from the point of view of the firm, is the value that is created from its economic activities and not the share that the firm occupies in the value of the final product.
Focusing on agriculture and food sectors, a series of OECD papers (Greenville et al., 2019; Greenville, Kawasaki and Jouanjean, 2019) highlight the presence of two possible value adding pathways related to trade and GVC engagement. The first is a processing pathway, where domestic value addition to agriculture and links to trade and GVCs occur through downstream processing sectors. The second is a primary pathway where domestic value addition is made to the primary or raw product, and the agricultural sector’s engagement in trade and GVCs is direct via the exports of these primary products for either foreign processing or foreign final demand. Arguments in favour of downstream value adding are often based on the notion of higher total returns with domestic processing versus exports of primary products. However, significant export opportunities for primary products exist within GVCs, and additional value added can also be created within the agricultural sector, for instance by increasing quality of the product.
With the increase in the share of trade that is organized in global value chains, developing countries have a chance to engage in exports of upstream production processes, without having to build up a domestic processing sector. Furthermore, the costs of protectionism are higher with GVCs (World Bank, 2019; Yi, 2003):
• the increased fragmentation of production across borders means that trade costs are incurred multiple times and are applied on the full value of exports, including tariffs paid previously;

| 12 |
A quantitative analysis of trends in agricultural and food global value chains (GVCs)
• protective measures against any country have knock-on effects on all its trading partners in the value chain;
• GVCs also amplify the costs of trade policy uncertainty because firms are more reluctant to make further investments in new or existing relationships with foreign suppliers;
• significant tariffs on inputs can force firms to incur large costs to reshape their existing supply chains, thereby causing potentially long-lasting disruptions in global investment and production.
In a world with GVCs, optimal trade policy needs to take into account the origin of the foreign value added embedded in exports and the role of exported domestic value added in other countries’ value chains (Balié et al., 2019a). Global value chain linkages modify countries' incentives to impose trade protection. Tariffs faced in the destination market have ripple effects on the production activities which are linked to the GVC, spanned across different countries (Diakantoni et al., 2017).

CHAPTER 3
Trends in GVC participation


| 15 |
3 Trends in GVC participation
Global trendsIn line with observed trends for the integration of the global economy (Pahl and Timmer, 2019; World Bank, 2019), GVC participation in the agricultural sectors also increased significantly between 1995 and 2008, globally from around 30 percent to above 35 percent for both agriculture and food and beverages (Figure 1), but with considerable variation across countries. After 2008, further integration has roughly stalled.8 The trends are remarkably similar for both commodity groups, highlighting that there are common factors that drive GVC participation that dominate sectoral and structural change effects. In fact, while the expansion of GVC participation has often been attributed to manufacturing sectors, the increase in the agricultural sectors has been of similar magnitude, even if on average GVC participation rates are 10–15 percent-points lower than the economy-wide average. Thus, while agricultural commodities are perhaps less complex than, for example, computers and cars, fragmentation of the associated value chains to increase specialization and exploit comparative advantages at finer slices has also occurred in the agricultural sectors. This implies that less developed countries that cannot compete internationally in manufacturing sectors can still participate in global value chains and boost exports.
Figure 1 Evolution of global GVC participation rates
0%
10%
20%
30%
40%
50%
60%
1995 1997 1999 2001 2003 2005 2007 2009 2011 2013 2015
Panel A. Agriculture
Range of country values
Global GVC participation rate
0%
10%
20%
30%
40%
50%
60%
1995 1997 1999 2001 2003 2005 2007 2009 2011 2013 2015
Panel B. Food & beverages
Range of country values
Global GVC participation rate
Note: values calculated at the country level and then aggregated. Source: Authors’ elaboration based on data from Nenci (2020).
The effects of the 2008 crisis are clear in both sectors, having a three-staged impact: (i) GVC participation rates declined significantly in 2009; (ii) there was a partial rebound effect in 2010–2011; and (iii) GVC participation rates stagnated after 2011. Thus, the financial crisis extended not only to financial services sectors and manufacturing but also to agriculture,
8 Evidence on trends after 2015 is scarce, but the World Investment Report 2019 (UNCTAD, 2019) seems to suggest that foreign value added levels revert after 2015 to 2011-–2013 levels, that is, the dip in 2015 is likely to be temporary, and the longer term trend is roughly flat.

| 16 |
A quantitative analysis of trends in agricultural and food global value chains (GVCs)
as economic activity went down. These effects were also remarkably widespread across regions: until 2008, only 13 out of 181 countries in the database observed a decline in GVC participation9, but after 2008 only 15 countries further continued their integration in the global economy10. Over the whole period, 136 out of 181 countries had a – sometimes small – increase in GVC participation.
The increase in GVC participation has been accommodated by and contributed to the rapidly increasing global exports of agricultural and food commodities (Figure 2). Backward-linked GVC exports is the sum of foreign value added (FVA) across countries, that is all value added that has already been part of exports earlier in the value chain; at the global level, this represents double-counted value added. Forward-linked GVC exports are exports that will later be re-exported, again aggregated across countries. Non-GVC exports are exports that do not flow through GVCs but that are absorbed in the destination country; in the terminology of Borin and Mancini (2019) this is “direct absorption”. Backward- and forward-linked exports add up to GVC participation; forward-linked exports and non-GVC related exports add up to domestic value added (DVA), aggregated across countries. The sum of the three elements (plus some pure double-counting that is too small to show up in the figure) equals gross exports. While a majority (roughly two-thirds) of export value is not part of a GVC, both backward and forward linkages contribute significantly to export value.
Global exports of food and beverages are roughly twice as large as those of agricultural commodities, and in absolute terms, the rapid increase in food exports between 2002 and 2008 is remarkable. But as the increasing share of foreign value added shows, the increase in total exports is inflated by double-counting of value added that was already recorded as imports earlier in the value chain: the domestic value added embedded in global gross amounts to 88 percent in agriculture and 78 percent in food and beverages. In the long run, the embedding of imported value added in the domestic value chain can, however, be beneficial for growth (Ignatenko, Raei and Mircheva, 2019).At the global level, the share of backward and forward linkages in total GVC participation remains roughly constant over the entire period – both parts largely move together. This holds for both sectors. This suggests that total GVC participation has been driven more by scale effects than by changes in the positioning of sectors in the different value chains.
Finally, the exports of agri-food sectors can also stimulate value added creation in other sectors, just as agri-food value added can be part of the exports of another downstream sector. In both agri-food sectors, the biggest share of sectoral FVA is provided by services (Figure 3: in 2015 42 percent and 38 percent, respectively). This means that any boost to agri-food GVC participation leads to increased value added creation (and job creation) in some foreign services sector. In agriculture, a significant share of foreign inputs is delivered by chemicals and raw materials (which includes petroleum) – this mostly reflects the globalization of the seeds market (the share in food and beverages is much smaller). In the food and beverages industry, the second largest FVA input share is, unsurprisingly, agricultural commodities (20 percent; intra-sectoral trade in agriculture makes up 12 percent of agricultural FVA). The share of manufacturing in FVA is also sizable in both sectors; this includes machinery. Finally, while foreign inputs from the food sector into agriculture are small, intra-sectoral trade in the food and beverages industry is more substantial.
9 These are mostly countries where agricultural markets have been affected by war, droughts and other major disturbances.10 This concerns a widely varying group of mostly relatively small countries, including Guyana, Ireland, Oman, San Marino and Serbia.

| 17 |
3. Trends in GVC participation
Figure 2 Composition of gross exports
0
200
400
600
800
1,000
1,200
1995 2000 2005 2010 2015
Bln
USD
Panel A. Agriculture
Backward-linked GVC exportsForward-linked GVC exportsNon-GVC exports
0
200
400
600
800
1,000
1,200
1995 2000 2005 2010 2015
Bln
USD
Panel B. Food & beverages
Backward-linked GVC exportsForward-linked GVC exportsNon-GVC exports
Note: values calculated at the country level and then aggregated.
Source: Authors’ elaboration based on data from Nenci (2020).
GVC linkages in agriculture are mostly forward linked (Figure 2): it serves as a basic ingredient in other production processes. Food and beverages are much more in the middle and at the end of a value chain, and include the processing of agricultural inputs. Thus, the forward linkages of agriculture are roughly equal to the backward linkages of food and beverages, highlighting that agricultural commodities are a large part of imports in production of food. The backward linkages of agriculture refer to imports of inputs for agricultural production and are linked to international trade in fertilizers and seeds as well as to the increased servitization of the economy. The forward linkages in food and beverages are, to a significant extent, exports by the sector itself – agricultural commodities are lightly processed in one country, then re-exported and further processed and distributed. But there are also other downstream sectors that embed value added created in the food and beverage industry. This includes, for example, sugar in pharmaceuticals and cosmetics.
At the global level, the share of backward and forward linkages in total GVC participation remains roughly constant over the entire period – both parts largely move together. This holds for both sectors. This suggests that total GVC participation has been driven more by scale effects than by changes in the positioning of sectors in the different value chains.
Finally, the exports of agri-food sectors can also stimulate value added creation in other sectors, just as agri-food value added can be part of the exports of another downstream sector. In both agri-food sectors, the biggest share of sectoral FVA is provided by services (Figure 3: in 2015 42 percent and 38 percent, respectively). This means that any boost to agri-food GVC participation leads to increased value added creation (and job creation) in some foreign services sector. In agriculture, a significant share of foreign inputs is delivered by chemicals and raw materials (which includes petroleum) – this mostly reflects the globalization of the seeds market (the share in food and beverages is much smaller). In the food and beverages industry, the second largest FVA input share is, unsurprisingly, agricultural commodities (20 percent; intra-sectoral trade in agriculture makes up 12 percent of agricultural FVA). The share of manufacturing in FVA is also sizable in both sectors; this includes machinery. Finally, while foreign inputs from the food sector into agriculture are small, intra-sectoral trade in the food and beverages industry is more substantial.

| 18 |
A quantitative analysis of trends in agricultural and food global value chains (GVCs)
Figure 3 Origin of foreign value added in 2015 at global level
12%
5%
19%
22%
42%
Panel A. Agriculture
Agriculture Food and beverages Other manufacturing Chemicals and raw materials Services
20%
13%
16%12%
38%
Panel B. Food and beverages
Source: Authors’ elaboration based on data from Nenci (2020).
Regional GVC participation in 2015GVC participation rates vary widely across income groups.11 While there is no clear trend that total GVC participation rates are higher for higher income groups, on average GVC participation rates tend to be lower in low-income countries and upper-middle-income countries (Figure 4).12
Figure 4 GVC participation rates in 2015 by income group and continent.
0%
10%
20%
30%
40%
50%
60%
70%
80%
90%
0 25,000 50,000 75,000 100,000 125,000
GVC
parti
cipat
ion
GDP per capita
Panel A. Agriculture
Low income Lower middle Upper middle High income
0%
10%
20%
30%
40%
50%
60%
70%
80%
90%
0 25,000 50,000 75,000 100,000 125,000
GVC
part
icipa
tion
GDP per capita
Panel B. Food & beverages
Low income Lower middle Upper middle High income
11 Interestingly, for food and beverages there is a weak trend of convergence, where GVC participation of the most integrated countries grows more weakly than that of less integrated countries. Such a trend is not significant for agriculture.
12 The trend for high-income countries is skewed by a few economically specialized small countries, most notably Qatar, that are not representative for the group.

| 19 |
3. Trends in GVC participation
By continent
0%
10%
20%
30%
40%
50%
60%
70%
80%
NorthAmerica
SouthAmerica
Europe Africa Asia Oceania World
Panel C. Agriculture
0%
10%
20%
30%
40%
50%
60%
70%
80%
90%
NorthAmerica
SouthAmerica
Europe Africa Asia Oceania World
Panel D. Food & beverages
Notes: 1. The black cross in Panels A and B reflects the global average. 2. The horizontal black lines in Panels C and D represent median participation rate; bars show the 25 percent to 75 percent percentiles, and the vertical whiskers show the full range of countries within the region. Source: Authors’ elaboration based on data from Nenci (2020).
As the European economies are almost exclusively high-income and heavily linked to each other through the European Union’s single market, their value chains tend to include multiple countries and thus GVC participation rates are higher than in other regions (Figure 4, panels C and D). This also affects the calculation of GVC participation rates for countries that deliver intermediate products to the European market: a relatively large share of these will be re-exported within the European Union after entering into the region, and thus the forward GVC linkages of these external supplier countries and the backward linkages of the final destination European countries will be high. This is one reason why GVC participation rates tend to be rather high in Africa. While Africa still accounts for a meagre share of world trade, the region has exhibited remarkable drive over the last decade, with trade rising faster than in most developed and developing economies (UNCTAD, 2013).
There is a wide variation between countries in both export levels and GVC participation rates (Figure 5). For agriculture, there is hardly any correlation between both variables, while for food and beverages, there is some weak positive correlation (0.2), mostly driven by a relatively small group of very well-connected large exporters, including many European Union countries.13
13 The most extreme cases tend to be small countries; for food and beverages, Luxembourg has the highest GVC participation rate at 80 percent, while Iceland has the highest export intensity.

| 20 |
A quantitative analysis of trends in agricultural and food global value chains (GVCs)
Figure 5 Export intensities and GVC participation rates in 2015
0%
10%
20%
30%
40%
50%
60%
70%
80%
90%
0 10 20 30 40 50 60
GVC
par
ticip
atio
n
Exports/GDP
Panel A. Agriculture
Low income Lower middle Upper middle High income
0%
10%
20%
30%
40%
50%
60%
70%
80%
90%
0 20 40 60 80 100G
VC p
artic
ipat
ion
Exports/GDP
Panel B. Food & beverages
Low income Lower middle Upper middle High income
Notes:1. The three outliers in the food and beverages graph are shown by errors, labelled with the corresponding export levels.2. The black cross shows global average. Source: Authors’ elaboration based on data from Nenci (2020).
The relatively low GVC participation rates of low-income countries are linked to very low levels of backward linkages in these regions, especially in agriculture (Figure 6). In the food and beverages sector, this tends to be compensated by relatively high forward linkages, but not in agriculture.
Figure 6 Backward and forward GVC linkages in 2015 by income group
0%
10%
20%
30%
40%
50%
60%
70%
80%
0% 10% 20% 30% 40% 50% 60% 70% 80%
Forw
ard
linka
ges
Backward linkages
Panel A. Agriculture
Low income Lower middle Upper middle High income
0%
10%
20%
30%
40%
50%
60%
70%
80%
0% 10% 20% 30% 40% 50% 60% 70% 80%
Forw
ard
linka
ges
Backward linkages
Panel B. Food & beverages
Low income Lower middle Upper middle High income
Note: the black cross reflects the global average. Source: Authors’ elaboration based on data from Nenci (2020).

| 21 |
3. Trends in GVC participation
A trend emerges that backward linkages are relatively high for high-income countries, whereas forward linkages are higher in low-income countries.14 This suggests that low-income countries specialize more in the first upstream steps in the value chains, while high-income countries specialize more in downstream activities in these value chains. This holds within the sector, and potentially also across sectors (see below for a more in-depth analysis of GVC positioning). Given the significance of backward linkages for growth and labour productivity (Constantinescu, Mattoo and Ruta, 2019; World Bank, 2019), the further evolution of backward linkages in low-income countries should be supported, while keeping in mind that countries and sectors should specialize where their relative comparative advantage is: not all countries can compete in the same stages of a value chain or in the same commodities.
Small countries tend to trade more and are thus also more likely to be heavily involved in GVCs. Figure 7 confirms this: there is a negative correlation between population size (as a proxy for the size of the country) and GVC participation rates.15 This mostly reflects that naturally small countries cannot easily develop all economic activity domestically. The higher GVC participation rates of smaller countries extend to backward as well as forward linkages, implying the effect is not merely a stronger reliance on imports.
Figure 7 Population and GVC participation rates in 2015
0%
10%
20%
30%
40%
50%
60%
70%
80%
90%
10 15 20 25
GVC
par
ticip
atio
n
Population (log)
Panel A. Agriculture
Low income Lower middle Upper middle High income
0%
10%
20%
30%
40%
50%
60%
70%
80%
90%
10 15 20 25
GVC
par
ticip
atio
n
Population (log)
Panel B. Food & beverages
Low income Lower middle Upper middle High income
Source: Authors’ elaboration based on Nenci (2020)’s data.
Regional time trendsGrowth in GVC participation levels, namely, the value of exports that are part of a GVC, has been stronger in countries where income growth was fast (Figure 8, panels A and B).16 Domestic
14 The correlation coefficient between income and backward GVC linkages equals 0.5 in both sectors. The correlation coefficient between income and forward linkages equals -0.2 in agriculture and -0.3 in the food and beverages sector.
15 The correlation coefficients are -0.4 and -0.5 for agriculture and food and beverages, respectively.16 The correlation coefficient between both variables is 0.4 for agriculture and 0.3 for food and beverages.

| 22 |
A quantitative analysis of trends in agricultural and food global value chains (GVCs)
economic growth tends to go hand in hand with growth in exports, including both non-GVC related exports and exports that are linked internationally in a GVC. This effect extends to both the agriculture and food sectors.
This correlation in growth rates between GDP growth and GVC export growth says nothing about causality. In order to establish causality, more fundamental econometric analysis is required (see Montalbano and Nenci, 2020). Nonetheless, the graph at least partially shows the common conjecture that fast economic growth and increased GVC participation go hand-in-hand.17
Figure 8 Growth in income and growth in GVC participation levels between 1995 and 2015 by income group and continent
By income group
-5%
0%
5%
10%
15%
20%
-4% -2% 0% 2% 4% 6% 8% 10% 12%
GVC
parti
cipat
ion
leve
ls
GDP per capita
Panel A. Agriculture
Low income Lower middle Upper middle High income
-5%
0%
5%
10%
15%
20%
-4% -2% 0% 2% 4% 6% 8% 10% 12%
GVC
parti
cipat
ion
leve
ls
GDP per capita
Panel B. Food & beverages
Low income Lower middle Upper middle High income
By continent
0%1%2%3%4%5%6%7%8%9%
NorthAmerica
SouthAmerica
Europe Africa Asia Oceania World
Panel C. Agriculture
GVC participation levels GDP per capita
0%1%2%3%4%5%6%7%8%9%
NorthAmerica
SouthAmerica
Europe Africa Asia Oceania World
Panel D. Food & beverages
GVC participation levels GDP per capita
Note: The black cross reflects the global average. Growth rates reflect average annual growth between 1995 and 2015. Growth rates of GVC participation levels reflect the growth of exports that are part of a GVC. Source: Authors’ elaboration based on Nenci (2020)’s data.
17 After 2008, growth in income and growth in GVC participation rates are negatively correlated (-0.3 for both sectors); this hints at the stronger propagation of macroeconomic shocks across countries when they are more strongly embedded in global markets. The period is, however, too short to draw robust conclusions.

| 23 |
3. Trends in GVC participation
Growth in exports leads to a decrease in GVC participation rates when non-GVC exports grow more rapidly than GVC-related exports. Figure 9 shows that indeed higher export growth is weakly correlated with the negative growth of GVC participation rates.18 But the relation is not very strong, and for most countries, GVC participation rates have not declined. This confirms that GVC-related export growth, that is, increasing GVC participation levels, has been at least as rapid as non-GVC export growth and on balance leads to moderately growing GVC participation rates.
Figure 9 Growth in exports and change in GVC participation rates
-4%
-3%
-2%
-1%
0%
1%
2%
3%
4%
-5% 0% 5% 10% 15% 20%
GVC
par
ticip
atio
n ra
te
Exports
Panel A. Agriculture
Low income Lower middle Upper middle High income
-4%
-3%
-2%
-1%
0%
1%
2%
3%
4%
-5% 0% 5% 10% 15% 20%
GVC
par
ticip
atio
n ra
te
Exports
Panel B. Food & beverages
Low income Lower middle Upper middle High income
Note: the black cross reflects the global average. Growth rates reflect average annual growth between 1995 and 2015. Source: Authors’ elaboration based on data from Nenci (2020).
The literature suggests that the negative impact of export growth on GVC participation rates is only a short-term effect, as the higher exports boost domestic economic growth, which tends to boost foreign value added and ultimately increase GVC participation rates (Pahl and Timmer, 2019). One possible explanation why this is not more clearly visible in the graph is that sluggish growth post-2008 has halted these trends; it remains to be seen whether GVC participation rates will increase again once growth picks up.
Individual countries all have their drivers of growth in exports and GVC participation rates, linked to free trade agreements, country-specific macroeconomic circumstances, etc. (as discussed in the next section). Nonetheless, the middle-income countries dominate when looking at countries with high export growth. Some of these countries are using mostly non-GVC exports to boost domestic growth, while others – especially in the upper-middle-income group – can combine fast export growth with an increase in GVC participation rates.
In contrast, growth in the high income countries has been much more concentrated around the global mean; virtually all countries in this group have a small but positive growth in GVC participation rates, coupled with decent export growth, both in terms of GVC-related and other
18 In both sectors, the correlation coefficient equals -0.4.

| 24 |
A quantitative analysis of trends in agricultural and food global value chains (GVCs)
exports. Given that these countries are more advanced in their structural development, trade patterns are more established, and changes are more gradual.
Finally, Figure 10 shows that changes in backward linkages tend to be weakly negatively correlated with changes in forward linkages, at least in the food and beverages industry.19 Thus, countries that increase their backward linkages tend to reduce their forward linkages, that is, they move upstream in the value chain. The effect is not very strong, however, and there are plenty of examples of countries that defy the trend and that can increase both backward and forward linkages – the global average is also positive for both variables. Also noticeable is that changes in backward linkages tend to be a bit larger than those in forward linkages.
Figure 10 Growth rates of backward and forward GVC linkages between 1995 and 2015
-5%
-4%
-3%
-2%
-1%
0%
1%
2%
3%
4%
5%
-6% -4% -2% 0% 2% 4% 6% 8% 10%
Forw
ard
linka
ges
Backward linkages
Panel A. Agriculture
Low income Lower middle Upper middle High income
-5%
-4%
-3%
-2%
-1%
0%
1%
2%
3%
4%
5%
-6% -4% -2% 0% 2% 4% 6% 8% 10%
Forw
ard
linka
ges
Backward linkages
Panel B. Food & beverages
Low income Lower middle Upper middle High income
Note: the black cross reflects the global average. Growth rates reflect average annual growth between 1995 and 2015. Source: Authors’ elaboration based on data from Nenci (2020).
Low-income and lower-middle-income countries are more prone to have negative growth rates for backward linkages, at least in agriculture, with mixed results for forward linkages. In some countries, the negative growth rates for both backward and forward linkages can be traced back to negative income growth (for example, driven by political conflict), whereas in other cases, other country-specific drivers dominate. Asia, in particular, has shown a trend to rely less on imports and more on domestic inputs in production as part of a fast-growing domestic economy, especially in agriculture, but also in the food industry. Thus, while forward-linkages have flourished between 1995 and 2015, overall GVC participation rates have hardly increased in the region.
19 The correlation coefficients are -0.1 and -0.3 for agriculture and food and beverages, respectively.

CHAPTER 4
Selected country case studies


| 27 |
4 Selected country case studies
The global and regional trends described above are representative for groups of countries, but national circumstances have a significant influence on export growth a GVC participation of individual countries. This section explores the evolution of GVC participation for five selected countries: Brazil, Germany, Ghana, Nepal and Viet Nam. The selected countries are purely illustrative and roughly representative of countries at different stages of development and with different export strategies. Analysing their domestic conditions and policies helps to showcase how domestic circumstances shape each countries’ GVC participation.
Reference point: Exports and GVC participation at the global levelIn order to provide a reference point for the country-specific results presented in this section, Figure 11 presents the global numbers, presented analogous to the graphs below. Panels A and B repeat Figure 2 to show the evolution of gross exports – separated into domestic value added for non-GVC exports and forward-linked GVC exports, and backward linked GVC exports (foreign value added at the national level) – for agriculture and food and beverages, respectively. Panel C clarifies GVC participation (backward and forward linkages) and domestic value added (which at global level equates to total exported value added) for both sectors, and Panel D showcases the GVC positioning for both sectors.
Figure 11 Global GVC Participation
0
200
400
600
800
1,000
1,200
1995 2000 2005 2010 2015
Bln U
SD
Panel A. Agriculture
Backward-linked GVC exportsForward-linked GVC exportsNon-GVC exports
0%10%20%30%40%50%60%70%80%90%
100%
Exported Value Added GVC Participation
Panel C. Shares in 2015
Agriculture Food & Beverages
0
200
400
600
800
1,000
1,200
1995 2000 2005 2010 2015
Bln U
SD
Panel B. Food & beverages
Backward-linked GVC exportsForward-linked GVC exportsNon-GVC exports
0.00
0.20
0.40
0.60
0.80
1.00
1.20
1.40
Upstreamness Downstreamness
Panel D. Positioning in 2015
Agriculture Food & Beverages
Note: Exported value added in panel C contains both forward-linked GVC exports and non-GVC exports. Source: Authors’ elaboration based on data from Nenci (2020).

| 28 |
A quantitative analysis of trends in agricultural and food global value chains (GVCs)
For an interpretation of these numbers, see Section 0 above. Note that the GVC positioning indicators are presented relative to the sector-specific global average, which is therefore 1 by definition in both sectors.
Germany: Example of an exporter with strong GVC linkagesThe GVC participation rates of Germany (Europe, high-income) are presented in Figure 12.
Figure 12 GVC Participation in Germany
0
20,000
40,000
60,000
80,000
100,000
1995 2000 2005 2010 2015
Mln
USD
Panel A. Agriculture
Backward-linked GVC exportsForward-linked GVC exportsNon-GVC exports
0
20,000
40,000
60,000
80,000
100,000
1995 2000 2005 2010 2015
Mln
USD
Panel B. Food & beverages
Backward-linked GVC exportsForward-linked GVC exportsNon-GVC exports
0%10%20%30%40%50%60%70%80%90%
100%
Domestic Value Added GVC Participation
Panel C. Shares in 2015
Agriculture Food & Beverages
0.00
0.20
0.40
0.60
0.80
1.00
1.20
1.40
Upstreamness Downstreamness
Panel D. Positioning in 2015
Agriculture Food & Beverages
Source: Authors’ elaboration based on date from Nenci (2020).
Germany GVC participation rates were persistent throughout the period from 1995–2015 for both sectors as displayed in panels A and B. As a WTO member and European Union member, Germany has benefited from both, as Germany's agricultural sector is among the fourth largest producers in the European Union and the world's third-largest exporter of agricultural goods (BMEL, 2019). Therefore, its GVC participation is mainly due to its domestic value added supplied to other countries’ exports (Panel C). Its economy is open and highly-developed, with substantial activities focused on the food and beverages sector, as demonstrated

| 29 |
4. Selected country case studies
in the GVC participation and the high share of foreign value-added. For both sectors, the positioning of Germany is slightly more downstream than the global average (Panel D).
Brazil: Example of an exporter with strong forward GVC linkagesBrazil’s (South America, upper-middle-income) GVC participation rates from 1995–2008 exhibited an increasing trend, following the global upsurge of trade in value added.
Figure 13 GVC Participation in Brazil
0
5,000
10,000
15,000
20,000
25,000
1995 2000 2005 2010 2015
Mln
USD
Panel A. Agriculture
Backward-linked GVC exportsForward-linked GVC exportsNon-GVC exports
0
5,000
10,000
15,000
20,000
25,000
1995 2000 2005 2010 2015
Mln
USD
Panel B. Food & beverages
Backward-linked GVC exportsForward-linked GVC exportsNon-GVC exports
0%10%20%30%40%50%60%70%80%90%
100%
Domestic Value Added GVC Participation
Panel C. Shares in 2015
Agriculture Food & Beverages
0.00
0.20
0.40
0.60
0.80
1.00
1.20
1.40
Upstreamness Downstreamness
Panel D. Positioning in 2015
Agriculture Food & Beverages
Source: Authors’ elaboration based on Nenci (2020)’s data.
Brazil’s GVC participation in agriculture (panel A in Figure 13) did not grow as much as other BRIC(S) countries. However, regional trade has been increasing and is more robust, primarily with Argentina, since the establishment of the Southern Common Market (Mercosur) in 1991 (Chen, 2012). The most acute point for determining Brazil’s relatively low participation in food and beverage GVCs is its modest use of foreign inputs in exports (see panel B for the time trend and panel C for the snapshot in 2015), as well as the low backward specialization linkages (panel B). Therefore, the focus on exporting domestically produced commodities is accompanied by

| 30 |
A quantitative analysis of trends in agricultural and food global value chains (GVCs)
the country’s significant participation in the GVCs as a supplier of basic goods used in other countries’ productive chain (and hence the high forward linkages shown in panels A, B, and D). For example, the soybean value chain, about 95 percent of Brazil’s soybean exports to China in 2009 were unprocessed beans (Callegari, Melo and Carvalho, 2018). Further, some of Brazil’s agricultural subsectors, such as dairy products, sugar, beverages, spirits, and vinegar are granted higher than average protection in the world, and bear the highest percentage of tariffs above 20 percent among agricultural products (WTO, 2017).20 Brazil is a commodity provider, and its forward participation rate for food and beverages is fairly low. In terms of positioning, the agriculture sector in Brazil is very close to the global average. It’s food and beverages industry is slightly more downstream than the global average.
Ghana: Example of an exporter with strong forward GVC linkagesGhana’s (Africa; lower-middle-income) GVC participation is characterized differently in both sectors, primarily being a key player in the agriculture sector – with rapidly expanding export volumes – and an underdeveloped food and beverages industry (Figure 14).
Ghana is the world’s leading cocoa producer, and as it exports mostly unprocessed cocoa, it has very high forward linkages from its agricultural sector to the rest of the world (panels A, C, and D) similarly, food exports are largely domestically processed cocoa products and hence have low backward linkages to other economies. Together this leads to Ghana’s status as a large exporter – in terms of export intensity – with strong forward GVC linkages in agriculture, but with weaker GVC linkages in food and beverages (panels A and B). Ghana experienced a consistent increase between 2000 until 2008, as it became one of the beneficiaries of the United States of America’s African Growth and Opportunity Act (AGOA) 21 quota and duty free status in 2000, and a key member of the Economic Community of West African States (ECOWAS). But as suggested in panels (A, B, and C) low backward linkages are prevalent in both sectors as its key exported commodity is unprocessed cocoa. Ghana is relatively less integrated into agricultural global value chains as its wider economy consists of other major sectors such as gold and oil (African Development Bank, OECD and United Nations Development Programme, 2014). The agriculture sector in Ghana is relatively upstream as displayed in panel D. For food and beverages, both the upstreamness and downstreamness indicators are well below global average. This reflects that the Ghanaian’ food and beverages industry is participating in value chains that are shorter than in most other countries.
20 The country is self-sufficient in basic foodstuffs and is a leading exporter of a wide range of crops, including oranges, soybeans, coffee, and cassava, which are grown mainly in the South and Southeast. Brazil, unlike most Latin American countries, has increased agricultural production by greatly enlarging its cultivated area.
21 The African Growth and Opportunity Act (AGOA) is a non-reciprocal trade initiative of the United States government which provides duty-free and quota-free treatment to over 6,500 products from sub-Saharan African countries to the United States market.

| 31 |
4. Selected country case studies
Reference point: Exports and GVC participation at the global levelIn order to provide a reference point for the country-specific results presented in this section, Figure 11 presents the global numbers, presented analogous to the graphs below. Panels A and B repeat Figure 2 to show the evolution of gross exports – separated into domestic value added for non-GVC exports and forward-linked GVC exports, and backward linked GVC exports (foreign value added at the national level) – for agriculture and food and beverages, respectively. Panel C clarifies GVC participation (backward and forward linkages) and domestic value added (which at global level equates to total exported value added) for both sectors, and Panel D showcases the GVC positioning for both sectors.
For an interpretation of these numbers, see Section 0 above. Note that the GVC positioning indicators are presented relative to the sector-specific global average, which is therefore 1 by definition in both sectors.
Figure 14 GVC Participation in Ghana
0
500
1,000
1,500
2,000
1995 2000 2005 2010 2015
Mln
USD
Panel A. Agriculture
Backward-linked GVC exportsForward-linked GVC exportsNon-GVC exports
0
500
1,000
1,500
2,000
1995 2000 2005 2010 2015
Mln
USD
Panel B. Food & beverages
Backward-linked GVC exportsForward-linked GVC exportsNon-GVC exports
0%10%20%30%40%50%60%70%80%90%
100%
Domestic Value Added GVC Participation
Panel C. Shares in 2015
Agriculture Food & Beverages
0.00
0.20
0.40
0.60
0.80
1.00
1.20
1.40
Upstreamness Downstreamness
Panel D. Positioning in 2015
Agriculture Food & Beverages
Source: Authors’ elaboration based on Nenci (2020)’s data.

| 32 |
A quantitative analysis of trends in agricultural and food global value chains (GVCs)
Viet Nam: Example of an exporter with strong backward GVC linkagesViet Nam’s (Asia, lower-middle-income) GVC participation is quite extensive and its rate exemplifies the international orientation, particularly of the food and beverage industry (Figure 15).
Viet Nam’s trade liberalization and international economic integration have brought about significant contributions to its export expansion, especially after 2000 in both sectors (panels A and B) (Auffret, 2003). Viet Nam benefited throughout the entire period from its membership in the Association of Southeast Asian Nations (ASEAN) and other bilateral trade agreements. In addition, Viet Nam has become a party to several FTAs that the regional trade bloc has signed, and has experienced positive rates in terms of participation in both sectors (panel C) (Thu, Trung and Xuân, 2015).22 As displayed in panel B, the extensive backward linkages in the food and beverages industry suggest that Viet Nam has specialized in processing, leaving the production of the basic inputs to its regional neighbours. Viet Nam tends to position itself relatively downstream in agriculture, and relatively upstream in food and beverages, implying that it is focusing on the middle segment of the agri-food chain (panel D). The high values for all indicators show that it focuses on relatively long value chains.
Figure 15 GVC Participation in Viet Nam
Source: Authors’ elaboration based on Nenci (2020)’s data.
22 Viet Nam’s trade liberalization has been prevalent as it has signed trade pacts with China, Republic of Korea, Australia, New Zealand, India, Chile and Japan, as well as a trade agreement with the Russian-led Customs Union block. In addition, it signed a bilateral trade agreement (BTA) with the United States of America.
0
1,000
2,000
3,000
4,000
1995 2000 2005 2010 2015
Mln
USD
Panel A. Agriculture
Backward-linked GVC exportsForward-linked GVC exportsNon-GVC exports
0
1,000
2,000
3,000
4,000
1995 2000 2005 2010 2015
Mln
USD
Panel B. Food & beverages
Backward-linked GVC exportsForward-linked GVC exportsNon-GVC exports
0%10%20%30%40%50%60%70%80%90%
100%
Domestic Value Added GVC Participation
Panel C. Shares in 2015
Agriculture Food & Beverages
0.00
0.20
0.40
0.60
0.80
1.00
1.20
1.40
Upstreamness Downstreamness
Panel D. Positioning in 2015
Agriculture Food & Beverages

| 33 |
4. Selected country case studies
Nepal: Example of an exporter with weak GVC linkagesNepal (Asia; low-income) GVC participation rates had a few significant periods that caused some hurdles and slowed the participation of the economy in global value chains (Figure 16).
Figure 16 GVC Participation in Nepal
0
100
200
300
400
500
1995 2000 2005 2010 2015
Mln
USD
Panel A. Agriculture
Backward-linked GVC exportsForward-linked GVC exportsNon-GVC exports
0
100
200
300
400
500
1995 2000 2005 2010 2015
Mln
USD
Panel B. Food & beverages
Backward-linked GVC exportsForward-linked GVC exportsNon-GVC exports
0%10%20%30%40%50%60%70%80%90%
100%
Domestic Value Added GVC Participation
Panel C. Shares in 2015
Agriculture Food & Beverages
0.00
0.20
0.40
0.60
0.80
1.00
1.20
1.40
Upstreamness Downstreamness
Panel D. Positioning in 2015
Agriculture Food & Beverages
Source: Authors’ elaboration based on Nenci (2020)’s data.
The agriculture sector is the backbone of Nepal's economy, as a coffee and tea producer, but it has modest forward linkages (panel A). However, its food and beverage sector has witnessed progressive growth, and is one of the fastest growing sectors of the Nepalese economy (panel B).
A considerable export intensity in agriculture is combined with low GVC participation rates, implying that Nepal has strong trade links with certain countries (including India) to provide agricultural commodities for final consumption, rather than for further processing (panels A and B). Nepal became a WTO member in 2004, and it also participates in two overlapping regional agreements: the South Asia Free Trade Area (SAFTA); and the Framework Agreement on the Bay of Bengal Initiative for Multi-Sectoral Technical and Economic Cooperation (BIMSTEC)

| 34 |
A quantitative analysis of trends in agricultural and food global value chains (GVCs)
FTA (WTO, 2018). Nepal's unique topography creates the potential to produce a wide variety of products but it faces many challenges as a landlocked country with poor infrastructure and a high risk of natural disasters (Choudhury and Nayak, 2019). As for Nepal, the positioning indicators for Nepal are below average (with the exception of downstreamness of the food and beverages sector), indicating participation in relatively short value chains (panel D).

CHAPTER 5
Trends in GVC positioning

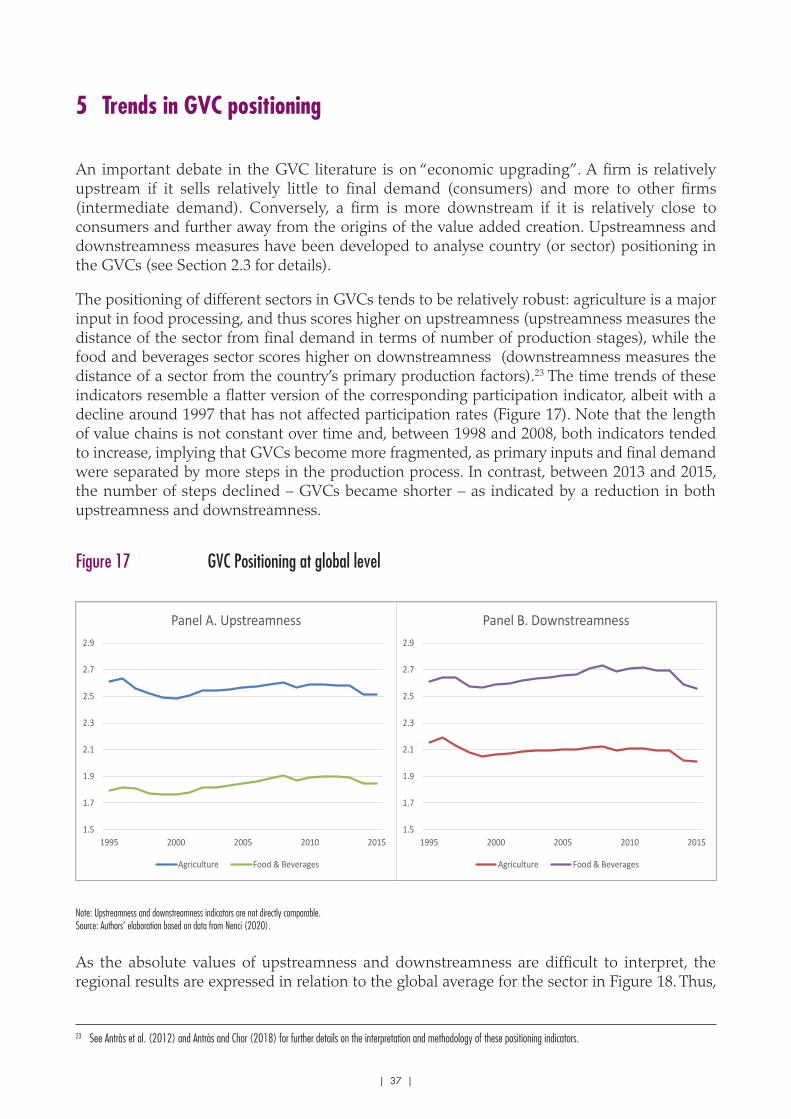
| 37 |
5 Trends in GVC positioning
An important debate in the GVC literature is on “economic upgrading”. A firm is relatively upstream if it sells relatively little to final demand (consumers) and more to other firms (intermediate demand). Conversely, a firm is more downstream if it is relatively close to consumers and further away from the origins of the value added creation. Upstreamness and downstreamness measures have been developed to analyse country (or sector) positioning in the GVCs (see Section 2.3 for details).
The positioning of different sectors in GVCs tends to be relatively robust: agriculture is a major input in food processing, and thus scores higher on upstreamness (upstreamness measures the distance of the sector from final demand in terms of number of production stages), while the food and beverages sector scores higher on downstreamness (downstreamness measures the distance of a sector from the country’s primary production factors).23 The time trends of these indicators resemble a flatter version of the corresponding participation indicator, albeit with a decline around 1997 that has not affected participation rates (Figure 17). Note that the length of value chains is not constant over time and, between 1998 and 2008, both indicators tended to increase, implying that GVCs become more fragmented, as primary inputs and final demand were separated by more steps in the production process. In contrast, between 2013 and 2015, the number of steps declined – GVCs became shorter – as indicated by a reduction in both upstreamness and downstreamness.
Figure 17 GVC Positioning at global level
1.5
1.7
1.9
2.1
2.3
2.5
2.7
2.9
1995 2000 2005 2010 2015
Panel A. Upstreamness
Agriculture Food & Beverages
1.5
1.7
1.9
2.1
2.3
2.5
2.7
2.9
1995 2000 2005 2010 2015
Panel B. Downstreamness
Agriculture Food & Beverages
Note: Upstreamness and downstreamness indicators are not directly comparable. Source: Authors’ elaboration based on data from Nenci (2020).
As the absolute values of upstreamness and downstreamness are difficult to interpret, the regional results are expressed in relation to the global average for the sector in Figure 18. Thus,
23 See Antràs et al. (2012) and Antràs and Chor (2018) for further details on the interpretation and methodology of these positioning indicators.

| 38 |
A quantitative analysis of trends in agricultural and food global value chains (GVCs)
values above one indicate that the sector is more upstream (or downstream) than the global average. For both upstreamness and downstreamness, and for both agriculture and food and beverages there are more regions below the global average than above; as the size of total exports and the number of countries in the regions differs widely, various regions have different weights in the global average.
The analysis of GVC participation rates above revealed that high-income countries tend to be more downstream than low-income countries. Figure 18 confirms this; the effect is stronger for agriculture than for food and beverages.
Figure 18 GVC positioning in 2015 at regional level
0.0
0.5
1.0
1.5
2.0
2.5
3.0
Low income Lower middleincome
Upper middleincome
High income
Panel A. Upstreamness
Agriculture Food & Beverages
0.0
0.5
1.0
1.5
2.0
2.5
3.0
Low income Lower middleincome
Upper middleincome
High income
Panel B. Downstreamness
Agriculture Food & Beverages
Source: Authors’ elaboration based on Nenci (2020)’s data.
In agriculture, higher income levels tend to be associated with higher downstreamness, (being further away from the primary inputs). Agricultural upstreamness forms a U-shape: it first declines with income, then rises again. The latter is mostly caused by the fact that high-income countries are involved in longer value chains and thus achieve high values for both upstreamness and downstreamness. In the food and beverages industry, the differences between income groups are less pronounced.
Finally, Figure 19 shows that the variation in positioning between countries in the same income group is larger than the variation between the groups. This holds for both sectors, but is especially clear for agriculture. The positioning indicators are positively correlated across sectors, especially for the downstreamness indicator. Thus, countries that are relatively upstream (downstream) in agriculture, are on average also relatively upstream (downstream) in food and beverages.

| 39 |
5. Trends in GVC positioning
Figure 19 GVC positioning in at country level
0.0
0.5
1.0
1.5
2.0
2.5
0.0 0.5 1.0 1.5 2.0 2.5
Food
& B
ever
ages
Agriculture
Panel A. Upstreamness
Low income Lower middle Upper middle High income
0.0
0.5
1.0
1.5
2.0
2.5
0.0 0.5 1.0 1.5 2.0 2.5
Food
& B
ever
ages
Agriculture
Panel B. Downstreamness
Low income Lower middle Upper middle High income


REFERENCES

| 43 |
References
African Development Bank, OECD & United Nations Development Programme. 2014. African Economic Outlook 2014: Global Value Chains and Africa’s Industrialisation. Paris, OECD Publishing. (also available at https://www.oecd-ilibrary.org/development/african-economic-outlook-2014_aeo-2014-en).
Antràs, P. & Chor, D. 2018. On the Measurement of Upstreamness and Downstreamness in Global Value Chains. , p. w24185. No. w24185. Cambridge, MA, National Bureau of Economic Research. (also available at http://www.nber.org/papers/w24185.pdf).
Antràs, P., Chor, D., Fally, T. & Hillberry, R. 2012. Measuring the Upstreamness of Production and Trade Flows. American Economic Review, 102(3): 412–416. https://doi.org/10.1257/aer.102.3.412
Auffret, P. 2003. Trade reform in Vietnam : opportunities with emerging challenges. No. WPS3076. World Bank. (also available at http://documents.worldbank.org/curated/en/724241468781156356/Trade-reform-in-Vietnam-opportunities-with-emerging-challenges).
Balié, J., Del Prete, D., Magrini, E., Montalbano, P. & Nenci, S. 2019a. Does Trade Policy Impact Food and Agriculture Global Value Chain Participation of Sub-Saharan African Countries? American Journal of Agricultural Economics, 101(3): 773–789. https://doi.org/10.1093/ajae/aay091
Balié, J., Del Prete, D., Magrini, E., Montalbano, P., & Nenci, S. 2019b. Food and agriculture global value chains: new evidence from Sub-Saharan Africa. In: Governance for Structural Transformation in Africa (pp. 251-276). Palgrave Macmillan, Cham.
BMEL. 2019. Understanding Farming - Facts and figures about German farming [online]. [Cited 4 June 2020]. https://www.bmel.de/SharedDocs/Downloads/EN/Publications/UnderstandingFarming.html
Borin, A. & Mancini, M. 2019. Measuring What Matters in Global Value Chains and Value-Added Trade. , pp. 1–66. No. WPS8804. The World Bank. (also available at http://documents.worldbank.org/curated/en/639481554384583291/Measuring-What-Matters-in-Global-Value-Chains-and-Value-Added-Trade).
Callegari, J., Melo, T.M. & Carvalho, C.E. 2018. The peculiar insertion of Brazil into global value chains. Review of Development Economics, 22(3): 1321–1342. https://doi.org/10.1111/rode.12386
Cattaneo, O., Gereffi, G., Miroudot, S. & Taglioni, D. 2013. Joining, Upgrading and Being Competitive in Global Value Chains: A Strategic Framework. WPS6406. The World Bank. (also available at http://elibrary.worldbank.org/doi/book/10.1596/1813-9450-6406).
Chen, L. 2012. The BRICs in the Global Value Chains: An Empirical Note. Cuadernos de Economía, 31(57): 221–239.
Choudhury, R. & Nayak, D. 2019. Trade And Investment In South Asia: An Analysis. , p. 200. World Scientific Publishing Co Pte Ltd. (also available at https://www.ibs.it/trade-investment-in-south-asia-libro-inglese-rahul-nath-choudhury-dinkar-nayak/e/9789811206566).
| 44 |
A quantitative analysis of trends in agricultural and food global value chains (GVCs)
Constantinescu, C., Mattoo, A. & Ruta, M. 2019. Does vertical specialisation increase productivity? The World Economy, 42(8): 2385–2402. https://doi.org/10.1111/twec.12801
Diakantoni, A., Escaith, H., Roberts, M. & Verbeet, T. 2017. Accumulating trade costs and competitiveness in global value chains. No. WTO Staff Working Paper ERSD-2017-02. Geneva, WTO. (also available at http://hdl.handle.net/10419/152255).
Fagerberg, J., Lundvall, B.-Å. & Srholec, M. 2018. Global Value Chains, National Innovation Systems and Economic Development. The European Journal of Development Research, 30(3): 533–556. https://doi.org/10.1057/s41287-018-0147-2
Fally, T. 2012. “Production Staging: Measurement and Facts," mimeo UC Berkeley.
FAO. 2016. The State of Agricultural Commodity Markets 2015-16. Rome, FAO. (also available at http://www.fao.org/publications/soco/the-state-of-agricultural-commodity-markets-2015-16/en/).
Gereffi, G. & Fernandez-Stark, K. 2016. Global Value Chain Analysis: A Primer, 2nd Edition
Greenville, J., Kawasaki, K. & Beaujeu, R. 2017. How policies shape global food and agriculture value chains. No. 100. Paris, OECD Publishing. (also available at https://www.oecd-ilibrary.org/content/paper/aaf0763a-en).
Greenville, J., Kawasaki, K., Flaig, D. & Carrico, C. 2019. Influencing GVCs through Agro-Food Policy and Reform. OECD Food, Agriculture and Fisheries Papers No. 125. Paris, OECD Publishing. (also available at https://www.oecd-ilibrary.org/agriculture-and-food/influencing-gvcs-through-agro-food-policy-and-reform_9ce888e0-en).
Greenville, J., Kawasaki, K. & Jouanjean, M.-A. 2019. Value Adding Pathways in Agriculture and Food Trade: The Role of GVCs and Services. OECD Food, Agriculture and Fisheries Papers No. 123. Paris, OECD Publishing. (also available at https://www.oecd-ilibrary.org/agriculture-and-food/value-adding-pathways-in-agriculture-and-food-trade_bb8bb93d-en).
Hummels, D., Ishii, J. & Yi, K.-M. 2001. The nature and growth of vertical specialization in world trade. Journal of International Economics, 54(1): 75–96. https://doi.org/10.1016/S0022-1996(00)00093-3
Ignatenko, A., Raei, F. & Mircheva, B. 2019. Global Value Chains: What are the Benefits and Why Do Countries Participate? No. WP/19/18. IMF. (also available at https://www.imf.org/en/Publications/WP/Issues/2019/01/18/Global-Value-Chains-What-are-the-Benefits-and-Why-Do-Countries-Participate-46505).
Koopman, R., Wang, Z. & Wei, S.-J. 2014. Tracing Value-Added and Double Counting in Gross Exports. American Economic Review, 104(2): 459–94. https://doi.org/10.1257/aer.104.2.459
Kowalski, P., Gonzalez, J.L., Ragoussis, A. & Ugarte, C. 2015. Participation of Developing Countries in Global Value Chains. OECD Trade Policy Papers No. 179. Paris, OECD. (also available at https://www.oecd-ilibrary.org/content/paper/5js33lfw0xxn-en).
Lenzen, M., Moran, D., Kanemoto, K. & Geschke, A. 2013. Building Eora: A Global Multi-Region Input–Output Database at High Country and Sector Resolution. Economic Systems Research, 25(1): 20–49. https://doi.org/10.1080/09535314.2013.769938
Leontief, W.W. 1936. Quantitative Input and Output Relations in the Economic Systems of the United States. The Review of Economics and Statistics, 18(3): 105–125. https://doi.org/10.2307/1927837

| 45 |
References
Montalbano, P. & Nenci, S. 2020. The effects of GVC participation on the economic growth of the agricultural and food sectors. Background paper for The State of Agricultural Commodity Markets 2020. Rome, FAO.
Nenci, S. 2020. Mapping global value chain (GVC) participation, positioning and vertical specialization in agriculture and food. Technical note for The State of Agricultural Commodity Markets (SOCO), FAO, Rome.
OECD & WTO. 2012. Trade in Value-Added: concepts, methodologies and challenges. (also available at http://www.oecd.org/sti/ind/49894138.pdf).
Pahl, S. & Timmer, M.P. 2019. Patterns of vertical specialisation in trade: long-run evidence for 91 countries. Review of World Economics, 155(3): 459–486. https://doi.org/10.1007/s10290-019-00352-3
Thu, N.B.A., Trung, V.V. & Xuân, L.T.T. 2015. Assessing the Impact of ASEAN+3 Free Trade Agreements on ASEAN’s Trade Flows: A Gravity Model Approach1. https://doi.org/10.5901/mjss.2015.v6n6p394
UNCTAD. 2013. Economic Development in Africa Report 2013, Geneva: United Nations Conference on Trade and Development, United Nations Publication ISBN 978-92-1-112866-6.
UNCTAD. 2019. World Investment Report 2019: Special Economic Zones. United Nations Conference on Trade and Development (UNCTAD) World Investment Report (WIR). UN. (also available at https://www.un-ilibrary.org/economic-and-social-development/world-investment-report-2019_8a8d05f9-en).
Voora, V., Bermúdez, S. & Larrea, C. 2019. Global Market Report:: Cocoa. International Institute for Sustainable Development (IISD). (also available at https://www.jstor.org/stable/resrep22025).
World Bank, ed. 2017. Measuring and analyzing the impact of GVCs on economic development: global value chains development report 2017. Washington, DC, World Bank Group. 189 pp.
World Bank. 2019. World Development Report 2020: Trading for Development in the Age of Global Value Chains. (also available at https://www.worldbank.org/en/publication/wdr2020).
WTO. 2017. WTO | Trade policy review - Brazil 2017. Trade Policy Review. Geneva, WTO. (also available at https://www.wto.org/english/tratop_e/tpr_e/tp458_e.htm).
WTO. 2018. Trade Policy Review: Nepal [online]. [Cited 4 June 2020]. https://www.wto.org/english/tratop_e/tpr_e/tp481_crc_e.htm
WTO. 2019. Global Value Chain Development Report 2019: Technological Innovation, Supply Chain Trade, and Workers in a Globalized World. Geneva. (also available at https://www.wto-ilibrary.org/information-technology-and-e-commerce/global-value-chain-development-report-2019_6b9727ab-en).
Yi, K. 2003. Can Vertical Specialization Explain the Growth of World Trade? Journal of Political Economy, 111(1): 52–102. https://doi.org/10.1086/344805


ANNEXES

| 48 |
Annex I Details on the methodology
The analysis in this report uses indicators calculated in Nenci (2020).
Computation of DVA and FVANenci (2020) follows the Borin and Mancini (2019) extension of the Koopman et al. (2014) methodology. and calculates the following value added components of gross exports at country level (see Figure I.1):
• the domestic value added (DVA), that is value added exported in final or intermediate goods. This is part of the domestic content (DC) – the part of gross exports thatoriginated in the country – and is also a measure of GDP in gross exports or inintermediates absorbed by direct importers;
• the foreign value added (FVA) that is value added contained in intermediate inputsimported from abroad, exported in the form of final or intermediate goods. This ispart of the foreign content (FC) – the part of gross exports that originated abroad.
Figure I.1 Borin and Mancini refinement of the Koopman et al. (2014) breakdown of aggregate exports
Source: Author’s adaptation from KWW and BM

| 49 |
Annexes
Computation of GVC participationGVC participation indicators are computed following Borin and Mancini (2019, p.20). Specifically, the overall bilateral GVC participation from country s to country r can be decomposed into a ‘backward’ component, corresponding to the vertical specialization (VS) index (that is the value of imported inputs used to produce goods that are exported) and a ‘forward’ component, corresponding to the VS1 indicator suggested by Hummels et al. (2001) (that is the value of intermediate exports sent indirectly through third countries to final destinations).
The overall bilateral GVC participation indicator can be thus defined as follows:
GVC positioning indicatorsThe downstreamness and upstreamness measures are computed following Antràs and Chor (2018) using data from EORA 26 (see Nenci, 2020, for technical details).
Computation of sectoral total value addedBy using the data on value added provided by the ‘VA’ matrices at basic prices in the EORA tables, the values for each country c and sector s are computed as follows24:
Values are expressed in current thousand USD.
Decomposition of sectoral Foreign Value AddedSectoral FVA of gross exports is computed following Borin and Mancini (2019) and is defined referring to world trade flows according to the sectoral-exporter perspective. FVA comprises: i) foreign VA in exports of final goods of country j and sector s globally originated from sector t; ii) foreign VA in exports of intermediate goods of country j and sector s globally originated from sector t.
The sectoral FVA data represent value added originated abroad in five different (groups of) sectors: i) ‘Agriculture’; ii) ‘Food and Beverage’; iii) ‘Petroleum, Chemical and Non-Metallic Mineral Products’; iv) ‘Services’ (including ‘Wholesale Trade’, ‘Retail Trade’, ‘Hotels and Restaurants’, ‘Transport’, ‘Post and Telecommunications’ and ‘Financial Intermediation and Business Activities’); v) ‘Other manufacturing’ (including ‘Textiles and Wearing Apparel’, ‘Wood and Paper’, ‘Metal Products’, ‘Electrical and Machinery’, ‘Transport Equipment’ and ‘Other Manufacturing’). Values are expressed in current thousand USD.
24 Sudan and Zimbabwe are not included in the dataset due to some inconsistencies in the EORA data. For some (small) countries, value added presents unreliable values. This is unfortunately related to balancing issues in the construction of the EORA tables (see https://worldmrio.com/documentation/faq.jsp). These values count for 1.3 percent of the value added data.

| 50 |
A quantitative analysis of trends in agricultural and food global value chains (GVCs)
AnnexII Details on the EORA database
Table II.1 EORA “agriculture” and “food and beverages”’ industries – ISIC correspondence and disaggregation
EORA Sector ISIC Rev.3 Correspondence
Agriculture Division 01 - Agriculture, hunting and related service activities
011 Growing of crops; market gardening; horticulture 0111 Growing of cereals and other crops n.e.c. 0112 Growing of vegetables, horticultural specialties and nursery products 0113 Growing of fruit, nuts, beverage and spice crops 012 Farming of animals 0121 Farming of cattle, sheep, goats, horses, asses, mules and hinnies; dairy farming 0122 Other animal farming; production of animal products n.e.c. 013 0130 Growing of crops combined with farming of animals (mixed farming) 014 0140 Agricultural and animal husbandry service activities, except veterinary activities 015 0150 Hunting, trapping and game propagation including related service activities
Division 02 - Forestry, logging and related service activities 020 0200 Forestry, logging and related service activities
Food and beverages
Division 15 Manufacture of food products and beverages
151 Production, processing and preservation of meat, fish, fruit, vegetables, oils and fats 1511 Production, processing and preserving of meat and meat products 1512 Processing and preserving of fish and fish products 1513 Processing and preserving of fruit and vegetables 1514 Manufacture of vegetable and animal oils and fats 152 1520 Manufacture of dairy products 153 Manufacture of grain mill products, starches and starch products, and prepared animal feeds 1531 Manufacture of grain mill products 1532 Manufacture of starches and starch products 1533 Manufacture of prepared animal feeds 154 Manufacture of other food products 1541 Manufacture of bakery products 1542 Manufacture of sugar 1543 Manufacture of cocoa, chocolate and sugar confectionery 1544 Manufacture of macaroni, noodles, couscous and similar farinaceous products 1549 Manufacture of other food products n.e.c. 155 Manufacture of beverages 1551 Distilling, rectifying and blending of spirits; ethyl alcohol production from fermented materials 1552 Manufacture of wines 1553 Manufacture of malt liquors and malt 1554 Manufacture of soft drinks; production of mineral waters
Division 16 Manufacture of tobacco products 160 1600 Manufacture of tobacco products

| 51 |
Annexes
Table II.2 EORA sector classification
Industry Code Sector Description1 Agriculture
2 Fishing
3 Mining and Quarrying
4 Food and Beverages
5 Textiles and Wearing Apparel
6 Wood and Paper
7 Petroleum, Chemical and Non-Metallic Mineral Products
8 Metal Products
9 Electrical and Machinery
10 Transport Equipment
11 Other Manufacturing
12 Recycling
13 Electricity, Gas and Water
14 Construction
15 Maintenance and Repair
16 Wholesale Trade
17 Retail Trade
18 Hotels and Restaurants
19 Transport
20 Post and Telecommunications
21 Financial Intermediation and Business Activities
22 Public Administration
23 Education, Health and Other Services
24 Private Households
25 Others
26 Re-export & Re-import


| 53 |

CB0729EN/1/09.20
ISBN 978-92-5-133211-5
9 7 8 9 2 5 1 3 3 2 1 1 5