a prismatic-core design for a milling machine component · a prismatic-core design for a milling...
TRANSCRIPT

A prismatic-core design for a milling machine component
A. Srikantha Phani, S.P. Mai, N.A. Fleck, J. Woodhouse
Department of Engineering
University of Cambridge
Trumpington Street,
Cambridge CB2 1PZ, UK
Email: [email protected]
Angelo Merlo, Donato Ricciardi
Centro Studi Industriali
Via Tintoretto, 10, 20093
Cologno Monzese, Italy
Fabrizio Meo.
Fidia S.p.A
Corso Lombardia, 11, 10099
San Mauro Torinese, Italy
1

Abstract
Novel lightweight steel sandwich tubular structures are proposed for application in the machine
tool industry− current designs are based on welded steel monolithic tubular construction with
internal stiffeners. A steel sandwich structure with a corrugated core is proposed as an alternative
multi-functional structure for potential application in future generation high speed, ultra precise
milling machines. A prototype is designed by an optimisation procedure, validated using the finite
element (FE) technique and manufactured by adhesively bonding the core to the facesheets. The
vibration frequency response is measured and the natural frequency and loss factor of each mode
are determined. Predictions for structural stiffness based on the FE study are indirectly verified
by comparing the measured natural frequencies of the built-up structure with the FE predictions.
The measured loss factors of the structure vary from mode to mode and lie in the rage 0.3%− 1%
under free-free test conditions. It is observed that the sandwich structure has adequate dynamic
stiffness for milling machine application. The sandwich core gives multi-functional capabilities such
as: integrated sensors to monitor distortions associated with thermal drift, active internal thermal
cooling down the channels of the corrugated core, and additional damping when the core is filled
with a low density viscoelastic foam.
2

I. INTRODUCTION
There is significant interest in developing high precision milling machines in order to make
components quickly and accurately1. A typical 3-axis high speed milling machine (shown
in Fig. 1) consists of a motorised spindle to which tools are attached. The spindle is mounted
on a mobile structure called the ram. The ram can move in the vertical (Z) direction along
guideways and is mounted on a Y -stage (carriage) which, in turn, is mounted on an X-stage
(carriage). Thus the tool can be positioned in three-dimensional X − Y − Z space within
the permissible range of the movement of the carriages and the ram. It is imperative that
the ram is stiff and light to ensure a high accuracy of the finished product at a high speed of
operation, thus reducing the machining time. It is also required that the damping capacity of
the ram is high to minimise vibration response levels. Also of significant influence on the final
precision is the thermal integrity of the structure. A gradient of temperature in the machine
structure of few degrees centigrade, arising from long term changes in ambient temperature
conditions, can lead to thermal distortions of the ram and the machine structure; these will
compromise the machining precision. Thus the requirements for an ideal ram structure are:
high stiffness and damping, and low mass and thermal sensitivity.
Conventional designs of machine tool ram structures are stiffness-governed rather than
strength-governed and are based on cast iron/welded-steel tubular structures with longitudi-
nal and transverse stiffeners. A potential alternative is to use sandwich tubular construction.
This could be attractive from two considerations: a sandwich construction eliminates the
need for stiffeners, giving lower mass compared to a monolithic hollow tube for compara-
ble stiffness (for detailed comparisons see for example2,3), and the openings provided by a
sandwich core impart multi-functionality to the structure. The multi-functionalities include:
integrated Fiber Bragg Grating (FBG) sensors to monitor distortions associated with ther-
mal drift, active internal thermal cooling down the channels of the corrugated core, and
additional damping when the core is filled with a low density viscoelastic foam.
Metallic cellular materials4, metallic and polymeric foams5 and composites are increas-
ingly finding application as multi-functional structures in the automotive and aerospace
industries. Application of these materials in the precision machine tool industry is the sub-
ject of this paper. A corrugated (prismatic) core sandwich tubular structure is proposed to
serve as a ram in a milling machine. The details of manufacture and results from vibration
3
tests conducted on the ram are presented. The measured vibration properties of the ram
are compared with finite element (FE) predictions, thus verifying the stiffness indirectly.
The paper is organised as follows. Design constraints on the ram structure are outlined
in Section II. An optimisation study is used to select the final design. The static stiffness of
this design is evaluated using finite element calculations as described in Section III. Salient
steps in the manufacturing of the ram are summarised in Section IV. Vibration tests aimed
to evaluate the natural frequencies and damping factors of the built-up structure are given
in Section V. Finally, conclusions are drawn in Section VII.
II. DESIGN CONSTRAINTS
A typical high speed milling machine is shown in Fig. 1 with the main components
labelled. The focus of the present study is the structural component labelled as the ram.
The constraints on the design of such a structure can be broadly classified into four groups:
geometrical, structural, thermal and economic. Geometric constraints are restrictions on
the overall size of the structure. In the present context, geometrical constraints are those
imposed on the cross section: the width (B), the height (H) and the inner space (W )
required for the mounting of a spindle (see Fig. 2). These constraints were chosen to make
the ram structure compatible with an existing milling machine. Structural constraints can
be sub-divided into static and dynamic. Static structural constraints exist on the mass of the
structure and on the stiffnesses kxx, kyy and kzz in the three cartesian directions X, Y and Z
respectively. These stiffnesses are evaluated at the tool central point (TCP) which is located
at the end of the spindle where tools are attached (see Fig. 1). Dynamic structural constraints
are specified in terms of damping, natural frequencies and vibration levels over a frequency
range. Here, it is assumed that the design is governed by static stiffness constraints. It is
worth noting that the static and dynamic constraints are not independent. For example,
a structure with low mass and high stiffness will have its fundamental natural mode of
vibration at a high frequency. Thermal constraints on the design are not specified in this
study. Thermal stresses due to thermal mismatch between the ram and the rest of the
machine are expected to be less important, since the ram is made of steel. Economic
constraints are primarily specified in terms of the overall manufacturing cost, although a
detailed life-cycle costing would be more appropriate. The main constraints on the present
4

design are specified in Table I.
An optimisation study has been conducted for the static stiffness of a sandwich tubular
structure with prismatic core and is described elsewhere6,7. Only a summary of this related
study is given here. The objective function to minimise is the total mass of the structure
while the geometric variables such as the width B, the height H and the facesheet thickness
t of the sandwich tube are allowed to vary within the specified bounds as given in Table I.
Optimisation constraints are on the stiffness and the geometry of the structure as specified
in Table I. To simplify the optimisation study, features such as an access window (see Fig. 1)
are ignored.
The optimisation task has been carried out by a sequential quadratic programming al-
gorithm8 implemented in MATLAB. The core morphology such as core height, core length
and thickness of the core sheet are fixed as shown in Fig. 2(b) throughout the optimisation
process. The optimisation procedure requires an initial guess for the free variables such as
the width (B), the height (H) and the facesheet thickness (t) of the sandwich tube. The
initial values are chosen based on the lower bounds for B and H as specified in Table I, and
a realistic value for the facesheet thickness t is chosen. For this choice of parameters, the
stiffness at TCP can be evaluated by modelling the sandwich tube as a Timoshenko beam.
This has the advantage that the stiffness at TCP of the sandwich tube can be expressed in
terms of the free variables B, H and t. The parameters B, H and t were then varied until
a minimum mass configuration was achieved while fulfilling the stiffness constraints. The
optimised values for these parameters are: t = 2 mm, H = 308 mm and B = 203 mm.
Further details on the optimisation can be found in6,7.
III. FINITE ELEMENT ANALYSIS
Since the optimisation study is idealised, a final verification of the design is required
before a prototype is built. A finite element model has been developed, with all the features
of the ram, such as the windows and guideways, as shown in Fig. 3, using PATRAN and
analysed using ABAQUS. The panels are modelled using the four-noded QUAD elements
while the solid back face is modelled using the eight-noded HEX elements. Multi-point
constraints are used to model the transfer of loads from the the tool central point, labelled
as TCP in Fig. 1, to the ram. The model is evaluated for the static stiffness of the structure
5

in the three directions: the two in-plane (X and Y ) directions and the axial (Z) direction
at TCP. The numerical values for the stiffness are summarised in Table I: they all meet the
required targets. The FE model was also used to predict the natural frequencies of the ram,
as will be discussed later.
IV. MANUFACTURE
The ram consists of sandwich panels on the four sides, and a monolithic back face to
interface with the milling machine as shown in Fig. 2(b). Steel sheets were folded into U-
shapes to form the face sheets (inner and outer) of the sandwich panels. Prismatic cores
(labelled I to IV in Fig. 2(b)) were folded from a planar steel sheet. Given the constraints
on accessibility and feasibility, an adhesive bonding technique was preferred to welding
and rivetting9. A thixotropic toughened epoxy adhesive (available commercially as DP 490
from 3M Scotch-Weld10) was chosen after trials on a range of adhesives. The recommended
procedure for adhesive bonding was followed9: roughening the bonding surfaces by sandpaper
followed by cleaning the surfaces with liquid isopropyl alcohol (IPA). A manual applicator
gun was used to apply uniform adhesive layers on the required bonding areas, and the
adhesive bond was allowed to cure under pressure applied by deadweights.
The sandwich steel structure was assembled in the following sequence. First, the core I
in Fig. 2(b) was bonded to the monolithic back face and the face sheet was bonded on top
to complete the back sandwich panel. Second, the ends of the inner U-panel were bonded to
the monolithic back-face. Then the inner U-panel was adhesively bonded to the monolithic
back-face and also to the front and rear flanges. The corrugated cores II, III, and IV were
bonded to the inner U-panel. Finally, the outer U-panel was bonded to the cores II, III and
IV and to the monolithic backface.
V. VIBRATION TESTS
Vibration tests were performed to measure the natural frequencies and damping (Q fac-
tors) of different vibration modes of the ram within the frequency range 0 − 1 kHz. The
ram was supported in two free-free configurations using elastic cords, as shown in Fig. 4.
The test protocol was as follows. An impulse excitation as shown in Fig. 5 was applied
6

using an instrumented hammer in different directions at six equally spaced points on each
of the three sides of the tubular structure. The vibration response (acceleration) at one of
the free ends was measured using accelerometers (DJB A 20) mounted on each face of the
ram (see Fig. 4). The signals from the impulse hammer and the accelerometers were passed
through charge amplifiers (DJB CA 4270) and acquired in digital form onto a computer
using a data acquisition card (NI DAQ 6023 E). The data was acquired for a total dura-
tion of 2 seconds at 20 kHz sampling rate, with a provision made for pre-triggering. This
time duration is adequate to capture the entire decaying response (see Fig. 5). This gives a
frequency resolution of 0.5 Hz.
Typical time series data for the impulse and acceleration response are shown in Fig. 5.
The frequency response function (FRF) H(ω) is calculated from these time series data using
the definition:
H(ω) ≡O(ω)
I(ω)(1)
where O(ω) and I(ω) respectively denote the Fourier transforms of the output and input
time signals in Fig. 5. It is standard practice11 to measure the average of the FRF by
repeating the experiment several times (typically 10 times) so that the coherence function
can be calculated, which gives a quality check on the measured FRF. The coherence function
γ2(ω) at each frequency point is defined as12:
γ2(ω) ≡|Sxy(ω)|2
Sxx(ω)Syy(ω)(2)
where Sxy denotes the cross-correlation between the input and the output while Sxx and
Syy respectively denote the auto-correlation functions of the input and output signals. Co-
herence is a measure of linearity between the input and output: values close to unity (zero
on log scale) indicate adequate linearity12. The amplitude of the averaged FRF is given
in Fig. 6, together with the coherence, for a typical example of the measurement made in
the y direction near the TCP as shown in Fig. 4. Good coherence was seen for all relevant
frequencies from the lowest resonance up to 1 kHz.
Modal parameter identification algorithms, such as circle-fitting11, were applied to the
FRF data surrounding each peak in the amplitude spectrum in Fig. 6 in order to estimate
the natural frequency and Q factor. The circle fitting method relies on the fact that a plot
of real part of H(ω) on X axis and imaginary part of H(ω) on Y axis for FRF data around
7
each resonance peak gives a circle, called the Nyquist plot. A typical Nyquist plot and the
fitted circle are shown in Fig. 7.
VI. DISCUSSION
The measured vibration properties of modes up to 1 kHz are reported in Table II corre-
sponding to the two suspension configurations shown in Fig. 4. Finite element predictions
for the natural frequencies are also included for comparison. It can be seen that the FE
predictions agree with the measurements to a good accuracy. This is a useful result: the
number of measurement points was not sufficient to define the mode shapes completely by
experiment. Given the good agreement between the predicted and measured frequencies,
the predicted mode shapes are taken to be reliable. Certainly, the measured shapes were
found to agree with the FE model at the points measured.
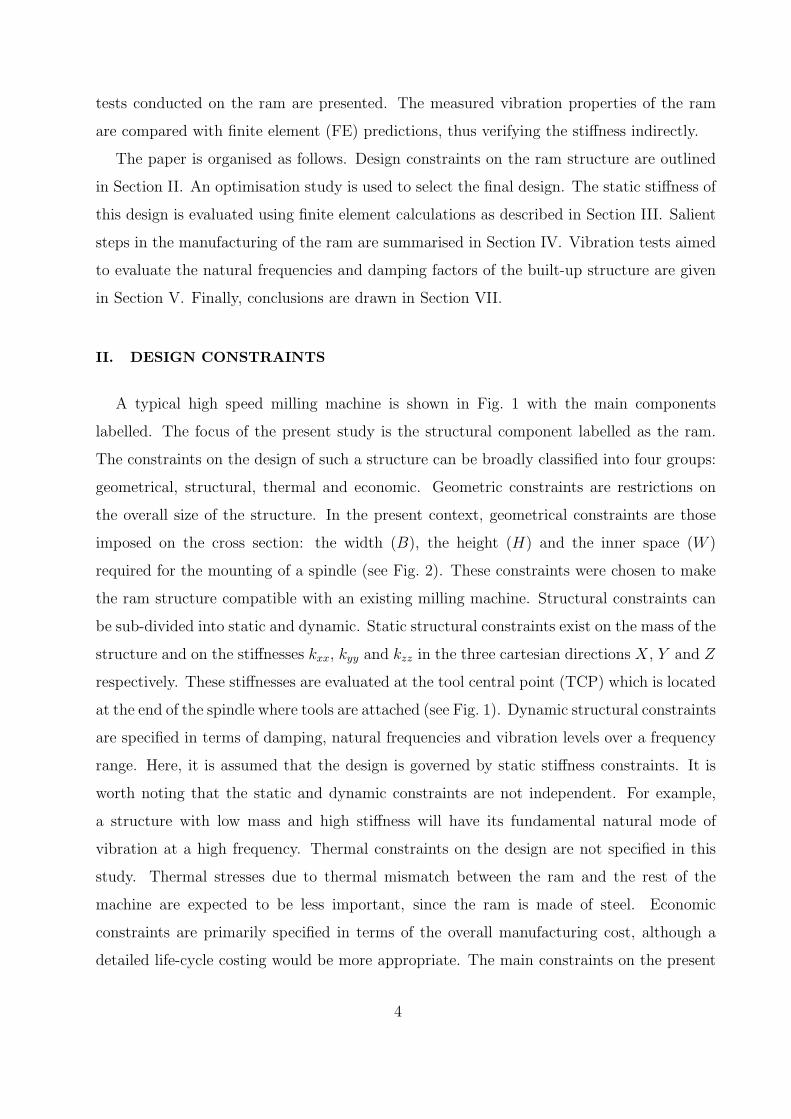
The mode shapes associated with the predicted natural frequencies in Table II are shown
in Figures 8 and 9. The first mode with a natural frequency of 386 Hz is predominantly
a torsional mode as shown in Fig. 8(a). The other modes (2 and 3) in Fig. 8 are also
predominantly torsional modes. The mode shapes in Fig. 9(a) and Fig. 9(e) are dominated
by global flexure of the ram. Both modes resemble the first bending mode of a free-free
beam, vibrating in two orthogonal planes. The presence of the access window has only a
local effect upon the mode shapes. In addition to these global modes of vibration, local
modes are observed. The first and second pinned-pinned modes for the vertical panel are
shown in Fig. 9(b) and Fig. 9(c), respectively. It is concluded from these selected mode
shapes that both global and local modes of vibration are present in the frequency response
within the 0−1 kHz frequency range. Consider Fig. 10 which shows the relative contribution
of the global and local modes to a typical frequency response measured near the TCP. It
can be seen, by comparing the relative peak levels, that the local modes have a smaller
contribution to the overall vibration response. The global modes of vibration dominate the
response at the TCP of the sandwich tubular structure.
It is noted from Table II that the predicted frequency for the first mode of vibration is
higher than the measured value. There are two possible reasons for this: an overestimation
of stiffness or an underestimation of mass in the FE model. Upon comparing the total mass,
it was found that the mass of the ram in the FE model was assumed to be 74 kg whereas
8

the measured mass is 78 kg. The back-face of the ram as tested has not been completely
machined and this contributed to the small additional mass. Other sources of additional
mass are flanges added at the front and rear of the ram structure, and adhesive. The
excellent agreement between the measured and the predicted values for the higher global
flexural modes (modes 4 and 8 in Table II) suggests that the stiffness has been adequately
modelled.
Measured values of the Q-factors for each mode of vibration are included in Table II. It is
striking that the values are sensitive to the choice of suspension for some modes (eg. mode
8) but not for others (eg. mode 7). In any measurement of damping, it is important to be
aware that the support method may add damping to the inherent damping of the structure.
In order to explore the sensitivity of the observed damping to the support configurations, two
different positions of the elastic suspension cords were used. The lower measured value of
damping (higher Q) is always taken to be the more reliable — the true modal damping may
be lower than either. To illustrate this, compare the observed damping of the global flexural
mode (mode 8 in Table II) in the two support configurations. In the first configuration,
labelled suspension 1, the ram was supported longitudinally (see Fig. 4). In the second
configuration, labelled suspension 2, the ram was supported at two points close to the
nodes of the first free-free bending mode (see Fig. 4). It can be seen from Table II that
the second suspension gives much lower damping, the observed level being about as low as
can be expected for a mild steel structure. The measured Q factors for the more reliable
suspension 2 were in the range 100-340. It is anticipated that the level of damping will be
considerably enhanced when the ram is integrated into rest of the milling machine: frictional
and other interfacial effects from the guideways will enhance the damping, particularly for
global modes.
The vibration analysis given above is for a ram without the spindle. The added mass of
a spindle at one end of the ram will lower the natural frequencies. In competition with this
the vibrational frequencies will be increased by the stiffness added by supports when the
ram is inserted into the milling machine. Overall, it is expected that the natural frequencies
will reduce.
9

VII. CONCLUDING REMARKS
Conventional designs of milling machine rams are based upon stiffened steel tubes with
monolithic walls. An alternative, adhesively bonded sandwich tubular structure is proposed.
A prototype has been designed to meet the requirements of static stiffness typical of a milling
machine. The finite element method has been used in conjunction with an optimisation
study to validate the initial design. A prototype was then built and tested for its vibration
properties. The predicted and measured natural frequencies were found to be in reasonable
agreement. This suggests that the structure meets the desired stiffness requirements. A
detailed analysis of vibration test data reveals that the damping loss factors of the built-up
structure, in free-free configuration, vary between 0.3% and 1%. These values are expected
to significantly increase when the ram is interfaced into the rest of the machine. It is evident
that the global vibration modes of the sandwich structure have a major contribution to the
vibration response within the 0 − 1 kHz frequency range. The contribution of local modes,
such as the plate modes of the sandwich panel, is less significant. However, these modes may
be important when the frequency of the forced vibration excited by the spindle matches that
of a local mode frequency. The open core architecture of the proposed structure provides
an opportunity to embed sensors, thermal cooling, and damping enhancement. Efforts are
underway to explore these possibilities.
VIII. ACKNOWLEDGEMENTS
The project “Advanced Hybrid Mechatronic Materials for ultra precise and high perfor-
mance machining systems design” (HYMM) is funded by the European Commission under
the NMP priority (NMP3-CT-2003-505206). The authors wish to thank the partners of the
consortium: Centro Studi Industriali (Italy), Fidia Spa (Italy), Sequoia Automation (Italy),
MS-Composites (France), Fundacion Fatronik (Spain), Czech Technical University, Prague
(Czech republic) and Fraunhofer ISC (Germany). Assistance from Mr. Alan Heaver and
Mr. Simon Marshall of Cambridge University Engineering Department in the manufacture
10

of the ram is gratefully acknowledged.
1 Meo, F., Merlo, A., de la O Rodriguez, M., Brunner, B., and Ippolito, M. “Advanced hy-
brid mechatronic materials for ultra precise and high performance machining systems design”.
Proceedings of IPROMS 2005.
2 Budiansky, B., 1999. “On the minimum weights of compression structures”. International
journal of solids and structures, 36, pp. 3677–3708.
3 Evans, A. G., Hutchinson, J. W., and Ashby, M. F., 1999. “Multifunctionality of cellular metal
systems”. Progress in material science, 43, pp. 171–221.
4 Gibson, L. J., and Ashby, M. F., 1997. Cellular solids: structure and properties, second ed.
Cambridge: Cambridge university press.
5 Ashby, M. F., Evans, A. G., Fleck, N. A., Gibson, L. J., Hutchinson, J. W., and Wadley, H.
N. G., 2000. Metal foams: a design guide, first ed. Butterwurth-Heinemann.
6 Mai, S. P., Fleck, N. A., and Lu, T. J., 2006. “Optimal design of box-section sandwich beams
in three-point bending”. International journal of solids and structures, submitted.
7 Mai, S. P., 2004. Optimal design of G995 and DL155 rams. Technical report, EU-HYMM,
Cambridge university engineering department.
8 Gill, P. E., Murray, M., and Wright, M. H., 1981. Practical optimization, first ed. London:
Academic press.
9 Andrews, D. R., 2000. Soldering, brazing, welding and adhesives, first ed. Institution of pro-
duction engineers, London.
10 “http://www.3m.com”.
11 Ewins, D. J., 2000. Modal Testing, second ed. Research Studies Press Ltd, Taunton, Somerset,
England.
12 McConnell, K. G., 1995. Vibration Testing: Theory and Practice, first ed. New York, Wiley
Interscience.
11

TABLE I: Design constraints on the corrugated-core ram structure (see reference[1]). The param-
eters B, H and W respectively denote the width of cross section, height of cross section and inner
width of the sandwich tube as shown in Fig. 2.
Parameter Target FE model
Stiffness in the X-direction (kxx) ≥ 22 MN/m 25 MN/m
Stiffness in the Y-direction (kyy) ≥34 MN/m 46 MN/m
Stiffness in the Z-direction (kzz) ≥ 220 MN/m 870 MN/m
Mass ≤ 97 kg 78 kg
Outer width (B) 298− 308 mm 308 mm
Height (H) < 204 mm 203 mm
Inner width (W ) ≥ 164 mm
12

TABLE II: Summary of measured vibration properties.
Mode Suspension 1 Suspension 2 Predicted (FE)
Frequency
(Hz)
Q factor Frequency
(Hz)
Q factor Frequency (Hz)
1 386 190 386 200 422
2 434 170 434 208 461
3 538 100 539 190 537
4 745 370 745 290 744
5 780 200 779 140 771
6 - - 848 100 824
7 855 334 856 340 858
8 868 50 872 330 886
13

XY
Z
Ram
TCP
Spindle
Y- Stage
X- Stage
Machine bed
Guideways
FIG. 1: A typical high-speed milling machine with main components labelled.
14

(A)
(B)
I
II
III
IV
FIG. 2: Geometry of a typical milling machine ram structure: (A) front and side views (B) plan.
All dimensions are in mm. 15

X
Y
Z
1
X
ZY
X
Y
Z
FIG. 3: Finite element model of the ram.
16

Suspension 1 Suspension 2
FIG. 4: Experimental set-up for vibration tests. The ram is tested under two free-free support
conditions to check the influence of supports on damping properties: longitudinal support (right)
and support at two discrete points using bungee cors (left). The impulse hammer used can also be
seen in the picture on the left.
17

0 0.01 0.02−0.5
0
0.5
1
1.5
Time (s)
Input (V)
0 0.1−5
0
5
Time (s)
Response (V)
FIG. 5: Typical time history data for the input (impulse) and output (acceleration) response.
The impulse is applied in the y direction slightly away from the accelerometer which measures the
response in the y direction near the TCP (see Fig. 4 where the accelerometers are present).
18

0 200 400 600 800 1000 1200−60
−50
−40
−30
−20
−10
0
10
20
30
Frequency (Hz)
Amplitude (dB)
Coherence
1
2 3 4
5 6
8
7
FIG. 6: Averaged frequency response function (FRF) along with the coherence shown in grey
colour. The impulse is applied in the y direction slightly away from the accelerometer which
measures the response in the y direction near the TCP (see Fig. 4 where the accelerometers are
present).
19

−150 −100 −50 0 50 100 150−250
−200
−150
−100
−50
0
50
Real part (V)
Imaginary part (V)
871.5 Hz
872 Hz
872.5 Hz
871 Hz
870.5 Hz873 Hz
FIG. 7: Typical Nyquist plot and the fitted circle. The measured data points are shown as circles
and the dashed line represents the best fit.
20
(a) Mode 1 (b) Mode 2 (c) Mode 3
FIG. 8: Modeshapes associated with the predicted natural frequencies listed in Table II.
21

(a) Mode 4 (b) Mode 5 (c) Mode 6
(d) Mode 7 (e) Mode 8
FIG. 9: Modeshapes associated with the predicted natural frequencies listed in Table II.
22

720 740 760 780 800 820 840 860 880
−15
−10
−5
0
5
10
15
20
Frequency (Hz)
Amplitude (dB)Global flexural mode (745 Hz)
Global flexural mode (872 Hz)
Local pin−pin panel mode (848 Hz)
Local pin−pin panel mode (779 Hz)
FIG. 10: Contribution of local and global modes to a typical frequency response. Note that the
global mode peaks dominate the response. The impulse is applied in the y direction slightly away
from the accelerometer which measures the response in the x direction near the TCP (see Fig. 4
where the accelerometers are present).
23