a practioner’s perspective: seismic risk … · a practioner’s perspective: seismic risk...
TRANSCRIPT

A PRACTIONER’S PERSPECTIVE: SEISMIC RISK REDUCTION NEEDS FOR
LIFELINE SYSTEMS
by
Stuart D. WernerSeismic Systems & Engineering Consultants
Oakland CA
December 18, 2008
RECOMMENDATIONS TO BE DISCUSSED
Seismic Performance of Lifeline Systems
• Risk Communication
• Multi-Hazard Perspective

SEISMIC PERFORMANCE OF LIFELINE SYSTEMS (NEHRP Plan Objectives 2, 4, 6, 8, 10)
• Need to Assess Seismic Performance in Terms of Unique Characteristics of Lifeline Systems
• Need to Continue to Upgrade Seismic Risk Analysis Procedures of Such Systems
• Need to Improve Understanding of Factors that Affect Lifeline System Resiliency
• Need to Develop Improved Understanding of Effects of Interdependencies

BACKGROUND
• Lifelines Definition
– Utility and Transportation Systems
– Provide Services Essential to Socio-
Economic Fabric of Communities
– Across All Jurisdictions & Localities
– Often Spatially Distributed across Very Large Area
• Consequences of System Disruptionby Any Natural or Man-Made Hazard
– Loss of Service
– Economic Losses
– Emergency Response Impacts
0 3.5 7
miles
Retrofitted BridgesNon-Retrofitted Bridges
LA Highway System

WHAT FACTORS AFFECT SEISMIC PERFORMANCE OF A LIFELINE?
• Component Characteristics– Configuration– Materials of Construction– Seismic Design, Retrofit, Detailing
• System Characteristics– Network Configuration– Link Capacities– Link Redundancies– Component Locations within System– Service Demands

HOW ARE LIFELINE SYSTEM RISKS ANALYZED? Highway System Example
Santa Monica Fault
Mw = 6.6

ESTIMATE SEISMIC HAZARDS: Ground Shaking, Liquefaction, Landslide , Fault Rupture
Ground Motions Ground Displacements

ESTIMATE COMPONENT DAMAGE STATES: Bridges, Approach Fills, Roadways, Tunnels

ESTIMATE POST-EQ SYSTEM STATES: Based on Damage Repair Models
7 Days after EQ 60 Days after EQ
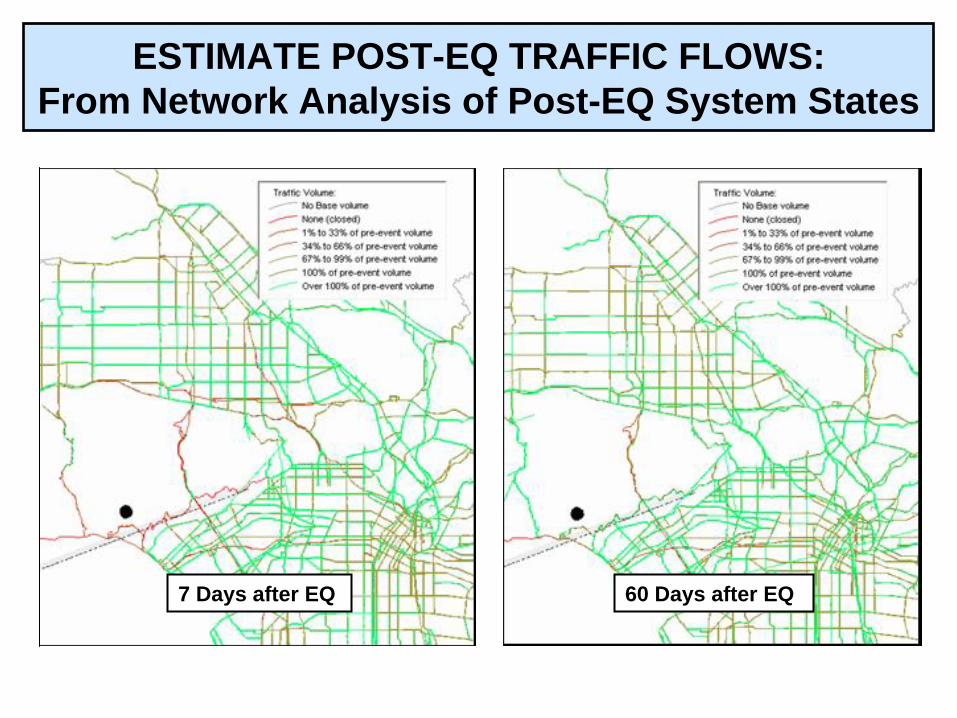
ESTIMATE POST-EQ TRAFFIC FLOWS: From Network Analysis of Post-EQ System States
7 Days after EQ 60 Days after EQ

ESTIMATE LOSSES FROM EQ DAMAGE
Location Increase in Access Time (relative to pre-EQ)
7-days after EQ
60-days after EQ
150-days after EQ
222-days after EQ
UCLA Hospital 9.3% 9.3% 6.4% 0.0%
Van Nuys Airport 3.6% 0.3% 0.3% 0.0%
Encino Commercial Center
20.1% 0.5% 0.5% 0.0%
0.0
1.0
2.0
3.0
4.0
5.0
6.0
0 50 100 150 200 250
Time after Earthquake, days
Los
s pe
r Day
, mill
ions
of
dolla
rs
Total Economic Loss = $540 x 106
Losses
• Economic Losses
• Travel Time Delays
• Trips Foregone
Access Times to Key Locations
Route Increase in Travel Time (relative to pre-EQ)
7-days after EQ
60-days after EQ
150-days after EQ
222-days after EQ
I-405 (San Diego Fwy) from I-10 to LA Airport
134.0% 63.6% 3.0% 0.0%
I-10 (Santa Monica Fwy) from Santa Monica to Downtown LA
209.7% 91.4% 37.6% 0.0%
I-5 (Golden State Fwy) from Burbank to Downtown LA
2.3% 2.0% 1.9% 0.0%
Travel Times along Key Routes
Economic Losses

INITIALIZATIONINITIALIZATION(input data, model parameters)(input data, model parameters)
SYSTEM ANALYSISSYSTEM ANALYSIS(for ith Simulation)
AGGREGATIONAGGREGATION(of Results from all Simulations)
To Next Simulation
CONFIDENCE INTERVALSCONFIDENCE INTERVALS(in loss results thus far)
Not Yet Acceptable
Acceptable -- No More Simulations Needed
PROBABILISTIC ANALYSIS

SYSTEM RISK ANALYSIS: Risk Evaluation Needs
• Improved Models– Scenario EQ Occurrences over Time (Walkthrough Tables)– Seismic Hazards– Component Damage States and Repair Requirements– System Risk Analysis– Loss Estimation (Direct and Indirect Losses)
• Data Bases: Input to Risk Analysis– System Configuration and Link Capacities– Component Attributes relevant to Seismic Response– Soils Data relevant to Seismic Hazard Estimation
• Data Bases: Seismic Performance– What Performed Poorly and What Performed Well– Relate to Component Attributes, Conditions, etc.

INPUT DATA FOR PROBABILISTIC SRA: Earthquake Walkthrough Table
Year No. Mw Location
124 6.5 Random Areal Source 127 (Lat124
,
Long124
)
628 5.2 Random Areal Source 51 (Lat628
, Long628
)
1,280 6.8 Calaveras Fault (initial rupture location, rupture
length and direction)1,649 7.2 Hayward Fault (initial
rupture location, rupture length and direction)
2,249 6.2 Random Areal Source 329 (Lat2,249
,
Long2,249
)
.
.
.
.
.
.
.
.
.
• Starting Point: EQ Source Models – From USGS – From Regional Agencies (e.g.,
CGS, CERI, etc.)
• Select Walkthrough Duration (years)
• Randomly Sample Above EQ Models– Establish Number, Magnitude,
and Location of EQ Occurrences during Each Year (0, 1, or more)
• EQ Sources– Known Active Faults– Random Areal Zones

SYSTEM RESILIENCE
Level of Service
Time
Time of EQ Occurrence
Time when Q0
Level of Service is Restored
t2
– t1

LIFELINE SYSTEM RESILIENCE Issues and Needs
• Investigate Use of Resilience as System Performance Requirement
• Investigate Factors that Affect Resilience– System Enhancements– Repair Methods and Strategies
• Perform Damage-Repair Research– Develop Improved Methods for Rapid Repair of Lifeline Damage– Assess Alternative Repair Strategies (e.g., Bonus Incentive)– Investigate Pre-EQ Repair Planning
• Identify Weak Links in Structure and Expected Repairs• Develop Detailed Designs of Expected Repairs• Facilitates Initiation of Construction Immediately After EQ

RESILIENCE: Use as Lifeline System Performance Requirement
Earthquake System Resilience Requirement
Standard Traffic Flows Emergency Traffic Flows
Frequent Earthquake
T80
≤
2 daysT100
≤
7 daysT80
≤
1 daysT100
≤
1 days
Rare Earthquake T80
≤
30 daysT100
≤
90 daysT80
≤
7 daysT100
≤
30 days
Deterministic Performance Requirement:
Probabilistic Performance Requirement:

LIFELINE INTERDEPENDENCIES e.g.,1995 KOBE JAPAN EARTHQUAKE
Port of Kobe (before earthquake)
Port Damage
Highway System Damage

LIFELINE INTERDEPENDENCE Issues and Recommendations
• Develop Case Histories of Effects of Lifeline Interdependencies– During Past Earthquakes– During Past Occurrences of Other Natural Hazards
• Develop Databases that Specify Particular Interdependencies between Lifelines in Earthquake Prone Municipalities Nationwide
• Develop Guidelines for Interdependent Lifelines– Seismic Risk Evaluation Procedures– Risk Reduction Strategies– Field Exercises– Demonstration Applications
• Develop Oversight and Working Groups– Utility and Transportation Lifeline Representatives– Maintain Collaboration between Lifelines– Establish Directions for Future Activities

RECOMMENDATIONS TO BE DISCUSSED
• Seismic Performance of Lifeline Systems
Risk Communication
• Multi-Hazard Perspective

RISK COMMUNICATION (NEHRP Objectives 2, 3, 8, 9, 13)
• Need to Better Communicate Risk Implications of Alternative Seismic Risk Reduction Decisions for Lifeline Systems
– To Stakeholders
– To Engineers
• Need to Increase Awareness of Seismic Risks to Lifelines Nationally

RISK IMPLICATIONS OF ALTERNATIVE SEISMIC RISK REDUCTION DECISIONS:
Issues
• Alternative Decisions– Various Increasing Levels of Risk Reduction
• Not Possible to Achieve Zero Risk of Unacceptable Performance– Some Residual Risk will Always be Present
• Increasing Levels of Risk Reduction– Will Increase Cost Outlay– Will Reduce Risks

RISK IMPLICATIONS OF ALTERNATIVE SEISMIC RISK REDUCTION DECISIONS:
Issues
• How Much Risk Reduction is Enough?– At What Point are Increased Costs to Further Reduce Risks
No Longer Acceptable/Feasible?
• This Decision will be Specific to Individual Lifeline Agencies– Will Depend on Particular Conditions and Constraints under
which that Agency Operates– Economic, Legal, Political, Administrative, Operational, etc.
• How Can Costs/Relative Risks of Alternative Risk Reduction Options be Better Communicated to Decision Makers?– Facilitate More Informed Selection of Preferred Option

RISK COMMUNICATION TO DECISION MAKERS: “Acceptable Risk”
Analysis of Major Wharf Structure
• Goal: Support Selection of Wharf Design Acceleration
• Probabilistic Risk Analysis for 10,000 Years of EQ Occurrences
• Multiple Simulations of Potential Economic Losses
• Decision = Financial Investment in Seismic Risk Reduction
– Maximize Yield = Minimize Mean Value of Life-Cycle Costs
– Reduce Volatility = Reduce Standard Deviation of Costs
Mean Value of Total Life Cycle Costs
Standard Deviation of Total Life Cycle Costs

RISK COMMUNICATION TO DECISION MAKERS: Recommendations
• Promote Continued Development of Procedures and Guidelines that Facilitate Risk Communication to Decision Makers– Metrics– Forms of Results
• Multidisciplinary– Engineering – Financial – Maintenance/Construction– Risk Analysis – Lifeline Managers

COMMUNICATION OF SEISMIC RISKS TO LIFELINES NATIONWIDE:
Issues
• How to Raise Awareness of Seismic Risks to Lifelines in Areas of U.S. with Moderate Seismicity but Where Infrequent Large EQs
have Occurred in the Past?
– Central and Southeastern U.S.
– Large but Infrequent EQs
Have Occurred
– High Risk if Large EQ Does Occur
• How to Raise Awareness that Significant Lifeline Damage in Major Metropolitan Area (e,g, LA) Could Have Far Reaching (National) Impacts?

COMMUNICATION OF SEISMIC RISKS OUTSIDE OF WEST COAST:
Recommendations
• Develop Comprehensive Assessment of Seismic Risks to Lifelines Nationwide
• Provide Results in Metrics that can be Understood by Public and by Management in Lifeline Agencies throughout CSEUS
• Facilitate Comparison of Seismic Risks to Risks from Other Natural and Man-Made Hazards
• Raise Awareness of These Risks and Their Relative Importance in These Areas
• Justify Funding of Programs to Reduce Risks to Acceptable Level

ASSESS SEISMIC RISKS TO LIFELINES NATIONWIDE Prior Work
• Completed in 1991
• Lifelines– Transportation– Energy– Emergency Services– Water
• Input Data: National Lifelines Inventory– FEMA– USGS
• Results– Loss of Service– Direct and Indirect Losses– For Limited No. of EQ Scenarios

ASSESS SEISMIC RISKS TO LIFELINES NATIONWIDE Scope
• Signficant
Update of ATC-25 Analysis:– Major Technological Advances Since Then.– Updated Inventory Data
• Probabilistic Evaluations would be Desirable (but time consuming)
– Consider Full Range of Potential EQs
and their Occurrence Rates over Time
– Provides More Complete Picture of Absolute and Relative Risks Nationwide
– Estimate Economic Impacts beyond Damaged Area (nationwide)
• Use Readily Understood Metrics and Presentation Strategies– Clearly Demonstrate Socio-Economic Risks of Earthquake-
Induced Damage and Disruption of Lifelines in these Regions

RECOMMENDATIONS TO BE DISCUSSED
• Seismic Performance of Lifeline Systems
• Risk Communication
Multi-Hazard Perspective

MULTI-HAZARD PERSPECTIVE
• Basic Principal (ALA)
– Actions that Minimize Effects of Seismic Risks to Lifelines can Also Improve Performance of Lifelines Subjected to Other Natural Hazards and Man-Made Hazards (and Vice Versa)
• Recommendation
– Initiate Exchanges and Collaborative Projects between Specialists in Lifeline Engineering and Risk Reduction from
• Earthquakes• Other Natural Hazards (e.g., Flood, Extreme Wind)• Man-Made Hazards
• Possible Benefits
– Improved Basis for Reducing Risks to Lifelines from All Hazards
– Increased Efficiencies: Take Advantage of What Others have Learned
– Might Multi-Hazard Approach Expand Funding Opportunities?

ALA PROJECT: LIFELINE INTERDEPENDENCIES DURING 2004 FLORIDA HURRICANE SEASON
Some Conclusions of Interest
• Damage to electric power distribution systems initiated patterns of cascading failures in dependent lifelines, including communications, transportation and water and wastewater.
• Critical lifeline interdependencies significantly expanded the impact of the hurricanes and complicated response and recovery processes.
• Strategies to decouple lifeline systems, by providing alternative supply through redundancy or distributed supply, were successful in some cases.

FURTHER QUESTIONS/DISCUSSION?