a plan for agricultural business in the greater lansing region
TRANSCRIPT

A Plan for Agricultural Business in the Greater Lansing Region
October 2011

Page 2 of 24
ACKNOWLEDGEMENTS
Clinton, Eaton, and Ingham Counties, in cooperation with Tri-‐County Regional Planning Commission and with support from a Michigan State University Project GREEEN grant led the development of this plan to enhance agricultural economic development in the Greater Lansing region. Those directly involved in the project include:
Project Partners John Czarnecki, Clinton County Economic Alliance, Retired Claudine Hannold, Eaton County Community Development
Sandra Gower, Ingham County Economic Development Corporation Ed Reed, Delta Township Economic Development Corporation
Stacy Byers, Ingham County Farmland and Open Space Preservation Board and Clinton County Agricultural Preservation Board
Susan Pigg, Christine Hnatiw and Harmony Gmazel, Tri-‐County Regional Planning Commission
Steven Miller, Center for Economic Analysis, Michigan State University Mary Beth Graebert, Melissa Gibson, Tyler Borowy, Ryan Soucy and Mark Jones, Land
Policy Institute, Michigan State University
Advisory Committee John Forell, Eaton County Commissioner and farmer
David Roberts, Eaton County Farmland Preservation Board Chair Steve Thelen, Clinton County farmer
David Pohl, Clinton County Commissioner Jake Wambaugh, Ingham County Farmland and Open Space Preservation Board Laurie Koelling, Tanebaum Farms and Ingham County Farmland and Open Space
Preservation Board Dallas Henney, Leslie Township Supervisor, farmer, and Ingham County Farmland and
Open Space Preservation Board
Prepared by Kuntzsch Business Services, Inc. Rachel Kuntzsch, President
Meredith Johnson, Program and Policy Coordinator
Study Participants The research for this plan was made possible with the cooperation of farmers, agribusiness owners, elected officials, economic developers, planners, and landowners who attended forums, provided valuable input, and completed surveys.

Page 3 of 24
A. Table of Contents Introduction .............................................................................................................................. 4 Why Agriculture is Important to the Greater Lansing Region ................................. 5 The Economic Impact of Agriculture in the Greater Lansing Region ..................... 6 Our Planning Process ............................................................................................................. 8 Challenges to Agricultural Economic Development in Our Region ........................ 9 Opportunities for Agricultural Economic Development in Our Region ............. 14 Recommendations ............................................................................................................... 17 Conclusion ............................................................................................................................... 22 APPENDICES ........................................................................................................................... 24

Page 4 of 24
Introduction In the Greater Lansing counties of Clinton, Eaton, and Ingham, agriculture contributes approximately $450 million each year to our local economy and more than 5,000 jobs to our residents. Despite its importance to our region’s prosperity, local economic development planners often neglect to include the agricultural industry in their planning efforts. Economic development planning on a regional level that views the agricultural sector as an asset and supports agriculture industries will help our communities ensure their prosperity. This plan provides guidance for harnessing our local agriculture industry’s potential to drive future economic development for the region. The greater-‐metropolitan area of Lansing includes The City of East Lansing, Delta Charter Township, Delhi Charter Township and Meridian Charter Township. Other municipalities within the region include St. Johns, DeWitt, Charlotte, Eaton Rapids, Grand Ledge, Mason and Williamston. Our urban and suburban population provides substantial demand for fresh, local foods, while the significant amount of farmland can meet this demand. And while the total number of farms in the region has decreased over the last ten years, the total farm acreage has increased.1 The region continues to maintain and build upon its rich history in agriculture production. Despite the substantial job loss in the auto industry, the Lansing area has the unique opportunity to capitalize on its agricultural assets by planning for agricultural business. In order to grow as a viable industry, local farmers must adapt to changes by developing new markets, products, ways of doing business, and partnerships; and local economic developers should assist them in doing so. A hypothetical 5% increase in agricultural sales would create an additional $3.4 million in labor income, $5.7 million in property-‐type income, 259 new jobs and $22 million in economic output.2 This plan provides recommendations for improving the viability of agriculture and related industries, creating job opportunities, encouraging agricultural entrepreneurship, and driving economic prosperity. Specifically, these recommendations will help our agricultural community take innovative measures to 1 Michigan State University Land Policy Institute. (2011). Tri-County Agriculture: The Status, Conditions and Economic Impacts. East Lansing, MI. 2 Michigan State University Land Policy Institute. (2011). Tri-‐County Agriculture: The Status, Conditions and Economic Impacts. East Lansing, MI.

Page 5 of 24
increase the profitability of their farm businesses. They will also help local economic development professionals and land use planners recognize opportunities provided by agriculture-‐based businesses and link these businesses to critical incentives and opportunities.
Why Agriculture is Important to the Greater Lansing Region Agriculture in the Greater Lansing area provides significant economic support to the region while contributing to our unique cultural, environmental and social qualities. Farmers Produce and Market Locally Grown Foods Farmers in the Greater Lansing area have taken advantage of opportunities for marketing food to local consumers. Local farms provide a unique opportunity for residents to enjoy locally grown food, support the region’s farming heritage and economy and improve our quality of life. The Greater Lansing region hosts a multitude of farmers’ markets and roadside stands, providing fresh, healthy food to residents in rural, suburban, and urban areas. Our Region is an Agri-‐Tourism Destination Agri-‐tourism is a way of life for many in our area. In the fall, cider mills, pumpkin patches, and corn mazes draw thousands of visitors from the region’s population centers. Bed and Breakfasts located near farms attract visitors who are seeking to escape their busy lives to be nearer to open spaces. Increasingly, we look to agriculture as an entertainment source – visiting local farms to harvest Christmas trees or pick fruits and vegetables. Farms Contribute to our Unique Rural Character Many of us enjoy living in close proximity to open spaces and take advantage of the provisions and recreation that small towns supporting nearby farms provide. Charlotte, Grand Ledge, Williamston, DeWitt and St. Johns, which support the farming industry through infrastructure and marketing opportunities, each have unique, historic identities with which residents feel a special connection. These small towns and the surrounding rural areas also provide the opportunity for city dwellers in Lansing and surrounding suburbs to enjoy open lands without traveling great distances.

Page 6 of 24
Farms Limit Sprawl and Reduce Service Requirements for Local Governments Farmland provides another economic benefit to our region by lowering the level of services that local governments must provide. Agricultural lands do not demand sewer, utility, educational, and social services from local governments. Sustaining agriculture in the Greater Lansing region also helps to limit development pressure, while encouraging development in existing cities and villages where government services already exist. Our Farms Help Preserve the Natural Environment Agriculture allows for large expanses of land that help to preserve our region’s
natural environment. Farms help to minimize erosion, recharge groundwater, and sequester carbon, contributing to the health of the region’s residents while enhancing the quality of life that is attractive to new residents. Farms provide land suitable for many animal species, making hunting a sustainable economic activity in the region.
The Economic Impact of Agriculture in the Greater Lansing Region
Agriculture is a Significant Part of Our Economy Today In the Greater Lansing area, agriculture provides for 5,182 jobs3, which is more than the 4000 jobs that the local information technology sector provides,4 and $437 million in economic output, which is more than the $427 million that the local supply chain and logistics sector provides (see Figure 1).5 6 The region’s total agricultural sales are $320 million, but also add about $117 million in indirect and induced economic impact.7 However, the level of production in our region is not reflective of the amount of land engaged in farming practices, indicating a lower level of productivity compared to other regions of the state. The Greater Lansing region’s 3,409 farms and 679,982
3 Number includes direct, indirect and induced jobs (i.e. supply chain businesses and those contributing to the agriculture sector). 4 “Information Technology.” LeapInc. LeapInc. n.d. Web. 6 July 2011. 5 “Supply Chain Management and Logistics.” LeapInc. LeapInc. n.d. Web. 6 July 2011. 6 Michigan State University Land Policy Institute. (2011). Tri-County Agriculture: The Status, Conditions and Economic Impacts. East Lansing, MI. 7 United States Department of Agriculture. (2007). Census of Agriculture. Washington, DC: U.S. Government Printing Office.

Page 7 of 24
farmland acres comprise 6.8% of Michigan’s land base and 6.1% of Michigan’s total number of farms but contribute only 5.6% of Michigan’s total agricultural sales.
Figure 1: Current Contribution of Agriculture to the Greater Lansing Region’s Economy8 Regardless, agriculture has an economic impact that extends beyond crop production. Many non-‐agricultural businesses in our region supply the needs of farmers with farming equipment, electricity, petroleum, hired farm labor, and feed. After foods are harvested, they are stored, packed, shipped, and sold – creating a demand for jobs and putting more money into the economy. In order to sustain their businesses, agricultural producers must invest in real estate, capital and livestock, requiring loans and interest paid on those loans. Acreage and Production have not Changed in Recent Years Between 1997 and 2007, the number of farms in the region decreased but acreage and production remained relatively the same. Our region’s portion of the state’s farms, acreage and total sales of agricultural products (see Figure 2) have remained virtually unchanged from 1997 to 2007. The majority of regional sales are from crops, which were reported to be nearly $145 million in 2007 (adjusted to year 2000 dollars). Apart from regional sales figures, Clinton County’s greatest sales were from milk and other dairy products, and Ingham and Eaton County’s highest sales were from grains, oilseeds, dry beans, and dry peas. During the 10-‐year period between 1997 and 2007, agricultural sales were fairly evenly distributed between crops and livestock, with sales from crops exceeding those of livestock products by $23.6 million in 2007. More than 83% of crop sales came from grains, oilseeds, dry beans and dry peas in 2007 with corn and soybean 8 Table created by Land Policy Research at the Land Policy Institute, Michigan State University, 2011. Data from IMPLAN and the United States Department of Agriculture. (2007). Census of Agriculture. Washington, DC: U.S. Government Printing Office
Impact Category Direct Indirect Induced TotalLabor Income $35,649,535 $20,197,015 $12,461,951 $68,308,501Property-Type Income $82,409,608 $24,078,052 $7,900,661 $114,388,320Employment (People) 4,281 527 373 5,182Value of Output $320,788,996 $77,966,081 $38,283,211 $437,038,288
Figure 2: Tri-‐County Sales Compared to State Sales
Page 8 of 24
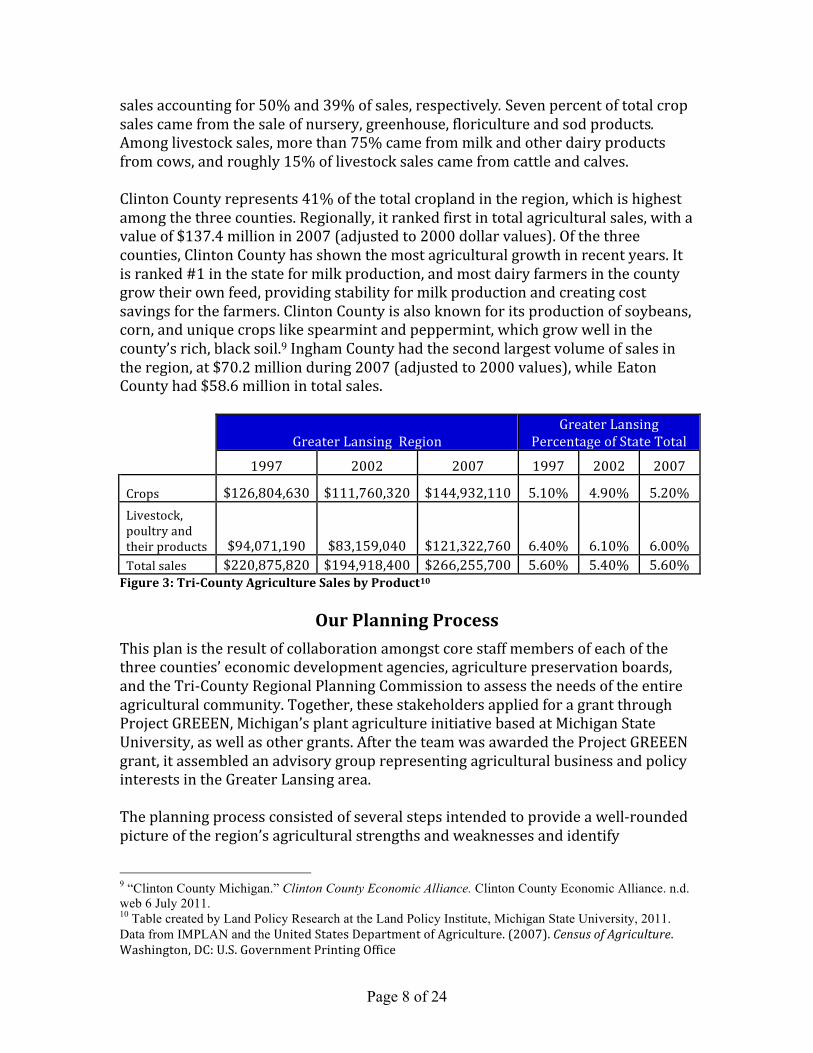
sales accounting for 50% and 39% of sales, respectively. Seven percent of total crop sales came from the sale of nursery, greenhouse, floriculture and sod products. Among livestock sales, more than 75% came from milk and other dairy products from cows, and roughly 15% of livestock sales came from cattle and calves. Clinton County represents 41% of the total cropland in the region, which is highest among the three counties. Regionally, it ranked first in total agricultural sales, with a value of $137.4 million in 2007 (adjusted to 2000 dollar values). Of the three counties, Clinton County has shown the most agricultural growth in recent years. It is ranked #1 in the state for milk production, and most dairy farmers in the county grow their own feed, providing stability for milk production and creating cost savings for the farmers. Clinton County is also known for its production of soybeans, corn, and unique crops like spearmint and peppermint, which grow well in the county’s rich, black soil.9 Ingham County had the second largest volume of sales in the region, at $70.2 million during 2007 (adjusted to 2000 values), while Eaton County had $58.6 million in total sales.
Greater Lansing Region Greater Lansing
Percentage of State Total
1997 2002 2007 1997 2002 2007
Crops $126,804,630 $111,760,320 $144,932,110 5.10% 4.90% 5.20% Livestock, poultry and their products $94,071,190 $83,159,040 $121,322,760 6.40% 6.10% 6.00% Total sales $220,875,820 $194,918,400 $266,255,700 5.60% 5.40% 5.60% Figure 3: Tri-‐County Agriculture Sales by Product10
Our Planning Process This plan is the result of collaboration amongst core staff members of each of the three counties’ economic development agencies, agriculture preservation boards, and the Tri-‐County Regional Planning Commission to assess the needs of the entire agricultural community. Together, these stakeholders applied for a grant through Project GREEEN, Michigan’s plant agriculture initiative based at Michigan State University, as well as other grants. After the team was awarded the Project GREEEN grant, it assembled an advisory group representing agricultural business and policy interests in the Greater Lansing area. The planning process consisted of several steps intended to provide a well-‐rounded picture of the region’s agricultural strengths and weaknesses and identify
9 “Clinton County Michigan.” Clinton County Economic Alliance. Clinton County Economic Alliance. n.d. web 6 July 2011. 10 Table created by Land Policy Research at the Land Policy Institute, Michigan State University, 2011. Data from IMPLAN and the United States Department of Agriculture. (2007). Census of Agriculture. Washington, DC: U.S. Government Printing Office

Page 9 of 24
opportunities for change. Early on, the project partners commissioned the Land Policy Institute at Michigan State University (MSU-‐LPI) to develop a methodology to gather and analyze data on agricultural production, which they shared at stakeholder meetings. To develop a plan for growing the viability of agriculture in the Greater Lansing region, it was critical to examine the region’s current agricultural profile and benchmark the sector’s economic impact. To that end, the project partners engaged MSU-‐LPI to develop a report, previously referenced – Tri-‐County Agriculture: The Status, Conditions, and Economic Impacts, which examines the Greater Lansing region’s agriculture makeup. The Report, contained in the appendices, highlights county-‐level statistics on agricultural production and sales, examines changes that occurred between 1997 and 2007, and estimates the agricultural sector’s impact on the economy. In order to get an “on the ground” assessment of the relationship between agriculture and economic development and establish goals for improving agricultural economic development in the region, a survey was distributed to farmers throughout the region with the assistance of Clinton, Eaton and Ingham County Farm Bureaus. The responses were used to develop the challenges and opportunities section of this plan and to identify recommendations for improving the region’s agricultural economy. The survey results, included in the appendices, can continue to be used to shape future agricultural economic development decisions. Farmers were asked to join local and regional planning officials, economic developers, agribusiness owners, and policy makers at the discussion forums. At these forums, participants, through small groups, responded to questions about challenges and opportunities impacting the region and determined. These discussions also helped inform this plan’s recommendations.
Challenges to Agricultural Economic Development in Our Region While agriculture has a significant impact on our region, there are challenges that hinder its growth. Part of our planning process was to seek out and identify these challenges. The following highlights primary challenges identified by regional stakeholders including farmers, economic developers, planners, agribusiness owners, and other community leaders who responded to a survey or attended a discussion forum. The survey and discussion forums, along with the Report

Page 10 of 24
referenced above, provided evidence that agriculture in the Greater Lansing region is fairly strong but faces some challenges, including conflict between agriculture and non-‐agriculture communities, and balancing environmental and quality of life values with the need to retain agriculture. A Lack of Processing Facilities Hinders Our Farmers Currently, there are no meat processing plants in the Greater Lansing area. ADM, Cargill and Tyson are the only three plants in the state, and they are located outside of the region. Because farmers are required to ship their raw goods to these locations, transportation costs are high and it becomes less likely that farmers will sell their products locally. According to the survey and the discussion forums, the Greater Lansing region lacks critical infrastructure for effective marketing of agricultural products. In addition to heightened transportation costs for getting products to processing facilities, there are few inexpensive options for farmers to transport their goods to market both within the region and to consumers outside the region. Zoning Regulations May Not Recognize Innovative Practices Participants in the discussion forums noted that zoning may limit agricultural use, particularly that which goes beyond traditional farming. Zoning regulations may not support new, innovative business opportunities (e.g. roadside farm stands, u-‐pick farms, biofuel production). Local ordinances may inadvertently stifle entrepreneurship through property maintenance codes or signage limitations. At the same time, as more residential development occurs in rural farming areas, incompatible uses between residents and the agricultural community become apparent, which could further limit innovative practices. Agriculture Lacks Support from Policymakers Some survey respondents and forum participants contend that policymakers do not provide adequate leadership for developing pro-‐farming policies and resist supporting the region’s agricultural economy as compared to its manufacturing economy. Studies support these observations -‐ government investment in food and agriculture in Michigan falls behind most other states.11 11 Cocciarelli, S., Smalley, S. and Hamm, M. (2011). Farm Viability and Development: Michigan Good Food Work Group Report No. 4 of 5. K. Colasanti (ed.) East Lansing, MI.

Page 11 of 24
Inactive Farmers Networks or Cooperatives Farmers Networks and Cooperatives can reduce costs by helping farmers market goods while reducing the amount of time farmers must spend away from their farms. Without the support of networks and cooperatives, farmers spend precious time attempting to market their own goods or have little choice over who buys their goods. This reduces the capacity for farmers to explore other revenue-‐building activities, like producing new varieties of specialty crops or starting an agribusiness enterprise on their farm. Lack of Access to Capital Many individuals who have the interest and knowledge to farm, including young farmers, have difficulty acquiring the necessary capital for starting a new agricultural business. According to the Chicago Federal Reserve Bank, Michigan farmland value has increased by better than ten percent, in contrast to a continuing decline in residential property value.12 This makes costs related to purchasing agricultural land relatively high in comparison to other opportunities. Farmers in our region may have difficulty accessing capital because they lack personal equity, are unable to convey farm production knowledge or establish a personal credit plan, and/or they lack a business plan or the ability to project a realistic cash flow.13 In addition there are few institutions in the region other than Greenstone Farm Credit Services that support agriculture, leaving farmers few options for lending sources. Farmers who wish to start new farm-‐based business start-‐ups, such as u-‐picks and cheese processing operations, face challenges in acquiring loans for these new projects. The lack of capital for expanded operation caps agricultural growth and prevents the production of local products. High Costs and Land Unavailability Limit Farmers’ Profitability Forum participants contend that there is not enough land available for purchase in our region, and even those who have access to land are faced with high fuel, fertilizer, processing and transportation costs. These factors create a barrier for
12 Wittenberg, E. and Hanson, S. (2009). Farmland Values Climb, Farm Earnings Soften. Michigan Farm News, February 15, 2009. 13 Cocciarelli, S., Smalley, S. and Hamm, M. (2011). Farm Viability and Development: Michigan Good Food Work Group Report No. 4 of 5. K. Colasanti (ed.) East Lansing, MI.

Page 12 of 24
younger generations of farming families who wish to continue farming operations as well as those who wish to start new businesses. Even for those who have an operating farm, it is not a given that the farm will generate sufficient revenue to cover farming expenses. More than half of the farmers surveyed either cannot cover expenses or cannot receive a meaningful income from farming (See Figure 4). This encourages some current farmers to sell their land and discontinue farming, and may act as a deterrent to young, qualified entrepreneurs who have the potential to enter the agriculture business.
According to the survey, larger farms tend to be more profitable. Two-‐thirds of farmers whose farm is their primary source of income operated more than 501 acres. Approximately 43% of farmers who indicated their farm is their secondary source of income, operated between 161 and 500 acres. As farm size decreases, more and more respondents answered that revenues do not contribute to total income nor do they cover expenses. In other words, respondents operating larger farms tended to be more financially viable. The average size of farms in the region is 200 acres and 40% of the region’s farms are 10 to 49 acres, which means most farms in our region are probably not profitable or covering costs.14 14 United States Department of Agriculture. (2007). Census of Agriculture. Washington, DC: U.S. Government Printing Office.
Figure 4: Farmer Revenue Generation

Page 13 of 24
Farmers Encounter Development Pressure Even though pressure on local farms to convert to non-‐agricultural uses has slowed somewhat in recent years due to the sluggish economy, 78% of farmers surveyed still feel development pressure is high. The promise of large buy-‐outs and comfortable retirements can be enticing to farmers who face volatile agricultural prices and inconsistent incomes.15 Furthermore, land that is suitable for agricultural production also tends to be desirable land for residential development. 16 If agricultural land is not profitable, it could transition out of agricultural use to residential use. Consumers Lack Knowledge about Farming According to the individuals that participated in the discussion forums, consumers in the Greater Lansing region lack knowledge of the benefits of supporting local agriculture (and the impact of not doing so). Many consumers believe that locally grown specialty items are too expensive for everyday consumption, but know little about the economic and nutritional benefits to consuming locally grown products, or how production of these local foods helps boost local job growth – not just directly on farms, but also at related businesses, such as farm implement dealers. Producers Need Greater Access to Information Based on comments from the discussion forums, producers may lack information about new crop types that can be successful in the region, partly due to limited access to the latest research or market trends. Most farmers surveyed indicated they were sticking to the production they know well rather than diversifying. Skilled Farm Labor is Difficult to Find and Retain Historically, farmers have relied on big families to provide labor for their farming operations. With smaller families becoming the norm and more children going on to college and professional careers outside of farming, the number of capable laborers has dropped significantly. The aging population of the farming sector may create a labor problem, as well. Among farmers responding to the survey, 76% are 50 years old or older, while only 18% are 40 years old or younger (See Figure 5). As farmers age and are no longer able to continue farming operations, there will be fewer young farmers to carry on where they left off.
15 Michigan State University Land Policy Institute. (2011). Tri-County Agriculture: The Status, Conditions and Economic Impacts. East Lansing, MI. 16 Cocciarelli, S., Smalley, S. and Hamm, M. (2011). Farm Viability and Development: Michigan Good Food Work Group Report No. 4 of 5. K. Colasanti (ed.) East Lansing, MI.

Page 14 of 24
Figure 5: Age Range of Survey Respondents
Opportunities for Agricultural Economic Development in Our Region
While there are challenges that hinder the growth of the community, there are countless opportunities to build our agricultural economy. The following highlights opportunities identified by those who responded to a survey or attended a discussion forum. Farmer Commitment to Keeping Farms in the Family Based on the survey responses, farmers in the region are committed to keeping their land in the family. Responding to the survey, 64% of farmers indicated they would not sell their land if offered a fair market value (See Figure 6) and 82% said they would give, sell, or will their land to a family member after they retire. This may indicate a
18-‐29 10%
30-‐39 8% 40-‐49 6%
50-‐59 28%
60+ 48%
Age range of Farmer Survey respondents
Figure 6: Farmer Motivation to Sell Land

Page 15 of 24
desire for farmers to continue to use their land for farming and to pass on agriculture skills to family members. Consumer Interest in Locally Grown Food The region has seen growth in interest for locally grown food and the benefits they provide. Currently, there are many farmers’ markets, food co-‐ops, community gardens and community-‐supported agriculture groups operating in the three counties, with distribution occurring in rural and suburban areas as well as the urban neighborhoods of Lansing. It is estimated farmers’ market sales result in an additional 50 cents in indirect or induced sales for every $1 of personal income earned.17 The Greater Lansing region boasts large production of specialty crops, which are conducive to supplying the demand for local foods. In fact, 44% of farmers responding to the survey grow specialty crops. Furthermore, farmers themselves believe that the public interest in locally grown food can benefit their businesses. Of farmers surveyed, 60% agreed or strongly agreed local efforts that support the “local food” movement will enhance their businesses. Government Programs Supporting Agriculture There are several state and federal government programs, which support our region’s agricultural base. Michigan’s Farmland and Open Space Preservation Program enables farmers to enter into development rights agreements with the state, promising to keep the land in agricultural use for a term of years in exchange for income tax benefits and exemptions from special assessments. Also, in recent years, the Michigan Department of Licensing and Regulatory Affairs and the Michigan Economic Development Corporation (MEDC) have provided increased support to agricultural businesses, including grants for farmers’ markets and
hoophouses (greenhouses with plastic roofs that can be used year-‐round for growing produce), and the formation of agricultural alliances in Southeast and Northwest Michigan.18 The Michigan Department of Agriculture and Rural Development (MDARD) provides support to agricultural businesses, including grant opportunities, a website of resources for agricultural business development, and training for food
17 Cocciarelli, S., Smalley, S. and Hamm, M. (2011). Farm Viability and Development: Michigan Good Food Work Group Report No. 4 of 5. K. Colasanti (ed.) East Lansing, MI. 18 Cocciarelli, S., Smalley, S. and Hamm, M. (2011). Farm Viability and Development: Michigan Good Food Work Group Report No. 4 of 5. K. Colasanti (ed.) East Lansing, MI.

Page 16 of 24
safety and pest management, among others. Our three counties also collaborate with MDARD to provide purchase of development rights opportunities for local farmers. The Michigan Agriculture Environmental Assurance Program (MAEAP) helps farms minimize agricultural pollution risks in a cost-‐effective way.19 Sixty-‐six percent of farmers surveyed indicated that the Michigan Right to Farm Act, which protects farmers from nuisance lawsuits, is important to the success of their businesses. The Michigan Right to Farm Act authorizes the Michigan Commission of Agriculture to develop and adopt Generally Accepted Agricultural and Management Practices (GAAMPs), which promote environmental stewardship and help maintain a farmer’s right to farm.20 Federal government subsidies and assistance are also available for area farmers. The Conservation Reserve Enhancement Program (CREP) is a voluntary land retirement program that helps agricultural producers protect environmentally sensitive land, restore wildlife habitat, and safeguard ground and surface water while receiving financial incentives.21 The federal Farm and Ranch Lands Protection Program (FRPP) provides matching funds to help purchase development rights to keep productive farms in active agricultural use.22 Entrepreneurial Farmers Some area farmers make added income by using farmlands for business opportunities other than crop production and livestock. These farmers engage in agri-‐tourism practices such as wineries, u-‐pick orchards, and restaurants that sell prepared food sourced from the farm. More farms are providing opportunities for sport hunting, which brings in revenue. In some places, agricultural zoning provides a community with balance by designating land for farming and other agricultural activities including farmstands and agri-‐tourism. The ability to provide services and products directly to consumers brings opportunity for business growth and continued farming while meeting needs of local citizens.23
19 http://www.maeap.org/maeap 20 http://www.michigan.gov/mdard/0,1607,7-125-1567_1599_47930---,00.html 21 http://www.apfo.usda.gov/FSA/webapp?area=home&subject=copr&topic=cep 22 http://www.nrcs.usda.gov/programs/frpp/ 23 Agricultural Tourism Local Zoning Guidebook and Zoning Ordinance Provisions, Michigan Agricultural Tourism Advisory Commission, 2007, p. 4.
Page 17 of 24
Access to Research and Other Resources Michigan State University (MSU), the nation’s first land grant institution and a leader in agricultural research and education, is located at the heart of the Greater Lansing region. The proximity of farms and local agricultural businesses to MSU provides unique access to research on agricultural best practices, technology advances, and a newly educated farm labor source. MSU Extension works with farmers to increase the success of their business and reach new markets through research and training.
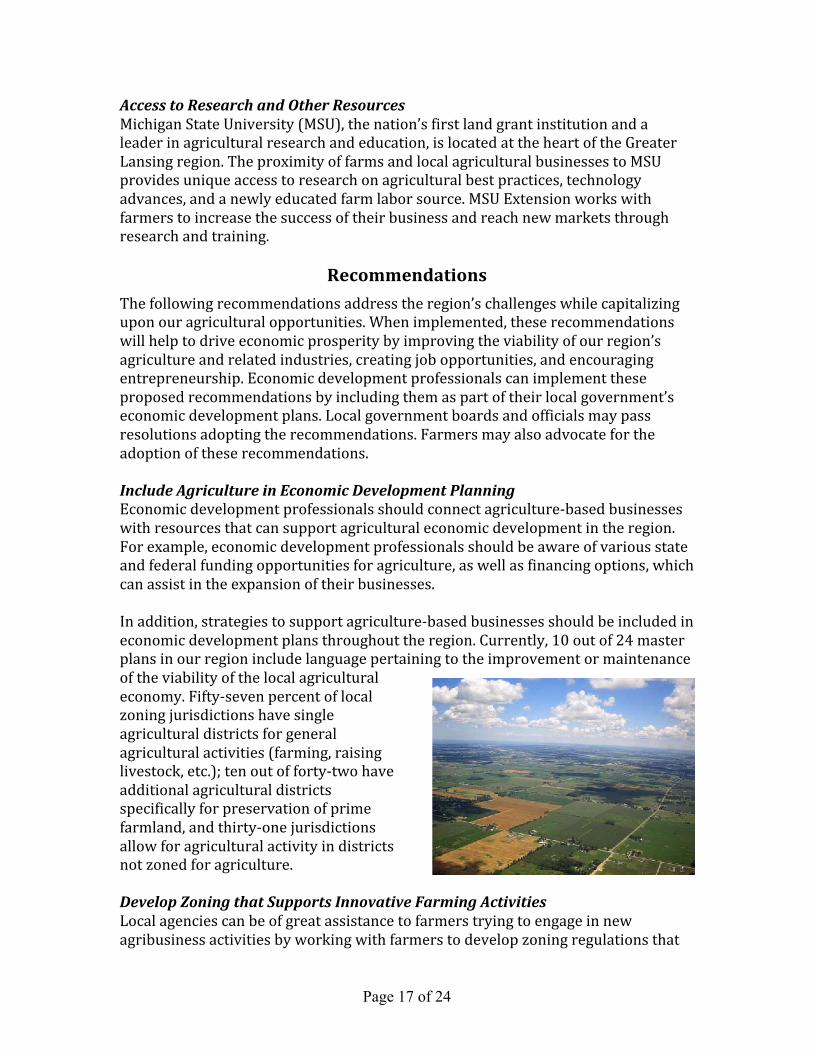
Recommendations The following recommendations address the region’s challenges while capitalizing upon our agricultural opportunities. When implemented, these recommendations will help to drive economic prosperity by improving the viability of our region’s agriculture and related industries, creating job opportunities, and encouraging entrepreneurship. Economic development professionals can implement these proposed recommendations by including them as part of their local government’s economic development plans. Local government boards and officials may pass resolutions adopting the recommendations. Farmers may also advocate for the adoption of these recommendations. Include Agriculture in Economic Development Planning Economic development professionals should connect agriculture-‐based businesses with resources that can support agricultural economic development in the region. For example, economic development professionals should be aware of various state and federal funding opportunities for agriculture, as well as financing options, which can assist in the expansion of their businesses. In addition, strategies to support agriculture-‐based businesses should be included in economic development plans throughout the region. Currently, 10 out of 24 master plans in our region include language pertaining to the improvement or maintenance of the viability of the local agricultural economy. Fifty-‐seven percent of local zoning jurisdictions have single agricultural districts for general agricultural activities (farming, raising livestock, etc.); ten out of forty-‐two have additional agricultural districts specifically for preservation of prime farmland, and thirty-‐one jurisdictions allow for agricultural activity in districts not zoned for agriculture. Develop Zoning that Supports Innovative Farming Activities Local agencies can be of great assistance to farmers trying to engage in new agribusiness activities by working with farmers to develop zoning regulations that

Page 18 of 24
recognize new and innovative farming and agribusiness practices. By working collaboratively, farmers and local agencies can proactively develop zoning that is supportive of business growth. This may be accomplished through inclusion of farmers and agribusiness owners on local zoning boards, whereby stakeholders can develop a shared understanding of how current and future zoning practices help or hinder agriculture. Regional stakeholders could develop a model zoning ordinance conducive to agriculture and agribusinesses to be adopted by local governments, for example. Additionally, local agencies should provide local farmers’ groups and farmer networks with information about the beneficial services available to farmers that are attempting to engage in new agricultural practices. Agencies should also provide farmers with information on how to best work with current zoning regulations and acquire the right permits to engage in on-‐farm activities that will boost production. Encourage Development in Non-‐Agricultural areas In order to preserve productive agricultural land and allow farming operations to occur without pressure from development, commercial and residential growth should be concentrated in non-‐agricultural areas. Local planners and developers should focus new building near existing centers where infrastructure exists. Local planning boards, with the input of farming board members or stakeholders, should focus on this type of “smart growth” and develop zoning laws and practices that support the growth of our region’s agricultural economy.
Attract Agriculture Processing Facilities to the Region Of farmers surveyed, 78% felt that food processing business should be increased in the region. By increasing the number of food processing businesses in the region, farmers would benefit from cheaper, more efficient shipping. Instead of having to send their products 100 miles away or more, shipping distances will be reduced to 10-‐50 miles. Economic developers in the region should work with local farmers to develop innovative strategies for attracting processing facilities to the area. Encourage Agricultural Entrepreneurship Although dairy and row crop production are the strongest agriculture sectors in our region, potential growth opportunities in other areas are significant. The farmers surveyed ranked advanced agricultural technology, commodity crops, and alternative energy as having the most potential for economic growth. Other areas for growth include biomass electrical generation, value-‐added land-‐based products and timber management, local food processing, horticulture and nurseries, farm supply services and organic products.

Page 19 of 24
Some farmers have begun making their farms available to visitors for recreation. Farms make excellent locations for festivals, family reunions, and weddings, and more events of this type could be encouraged through providing farmers with access to marketing resources. Farmers should also be encouraged to find new uses for their products. For example, a Michigan State University researcher found that the cancer-‐fighting drug Taxol can be produced using enzymes from yew trees, a much cheaper method than current semi-‐synthetic organic chemistry approaches24. Local farmers can capitalize upon the discovery of new markets like this to make their businesses more profitable and sustainable. Our region needs to focus resources towards the opportunity for agricultural growth in order to foster agricultural entrepreneurship. Local financial institutions should be encouraged to lend to agricultural producers with new ideas, and processing facilities, suppliers, and agricultural services industries need to be incentivized to locate in our region.
Link Agricultural Activities to Community Development Efforts Local and downtown development activities do not need to occur separately from agricultural economic development opportunities. Downtown development organizations should be encouraged to cooperate with local agricultural vendors. Some localities have embraced opportunities to leverage agricultural and non-‐agricultural local economic growth. Many communities in the region host a farmers’ market in their downtown areas. This provides multiple benefits by drawing people that are primarily there to pick up fruits and vegetables at the farmers market into nearby stores for gifts or lunch, while those who are visiting downtowns to shop at the stores may purchase items from one of the farmers’ market vendors. This scenario allows for increased marketing for both shops and market vendors. The benefits and success of farmers’ markets in the region should be shared with other communities to encourage the expansion of additional markets. Food vendors can also be clustered into food business districts to attract buyers and encourage vendors to work together. The Lansing City Market is an example of a food district that provides exposure for local agricultural producers with value-‐added businesses. Shoppers can purchase fresh fruit and vegetables, stop at a café for lunch, and pick up some gelato or homemade cookies, all purchased from local 24 http://www.in-pharmatechnologist.com/Processing-QC/Effective-biosynthetic-alternative-to-Taxol-production-discovered

Page 20 of 24
producers. Other communities in the region could work with area growers to develop and promote food districts. Advocate for Government Support Our agriculture community should reach out to state and local policy leaders, emphasizing that agriculture and agricultural products should be given equal weight to the re-‐tooling of the auto-‐industry. State government should help support exports from the region and financial capital for agricultural practices. Agriculture-‐related organizations should work to ensure agriculture is incorporated into local economic development planning efforts. According to the farmer survey, 78% of farmers whose farms provide their primary source of income have more than three-‐quarters of their land enrolled in the State of Michigan’s Farmland and Open Space Preservation Program (commonly referred to as PA 116). The majority of respondents whose farms do not provide a primary source of income have no land enrolled in the program. This data may indicate that farmers tend to thrive when they can receive the tax benefits associated with farmland preservation. Regional planners, economic development officials, and policymakers should work with local groups to ensure area farmers are fully aware and take advantage of financial incentive programs such as PA 116, FRPP, CREP and the state farmland preservation program. These groups may consider providing services to area farmers to assist them with the application process to such programs. Market Our Agricultural Products Our region should work to promote the importance and prevalence of agricultural products in our communities, as well as the variety of different types of farming practices, like organic and local. Promotion and education is necessary to achieve a positive public perception of farming in the region, and to help farmers get to know the needs of consumers. Agriculture should be included in local economic development promotion. An inventory of agricultural assets would be a helpful guidance tool for farmers and a source of information for the community as a whole. Regional branding and the location of value-‐added practices, like marketing, processing and distribution, within the region would create a community connection to agriculture and encourage farmers and processors to locate their business and invest here. Consumers and farmers should buy agricultural products and supplies from local suppliers. By focusing demand inward, more dollars will be put into the local

Page 21 of 24
economy, and farmers and suppliers will be encouraged to expand or create new businesses. Our region is home to hundreds of schools, hospitals, colleges, universities and large businesses that have the power to influence the local food supply chain. These entities should be encouraged to source products, such as milk, fruits and vegetables from local producers. To encourage marketing of locally grown food, relationships between local restaurants and local producers should also be encouraged. Improve Access to Financial Resources Revenue sharing, property tax alternatives, cost-‐sharing, tax rebates and grants are all financial incentives that help to attract new farming operations to the community and retain current ones. Tax incentives for farming operations should be encouraged. State agencies can establish loan programs for first-‐time farmers, or provide banks with loan guarantees. MDARD can set aside grants for farm financial planning. Local financial institutions should be educated about the benefits of lending to agricultural businesses and encouraged to do so. Economic development professionals can connect agricultural businesses with the resources needed to apply for SBA loans. Finally, angel investors and venture capitalists should be encouraged to look at entrepreneurial agricultural businesses as a smart way to invest their resources and contribute to the local economy. Improve and Expand Farmers’ Networks Farmers’ networks and co-‐operatives (co-‐ops) are examples of organizations through which farmers share resources that help save costs or encourage innovation and help to expand the capacity of these groups. Economic development coordinators and non-‐governmental organizations should initiate support for these types of networks. Some successful examples of current networks include the Michigan Farmers Market Association, which provides services such as insurance, education, policy support and peer-‐to-‐peer networking to members.25 The Starting Block Incubator in Hart, Michigan provides licensed commercial facilities, entrepreneurial education, and peer-‐to-‐peer networking to food and natural resource related businesses26. Networks should have access to production, market and other data that can show trends in the local food supply chain.
25 http://www.mifma.org/home/ 26 http://www.startingblock.biz/about.htm

Page 22 of 24
Make Information About Local Agriculture Accessible It is critical to educate planners, economic developers, policymakers, retailers, consumers, and youth about what is grown in our region and how supporting local agriculture benefits the economy in the Greater Lansing region. Regional leaders could develop a promotional campaign to educate and collaborate with these audiences to promote local agriculture. Farmers themselves need access to education, including assistance with business plans, production, and management.27 This can be achieved with the development of start-‐up assistance apprenticeships. Access to information on marketing materials, including information on supply, demand, and markets is also crucial. Farmers also need information on best practices and new technologies that could improve or make their operations more innovative, perhaps meeting a certain market need. Groups that provide services to farmers, like the MSU Agricultural Product Center and MSU Extension, and other non-‐governmental organizations, should hold conferences and disseminate newsletters and brochures with information about new agricultural technologies.
Conclusion Agriculture and agriculture-‐based businesses are key drivers to Greater Lansing’s regional economy. This plan was developed to further encourage agriculture economic development in the region. Recommendations include:
• Include Agriculture in Local Economic Development Planning • Develop Zoning that Supports Innovative Farming Activities • Encourage Development in Non-‐Agricultural Areas • Attract Agriculture Processing Facilities to the Region • Encourage Agricultural Entrepreneurship • Link Agricultural Activities to Community Development Efforts • Advocate for Government Support • Market Our Agricultural Products • Improve Access to Financial Resources • Improve and Expand Farmers’ Networks • Make Information About Local Agriculture Accessible
It is the aim of this plan’s authors that local economic developers, planners, agriculture-‐based business owners, farmers, local officials, and other stakeholders will work together to implement these recommendations. Many of these strategies will require additional funding to complete. For example, follow-‐on projects could include: convening stakeholders to draft a model zoning ordinance that is favorable to agribusinesses; identifying and cataloguing resources for farmers, economic 27 Cocciarelli, S., Smalley, S. and Hamm, M. (2011). Farm Viability and Development: Michigan Good Food Work Group Report No. 4 of 5. K. Colasanti (ed.) East Lansing, MI.

Page 23 of 24
development professionals, and zoning officials; or developing a public outreach campaign on agriculture’s impact to the regional economy. Project partners are committed to exploring funding sources to implement this plan, which will support our rich agricultural heritage, create job growth, and enhance our quality of life.

Page 24 of 24
APPENDICES
Tri-‐County Agriculture: The Status, Conditions, and Economic Impacts Report
Farmer Survey Results
Tri-‐County Agricultural Zoning Assessment

A REPORT ON CLINTON, EATON AND INGHAM COUNTIES
MICHIGAN TRI-COUNTY AGRICULTURE
status, conditions andeconomic impactsTH
E
August 31, 2011


BY THE LAND POLICY INSTITUTE AT MICHIGAN STATE UNIVERSITY
08.31.11
Support for this project was provided by Project
GREEEN at Michigan State University and the
W.K. Kellogg Foundation through the People
and Land Initiative, administered by the MSU
Land Policy Institute (LPI) and Public Sector
Consultants. The Land Policy Institute would
like to thank our partners on this project:
� The Tri-County Regional Planning
Commission;
� The Ingham County Agricultural
Preservation Board;
� The Clinton County Economic
Development Alliance;
� The Eaton County Community
Development Department;
� The MSU Department of Agriculture,
Food and Resource Economics; and
� Kuntzsch Business Services.
About Land Policy Research
Research and analysis is supported by the Land
Policy Research (LPR) team at the Land Policy
Institute at Michigan State University.
Tyler BorowyResearch Analyst
Ben CalninData and Informatics Coordinator
Melissa GibsonResearch Manager
Mary Beth GraebertAssociate Director for Programs and Operations
Acknowledgements

repo
rt
TRI-COUNTY AGRICULTURE
In order to ensure that agriculture remains
a sustainable and viable resource for
the Tri-County Region of the Greater
Lansing Area (Clinton, Eaton and Ingham
counties in Mid-Michigan) and a vital part of
the state’s economy, an agricultural economic
development plan is needed to focus regional
efforts and bring greater awareness to the
critical role agriculture and agricultural
businesses can play as part of a comprehensive
economic development strategy. To achieve
this, the Land Policy Institute (LPI) at
Michigan State University (MSU); the Ingham
County Agricultural Preservation Board; the
Tri-County Regional Planning Commission;
the MSU Department of Agriculture, Food
and Resource Economics; the Clinton County
Economic Development Alliance; and the
Eaton County Community Development
Department Alliance partnered to develop
the Tri-County Regional Agricultural Economic
Development Plan. The planning process
consists of five steps, that once complete, will
comprise the Agricultural Economic Development
Plan, including:
� A regional agricultural sector baseline
assessment (this report).
� A series of listening sessions involving
farmers, citizens, local planning
officials, local and regional leaders, and
other policy makers (completed in the
spring of 2011).
� A survey of farmers to assess the
relationship between agriculture and
economic development in the region
(May–June, 2011).
� An assessment of zoning ordinances
and master plans pertaining to
agricultural land uses (June 2011).
� The development of A Plan for
Agricultural Business in the Greater Lansing
Region (August 2011).
This report presents the regional agricultural
baseline assessment of the Tri-County
Region. It highlights county-level statistics on
agricultural production and sales, examines
the changes that have occurred over the
10-year period from 1997 to 2007, in five-
TRI-COUNTY AGRICULTURE: Status, Conditions and Economic Impacts
THIS REPORT PRESENTS THE REGIONAL AGRICULTURAL BASELINE ASSESSMENT OF THE TRI-COUNTY REGION (CLINTON, EATON AND INGHAM COUNTIES) OF THE GREATER LANSING AREA. IT HIGHLIGHTS COUNTY-LEVEL STATISTICS ON AGRICULTURAL PRODUCTION AND SALES, EXAMINES THE CHANGES THAT HAVE OCCURRED OVER THE 10-YEAR PERIOD FROM 1997 TO 2007, IN FIVE-YEAR INCREMENTS, AND ESTIMATES THE REGIONAL ECONOMIC IMPACT OF THE AGRICULTURAL SECTOR.
Executive Summary
i

the status, conditions and economic impacts
land
pol
icy
inst
itut
e
year increments (U.S. Census of Agriculture
information is released every five years),
and estimates the regional economic impact
of the agricultural sector. Having a firm
understanding of the status and conditions of
the agricultural industry and the contribution
it makes to the local economy, and the
promotion of such information and the sector’s
needs, can bring greater awareness to this
sector of the economy—which is often ignored
in economic development planning. This
report is one step in promoting awareness
and understanding of the status of tri-county
agriculture in Mid-Michigan.
When examining agricultural statistics
for the Tri-County Region, Table 1 suggests
that agriculture in the Tri-County Region is
diverse and relatively strong, but that it also
may face some challenges. In 2007, its sales
contributions to Michigan’s agricultural
economy (5.6%) are slightly less than its
percentage of land in farms (6.8%) and its total
number of farms (6.1%). A minor decline in
sales between 1997 and 2002 was overcome by
a sizeable gain between 2002 and 2007. From
1997–2007, tri-county agriculture kept pace
with the state in terms of sales, but did not
exceed the state trend.
As a robust sector of our regional and state
economies, understanding the economic
impacts of agriculture to the regional economy
is necessary for increasing agricultural
awareness and encouraging its incorporation
into economic development plans. Table
2 presents the total economic impact of
agriculture in the Tri-County Region (in 2007
dollar values), which includes:
� $68 million in labor income;
� $114 million in property-type income;
Table 1: Tri-County Region Agricultural Statistics for 1997, 2002, and 2007
Michigan Tri-County RegionTri-County % of
State Total1997 2002 2007 1997 2002 2007 1997 2002 2007
Crops ($1,000) $2,476,501 $2,268,123 $2,763,840 $126,805 $111,760 $144,932 5.1% 4.9% 5.2%
Livestock, Poultry, and Their Products ($1,000) $1,476,796 $1,353,415 $2,011,332 $94,071 $83,159 $121, 323 6.4% 6.1% 6%
Total Sales ($1,000) $3,953,297 $3,621,538 $4,775,172 $220,876 $194,918 $266,256 5.6% 5.4% 5.6%
Number of Farms 53,519 53,315 56,014 3,507 3,418 3,409 6.6% 6.4% 6.1%
Land in Farms (Acres) 10,443,935 10,142,958 10,031,807 702,348 679,152 679,982 6.7% 6.7% 6.8%
Harvested Cropland (Acres) 6,989,300 6,827,903 6,859,081 514,972 515,271 523,490 7.4% 7.6% 7.6%
Sources: Table created by the Land Policy Institute, Michigan State University, 2011. Data from the 2002 and 2007 USDA National Agricultural Statistics Service, Census of Agriculture. Note: See Appendix B for Global Commodity Price Index.
the status, conditions and economic impacts
land
pol
icy
inst
itut
e
ii

repo
rt
TRI-COUNTY AGRICULTUREiii
� More than 5,182 jobs; and
� Approximately $437 million in
economic output.
A hypothetical 5% increase in agricultural
sales would create an additional:
� $3.4 million in labor income;
� $5.7 million in property-type income;
� 259 new jobs; and
� $22 million in economic output.
The Tri-County Region is endowed with
a variety of land cover types. The greater-
metropolitan area of Lansing includes East
Lansing, Delta Township, Delhi Township
and Meridian Township. Several nearby cities
include St. Johns, Dewitt, Charlotte, Eaton
Rapids, Mason and Williamston. Outside of
the region’s urbanized area, predominant land
cover includes agricultural types, primarily
those devoted to row crops and grains, hay,
and seeds. Natural land types compose the
majority of the remainder of land cover in the
region (see Figures 1 and 2).
Based on Cropland Data Layer (CDL) and
U.S. Census of Agriculture information, the
following briefly highlight agricultural figures
of the three counties included in the Tri-
County Region:
Clinton County
� Contains 41% of the total cropland in
the region, which is highest among the
three counties.
� Regionally, it ranked first in total
agricultural sales, with a value of
$137.4 million in 2007 (adjusted to
2000 dollar values), with more than
$83.2 million in livestock, poultry and
their products.
Ingham County
� In 2007, had the second largest value
of sales in the region, at $70.2 million
(adjusted to 2000 values).
� Had high sales in grains, oilseeds, dry
beans, and dry peas along, with milk
and other dairy products from cows
accounting for most of these sales.
Table 2: Contribution of Agriculture to the Tri-County Region’sEconomy for 2007
Impact Category Direct Indirect Induced TotalLabor Income $35,649,535 $20,197,015 $12,461,951 $68,308,501
Property-Type Income $82,409,608 $24,078,052 $7,900,661 $114,388,320
Employment (People) 4,281 527 373 5,182
Value of Output $320,788,996 $77,966,081 $38,283,211 $437,038,288
Sources: Table created by the Land Policy Institute, Michigan State University, 2011. Data from IMPLAN and the 2007 USDA National Agricultural Statistics Service, Census of Agriculture.Note: See Appendix C for definitions of Direct, Indirect, Induced and Total Effects.

the status, conditions and economic impacts
land
pol
icy
inst
itut
e
Figure 2: Proportional Land Cover for theTri-County Region for 2007
Source: Figure created by the Land Policy Institute, Michigan State University, 2011. Data from the USDA National Agricultural Statistics Service, 2009 Michigan Cropland Data Layer.
iv
Figure 1: Land Cover Types for the Tri-County Region of Mid-Michigan
Source: Figure created by the Land Policy Institute, Michigan State University, 2011. Data from the USDA National Agricultural Statistics Service, 2009 Michigan Cropland Data Layer.

repo
rt
TRI-COUNTY AGRICULTURE
Eaton County
� With $58.6 million in
total sales (adjusted
to 2000 dollar
values), Eaton County
saw most of its sales
come from grains,
oilseeds, dry beans
and dry peas.
The Tri-County Region has an
established agricultural base
that, based on this report and
listening session responses,
could be expanded and
enhanced to help the region
achieve increased agricultural
economic activity, and could
increase its sales and bolster
its markets.
This report identifies the
region’s agricultural status and conditions
alongside economic impacts. It will be
integrated into the Agricultural Economic
Development Plan, which will assist in linking
agriculture and economic development. The
plan will also help guide the region along
a mutually beneficial path toward regional
and statewide prosperity through expanding
agricultural business opportunities.
v

the status, conditions and economic impacts
land
pol
icy
inst
itut
e
1
Executive Summary................................................................................................................................................................i
Tri-County Agriculture Assessment..............................................................................................................................3
Background.......................................................................................................................................................................3
Agricultural Base of the Tri-County Region.......................................................................................................5
Agriculture-Related Industries, Region-Wide................................................................................................10
Economic Impact of Agriculture in the Tri-County Region......................................................................13
County-Based Assessments of Agriculture in the Tri-County Region of Mid-Michigan.....................16
Clinton County Agriculture Assessment...........................................................................................................18
Eaton County Agriculture Assessment..............................................................................................................22
Ingham County Agriculture Assessment..........................................................................................................26
Conclusion...............................................................................................................................................................................30
Appendices...............................................................................................................................................................................31
References................................................................................................................................................................................38
Table of Contents
Figure 1: Land Cover Types for the Tri-County Region of Mid-Michigan...................................................iv
Figure 2: Proportional Land Cover for the Tri-County Region for 2007......................................................iv
Figure 3: Number of Farm Proprietors and Their Net Income for the Tri-County Region
for 1969–2007........................................................................................................................................................15
Figure 4: Clinton County Land Cover Types............................................................................................................19
Figure 5: Clinton County Proportional Land Cover for 2009...........................................................................21
Figure 6: Number of Clinton County Farm Proprietors and Their Net Income for 1969–2007.........21
Figure 7: Eaton County Land Cover Types................................................................................................................23
Figure 8: Eaton County Proportional Land Cover for 2009..............................................................................23
Figure 9: Number of Eaton County Farm Proprietors and Their Net Income for 1969–2007.............25
Figure 10: Ingham County Land Cover Types..........................................................................................................27
Figure 11: Ingham County Proportional Land Cover for 2009.........................................................................27
Figure 12: Number of Ingham County Farm Proprietors and Their Net Income for 1969–2007.......29
Figure 13: Global Corn, Soybean and Wheat Prices for 1996–2011.................................................................34
Figure 14: Global Beef and Poultry Prices for 1996–2011......................................................................................35
Figures

repo
rt
TRI-COUNTY AGRICULTURE2
Table 1: Tri-County Region Agricultural Statistics for 1997, 2002 and 2007................................................ii
Table 2: Contribution of Agriculture to the Tri-County Region’s Economy for 2007.............................iii
Table 3: Percentage of Total Land Cover Acreages for 2007 for Michigan and the
Tri-County Region................................................................................................................................................7
Table 4: Agricultural Sales by Type for 1997, 2002 and 2007 for Michigan and the
Tri-County Region................................................................................................................................................8
Table 5: Farms and Acreage for 1997, 2002 and 2007 for Michigan and the Tri-County Region.........8
Table 6: Agricultural Sales by Type for 1997, 2002 and 2007 for the Tri-County Region........................9
Table 7: Number of Businesses, Employment and Sales for the Tri-County Region for 2009........11-12
Table 8: Current Contribution of Agriculture to the Tri-County Region’s Economy.............................14
Table 9: Potential Increased Contribution to the Tri-County Region’s Economy from a 5%
Increase in Agricultural Sales.........................................................................................................................14
Table 10: Each County’s Percentage of Agricultural Acreage in the Tri-County Region for 2007.....17
Table 11: Clinton County Land Cover Acreages for 2009....................................................................................18
Table 12: Clinton County Farms and Farm Acreage for 1997, 2002 and 2007.............................................19
Table 13: Clinton County Agricultural Sales by Type for 1997, 2002 and 2007.........................................20
Table 14: Eaton County Land Cover Acreages for 2009.......................................................................................22
Table 15: Eaton County Farms and Farm Acreage for 1997, 2002 and 2007................................................24
Table 16: Eaton County Agricultural Sales by Type for 1997, 2002 and 2007.............................................24
Table 17: Ingham County Land Cover Acreages for 2009...................................................................................26
Table 18: Ingham County Farms and Farm Acreage for 1997, 2002 and 2007............................................28
Table 19: Ingham County Agricultural Sales by Type for 1997, 2002 and 2007........................................28
Tables
Appendix A: Data Sources and Issues..........................................................................................................................31
Appendix B: Global Commodity Sales for Major Crops and Livestock.......................................................34
Appendix C: Glossary of Terms......................................................................................................................................36
Appendices

the status, conditions and economic impacts
land
pol
icy
inst
itut
e
tri-county region agriculture assessment
MICHIGAN IS ENDOWED WITH THE COMBINATION OF SOIL, CLIMATE AND WEATHER PATTERNS TO CREATE ONE OF THE MOST DIVERSE AGRICULTURE SECTORS IN THE NATION. IT RANKS SECOND ONLY TO CALIFORNIA IN THE DIVERSITY OF AGRICULTURAL PRODUCTS. MICHIGAN HAS A SIGNIFICANT EDGE, WITH ITS UNIQUE ENDOWMENT AND ABUNDANCE OF AVAILABLE WATER TO SUPPORT A WIDE-RANGE OF FARMING OPERATIONS ACROSS THE STATE. THE TRI-COUNTY REGION IS WELL-POSITIONED, BOTH GEOGRAPHICALLY AND ECONOMICALLY, TO CAPITALIZE ON ITS AGRICULTURAL ASSETS.
Tri-County Region
3
Background
Land is the primary resource upon which
American prosperity was built. Until
the mid to late 1850s, the utilization
of land to optimize the performance of land-
based industries (e.g., agriculture or industry)
was the primary focus of land planning and
policy. Thomas Jefferson and Alexander
Hamilton vigorously debated the future of the
U.S. development of land. Jefferson believed
that the republic’s strength lay in its agrarian
roots and a decentralized government.
Hamilton advocated for industry in urban
centers and a strong and efficient central
federal government. Clearly, parts of both
philosophies prevailed and, as a result, both
agriculture and industry have flourished since
the founding of the United States.
Following the Civil War, a key goal of U.S.
agricultural policy was the enhancement
of agricultural yield and productivity,
while guaranteeing national food security.
Commodity price support programs helped
to mask various inefficiencies inherent
in commodity-focused agriculture, while
obscuring unique market and ecological
opportunities for agriculture at the state and
local levels (Keeney and Kemp, 2003).
Since the Industrial Revolution, however, the
focus on land in the United States has been
more on its potential for development into
non-agricultural uses (such as for locating
manufacturing industries or housing) than on
the maintenance of an agricultural base. The
post-World War II phenomenon of sprawling
cities changed how people perceived land.
Where once it was valued for the quality of its
soil and potential for agricultural production,
it came to be judged by its locational proximity
and building potential. The development
pressure facing farm families, with the promise
of large buy-outs and comfortable retirements,
was and remains enticing, particularly with
the volatile agricultural prices farmers face.
Since the 1983 Dairy and Tobacco Adjustment
Act and the subsequent diminished emphasis
on national government intervention,

repo
rt
TRI-COUNTY AGRICULTURE4
agricultural policy development has
increasingly become the responsibility of state
and local governments (Offutt et al., 2004).
For example, in the area of marketing, such
issues as eco-tourism, agro-entertainment,
value-added farm diversification, right-to-farm,
specialty markets, farmland preservation,
direct marketing, new use agriculture
and the management skills of farmers are
increasingly being pursued at the state level as
opportunities to enhance the competitiveness
and retention potential for agriculture (Babb
and Long, 1987). Simultaneously, the aesthetic
and ecological dimensions of the industry are
also becoming more clearly illuminated (Offutt
et al., 2004).
The enhancement of farm viability has, thus,
become an agricultural policy goal at state
and local levels (Adelaja and Sullivan, 1998).
Rapid consolidation of farms and the apparent
limited viability of many mid-size farms,
in the 1960s and 1970s, led many states to
explore mechanisms for direct intervention
in the economic plight of state agriculture.
In such states as Iowa, Michigan, Maryland,
Massachusetts, Minnesota, New Jersey and
Ohio, policies are being implemented to
address viability issues.
The debate about the future survival of
agriculture has gone well beyond the discourse
in the 1980s about farm viability (Adelaja
and Rose-Tank, 1988; Adelaja et al., 1989).
Farmers must coexist with their neighbors
and take advantage of the unique local features
in order to survive well into the future.
Water management practices, chemical
usage strategies, good neighbor relations,
participation in federal conservation programs
(e.g., Conservation Reserve Programs), generally
accepted agricultural management practices
(GAAMPs) and other factors that contribute to
sustainability could potentially impact viability.
The chemistry between agriculture and
economic development can certainly be
traced back to Jefferson and Hamilton. Yet
its modern roots took shape in the 1960s.
Johnston and Mellor (1961) discuss the false
dichotomy between agricultural and industrial
development, arguing that agriculture’s role in
economic development is primarily dependent
on the amount of people living in rural areas
and at what stage of economic development
a particular community may be facing. In
other words, agricultural and industrial
developments are not mutually exclusive.
tri-county region agriculture assessment

the status, conditions and economic impacts
land
pol
icy
inst
itut
e
5
Yet even today, the economic development
literature has favored the development of the
modern industrial sector over agriculture (Self
and Grabowski, 2007). However, the authors
highlight the importance and potentially high
economic impacts of agricultural technology
in re-establishing agriculture as having a vital
role in economic development. They also state
that more recent economic models have found
significant contributions to economic growth
from agriculture and agricultural technologies.
Regardless of the literature, experience
has shown that over the past few decades,
rural and small town poverty—resulting
from slowdowns in agriculture and
manufacturing—has taken its toll on many
communities. Michigan was not immune
to this slowdown. The economic declines
in rural communities have been a result of
high interest rates, farmland speculation
and over-production (Blakely and Bradshaw,
2002). As industries and farms collapsed, so
too did employment levels, which had a harsh
ripple-effect throughout rural communities
(Blakely and Bradshaw, 2002). Furthermore,
the fluctuation of global commodity prices,
and the decisions of manufacturing firms and
other raw-material-extracting businesses
to close plants or relocate, has exacerbated
the negative economic and social effects on
communities (Blakely and Bradshaw, 2002).
Surely, such challenges, when combined with
speculative real estate development pressure,
necessitate the need to closer examine the
potential positive interactions of agriculture
and economic development.
Recognizing the importance of this
interaction, this report summarizes the
agricultural base of the Tri-County Region
(Clinton, Eaton and Ingham counties) of
Mid-Michigan to underscore the current
agricultural assets and the changes that have
occurred in recent years. The report does not
delve into rural challenges and poverty, and
how past economic development efforts have
targeted them, but merely presents the current
trends and conditions of agriculture and
agriculture-related businesses.
Agricultural Base of the Tri-County Region
Despite projected statewide losses of farmland,
Michigan’s agricultural production is expected
to increase, due to technological advances
and farm specialization (Leholm et al., 2003).
However, the question remains: As farms
become more productive will they also become
more profitable and economically viable, and
how will agri-business opportunities play a
role? The effects of climate change may also
affect Michigan agriculture, as other regions
become too arid for diverse crop production,
or as cooler climates—such as Michigan’s—
experience changes in their production
potential. This may also provide interesting
opportunities for agricultural diversification
and alternative energy production.
The issues mentioned above are important
to consider for farms and farmers in the Tri-
County Region too. The agricultural landscape
of Mid-Michigan is varied and diverse, with few
elevation changes providing prime landscape for
row crops. The three counties of Clinton, Eaton

repo
rt
TRI-COUNTY AGRICULTURE
tri-county region agriculture assessment
and Ingham are located in this region of the
state, and their central location and proximity
to the State Capitol and Michigan State
University offer unique market opportunities
and partnerships. All three counties have
harvested cropland acreage and total sales
greater than the state’s county average of 82,640
acres and $69.3 million, respectively.
By examining the agricultural base and sales
between 1997 and 2007, it is possible to see
how agriculture has changed in the Tri-County
Region. It is important to understand the path
agriculture has been on before suggesting
modifications to that path. It is also important
to understand the agri-business opportunities
that may be present. A breakdown of the acres
of farmland harvested by crop for the year 2009
(based on Cropland Data Layer (CDL) data),
as well as acreage devoted to other uses for the
state of Michigan and the Tri-County Region’s
percentage of the state’s total is presented in
Table 3. This snapshot in time reveals that in
2009, nearly three times as much land was
devoted to agricultural production, and nearly
two-and-a-half times as much devoted to
natural land types than to urban/developed
land. This exemplifies the highly rural/
agricultural nature of the region and the need
for targeted economic development planning
for agriculture and agri-businesses.
As of the 2007 Census of Agriculture, the Tri-
County Region accounted for 7.6% of the state’s
harvested cropland, and 6.1% of the state’s
farms, and contributed 5.6% of the state’s total
sales (see Tables 4 and 5). However, the region’s
share of the state’s total farms decreased from
6.6% in 1997 to 6.1% in 2007, its share of land
(acres) in farms increased from 6.7% in 1997 to
6.8% in 2007, its acreage of harvested cropland
increased to 7.6% from 7.4%, and its share of
the state’s total sales remained steady at 5.6%
from 1997 to 2007. It would appear that the
tri-county’s portion of the state’s farms, acreage
and total sales of agricultural products has
remained virtually unchanged from 1997 to
2007. During the same period, the region lost
98 farms and retained land in farms at a rate
similar to the state—the state lost 3.9% and the
region 3.1%. Michigan’s total harvested cropland
decreased by 1.9% from 1997 to 2007, while
the same measure for the Tri-County Region
increased by 1.7%. Thus, while the statewide
trend of declining land in farms and harvested
cropland was occurring, the Tri-County Region
showed similar trends with regard to acreage
of land in farms, but did not trend downward
in its acreage of harvested cropland like the
state. A loss of land in farms is attributed to
urbanization, sale of farms, and farmland being
succeeded by fallow or idle cropland.
According to the 2007 U.S. Department of
Agriculture (USDA) National Agricultural
Statistics Survey (NASS) Census of
Agriculture, there are 679,982 acres of
farmland, with total sales of more than $320
million ($266 million when adjusted for
inflation to the year 2000) in the Tri-County
Region1 (see Tables 5 and 6). The region
experienced a decline of nearly $26 million in
sales between 1997 and 2002, followed by an
increase of more than $71 million from 2002 to
1. All dollar values reported have been adjusted for inflation to the year 2000 (a census year) for ease of interpretation and comparison across years. For Mid-Michigan, in 2007, total sales were $320.8 million, but when adjusted for inflation to 2000 dollar values, were closer to $266.3 million.
6

the status, conditions and economic impacts
land
pol
icy
inst
itut
e
the status, conditions and economic impacts
land
pol
icy
inst
itut
e
7
Table 3: Percentage of Total Land Cover Acreages for 2007 for Michigan and the Tri-County Region
Crop
State of Michigan
AcresTri-County
Acres
Tri-County Percentage
of StateRow Crops 4,715,007 399,416 8.5%
Corn 2,587,362.3 194,634.2 7.5%
Sorghum 2,864.1 63.5 2.2%
Soybeans 2,120,536.6 204,684.9 9.7%
Sunflowers 2,326.3 16.3 0.7%
Sweet Corn 1,673.1 16.3 1%
Popping or Ornamental Corn 244.9 0.8 0.3%
Grain, Hay, Seeds 1,439,805 112,494 7.8%
Barley 12,349.9 74.4 0.6%
Winter Wheat 736,133 72,992.3 9.9%
Other Small Grains 484.3 1.5 0.3%
Winter Wheat and Soybean Double Crop 580.4 4.6 0.8%
Rye 11,235.6 44.2 0.4%
Oats 40,556.3 185.2 0.5%
Speltz 1,055.4 289.8 27.5%
Alfalfa 637,410.2 38,901.9 6.1%
Other Crops 419,359 2,969 0.6%
Sugarbeets 116,896 492.1 0.4%
Dry Beans 202,890 498.3 0.2%
Potatoes 39,405 103.8 0.3%
Other Crops 3,978 1.5 0%
Misc Vegetables, Fruits 47,455 189.1 0.4%
Onions 1,093 176.7 16.2%
Peas 2,750 0.8 0%
Herbs 1,986 1,438.3 72.4%
Clover/Wildflowers 2,906 68.2 2.3%
Open Non-Crop 133,359 1,922 1.4%
Fallow Idle Cropland 133,359 1,921.8 1.4%
Urban/Developed 4,363,131 163,377 3.7%
Natural Land Types 25,164,736 409,782 1.6%
Water 849,491 6,598 0.8%Source: Table created by the Land Policy Institute, Michigan State University, 2011. Data from the 2009 USDA National Agricultural Statistics Service, Cropland Data Layer.Note: Tree crops have been excluded due to inability to distinguish tree crops from natural land types. See Appendix A for more information.

repo
rt
TRI-COUNTY AGRICULTURE
2007 (see Table 6). This could be attributed to
the temporary spike in sales of corn for ethanol
products, and may not represent an actual
sustainable increase in sales. Yet, over the 10-
year period, the number of acres of harvested
cropland increased by 1.7%, increasing from
514,972 to 523,490. Meanwhile, the number of
acres of land in farms declined from 1997 to
2007, going from 702,348 to 679,982—a 3.2%
decline. Regardless, sales per acre (using land
in farms) increased from $314.48 to $391.56 per
acre from 1997 to 2007 (dollar values adjusted
to year 2000 values), thus illustrating an
upward trend in sales and productivity during
the decade.
During this 10-year period, the sales of
crops and livestock (including poultry and
their products) remained relatively evenly
distributed between the two groups, with
sales from crops exceeding those of livestock
products by $23.6 million in 2007 (see Table 6).
Of crop sales in 2007:
� More than 83% came from grains,
oilseeds, dry beans and dry peas.
tri-county region agriculture assessment
Michigan Tri-County RegionTri-County % of
State Total1997 2002 2007 1997 2002 2007 1997 2002 2007
Number of Farms 53,519 53,315 56,014 3,507 3,418 3,409 6.55% 6.4% 6.1%
Land in Farms (Acres) 10,443,935 10,142,958 10,031,807 702,348 679,152 679,982 6.72% 6.7% 6.8%
Harvested Cropland (Acres) 6,989,300 6,827,903 6,859,081 514,972 515,271 523,490 7.37% 7.6% 7.6%
Table 4: Agricultural Sales by Type for 1997, 2002 and 2007 for Michigan and the Tri-County Region
Table 5: Farms and Acreage for 1997, 2002 and 2007 for Michigan and the Tri-County Region
Michigan Tri-County RegionTri-County % of
State Total1997 2002 2007 1997 2002 2007 1997 2002 2007
Crops ($1,000) $2,476,501 $2,268,123 $2,763,840 $126,805 $111,760 $144,932 5.12% 4.93% 5.24%
Livestock, Poultry, and Their Products ($1,000) $1,476,796 $1,353,415 $2,011,332 $94,071 $83,159 $121, 323 6.37% 6.14% 6.03%
Total Sales ($1,000) $3,953,297 $3,621,538 $4,775,172 $220,876 $194,918 $266,256 5.59% 5.38% 5.58%
Source: Table created by the Land Policy Institute, Michigan State University, 2011. Data from the 2007 USDA National Agricultural Statistics Service, Census of Agriculture.
Source: Table created by the Land Policy Institute, Michigan State University, 2011. Data from the 2007 USDA National Agricultural Statistics Service, Census of Agriculture. Note: Sales figures adjusted to year 2000 values. See Appendix B for Global Commodity Price Index.
repo
rt
TRI-COUNTY AGRICULTURE8

the status, conditions and economic impacts
land
pol
icy
inst
itut
e
Table 6: Agricultural Sales by Type for 1997, 2002 and 2007 for the Tri-County Region
Item 1997 2002 2007Crops $126,804,630 $111,760,320 $144,932,110
Grains, Oilseeds, Dry Beans, Dry Peas - $84,616,320 $120,950,9520
Vegetables, Melons, Potatoes, Sweet Potatoes - $7,352,640 $4,986,640
Fruits, Tree Nuts, Berries - $1,108,800 $984,380
Nursery, Greenhouse, Floriculture, Sod - $12,326,400 $10,656,370
Cut Christmas Trees, Short-Rotation Woody Crops - $545,280 $1,069,040
Other Crops, Hay - $5,810,880 $6,286,420
Livestock, Poultry, and their Products $94,071,190 $83,159,040 $121,322,760
Poultry, Eggs $204,370 - $234,060
Cattle, Calves $19,948,010 $16,543,680 $18,252,530
Milk, Other Dairy Products from Cows $61,198,650 $58,435,200 $92,047,830
Hogs, Pigs $9,718,810 $5,588,160 $3,985,660
Sheep, Goats, Their Products - $407,040 $428,280
Horses, Ponies, Mules, Burros, Donkeys - $1,746,240 -
Aquaculture - - -
Other Animals, Other Animal Products - - -
Value of Agricultural Products Sold Directly to Individuals for Human Consumption $887,030 $1,525,440 $1,498,980
Total Sales* $220,875,820 $194,919,360 $266,254,870
Average Sales per Farm** $62,718.41 $56,817.28 $77,801.16
For the purpose of comparison, all dollar values have been adjusted for inflation to the year 2000. Missing values (-) exist due to data limitations and non-disclosure policies of the Census of Agriculture. Missing values do not necessarily represent non-activity.*Total Sales does not include “Value of Agricultural Products Sold Directly to Individuals for Human Consumption.” It is a separate category that includes sales from roadside stands and other direct interactions between farmer and consumer. These total sales figures are non-rounded calculations, which match total sales information in Table 4.**Average Sales per Farm was calculated by summing the average sales per farm for each of the three counties, and dividing by three. Source: Table created by the Land Policy Institute, Michigan State University, 2011. Data from the 2007 USDA National Agricultural Statistics Service, Census of Agriculture. See Appendix B for Global Commodity Price Index.
� Corn and soybean sales accounted for
50% and 39% of sales, respectively.
� Seven percent came from the sale of
nursery, greenhouse, floriculture and
sod products.
� The region did
not display strong
sales trends in the fruits,
tree nuts and berries category.
the status, conditions and economic impacts
land
pol
icy
inst
itut
e
9

repo
rt
TRI-COUNTY AGRICULTURE10
Among livestock sales in 2007:
� More than 75% came from milk and
other dairy products from cows.
� Roughly 15% of livestock sales came
from cattle and calves.
� Sales in poultry and egg products
were not strong when compared to
other livestock categories.
The region lost 89 farms from 1997 to 2002,
and subsequently lost nine farms from 2002
to 2007, resulting in an overall decrease in
farms for the region of 98 for the 10-year
period between 1997 and 2007 (see Table 5).
The region’s share of farms within the state
also declined during this period, which is not
surprising considering that the number of
farms statewide increased during the decade.
Nationally, from 1997 to 2007, the nation
(excluding Alaska and Hawaii) lost a total of
11,084 farms—a less than 1% reduction.
The following sections will examine
agriculture-related industries, the economic
impact of agriculture to the region, and
county-specific attention of farm and
farming characteristics, upon which
appropriate economic development strategies
can be formulated.
Agriculture-Related Industries, Region-Wide
In order to better identify potential agri-
business expansion opportunities, it is
necessary to know what businesses already
exist, how many people they employ, and what
their sales figures are. Having this information
also helps to identify possible gaps or regional
shortcomings in agri-business activities.
An agriculture industry sector breakdown
of the Tri-County Region reveals that the
greatest number of businesses (excluding all
other miscellaneous crop farming) is in corn
farming, with a total of 206 businesses (see
Table 7). Dairy cattle and milk production, at
128, ranks second. Within support activities
for agriculture and forestry, most businesses
are dedicated to support activities for animal
production (48 businesses). Within the food
manufacturing sub-sector, most businesses
(29) are retail bakeries.
Food Manufacturing has only 79 businesses,
but employs 616 people—the largest ratio of
jobs to businesses (7.8 people per business). On
the other hand, there are 714 Crop Production
businesses that employ 1,373 people, which
is less than two people employed for each
business (1.92). Support Activities for
Agriculture and Forestry also have a larger
ratio of jobs to businesses (4.6). The ratio of
jobs to businesses for Animal Production is
3.06. It is apparent that the Support Activities
and other industries associated with farming
tri-county region agriculture assessment

the status, conditions and economic impacts
land
pol
icy
inst
itut
e
Table 7: Number of Businesses, Employment and Sales for the Tri-County Region for 2009
Source: Table created by the Land Policy Institute, Michigan State University, 2011. Data from the 2009 Dunn and Bradstreet National Establishment Time Series. Note that sales and employment figures presented in this table may be different than in other tables due to counting procedures and other methodologies. Notes: ‘D’ represents non-disclosure of information. Employment and sales figures have been removed for those industry sectors with fewer than five businesses so as to not disclose sensitive data and information on businesses in the region, which may be gleaned from the table above if there are only a few of those businesses present. The rows in the table containing the totals include the non-disclosed figures. Employment figures may be under-represented due to the fact that not all businesses have a Dunn and Bradstreet identification number.
Industry SectorNumber of Businesses
Employment (People) Sales
Crop Production 714 1,373 $97,645,756
Soybean Farming 88 136 $10,477,000
Dry Pea and Bean Farming 8 12 $810,000
Wheat Farming 27 47 $4,022,000
Corn Farming 206 339 $25,012,000
All Other Grain Farming 35 65 $4,600,000
Potato Farming 1 D D
Other Vegetable (except Potato) and Melon Farming 16 85 $7,482,856
Apple Orchards 4 D D
Grape Vineyards 3 D D
Strawberry Farming 1 D D
Berry (except Strawberry) Farming 4 D D
Other Noncitrus Fruit Farming 5 D D
Mushroom Production 1 D D
Nursery and Tree Production 33 143 $7,216,700
Floriculture Production 4 D D
Hay Farming 22 29 $1,748,000
All Other Miscellaneous Crop Farming 256 365 $29,003,200
Animal Production 253 774 $58,468,600Beef Cattle Ranching and Farming 31 61 $3,216,800
Cattle Feedlots 32 53 $5,046,700
Dairy Cattle and Milk Production 128 482 $41,634,400
Hog and Pig Farming 8 10 $964,000
Chicken Egg Production 2 D D
Broilers and Other Meat Type Chicken Production 1 D D
Sheep and Goat Farming 3 D D
Apiculture 2 D D
Horses and Other Equine Production 18 46 $1,380,000
Fur-Bearing Animal and Rabbit Production 1 D D
All Other Animal Production 27 105 $5,394,200
the status, conditions and economic impacts
land
pol
icy
inst
itut
e
11

the status, conditions and economic impacts
land
pol
icy
inst
itut
e
Table 7: Number of Businesses, Employment and Sales for the Tri-County Region for 2009 (Cont.)
Source: Table created by the Land Policy Institute, Michigan State University, 2011. Data from the 2009 Dunn and Bradstreet National Establishment Time Series. Note that sales and employment figures presented in this table may be different than in other tables due to counting procedures and other methodologies. Notes: ‘D’ represents non-disclosure of information. Employment and sales figures have been removed for those industry sectors with fewer than five businesses so as to not disclose sensitive data and information on businesses in the region, which may be gleaned from the table above if there are only a few of those businesses present. The rows in the table containing the totals include the non-disclosed figures. Employment figures may be under-represented due to the fact that not all businesses have a Dunn and Bradstreet identification number.
Industry SectorNumber of Businesses
Employment (People) Sales
Support Activities for Agriculture and Forestry 68 313 $22,956,387
Cotton Ginning 1 D D
Soil Preparation, Planting, and Cultivating 10 16 $1,578,200
Crop Harvesting, Primarily by Machine 4 D D
Post-Harvest Crop Activities (except Cotton Ginning) 2 D D
Farm Management Services 1 D D
Support Activities for Animal Production 48 271 $19,565,887
Support Activities for Forestry 2 D D
Food Manufacturing 79 616 $59,933,509
Dog and Cat Food Manufacturing 1 D D
Other Animal Food Manufacturing 9 83 $17,850,000
Soybean Processing 1 D D
Confectionery Manufacturing from Purchased Chocolate 2 D D
Nonchocolate Confectionery Manufacturing 3 D D
Frozen Specialty Food Manufacturing 1 D D
Fluid Milk Manufacturing 2 D D
Dry, Condensed, and Evaporated Dairy Product Manufacturing 1 D D
Ice Cream and Frozen Dessert Manufacturing 2 D D
Animal (except Poultry) Slaughtering 7 19 $1,308,000
Meat Processed from Carcasses 1 D D
Poultry Processing 2 D D
Retail Bakeries 29 232 $9,889,010
Commercial Bakeries 8 32 $1,825,600
Cookie and Cracker Manufacturing 1 D D
Flour Mixes and Dough Manufacturing from Purchased Flour 1 D D
Other Snack Food Manufacturing 2 D D
Coffee and Tea Manufacturing 1 D D
Flavoring Syrup and Concentrate Manufacturing 2 D D
Spice and Extract Manufacturing 1 D D
All Other Miscellaneous Food Manufacturing 2 D D
Region Total 1,114 3,076 $239,004,252
repo
rt
TRI-COUNTY AGRICULTURE12

the status, conditions and economic impacts
land
pol
icy
inst
itut
e
tri-county region agriculture assessment
and agriculture are major employers within the
overall agricultural industry.
There are several sectors that appear ripe
for expansion, based on business and
employment numbers. However, the highly
mechanized and efficiency-oriented nature of
some agricultural crops and products makes
expanding employment in those sectors
impractical or inefficient:
� Could tea production or processing
grow, given the amount of mint grown
in Clinton County?
� There are two poultry processing
businesses. Could there be more?
� Chicken egg production has two
businesses. Is there room for expansion
in this sector?
� Clinton County has a strong dairy
cow base. Could dairy processing be
expanded in this county or throughout
the region?
� Are other crops and farms ready
for expansion?
These are important questions to ask in
moving forward with an agricultural economic
development plan and grasping a better
understanding of the impacts agriculture and
its many industries can have on the region.
Economic Impact of Agriculture in the Tri-County Region
The contribution of agriculture to
the local and regional economy is
significant. To conduct an economic
impact assessment of the agricultural
sector of the tri-county economy, the IMPLAN
economic impact analysis tool (a recognized
procedure in estimating the economic impacts
that result from a given situation, in this case
the current level of agricultural sales) was
utilized. These impacts were then traced
through the effects on labor income, property-
related income, employment and value of output
in the region. They are classified into direct
impacts (the first-impacted sectors); indirect
impacts (effects on other related sectors, as a
result of impacts on first-affected sectors); and
induced effects (subsequent effects transmitted
through the rest of the sectors linked to the
changes in income and consumption). The total
economic impact traces all these effects across
interconnected sectors.
The IMPLAN analysis tool was applied to
the Tri-County Region so as to isolate the
effect of agriculture at the regional scale. The
IMPLAN tool obtains data from several sources
to construct its database, which is utilized to
measure economic impacts of a specific event.
Despite already having available agricultural
industry sales for 2007 within IMPLAN, Census
of Agriculture 2007 sales values were used to
supplement already existing data and were then
analyzed for this exercise. These values are used
13

repo
rt
TRI-COUNTY AGRICULTURE
Table 9: Potential Increased Contribution to the Tri-County Region’s Economy from a 5% Increase in Agricultural Sales
Impact Category Direct Indirect Induced TotalLabor Income $1,782,477 $1,009,851 $623,098 $3,415,425
Property-Type Income $4,120,480 $1,203,903 $395,033 $5,719,416
Employment (People) 214 26 19 259
Value of Output $16,039,450 $3,898,304 $1,914,161 $21,851,914
Source: Table created by the Land Policy Institute, Michigan State University, 2011. Data from IMPLAN and the 2007 USDA National Agricultural Statistics Service, Census of Agriculture.
to estimate the regional impact of the existing
agriculture industry on the local economy, and
to isolate the effects as they trickle through the
economy. Impacts on the surrounding regions
and the state as a whole are not included.
In Table 8, the estimated economic impacts to
the Tri-County Region of current agricultural
sectors in the tri-county economy are
presented, including the direct, indirect
and induced impacts, all in 2007 dollar
values. Currently, agriculture-related sectors
contribute a total of:
� $68,308,501 in labor income;
� $114,388,320 in property-type income;
� 5,182 jobs; and
� $437,038,288 in value of economic output.
In addition to estimating the current value
of agriculture’s contribution to the Tri-
County Region, a hypothetical projection was
conducted to estimate the contribution to the
local economy if the agriculture sector were to
increase by 5% in agricultural output across
the board. Table 9 presents the additional
total, direct, indirect and induced economic
impacts that could result from a 5% increase in
agricultural sales:
� $3,415,425 in labor income,
� $5,719,416 in property-type income,
tri-county region agriculture assessmentre
port
TRI-COUNTY AGRICULTURE
Table 8: Current Contribution of Agriculture to the Tri-County Region’s Economy1
2
2. Forestry, hunting, fishing—commercial and otherwise—were not included in the measurement of agricultural impacts in the Tri-County Region, but are integrated with support services for agriculture within the modeling software. Hence, relative weight of the forestry/hunting/fishing sectors was subtracted from the total support services sector to arrive at an estimate of agricultural support services.
14
Impact Category Direct Indirect Induced TotalLabor Income $35,649,535 $20,197,015 $12,461,951 $68,308,501
Property-Type Income $82,409,608 $24,078,052 $7,900,661 $114,388,320
Employment (People) 4,281 527 373 5,182
Value of Output $320,788,996 $77,966,081 $38,283,211 $437,038,288
Source: Table created by the Land Policy Institute, Michigan State University, 2011. Data from IMPLAN and the 2007 USDA National Agricultural Statistics Service, Census of Agriculture.

the status, conditions and economic impacts
land
pol
icy
inst
itut
e
Figure 3: Number of Farm Proprietors and Their Net Income for the Tri-County Region for 1969–2007
Source: Figure created by the Land Policy Institute, Michigan State University, 2011. Data from the Regional Economic Information System, Bureau of Economic Analysis, Table CA30, April 2009. See Appendix B for Global Commodity Price Index.Note: Income figures adjusted for inflation to year 2000.
� 259 jobs and
� $21,851,914 in value of economic output.
Figure 3 depicts the number of farm
proprietors and their net income in the Tri-
County Region from 1969 to 2007. The graph
indicates that the number of farm proprietors
has steadily declined from roughly 5,000 to
approximately 3,400. Meanwhile, their net
income (adjusted for inflation) fluctuated
greatly during the period. Since 1969, net
income dropped below $0 three times. In 1989,
farm proprietors’ income reached $30,000,000.
However, in 2001, this figure dropped to
-$20,000,000. Since then, income figures
have remained positive. Over the course of
the entire period, while
varying greatly, net income
remained relatively unchanged
(when adjusting for inflation).
To conclude this section, it is apparent
that the total economic impact of
agriculture in the region is impressive.
Yet, upon examining net income figures
over time, ensuring a profitable agricultural
economy is far from guaranteed. Regardless, the
potential for growth in the agriculture sectors
should not be ignored in economic planning,
but investigated and strategically engaged for
a diverse and well-rounded economy. The next
section highlights trends and conditions in
Clinton, Eaton and Ingham counties.
15

repo
rt
TRI-COUNTY AGRICULTURE
County-Based Assessmentscounty-based assessments of the tri-county region
16
The remainder of this report reviews
NASS data for the years 1997, 2002
and 2007, and Michigan CDL map
information for 2009 at the county level. All
dollar values reported have been adjusted
for inflation to the year 2000 (a census year)
for ease of interpretation and comparison
across years.
While the tables and figures shown
throughout this section highlight information
pertinent only to one county, comparisons
are made to other counties throughout this
section. The bulleted list below is designed to
help make those comparisons.
For Each County:
� Land coverage for 2009 is presented
and illustrates the breakdown of
acreages for the given year. This
information compares data from
Tables 12 (Clinton County), 15 (Eaton
County) and 18 (Ingham County).
� Land coverage acreages are depicted
using CDL imagery. This information
compares data from Figures 4 (Clinton
County), 7 (Eaton County) and 10
(Ingham County).

the status, conditions and economic impacts
land
pol
icy
inst
itut
eTable 10: Each County’s Percentage of Agricultural Acreage in the
Tri-County Region for 2007
Source: Table created by the Land Policy Institute, Michigan State University, 2011. Data from the 2007 USDA National Agricultural Statistics Service, Census of Agriculture.
Agricultural Acreage PercentageClinton 233,342 41.2%
Eaton 176,885 31.3%
Ingham 155,695 27.5%
Total 565,922 100%
� A graphical representation of land
coverage is portrayed. This information
compares data from Figures 5 (Clinton
County), 8 (Eaton County) and 11
(Ingham County).
� Basic farm statistics are shown, such as
number of farms, land in farms, average
farm size and harvest cropland. This
information compares data from Tables
12 (Clinton County), 15 (Eaton County)
and 18 (Ingham County).
� The number of farm proprietors
and net income is disclosed. This
information compares data from
Figures 6 (Clinton County), 9 (Eaton
County) and 12 (Ingham County).
� The sales of crops,
livestock and other
products for each county are
revealed. This information
compares data from Tables 13
(Clinton County), 16 (Eaton
County) and 19 (Ingham County).
Key points of interest are identified and
discussed, along with significant changes or
variations over time, for each county. Table 10
lists each county’s percentage of agricultural
acreage in the region in 2007 and shows that
the majority of the region’s farmland is in
Clinton County, followed by Eaton, then by
Ingham. Overall, the region boasts more than a
half-million acres of agricultural land.
the status, conditions and economic impacts
land
pol
icy
inst
itut
e
17

repo
rt
TRI-COUNTY AGRICULTURE
Table 11: Clinton County Land Cover Acreages for 2009
clinton county assessment of agriculture
Clinton CountyCrop Acres
Row Crops 156,438
Corn 78,799
Sorghum 60
Soybeans 77,562
Sunflowers 6
Sweet Corn 11
Popping or Ornamental Corn 0
Grains, Hay, Seeds 47,244
Barley 2
Winter Wheat 27,427
Other Small Grains 1
Winter Wheat and Soybean Double Crop 5
Rye 31
Oats 106
Speltz 30
Alfalfa 19,642
Other Crops 1,918
Dry Beans 368
Potatoes 18
Other Crops 1
Misc Vegetables, Fruits 80
Onions 28
Peas 1
Herbs 1,372
Clover/Wildflowers 50
Open Non-Crop 1,005
Fallow Idle Cropland 1,005
Urban/Developed 39,967
Natural Land Types 117,529
Water 2,815
18
Source: Table created by the Land Policy Institute, Michigan State University, 2011. Data from the USDA National Agricultural Statistics Service, 2009 Michigan Cropland Data Layer.
CLINTON WAS THE ONLY COUNTY TO INCREASE ACRES OF LAND IN
FARMS IN THE TRI-COUNTY REGION.
1997–2007
In 1997, Clinton County had 1,286 farms, which
declined to 1,179 by 2002, and then increased
to 1,231 by 2007 (see Table 12). In 2007, Clinton
and Eaton counties both had 1,231 farms. Although
Clinton and Eaton are equal in number of farms,
Clinton County has consistently maintained the
most acres of harvested cropland in the region,
which accounts for about 42% of the region’s
total harvested cropland (see Table 12). Remotely
sensed imagery (see Table 11, Figure 4 and Figure 5)
indicates that of the three counties, Clinton County:
� Has the most planted acres of corn and
soybeans—the region’s most prominent crops.
� Had roughly 21% of its land devoted to
growing both corn and soybeans (see
Figures 4 and 5) in 2009.
� Ranked highest in the region in total acres
of grains, hay and seeds.
� Is the least urbanized/developed county in
the region.
� Possesses the least amount of natural land
types among the three counties (compare
Tables 11, 14 and 17).

the status, conditions and economic impacts
land
pol
icy
inst
itut
e
Figure 4: Clinton County Land Cover Types
Source: Figure created by the Land Policy Institute, Michigan State University, 2011. Data from the USDA National Agricultural Statistics Service, 2009 Michigan Cropland Data Layer.
Table 12: Clinton County Farms and Farm Acreage for 1997, 2002 and 2007
1997 2002 2007Number of Farms 1,286 1,179 1,231
Land in Farms (Acres) 256,693 255,673 271,558
Average Size of Farm (Acres) 200 217 221
Harvested Cropland 196,942 200,538 217,655
Source: Table created by the Land Policy Institute, Michigan State University, 2011. Data from the 2007 USDA National Agricultural Statistics Service, Census of Agriculture.
the status, conditions and economic impacts
land
pol
icy
inst
itut
e
19
� Is also the state leader in mint grown for
oil. In 2002, Clinton County possessed
76% of the state’s total acreage devoted
to growing herbs (predominantly mint
in Clinton County).2
3
Tables 12 and 13 indicate that from 1997 to
2007, Clinton County:
3. Values are not available for 2007, due to data disclosure limitations.
� Was the only county in the region
to have increased its acreage of land
in farms.
� Increased the amount of land in farms
by 14,865 acres (5.8%).
� Had the highest total sales in the
region. In 2007, total sales equaled
$165.5 million—almost doubling

repo
rt
TRI-COUNTY AGRICULTURE
Table 13: Clinton County Agricultural Sales by Type for 1997, 2002 and 2007
Item 1997 2002 2007Crops $45,793,860 $39,800,640 $54,237,180
Grains, Oilseeds, Dry Brans, Dry Peas - $31,424,640 $45,602,690
Vegetables, Melons, Potatoes, Sweet Potatoes - $1,236,480 $1,155,360
Fruits, Tree Nuts, Berries $881,680 $460,800 $285,520
Nursery, Greenhouse, Floriculture, Sod - $3,888,960 $3,148,190
Cut Christmas Trees, Short Rotation Woody Crops - $200,640 $166,000
Other Crops, Hay - $2,589,120 $3,879,420
Livestock, Poultry, and Their Products $54,216,900 $54,913,920 $83,150,230
Poultry, Eggs $18,190 - $70,550
Cattle, Calves $8,860,670 $8,825,280 $10,595,780
Milk, Other Dairy Products from Cows $40,581,890 $43,865,280 $70,326,730
Hogs, Pigs $4,191,190 $1,794,240 $1,705,650
Sheep, Goats, Their Products - $161,280 $164,340
Horses, Ponies, Mules, Burros, Donkeys - $163,200 $108,730
Aquaculture - - -
Other Animals, Other Animal Products - - $177,620
Value of Agricultural Products Sold Directly to Individuals for Human Consumption $394,830 $629,760 $520,410
Value of Certified Organically Produced Commodities - $88,320 -
Total Sales $100,010,760 $94,713,600 $137,387,410
Average Sales Per Farm $77,770 $80,334 $111,607
For the purpose of comparison, all dollar values have been adjusted for inflation. They have been adjusted to the year 2000. Missing values (-) exist due to data limitations and non-disclosure policies of the Census of Agriculture. Missing values do not represent non-activity.Source: Table created by the Land Policy Institute, Michigan State University, 2011. Data from the 2007 USDA National Agricultural Statistics Service, Census of Agriculture. Note: See Appendix B for Global Commodity Price Index.
repo
rt
TRI-COUNTY AGRICULTURE20
clinton county assessment of agriculture
Ingham County’s total sales, which
was $84.6 million.
� Farms increased their average sales per
farm by 44%.
� Is clearly the regional leader in
agriculture.
Compared to the region as a whole (Figure 3),
Figure 6 indicates that Clinton County farm
proprietors had fewer years of not experiencing
net income. Net income only falls below zero
one time between 1969 and 2007 and remained
there for two years (2001 and 2002). Meanwhile,
the number of farm proprietors declined to
roughly 1,400, down from about 2,000.

the status, conditions and economic impacts
land
pol
icy
inst
itut
e
Figure 6: Number of Clinton County Farm Proprietors and Their Net Income for 1969–2007
Source: Figure created by the Land Policy Institute, Michigan State University, 2011. Data from the Regional Economic Information System, Bureau of Economic Analysis, Table CA30, April 2009. Note: See Appendix B for Global Commodity Price Index.
21
Figure 5: Clinton County Proportional Land Cover for 2009
Source: Figure created by the Land Policy Institute, Michigan State University, 2011. Data from the USDA National Agricultural Statistics Service, 2009 Michigan Cropland Data Layer.

repo
rt
TRI-COUNTY AGRICULTURE
Table 14: Eaton County Land CoverAcreages for 2009
eaton county assessment of agriculture
Eaton CountyCrop Acres
Row Crops 135,157
Corn 62,581
Sorghum 2
Soybeans 72,573
Sunflowers 0
Sweet Corn 0
Popping or Ornamental Corn 1
Grains, Hay, Seeds 35,134
Barley 0
Winter Wheat 24,033
Other Small Grains 0
Winter Wheat and Soybean Double Crop 0
Rye 1
Oats 17
Speltz 135
Alfalfa 10,949
Other Crops 480
Dry Beans 100
Potatoes 69
Other Crops 1
Misc Vegetables, Fruits 91
Onions 145
Peas 0
Herbs 65
Clover/Wildflowers 9
Open Non-Crop 301
Fallow Idle Cropland 301
Urban/Developed 48,815
Natural Land Types 148,429
Water 2,257
22
Source: Table created by the Land Policy Institute, Michigan State University, 2011. Data from the USDA National Agricultural Statistics Service, 2009 Michigan Cropland Data Layer.
In the Tri-County Region, Eaton County ranks
second to Clinton County in its total amount
of natural land cover categories (see Figues 7
and 8). Eaton County:
� Has higher acreages devoted to
some “other crops,” such as potatoes,
miscellaneous fruits and vegetables and
onions (see Table 14).
� Ranks highest in the region in its amount
of Alfalfa grown.
� Is less urban/developed than Ingham
County, but more so than Clinton County.
� Ranked highest in Poultry and Eggs sales
at $83,000 in the region (see Table 16).
As indicated in Table 15, between 1997 and 2007,
the number of farms in Eaton County decreased
by only 16, but experienced a decrease in acres
in farms, as well as a decline in the average farm
size. In fact, from 1997 to 2007, Eaton County lost
the most acres of land in farms in the region. In
Eaton County:
� Adjusted total sales during 2007 were
$58.6 million in 2000 dollar value ($70.6
million in actual 2007 value).
� For all three years for which data was
available, the county has generally had
the smallest average sales-per-farm in
the region.
EATON COUNTY RANKS HIGHEST IN THE REGION IN THE AMOUNT
OF ALFALFA GROWN AND IN POULTRY AND EGG SALES

the status, conditions and economic impacts
land
pol
icy
inst
itut
e
Figure 7: Eaton County Land Cover Types
Figure 8: Eaton County Proportional Land Coverfor 2009
Source: Figure created by the Land Policy Institute, Michigan State University, 2011. Data from the USDA National Agricultural Statistics Service, 2009 Michigan Cropland Data Layer.
Source: Figure created by the Land Policy Institute, Michigan State University, 2011. Data from the USDA National Agricultural Statistics Service, 2009 Michigan Cropland Data Layer.
23

repo
rt
TRI-COUNTY AGRICULTURE
Table 15: Eaton County Farms and Farm Acreage for 1997, 2002 and 2007
1997 2002 2007Number of Farms 1,247 1,221 1,231
Land in Farms (Acres) 246,358 238,188 222,215
Average Size of Farm (Acres) 198 195 181
Harvested Cropland 169,337 171,242 161,117
Table 16: Eaton County Agricultural Sales by Type for 1997, 2002 and 2007
Item 1997 2002 2007Crops $43,950,250 $38,781,120 $47,668,560
Grains, Oilseeds, Dry Brans, Dry Peas - $30,210,240 $41,360,560
Vegetables, Melons, Potatoes, Sweet Potatoes - $4,549,440 $2,606,200
Fruits, Tree Nuts, Berries - $138,240 $211,650
Nursery, Greenhouse, Floriculture, Sod - $2,160,960 $2,024,370
Cut Christmas Trees, Short Rotation Woody Crops - $134,400 $159,360
Other Crops, Hay - $1,587,840 $1,308,080
Livestock, Poultry, and Their Products $17,025,840 $12,130,560 $10,964,300
Poultry, Eggs $103,790 $70,080 $83,000
Cattle, Calves $6,459,590 $4,661,760 $4,217,230
Milk, Other Dairy Products from Cows $5,974,880 $3,932,160 $4,814,830
Hogs, Pigs $3,638,000 $2,645,760 $4,814,830
Sheep, Goats, Their Products - $77,760 $109,560
Horses, Ponies, Mules, Burros, Donkeys - $713,280 $557,760
Aquaculture - - -
Other Animals, Other Animal Products - $30,720 $32,370
Value of Agricultural Products Sold Directly to Individuals for Human Consumption $153,010 $316,800 $229,080
Value of Certified Organically Produced Commodities - - -
Total Sales $60,976,090 $50,912,640 $58,632,860
Average Sales Per Farm $48,898 $41,698 $47,630
For the purpose of comparison, all dollar values have been adjusted for inflation. They have been adjusted to the year 2000. Missing values (-) exist due to data limitations and non-disclosure policies of the Census of Agriculture. Missing values do not represent non-activity.Source: Table created by the Land Policy Institute, Michigan State University, 2011. Data from the 2007 USDA National Agricultural Statistics Service, Census of Agriculture. Note: See Appendix B for Global Commodity Price Index.
Source: Table created by the Land Policy Institute, Michigan State University, 2011. Data from the 2007 USDA National Agricultural Statistics Service
repo
rt
TRI-COUNTY AGRICULTURE24

the status, conditions and economic impacts
land
pol
icy
inst
itut
e
eaton county assessment of agriculture
Figure 9: Number of Eaton County Farm Proprietors and Their Net Income for 1969–2007
Source: Figure created by the Land Policy Institute, Michigan State University, 2011. Data from the Regional Economic Information System, Bureau of Economic Analysis, Table CA30, April 2009. Note: See Appendix B for Global Commodity Price Index.
25
� Has seen both total sales and average
sales per farm decrease from 1997 to
2007—a trend not experienced by
either Ingham or Clinton counties
(although Ingham did decline from
1997 to 2002) (compare Tables 13, 16
and 19). This decline was primarily due
to decreases in sales in the Livestock,
Poultry and Their Products category,
which went from $17 million in 1997 to
$10.9 million in 2007.
Figure 9 shows that Eaton County tracked
more closely with regard to regional net income
trends (see Figure 3 for regional trends) than
did Clinton County. When net income at the
regional level dropped
below zero, it did also in
Eaton County. In addition, there
was much more variation in net income
observed in Eaton County. In other
words, there was greater year-to-year
fluctuation in the county. Furthermore,
net income was close to $5,000,000 in
1969, down to just under $1,000,000 in 2007—a
steeper decline than what is observed at the
regional scale. Meanwhile, the number of farm
proprietors declined to just over 1,200 in 2007,
from roughly 1,550 in 1969. The county had the
most farm proprietors during the mid-1970s and
early 1980s, but has been in decline ever since.

repo
rt
TRI-COUNTY AGRICULTURE
Crop AcresRow Crops 107,821
Corn 53,254
Sorghum 2
Soybeans 54,550
Sunflowers 10
Sweet Corn 5
Popping or Ornamental Corn 0
Grains, Hay, Seeds 30,116
Barley 72
Winter Wheat 21,533
Other Small Grains 1
Winter Wheat and Soybean Double Crop 0
Rye 12
Oats 62
Speltz 125
Alfalfa 8,311
Other Crops 79
Dry Beans 30
Potatoes 17
Other Crops 0
Misc Vegetables, Fruits 18
Onions 4
Peas 0
Herbs 1
Clover/Wildflowers 9
Open Non-Crop 616
Fallow Idle Cropland 616
Urban/Developed 74,594
Natural Land Types 143,825
Water 1,526
Table 17: Ingham County Land Cover Acreages for 2009
ingham county assessment of agriculture
Ingham County
26
Source: Table created by the Land Policy Institute, Michigan State University, 2011. Data from the USDA National Agricultural Statistics Service, 2009 Michigan Cropland Data Layer.
Ingham County is the most urbanized/
developed county in the Tri-County Region,
with 21% of its land classified as such (see
Table 17 and Figures 10 and 11). In addition,
Ingham County:
� Has fewer farms, land in farms and
harvested cropland than Clinton and
Eaton counties (see Table 18).
� Has a larger average farm size than
Eaton County.
� From 1997 to 2007, the average farm
size decreased.
� Lost 27 farms—not as many as Clinton
County (-55), but more than Eaton County
(-16), from 1997 to 2007.
� The amount of harvested cropland
declined 2.7% from 1997 to 2007.
OF INGHAM COUNTY LAND IS CLASSIFIED AS URBANIZED/DEVELOPED, THE HIGHEST AMOUNT FOR THE REGION
21%

the status, conditions and economic impacts
land
pol
icy
inst
itut
e
Figure 10: Ingham County Land Cover Types
Figure 11: Ingham County Proportional Land Cover for 2009
Source: Figure created by the Land Policy Institute, Michigan State University, 2011. Data from the USDA National Agricultural Statistics Service, 2009 Michigan Cropland Data Layer.
Source: Figure created by the Land Policy Institute, Michigan State University, 2011. Data from the USDA National Agricultural Statistics Service, 2009 Michigan Cropland Data Layer.
27
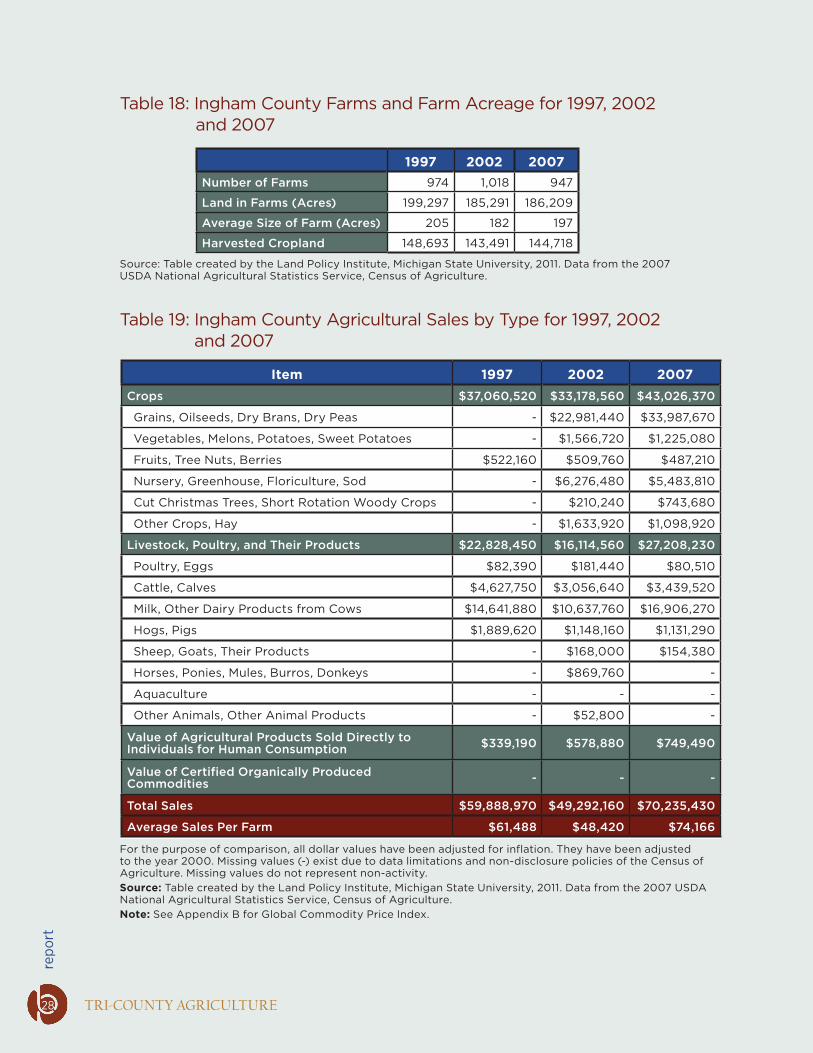
repo
rt
TRI-COUNTY AGRICULTURE
Table 18: Ingham County Farms and Farm Acreage for 1997, 2002 and 2007
1997 2002 2007Number of Farms 974 1,018 947
Land in Farms (Acres) 199,297 185,291 186,209
Average Size of Farm (Acres) 205 182 197
Harvested Cropland 148,693 143,491 144,718
Table 19: Ingham County Agricultural Sales by Type for 1997, 2002and 2007
Item 1997 2002 2007Crops $37,060,520 $33,178,560 $43,026,370
Grains, Oilseeds, Dry Brans, Dry Peas - $22,981,440 $33,987,670
Vegetables, Melons, Potatoes, Sweet Potatoes - $1,566,720 $1,225,080
Fruits, Tree Nuts, Berries $522,160 $509,760 $487,210
Nursery, Greenhouse, Floriculture, Sod - $6,276,480 $5,483,810
Cut Christmas Trees, Short Rotation Woody Crops - $210,240 $743,680
Other Crops, Hay - $1,633,920 $1,098,920
Livestock, Poultry, and Their Products $22,828,450 $16,114,560 $27,208,230
Poultry, Eggs $82,390 $181,440 $80,510
Cattle, Calves $4,627,750 $3,056,640 $3,439,520
Milk, Other Dairy Products from Cows $14,641,880 $10,637,760 $16,906,270
Hogs, Pigs $1,889,620 $1,148,160 $1,131,290
Sheep, Goats, Their Products - $168,000 $154,380
Horses, Ponies, Mules, Burros, Donkeys - $869,760 -
Aquaculture - - -
Other Animals, Other Animal Products - $52,800 -
Value of Agricultural Products Sold Directly to Individuals for Human Consumption $339,190 $578,880 $749,490
Value of Certified Organically Produced Commodities - - -
Total Sales $59,888,970 $49,292,160 $70,235,430
Average Sales Per Farm $61,488 $48,420 $74,166
Source: Table created by the Land Policy Institute, Michigan State University, 2011. Data from the 2007 USDA National Agricultural Statistics Service, Census of Agriculture.
For the purpose of comparison, all dollar values have been adjusted for inflation. They have been adjusted to the year 2000. Missing values (-) exist due to data limitations and non-disclosure policies of the Census of Agriculture. Missing values do not represent non-activity.Source: Table created by the Land Policy Institute, Michigan State University, 2011. Data from the 2007 USDA National Agricultural Statistics Service, Census of Agriculture. Note: See Appendix B for Global Commodity Price Index.
repo
rt
TRI-COUNTY AGRICULTURE28

the status, conditions and economic impacts
land
pol
icy
inst
itut
e
Figure 12: Number of Ingham County Farm Proprietors and Their Net Income from 1969–2007
Source: Figure created by the Land Policy Institute, Michigan State University, 2011. Data from the Regional Economic Information System, Bureau of Economic Analysis, Table CA30, April 2009. Note: See Appendix B for Global Commodity Price Index.
29
ingham county assessment of agriculture
Ingham County was the only county in the
region that experienced an increase in the
number of farms from 1997 to 2002 (see Table
18). Alongside Clinton County, its acres
of harvested cropland also increased from
2002 to 2007. From 1997 to 2007, the average
sales per farm increased by 21%. Overall,
both crops and livestock contributed to the
increases in total sales and average sales
per farm in the county. For 2007, Ingham
County ranked just behind Eaton County in
total sales of Poultry and Eggs—total sales
were $80,510 (adjusted for inflation to 2000
dollar values) (see Table
19). Farm proprietors’ net
income in Ingham County also
fluctuated more than in Eaton and
Clinton counties (See Figures 6, 9 and
12). While all counties in the region
experienced a shock in this measure
after September 11, 2001, Ingham
County struggled much sooner, and for a
much longer period of time than the other
counties. Only Clinton County remained
positive in the recession of the early 1980s.

repo
rt
TRI-COUNTY AGRICULTURE
ConclusionBEFORE POLICIES, IDEAS AND INITIATIVES ARE SOUGHT, DISCUSSED AND IMPLEMENTED, IT IS NECESSARY TO UNDERSTAND WHERE AGRICULTURE AND AGRI-BUSINESS STANDS—ECONOMICALLY AND IN TERMS OF CROP DIVERSITY—BEFORE CHANGES ARE SUGGESTED AND OPPORTUNITIES ARE IDENTIFIED, WHICH ULTIMATELY AIM TO IMPROVE AGRICULTURE AND ITS RELATIONSHIP TO ECONOMIC DEVELOPMENT IN THE REGION.
30
The stated goal of this report is to present a regional baseline assessment, highlight
statistics, present agri-businss-related sectors, and estimate the regional economic
impact of agriculture and agri-business. It is designed to be one step of an Agricultural
Economic Development Plan that promotes awareness and understanding of agriculture and agri-
business in relation to economic development in the region. Other steps of the plan include
listening sessions, a survey of farmers and an inventory of zoning ordinances of local units of
government throughout the Tri-County Region. The Agricultural Economic Development Plan’s aim is
to be flexible and evolving, allowing for feedback and modifications based on regional conditions
and changing trends.
Before policies, ideas and initiatives are sought, discussed and implemented, it is necessary to
understand where agriculture and agri-business stands—economically and in terms of crop
diversity—before changes are suggested and opportunities are identified, which ultimately aim
to improve agriculture and its relationship to economic development in the region.

the status, conditions and economic impacts
land
pol
icy
inst
itut
e
Appendix A: Data Sources and Issues
In 2006, the Land Policy Institute at MSU and the U.S. Department of Agriculture’s (USDA)
National Agriculture Statistics Service (NASS) entered into a partnership to produce the 2007
Cropland Data Layer (CDL) for Michigan. The funding for that effort was raised through a
cooperative partnership between LPI and collaborating MSU researchers (including the Integrated
Pest Management Program and the Computational Ecology and Visualization Laboratory). The result
was the completion of the 2007 and 2008 CDL and dissemination via partners and through the LPI
informatics unit.
This report relies on data collected and reported by the USDA NASS Census of Agriculture for 1997,
2002 and 2007, as well as CDL data for the year 2009. These two comprehensive sources are the most
reliable for examining the agricultural base and production at the county level in Michigan. This
report presents agricultural acreage, farms, sales and income as reported by the Census of Agriculture
and CDL.
The Census of Agriculture surveys farmers every five years, focusing on different crops and livestock
in each census. As a result, sales data for specific commodities is unavailable/incomplete for the years
discussed in this report. All dollar values reported have been adjusted for inflation to the year 2000
(a census year) for ease of interpretation and comparison across years. The multipliers utilized for the
inflation adjusted dollar values for each year are: 2007 values are adjusted down by 0.83; 2002 values
are adjusted down by 0.96; and 1997 values are adjusted up by 1.07. Hence, the values reported for 2007
and 2002 will be lower in value (deflated to the year 2000) than the actual values in 2002 and 2007,
and values reported for 1997 will be higher.
Several concerns regarding data obtained from the CDL and U.S. Census of Agriculture were
addressed during advisory team meetings. Primarily, those concerns were focused on the accuracy of
acreages for specialty crops reported in the CDL. Such a wide discrepancy between what is reported
in the CDL, and what farmers and other officials know to be true, is problematic. The purpose of the
following paragraphs, therefore, is to address this problem by providing more details on how the CDL
is composed and why acreage numbers are not likely to match.
Appendices
31

repo
rt
TRI-COUNTY AGRICULTURE
Appendix A: Data Sources (Cont.)
First, there are sure to be problems when trying to correctly classify acres of Christmas tree farms, for
example, via satellite imagery when one of the classifications incorporated into the CDL is the Natural
Land Cover Dataset. As its name would indicate, it includes natural land types—one of which is forest
and is sure to include coniferous trees. The CDL metadata section lists the “producer’s accuracy” of
this crop to be 24.43%.
Second, the CDL, by design, was never intended to provide accurate estimates of specialty or
“other crops.” One of the main purposes of the CDL program is to “provide acreage estimates to the
Agricultural Statistics Board for the state’s major commodities.”1
4 Additionally, the CDL relies on
three satellites to provide crop-specific land cover information at a ground resolution of 56 meters.
Additional inputs that aid crop classification and the overall CDL include such sources as the U.S.
Geological Survey (USGS), the National Elevation Dataset (NED), the USGS National Land Cover
Dataset 2001 (NLCD), and the NASA Moderate Resolution Imaging Spectroradiometer (MODIS). The
metadata of CDL explicitly states that its emphasis is producing agricultural land coverages, and that
“no farmer reported data are derivable from the CDL.”
Third, classification accuracy is cited as being 85–95% correct for the “major crop-specific land cover
categories.” Corn, soybeans and winter wheat are the most accurately predicted crop coverages, with
“producer’s accuracy” being no lower than 93% for each. The “user’s accuracy” is no less than 94%
for each major crop. Producer’s accuracy “indicates the probability that a ground truth pixel will be
correctly mapped,” whereas the user’s accuracy “indicates the probability that a pixel from the CDL
classification actually matches the ground truth data and measures ‘errors of commission.’”
The CDL mapping process goes through a rigorous process in order to achieve the final product. It
can be described as an “adjusted census by satellite.” The process by which the CDL progresses is
based on computer processing, where raw satellite imagery is processed with ancillary layers and
validation, which includes ground truthing layers and a decision tree, to create the final CDL. As
with any statistical or geospatial exercise, errors do occur. The CDL validation process includes
procedures for reducing error. For example, even though there are generally fewer cloudy days during
the summer months when the images are procured, there is the possibility of cloud cover masking the
ground. Over a series of a few days, it is hoped that an overall composite image is secured that avoided
capturing clouds, thus allowing for a more accurate image.
4. USDA, National Agriculture Statistics Service, 2009 Michigan Cropland Data Layer Metadata: http://www.nass.usda.gov/research/Cropland/metadata/metadata_mi09.htm.
32

the status, conditions and economic impacts
land
pol
icy
inst
itut
e
The Census of Agriculture also has error problems associated with it. Considering that the Census of
Agriculture Census Mail List contains more than 3.1 million records and that 2.1 million of them were
thought to meet the farm definition, obtaining 100% accuracy is surely impossible. Furthermore, the
census strives to follow-up with correspondence and procedures to ensure that it achieves at least a
75% response rate in all counties. For the 2007 census, the response rate was 85.2%.
The overall procedure utilized by the Census of Agriculture, explained in its own methodology
appendix, employs several components of an overall methodology that adjusts for undercoverage at
the county level, assigns weights and adjusts for non-respondents, and employs complex calibration
algorithms all as part of an attempt to count non-respondent farms. It also verifies reported responses
and checks internal processing for errors. Generally speaking, there are two types of errors to be
concerned about: 1) respondent and enumerator error; and 2) various census-based errors, such as
processing, classification and matching errors. The census fully discloses these sources of error and
offers remedies and adjustments to address them.
It is also important to remember where various statistics and measures are being cited from. The
Census of Agriculture does not break down specialty crops as well as the CDL. This is concerning
when one considers Michigan’s agricultural diversity. This is why acreages are reported from the CDL,
and sales, number of farms and other measures are reported from the census.
Another issue that arises from census data is comparability across multiple time periods. It is not
uncommon for the census to modify its methodology between census years. Therefore, data collected
or counted in 2002 may not be comparable to those from 1997. The Census of Agriculture corrects
this comparability issue, however, by applying 2002 criteria to the previously obtained measurements
obtained in 1997. In most cases, when examining the census data, the current census year being
examined also contains data from the previous census year. This allows for easy five-year comparisons.
33

repo
rt
TRI-COUNTY AGRICULTURE
Appendix B: Global Commodity Sales of Major Crops and Livestock
Global demand for food and fuel can affect price, resulting in fluctuating crop and
livestock prices over time. Market prices for crops peak in 2007–2008, contributing to
rising sales observed in census sales statistics and in Figures 3, 6, 9 and 12. Figures 13
and 14 lend a context for which to compare sales figures throughout the report.
Source: International Monetary Fund (IMF). Reported in nominal U.S. dollars. Not seasonally adjusted. See http://www.imf.org/external/np/res/commod/index.asp.
Figure 13: Global Corn, Soybean and Wheat Prices for 1996–2011
34

the status, conditions and economic impacts
land
pol
icy
inst
itut
e
Figure 14: Global Beef and Poultry Prices for 1996–2011
35
Source: International Monetary Fund (IMF). Reported in nominal U.S. dollars. Not seasonally adjusted. See http://www.imf.org/external/np/res/commod/index.asp.
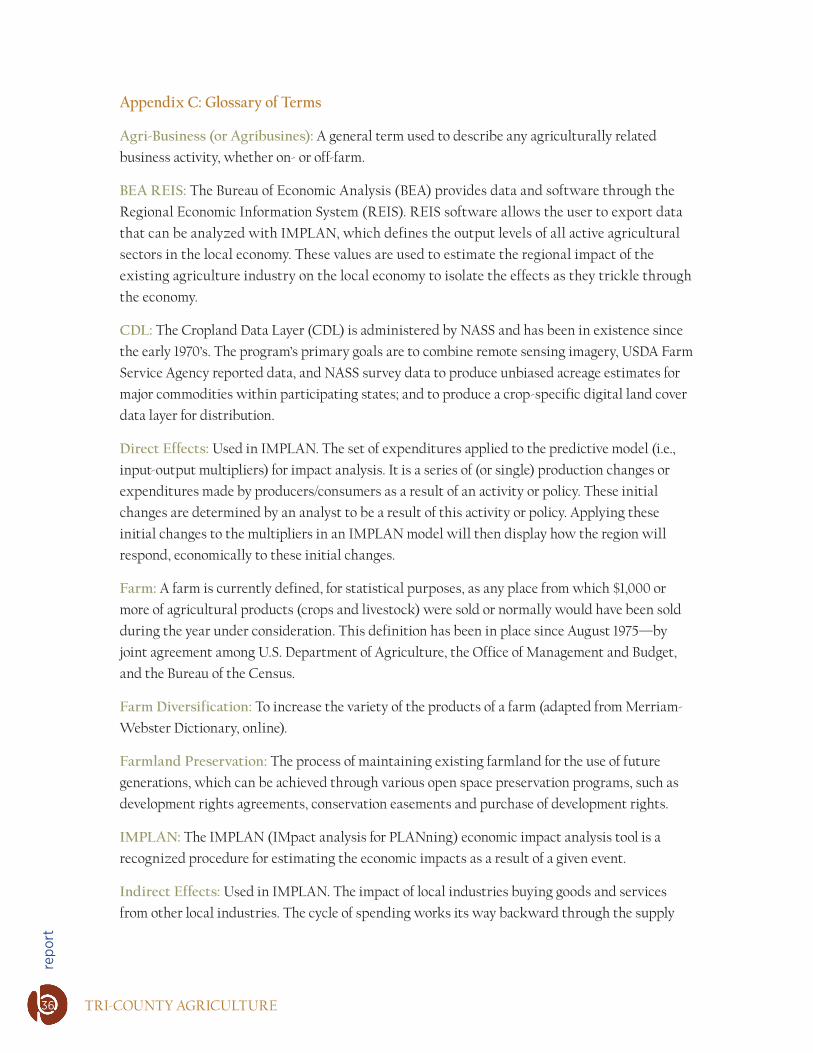
repo
rt
TRI-COUNTY AGRICULTURE
Appendix C: Glossary of Terms
Agri-Business (or Agribusines): A general term used to describe any agriculturally related
business activity, whether on- or off-farm.
BEA REIS: The Bureau of Economic Analysis (BEA) provides data and software through the
Regional Economic Information System (REIS). REIS software allows the user to export data
that can be analyzed with IMPLAN, which defines the output levels of all active agricultural
sectors in the local economy. These values are used to estimate the regional impact of the
existing agriculture industry on the local economy to isolate the effects as they trickle through
the economy.
CDL: The Cropland Data Layer (CDL) is administered by NASS and has been in existence since
the early 1970’s. The program’s primary goals are to combine remote sensing imagery, USDA Farm
Service Agency reported data, and NASS survey data to produce unbiased acreage estimates for
major commodities within participating states; and to produce a crop-specific digital land cover
data layer for distribution.
Direct Effects: Used in IMPLAN. The set of expenditures applied to the predictive model (i.e.,
input-output multipliers) for impact analysis. It is a series of (or single) production changes or
expenditures made by producers/consumers as a result of an activity or policy. These initial
changes are determined by an analyst to be a result of this activity or policy. Applying these
initial changes to the multipliers in an IMPLAN model will then display how the region will
respond, economically to these initial changes.
Farm: A farm is currently defined, for statistical purposes, as any place from which $1,000 or
more of agricultural products (crops and livestock) were sold or normally would have been sold
during the year under consideration. This definition has been in place since August 1975—by
joint agreement among U.S. Department of Agriculture, the Office of Management and Budget,
and the Bureau of the Census.
Farm Diversification: To increase the variety of the products of a farm (adapted from Merriam-
Webster Dictionary, online).
Farmland Preservation: The process of maintaining existing farmland for the use of future
generations, which can be achieved through various open space preservation programs, such as
development rights agreements, conservation easements and purchase of development rights.
IMPLAN: The IMPLAN (IMpact analysis for PLANning) economic impact analysis tool is a
recognized procedure for estimating the economic impacts as a result of a given event.
Indirect Effects: Used in IMPLAN. The impact of local industries buying goods and services
from other local industries. The cycle of spending works its way backward through the supply
36

the status, conditions and economic impacts
land
pol
icy
inst
itut
e
chain until all money exits the local economy, either through imports or by payments to value
added. The impacts are calculated by applying Direct Effects to the Type I Multipliers.
Induced Effects: Used in IMPLAN. The response by an economy to an initial change (direct
effect) that occurs through re-spending of income received by a component of value added.
IMPLAN’s default multiplier recognizes that labor income (employee compensation and
proprietor income components of value added) can support the regional economy. This money is
recirculated through the household spending patterns causing further local economic activity.
Labor Income: Used in IMPLAN. All forms of employment income, including Employee
Compensation (wages and benefits) and Proprietor Income.
Medicinal and Botanical Manufacturing: A Manufacturing subsector of the U.S. Census
Bureau North American Industry Classification System.
NASS: The U.S. Department of Agriculture’s (USDA) National Agricultural Statistics Service
(NASS) conducts yearly surveys and prepares reports related to nearly every aspect of U.S.
agriculture (adapted from online description at http://www.nass.usda.gov/About_NASS/index.asp).
Natural Lands: Defined here as all lands not classified as agricultural or urban. Includes land
covers, such as woodlands, wetlands, grass/pasture, water, shrubland, barren or fallow/idle
cropland. These land covers are identified using remotely sensed imagery from the National Land
Cover Dataset.
Property Type Income: Used in IMPLAN. Other property income includes dividends, interest
payments, rents and profits.
Right-to-Farm: In Michigan, the Right-to-Farm Act, P.A. 93, provides farmers with protection
from nuisance lawsuits and authorizes the Michigan Commission of Agriculture to develop
and adopt Generally Accepted Agricultural and Management Practices (GAAMPs) for farms
in Michigan (Michigan Department of Agriculture, online at http://www.michigan.gov/
mda/0,1607,7-125-1566_2311_2313-13052--,00.html).
Value Added: The process of increasing the economic value and consumer appeal of an
agricultural commodity through the use of alternative production and marketing strategies
(Michigan State University Extension, online at http://web1.msue.msu.edu/valueadded/).
Value of Output: Used in IMPLAN. Output represents the value of industry production. In
IMPLAN these are annual production estimates for the year of the data set and are in producer
prices. For manufacturers this would be sales plus/minus change in inventory. For service sectors
production = sales. For Retail and wholesale trade, output = gross margin and not gross sales.
37

repo
rt
TRI-COUNTY AGRICULTURE
Adelaja, A., D. Derr and K. Rose-Tank. 1989. “Economic and Equity Implications of Land-Use Zoning in Suburban Agriculture.” Journal of Agricultural Ethics 2:97–112.
Adelaja, A. and K. Rose-Tank. 1988. “Farm Viability Revisited: A Simultaneous Equation Cash Flow Approach.” Agricultural Finance Review 48:10–24.
Adelaja, A. and K. Sullivan. 1998. “Agricultural Viability at the Urban Fringe.” Working Paper. Department of Agricultural, Food and Resource Economics, Michigan State University, East Lansing, MI; and Cook College, Rutgers University, New Jersey, NJ. Available at: http://njsustainingfarms.rutgers.edu/PDF/Agricultural_Viability_at_the_Urban_Fringe.pdf.
Babb, E.M. and B.F. Long. 1987. “The Role of Alternative Agricultural Enterprises in a Changing Agricultural Economy.” Southern Journal of Agricultural Economics July: 7–16.
Blakely, E.J. and T.K. Bradshaw. 2002. Planning Local Economic Development. Thousand Oaks, CA: Sage Publications.
Johnston, B.F. and J.W. Mellor. 1961. “The Role of Agriculture in Economic Development.” The American Economic Review 51(4):566–593.
Keeney, D. and L. Kemp. 2003. “A New Agricultural Policy for the United States.” A paper produced for the 2002 NATO Advanced Research Workshop on Biodiversity Conservation and Rural Sustainability. Institute for Agriculture and Trade Policy, Minneapolis MN; and The Minnesota Project, St. Paul MN. Available at: http://www.mnproject.org/pdf/ANewAgriculturePolicyfortheU.S.byDennisKeeneyLo..pdf.
Leholm, A., R. Vlasin and J. Ferris. 2003. “Michigan’s Agricultural, Forestry, and Mining Industries.” In Michigan at the Millennium, eds. C.L. Ballard, P.N. Courant, D.C. Drake, R.C. Fisher and E.R. Gerber. East Lansing, MI: Michigan State University Press.
Offutt, S., B. Kuhn and M. Morehart. 2004. “Devolution of State Programs Could Broaden States’ Roles in Agricultural Policy.” Amber Waves: The Economics of Food, Farming, Natural Resources and Rural America 10:1–8.
Self, S. and R. Grabowski. 2007. “Economic Development and the Role of Agricultural Technology.” Agricultural Economics 36(3):395–404.
Photos by The Allen Neighborhood Center, pg. 5 (fruit and tomato photos); Andrea Bommarito, pg. v; Aunt Owwee, front cover bottom and pg. 5 (cows); EllenM1, front cover top; Joel Dinda, pgs. 5 and back cover bottom (farm); Martin LaBar, pg. 17; Michigan State University, pg. 35; MSUAgBioResearch, pg. 27; MSU ANR Communications; pgs.19 and. 30; stock.exchng, back cover top; and stock photography, pgs. 4 and 5 (wheat).
References
38

the status, conditions and economic impacts
land
pol
icy
inst
itut
e
The Report OnlineThis report is available online at www.landpolicy.msu.edu/Tri-CountyAgReport.
Michigan State University has been advancing knowledge
and transforming lives through innovative teaching, research
and outreach for more than 150 years. MSU is known
internationally as a major public university, with global reach
and extraordinary impact. Its 17 degree-granting colleges
attract scholars worldwide who are interested in combining
education with practical problem solving. www.msu.edu.
The School of Planning Design and Construction will be
known for leading education, research and outreach towards
the integration of planning, design and construction to
create a sustainable built and natural environment. The goal
of SPDC is to create knowledge that enriches communities,
advances economic and family life through leadership, fosters
the development of entrepreneurial creativity, imbues a sense
of social responsibility, promotes the appreciation of cultural
relevance, and above all, advances the understanding of
environmentally beneficial planning, design and construction.
www.spdc.msu.edu
The Land Policy Institute partners with the School of
Planning, Design and Construction at Michigan State
University to provide policy makers at the federal, state, local
level and beyond with science-based tools and solutions that
help build a better quality of life, strengthen the economy and
protect the environment in ways that are fair to all. The LPI
works to encourage collaboration among land use researchers,
policy makers and community organizations.
www.landpolicy.msu.edu.
School of Planning, Design and Construction
39
Land Policy Institute

repo
rt
TRI-COUNTY AGRICULTURE
LAND POLICY RESEARCH
Land Policy InstituteMichigan State University1405 S. Harrison Road3rd Floor Manly Miles BuildingEast Lansing, MI 48823
517.432.8800517.432.8769 fax
www.landpolicy.msu.edu

Prepared by the Land Policy Institute at MSU, June 2011
Tri-County Farmer Survey: Summary of Results
Strongly disagree
10%
Neutral 2%
Agree 34%
Strongly agree 54%
1. Economic development efforts in this region should include agriculture production as a source of economic growth and stability.
Strongly disagree
4%
Disagree 34%
Neutral 24%
Agree 22%
Strongly agree 16%
2. It is up to the farmers in this region, NOT the community and economic development initiatives, to seek out and expand agricultural markets and opportunities.

Prepared by the Land Policy Institute at MSU, June 2011
Disagree 10%
Neutral 26%
Agree 42%
Strongly agree 18%
Don’t know 4%
3. Local efforts that support the "local food movement" will enhance my farm business.

Prepared by the Land Policy Institute at MSU, June 2011
4. Please rank your level of agreement with the following statements. It is important for our regional
economy to:
Disagree 4%
Neutral 20%
Agree 44%
Strongly agree 32%
a. boost sales and production in specialty crops. Strongly
disagree 4%
Disagree 6%
Neutral 29%
Agree 44%
Strongly agree 15%
Don’t know
2%
b. boost sales in agri-tourism.
Strongly disagree
4%
Disagree 16%
Neutral 32%
Agree 28%
Strongly agree 20%
c. boost sales and production in organic farming.
Strongly disagree
2%
Disagree 4%
Neutral 16%
Agree 56%
Strongly agree 22%
d. increase food processing business.

Prepared by the Land Policy Institute at MSU, June 2011
4. Please rank your level of agreement with the following statements. It is important for our regional
economy to (continued):
Note: These represent weighted results. Number of responses “most important” multiplied by 3; “second most important”
multiplied by 2; “third most important” multiplied by 1. Weighted results were then summed.
Strongly disagree
6%
Disagree 10%
Neutral 10%
Agree 48%
Strongly agree 26%
e. boost sales and production of alternative energy. Disagree
4%
Neutral 10%
Agree 54%
Strongly agree 30%
Don’t know
2%
f. increase farm access to advanced agricultural technologies..
0 10 20 30 40 50 60
Agri-tourism
Specialty Crops
Organic farming
Food processing business
Livestock
Alternative energy
Commodity crops
Advanced agricultural technology
5. Considering that the promotion of agriculture is part of the region’s economic development effort, please select three segments from the following areas of focus with the most potential for economic growth in the region.

Prepared by the Land Policy Institute at MSU, June 2011
6. Please rank your level of agreement with the following statements.
Strongly disagree
2% Disagree
4%
Neutral 10%
Agree 50%
Strongly agree 32%
Don’t know
2%
a. The global economy has a significant impact on the success of agriculture in this region.
Strongly disagree
4%
Disagree 14%
Neutral 6%
Agree 32%
Strongly agree 44%
b. Development pressure of agricultural land is a large issue threatening the future of agriculture in this region of the state.
Strongly disagree
2%
Neutral 30%
Agree 50%
Strongly agree 18%
c. Various on-site farm activities like u-pick, festivals, markets and other agriculture
events are important for increasing agricultural sales in our region.

Prepared by the Land Policy Institute at MSU, June 2011
7. What do you see as the greatest opportunities to help strengthen or expand agriculture and ag-related
businesses in the Clinton-Eaton-Ingham county region? Please explain.
Open-ended response. Responses not disclosed.
8. What do you feel is holding back the expansion of agriculture and agri-business in the Clinton-Eaton-
Ingham county region? Please Explain.
Open-ended response. Responses not disclosed.
Yes 12%
No 64%
Not sure 24%
9. Would you sell your farm if offered a fair market value?

Prepared by the Land Policy Institute at MSU, June 2011
0 5 10 15 20 25
Give it to others
Will it to others
Gift the farm to a conservation organization
Other
Sell it to a family member
Sell it to others
Give it to a family member
Undecided
Will it to a family member
10. What do you plan to do with your land when you retire from farming? Please check all that apply.
0
5
10
15
20
25
30
35
11. Do you provide or allow any of the following farm- and non-farm-related activities on your farm? If so, do you charge a fee?
Provided/allowed
YES: Fee charged

Prepared by the Land Policy Institute at MSU, June 2011
0
5
10
15
20
25
30
12. Please estimate what percent of your agricultural income were from the following market outlets.
76-100%
51-75%
25-50%
16-25%
6-15%
1-5%
None
0 1 2 3 4 5
Biosolids application
Hydroponics
On-farm food processing
Renewable energy (biofuel, wind,solar) production
Organic farming
Other
Specialty crop production
13. Have you expanded your farming operations into any of the following emerging agribusiness activities in the past 5 years? (Please check all that apply.)

Prepared by the Land Policy Institute at MSU, June 2011
Very important 48%
Somewhat important
18%
Neutral 16%
Somewhat important
4%
Didn’t know about the law/ makes no
difference 14%
14. How important is the state Right-to-Farm law to the success of your business?
1-25% 6%
26-50% 4%
51-75% 2%
76-100% 18%
None 70%
15. What percentage of your land is currently enrolled in PA116 (The Farmland and Open Space Preservation Program)?

Prepared by the Land Policy Institute at MSU, June 2011
19%
29%
31%
21%
16. Does your operation generate sufficient revenues to cover your expenses?
a) Yes – enough that my operation is my primary source of income
b) Yes – enough that my operation is my secondary source of income
c) No – my revenues cover my expenses but does not meaningfully contribute to my total income
d) No – my revenues do not cover my expenses
1-5 acres 6%
6-10 acres 10%
11-20 acres 6%
21-40 acres 8%
41-80 acres 17%
81-160 acres 15%
161-500 acres 17%
501 or more acres 21%
17. How many acres do you currently operate?

Prepared by the Land Policy Institute at MSU, June 2011
0 5 10 15 20 25 30
Nursery crops (field only, Christmas trees)
Nursery crops (greenhouse only)
Aquaculture
Poultry
Horses
Other (please specify)
Tree fruit
Berries (blueberries, grapes, raspberries, cranberries)
Vegetables
Other livestock (goats, sheep)
Wood products
Dairy and beef
Field crops (hay, potatoes, sweet potatoes)
Cash grain (corn, soybeans, wheat, barley, oil seeds,…
18. What are the primary crops grown or livestock raised on your farm? (Please check all that apply.)
0
2
4
6
8
10
12
14
16
18
0-3 years 4-9 years 10-15 years 16-29 years 30-39 years More than 40years
19. For how many years have you been working as a farmer?

Prepared by the Land Policy Institute at MSU, June 2011
22. Please provide any additional comments you think are important and we should know about.
Open-ended response. Responses not disclosed.
Survey notes:
Total number of respondents from Clinton, Eaton and Ingham Counties: 50
All respondents did not necessarily answer all questions throughout the survey.
0
5
10
15
20
25
30
Clinton Eaton Ingham Other
20. I operate my farm in __________County (please check all that apply).
18-29 10%
30-39 8%
40-49 6%
50-59 28%
60+ 48%
21. I am between the ages of:

Prepared by Associates at the Planning & Zoning Center at MSU, June 2011 1
Tri-County Agricultural Zoning Assessment
Prepared By: Ryan Soucy, Research Assistant, Planning & Zoning Center Mark Jones, Graduate Assistant, Planning & Zoning Center
Mark Wyckoff, Director, Planning & Zoning Center
A 23-question assessment tool was developed to aid in the identification of agricultural-related provisions found in local master plans and zoning ordinances in the Tri-County Region (Clinton, Eaton and Ingham Counties.) Forty-two jurisdictions consisting of county, township, city and village governments that engage in zoning were assessed using this tool.
Master plans, zoning ordinances and other related ordinances were sought from each community in the study area that were known to engage in planning and zoning. Attempts to obtain documents began through internet searches; primarily the community’s official website or a third-party service, such as Municode (http://www.municode.com/). If documents were not able to be obtained through this method, they were searched at Tri-County Regional Planning Commission’s library. Obtained documents were analyzed using the assessment tool and results for individual communities were recorded and tabulated (see attached spreadsheet).
Of the 48 townships within the study area, 23 were assessed; the remaining townships were not examined due to being under the authority of county planning and zoning. Documents were unable to be obtained from Ingham Township and, as a result, it was the only township with local planning and zoning authority that was not examined. Eighteen cities and villages that possess local zoning, as well as two counties (Clinton and Eaton) and Michigan State University, make up the remainder of the 42 jurisdictions assessed. Ingham County does not engage in planning and zoning at the county level on behalf of local jurisdictions and, therefore, was not included in this total.
Agricultural Planning in the Tri-Counties Master plans within the study area were assessed for the presence of goals, objectives, strategies and action items related to agricultural economic development. Master plan documents were obtained from 26 out of the 42 communities surveyed. Twelve of the 26 master plans were created or updated since the passage of the Michigan Planning Enabling Act in 2008.
The goal of farmland or agricultural preservation was contained in 19 of the 26 community master plans. Strategies for attaining this goal were primarily through the use of conservation easement agreements, transfers and purchases of development rights, enrollment in the Michigan Farmland & Open Space Preservation Program (PA 116), and zoning regulations. Communities that were more urban and contained few to no agricultural districts within their jurisdiction were more likely to lack agricultural zoning preservation goals.
Goals, objectives, and strategies that related specifically to agricultural economic development were much less prevalent than farmland or agricultural preservation goals. Ten of the 26 master plans stated a desire for improving or maintaining the viability of the local agricultural economy.

Prepared by Associates at the Planning & Zoning Center at MSU, June 2011 2
Of these 10 communities, four identified that these goals should be met by stabilizing property values of agricultural lands or reducing pressure to develop for non-agricultural purposes. The assessment indicated that 10 of the 26 master plans included specific agricultural-related uses, such as urban agriculture, chicken farming in non-agricultural zones, and farmer’s markets as either a current asset or part of a vision for the community’s future.
Agricultural Zoning in the Tri-Counties Agricultural zoning within the identified jurisdictions includes such things as where agricultural zoning occurs, where these zones are distributed throughout the Tri-County Region, and what uses are permitted within these zones.
Twenty-two of the 28 zoning ordinances were created or amended since passage of the Michigan Zoning Enabling Act in 2006. The Village of Dimondale’s zoning ordinance is the most recently updated of any of the ordinances collected, citing a creation date of 2011. White Oak Township has the oldest ordinance in the study area, with a creation date citing 1995, with no mention of any amendments.
County zoning covers 13 of the 16 townships in Clinton County; the three remaining charter townships, as well as five other cities and villages, have their own regulations. County zoning covers approximately 75% of the total land area in Clinton County; of that percentage it is estimated that 75% of that land is zoned for agriculture.
In Eaton County, county zoning covers 12 of the 16 townships, while four townships and eight cities and villages engage in local zoning. County zoning covers approximately 70% of the total land area in Eaton County; of that percentage, it is estimated that 60% of that land is zoned for agriculture.
Ingham County does not engage in county zoning. All 16 townships, six municipalities and Michigan State University have local zoning. It is estimated that 50% of the land within Ingham County is zoned for agriculture.
While each local zoning ordinance varies, the majority of jurisdictions (57%) have only a single agriculture zoning district for general agricultural activities (farming, raising livestock, etc.) Clinton County’s zoning ordinance contained three different types of agricultural districts, the most of any jurisdiction in the study area. Eaton County’s zoning ordinance contained two types of agricultural districts; an LA (Limited Agriculture) district and an RC (Resource Conservation) district. Eaton County’s Resource Conservation district provides functions similar to Clinton County’s AP (Agricultural Preservation) district, but with additional provisions for open space conservation. Within jurisdictions characterized by suburban growth or encroaching development, 10 jurisdictions provide additional agricultural districts specifically for preservation of prime farmland or transitional districts that serve to protect traditional agricultural zones. Although most districts do not make use of a specialized zone for agricultural preservation, a desire for the preservation of prime farmlands is cited in 18 of the 21 Tri-County township ordinances.
Beyond the City of Lansing and its immediate urban and suburban neighboring jurisdictions, the percentage of land zoned for agriculture increases significantly. Typically, urban/suburban

Prepared by Associates at the Planning & Zoning Center at MSU, June 2011 3
communities adjacent to the City of Lansing, such as Delta or DeWitt Townships range from 0% to 20% agricultural zoning. Beyond these jurisdictions, rural townships like Eagle and Alaiedon are near 75% to 80%.
Among the typical uses permitted in agricultural zones, the most commonly cited were roadside stands (28 occurrences), commercial nurseries and/or greenhouses (28 occurrences), veterinary clinics (26 occurrences) and home-based businesses (26 occurrences). While many other common agricultural uses were not specifically cited, it was typical for a community to provide for these types of uses by permitting “all uses incidental to a farming operation.”
Regulations in Agricultural Districts Large minimum lot sizes for agricultural zones impede the further reduction of farmlands. When large minimums are present (as with Clinton County and Wheatfield Township 40-acre Agricultural Preservation zones) the likelihood that land will be parceled-off for subdivision development becomes much lower as long as farmland remains in an agricultural district. Jurisdictions that protect these large contiguous tracts of land are typically characterized by a more concentrated farming community with an abundance of agricultural land. Jurisdictions that allow for smaller minimum lot sizes (like the Village of Elsie with 20,000 square foot agricultural lots) are more typified by “gentleman farmer” acreage than active agricultural operations. The average minimum size for a lot in an agricultural district in the Tri-County area was 3.6 acres.
Approximately half of the Tri-County townships (10 of 21) regulate in some manner, the maximum number of animals permitted within agricultural uses. Some examples of these regulations include basic per animal limits, sliding scales based on lot area, and the less common calculation of “animal units” per unit of area. Cities and villages, on the other hand, do not typically address limits on the number of animals permitted on-site. These limits may be contrary to GAAMPs adopted under the Right-to-Farm Act. Most cities and villages do not allow for the keeping of non-household animals in any zone within the jurisdiction; only five of the 19 cities and villages set limits on the number of animals allowed to be kept in the zoning ordinance.
Most jurisdictions (26 out of 31) that allow the keeping of animals provide setback standards for structures used to house livestock and other farm animals. The most common standard for a majority of these regulations is 100 feet from any lot line. Such setback regulations are likely contrary to adopted GAAMPs once past a couple of animals.
Agricultural Activities in Non-Ag Zones Of all the communities that were assessed, the results show that a significant majority, 31 out of 42 jurisdictions, allow for some form of agricultural activity in districts not zoned for agriculture. For the most part, the uses that were permitted consisted primarily of growing crops for non-commercial purposes in low-density residential zones and in some cases allowed for the raising of chickens.
The agricultural use most commonly associated with non-agricultural zones in any jurisdiction was the use of roadside stands for the sale of agricultural products. Slightly under half (nine out of 19) of the study area’s cities and villages allowed for the placement of roadside stands in districts not zoned for agriculture; however, both Clinton County and Eaton County’s zoning ordinances did not allow stands in non-agricultural districts.

Prepared by Associates at the Planning & Zoning Center at MSU, June 2011 4
PDR/TDR All three counties (Clinton, Eaton and Ingham) authorize a Transfer or Purchase of Development Rights (TDR or PDR) program. Alaiedon Township is the only non-county jurisdiction within the study area that authorizes its own TDR program. No data was examined that measures the effectiveness of these PDR or TDR programs.
Summary Though outdated documents are not particularly pervasive in the Tri-County Region, up-to-date documents are an integral step in any planning and zoning exercise, and so it is recommended that master plans and zoning ordinances should be updated and amended as regularly as possible.
Eight out of 26 communities in the Tri-County Region have master plans dated older than the Michigan Planning Enabling Act of 2008. Given this fact, it may be a good opportunity for these communities to update their local master plans and consider adding goals and objectives for the preservation of farmlands and develop strategies to improve the local agricultural economy. Communities with a significant amount of agricultural land, as well as those communities that are under pressure to develop what remaining agricultural lands are left, should be the most interested in developing contemporary plans for safeguarding agricultural activities in the long-term.
Five out of 36 communities in the Tri-County Region have zoning ordinances dated older than the Michigan Zoning Enabling Act of 2006, and may be in danger of being at odds with State laws. It is recommended that all communities (especially those with ordinances older than the Michigan Zoning Enabling Act of 2006) read through the Michigan Right-to-Farm Act, as well as the current versions of Michigan’s 2010 and 2011 GAAMPs, and then re-evaluate their local zoning ordinances for possible amendment additions. For Tri-County communities (especially those subject to increasing development and encroachment into agricultural lands), local zoning regulations should be consistent with goals and objectives set-forth in the master plan. If agricultural preservation is a goal, the local zoning ordinance should reflect this by providing sufficient regulations and districts for preservation and transitioning between uses.
Agricultural activities in non-agricultural zones are a growing trend in the Tri-County Region. An example of this is the 12 communities that allow for the raising of chickens in residential districts and the numerous others currently debating ordinance amendments in favor of the practice. Communities that have adopted measures of this nature tend to be less traditional in regard to zoning and the separation of uses, and were characterized by having zones of mixed-uses, as with the City of East Lansing and Meridian Township. Clinton and Eaton counties, as well as a majority of townships that engage in zoning (13 of 22) take the traditional approach of separating uses by allowing for most typical agricultural activities only in agricultural, conservation and rural residential zones.