a physics toolkit chapter 1. a physics toolkit use mathematical tools to measure and predict. apply...
TRANSCRIPT

A Physics ToolkitChapter
1

A Physics Toolkit
Use mathematical tools to measure and predict.
Apply accuracy and precision when measuring.
Display and evaluate data graphically.
Chapter
1
In this chapter you will:

Table of Contents
Chapter 1: A Physics Toolkit
Section 1.1: Mathematics and Physics
Section 1.2: Measurement
Section 1.3: Graphing Data
Chapter
1

Mathematics and Physics
Demonstrate scientific methods.
Use the metric system.
Evaluate answers using dimensional analysis.
Perform arithmetic operations using scientific notation.
In this section you will:
Section
1.1

Mathematics and Physics
Physics is a branch of science that involves the study of the physical world: The study of energy and matter, and how they are related.
1.) What is Physics?
Section
1.1
What types of careers do people with a background in physics have?

Mathematics and Physics
Physics uses numerical results to make predictions and to support theories and form conclusions.
2.) Will we use a lot of math in physics?
Section
1.1

Mathematics and Physics
Electric Current
The potential difference, or voltage, across a circuit equals the current multiplied by the resistance in the circuit. That is, V (volts) = I (amperes) × R (ohms). What is the resistance of a lightbulb that has a 0.75 amperes current when plugged into a 120-volt outlet?
Section
1.1

Electric Current
Rewrite the equation so that the unknown value is alone on the left.
Mathematics and PhysicsSection
1.1
V = IR

Mathematics and Physics
Electric Current
Section
1.1
IR = V
Reflexive property of equality.
Divide both sides by I.

Mathematics and Physics
Electric Current
Section
1.1
Substitute 120 volts for V, 0.75 amperes for I.
Resistance will be measured in ohms.

Mathematics and Physics
3.) What are the seven SI base units?
Section
1.1

Mathematics and Physics
It is regulated by the International Bureau of Weights and Measures and the National Institute of Science and Technology (NIST).
4.) How is the SI regulated?
Section
1.1

Mathematics and Physics
An advantage is that conversions are easy because they are all multiples of ten.
Prefix Multiplier symbolKilo 1000 x base K Hecto 100 x base HDeka 10 x base DBase (meter) 1 x baseDeci 0.1 x base dCenti 0.01 x base cMilli 0.001 x base m
5.) What is an advantage of using SI Units?
Section
1.1

Mathematics and Physics
.femto 1 X 10-15 x base fpico 1 x 10-12 x base pnano 1 x10⁻⁹ x base nmicro 1 x 10⁻⁶ x base μmega 1 x 10 6 x base Mgiga 1 x 10 9 x base Gtera 1 x 10 12 x base T
Additional prefixes
Section
1.1

Mathematics and Physics
A method of problem solving that uses units to set up problems.
For example, if you are finding a speed and you see that your answer will be measured in s/m or m/s2, you know you have made an error in setting up the problem.
6.) What is dimensional analysis?
Section
1.1

Mathematics and Physics
A fraction used in dimensional analysis in which the numerator and denominator have different units but equal to each other in value. All conversion factors have a value of one.
For example, because 1 kg = 1000 g, you can construct the following conversion factors:
7. What is a conversion factor?
Section
1.1

Mathematics and Physics
Choose a conversion factor that will make the units cancel, leaving the answer in the correct units.
For example, to convert 1.34 kg of iron ore to grams, do as shown below:
Dimensional Analysis
Section
1.1

Mathematics and Physics
Significant digits are the valid digits in a measurement. The last digit is estimated but is still considered valid.
Significant digits are only applicable with measurements.
On a scale, all marked increments are considered valid.
On a digital scale the last digit is the estimated value.
8.) What are Significant Digits?
Section
1.1

Mathematics and Physics
1.) Non-zero numbers are always significant.
2.) Any zeros between two significant digits are significant.
3.) A final zero or trailing zeros in the decimal portion ONLY are significant.
0.0007500 Km = .7500 m = 750.0 mm
0.0007500 Km = .7500 m = 750.0 mm
All have four significant digits
Rule for determining the number of Significant Digits
Section
1.1

Mathematics and Physics
Atlantic Pacific Rule
Section
1.1
Use this diagram to help determine the number of significant figures in a measured value…
Pacific Atlantic
If the decimal point is present, start counting digits from the Pacific (left) side, starting with the first non-zero digit.
If the decimal point is absent start counting digits from the Atlantic (left) side, starting with the first non-zero digit.

Mathematics and Physics
When you perform any arithmetic operation, it is important to remember that the result never can be more precise than the least-precise measurement.
To add or subtract measurements, first perform the operation, then round off the result to correspond to the least-precise value involved.
10 + 11.6 + .2 = 21.8 but we cant report the tenth place because of the first value
1011.6 0.2 21.8 so we have to round to 22
9.) How do you deal with addition and subtraction with significant digits?
Section
1.1

Mathematics and Physics
Perform the operation and then report the smallest number of significant digits as found in any of the factors.7 x .125 x 6.125 = 5.359375
1 3 4 = can only report one sig fig
The answer that can be reported is 5. Just because the calculator gives us all of those place values doesn’t mean that all of a sudden we were that precise when we measured.
10.) How do you deal with multiplication and division with significant digits?
Section
1.1

Mathematics and Physics
A systematic method of observing, experimenting and analyzing to answer questions about the natural world.
11.) What is the Scientific Method?
Section
1.1
12.) What is a hypothesis?
An educated guess about how variables are related.

Mathematics and Physics
A scientific law describes relationships in nature without attempting to explain them. We talk about what happens but not why. i.e. Law of Gravity
A scientific theory attempts to explain the phenomenon. i.e. Theory of Evolution
13.) What is the difference between a scientific law and a theory?
Section
1.1
Mathematics and Physics
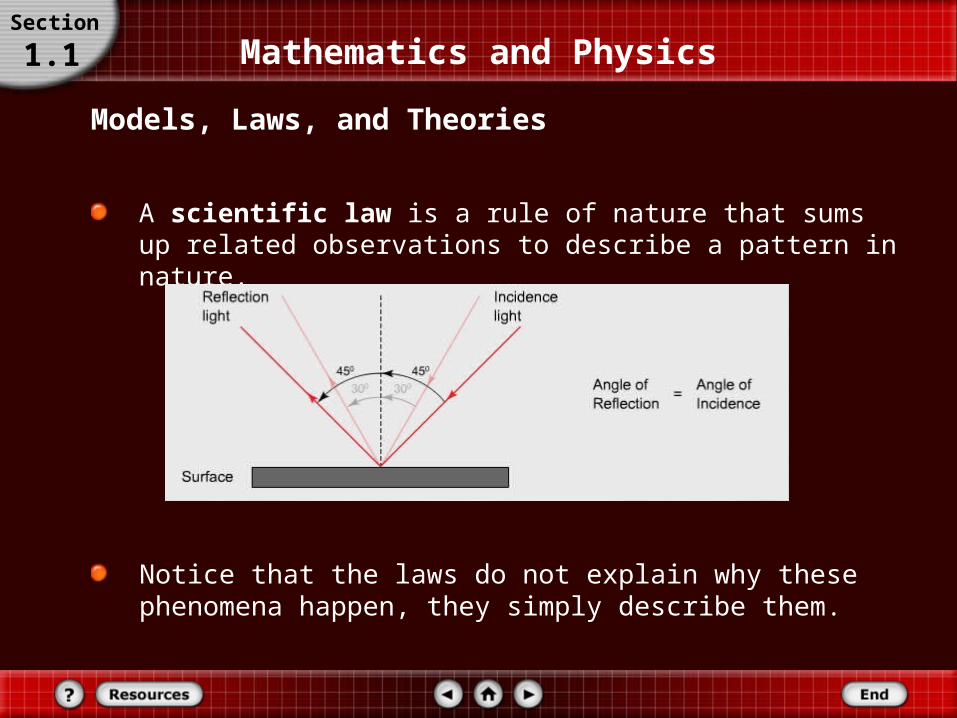
A scientific law is a rule of nature that sums up related observations to describe a pattern in nature.
Models, Laws, and Theories
Section
1.1
Notice that the laws do not explain why these phenomena happen, they simply describe them.

Section Check
The potential energy, PE, of a body of mass, m, raised to a height, h, is expressed mathematically as PE = mgh, where g is the gravitational constant. If m is measured in kg, g in m/s2, h in m, and PE in joules, then what is 1 joule described in base unit?
Question 1
Section
1.1
A. 1 kg·m/s
B. 1 kg·m/s2
C. 1 kg·m2/s
D. 1 kg·m2/s2

Section Check
Answer: D
Answer 1
Reason:
Section
1.1
Section Check
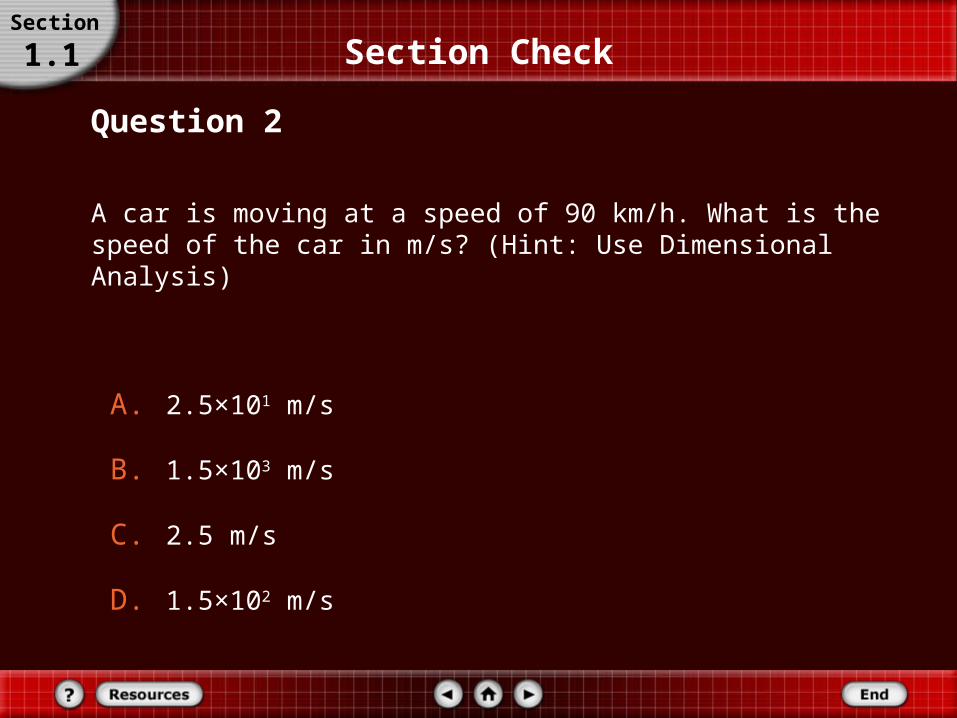
A car is moving at a speed of 90 km/h. What is the speed of the car in m/s? (Hint: Use Dimensional Analysis)
Question 2
Section
1.1
A. 2.5×101 m/s
B. 1.5×10³ m/s
C. 2.5 m/s
D. 1.5×10² m/s

Section Check
Answer: A
Answer 2
Reason:
Section
1.1

Section Check
Which of the following representations is correct when you solve 0.030 kg + 3333 g using scientific notation?
Question 3
Section
1.1
A. 3.333×10³ g
B. 3.36×10³ g
C. 3×10³ g
D. 3363 g

Section Check
Answer: A
Answer 3
Section
1.1
Reason: When you compare place value. The only place value they have in common is the ones place.
3333+ 0.0303333.030 we can only report 3333 as our most precise value.

Measurement
Distinguish between accuracy and precision.
Determine the precision of measured quantities.
In this section you will:
Section
1.2

Measurement
A measurement is a comparison between an unknown quantity and a standard.
14.)What is a Measurement?
Section
1.2

Measurement
.
Are these three measurements in agreement with each other?
Section
1.2

Measurement
When a measurement is made, the results often are reported with an uncertainty.
Therefore, before fully accepting a new data, other scientists examine the experiment, looking for possible sources of errors, and try to reproduce the results.
A new measurement that is within the margin of uncertainty confirms the old measurement.
Comparing Results
Section
1.2

Measurement
Precision Versus Accuracy
Section
1.2
Click image to view the movie.

Measurement15.) What is precision?
The degree of exactness. How repeatable a value is.
Student 3 is the most precise because the it has the smallest amount of uncertainty.
Generally precision is ½ of theSmallest division of the Instrument.
Section
1.2

Measurement
16.) What is accuracy?
A description of how well the results of a measurement agree with the “real” value.
Section
1.2

Measurement
17.) What is two point calibration?
A method for checking the accuracy of an instrument.
Section
1.2

Techniques of Good Measurement
The apparent shift in the position of an object when viewed from a different angle.
18.) What is a parallax?
Section
1.2

Measurement
Scales should be read with one’s eye directly above the measure.
Techniques of Good Measurement
Section
1.2
(a)
(b)
If the scale is read from an angle, as shown in figure (b), you will get a different, and less accurate, value.
The difference in the readings is caused by parallax, which is the apparent shift in the position of an object when it is viewed from different angles.

Section Check
Ronald, Kevin, and Paul perform an experiment to determine the value of acceleration due to gravity on the Earth (980 cm/s2). The following results were obtained: Ronald - 961 ± 12 cm/s2, Kevin - 953 ± 8 cm/s2, and Paul - 942 ± 4 cm/s2. Justify who gets the most accurate and precise value.
Question 1
Section
1.2
A. Kevin got the most precise and accurate value.
B. Ronald’s value is the most accurate, while Kevin’s value is the most precise.
C. Ronald’s value is the most accurate, while Paul’s value is the most precise.
D. Paul’s value is the most accurate, while Ronald’s value is the most precise.

Section Check
Answer: C
Answer 1
Section
1.2
Reason: Ronald’s answer is closest to 980 cm/s2 and hence his result is the most accurate. Paul’s measurement is the most precise within 4 cm/s2.

Section Check
What is the precision of an instrument?
Question 2
Section
1.2
A. The smallest division of an instrument.
B. The least count of an instrument.
C. One-half of the least count of an instrument.
D. One-half of the smallest division of an instrument.

Section Check
Answer: D
Answer 2
Section
1.2
Reason: Precision depends on the instrument and the technique used to make the measurement. Generally, the device with the finest division on its scale produces the most precise measurement. The precision of a measurement is one-half of the smallest division of the instrument.

Section Check
A 100-cm long rope was measured with three different scales. The answer obtained with the three scales were:
1st scale - 99 ± 0.5 cm, 2nd scale - 98 ± 0.25 cm, and 3rd scale - 99 ± 1 cm. Which scale has the best precision?
Question 3
Section
1.2
A. 1st scale
B. 2nd scale
C. 3rd scale
D. Both scale 1 and 3

Section Check
Answer: B
Answer 3
Section
1.2
Reason: Precision depends on the instrument. The measurement of the 2nd scale is the most precise within 0.25 cm.

Graphing Data
Graph the relationship between independent and dependent variables.
Interpret graphs.
Recognize common relationships in graphs.
In this section you will:
Section
1.3
Graphing Data
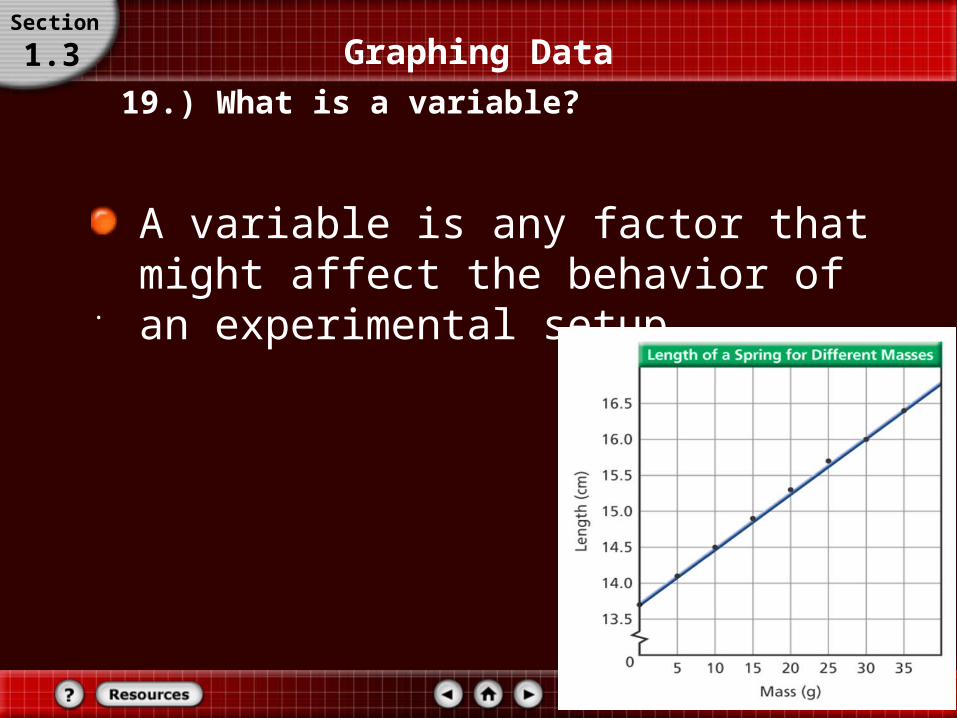
A variable is any factor that might affect the behavior of an experimental setup.
19.) What is a variable?
Section
1.3
.

Graphing Data
Graphing Data
Section
1.3
Click image to view the movie.

Graphing Data
The factor that is changed or manipulated by the experimenter during the experiment.
20.) What is the independent variable?
Section
1.3
.

Graphing Data
The factor that depends on the independent variable.
21.) What is the dependent variable?
Section
1.3
.

Graphing Data
The independent variable is placed on the x axis.
The dependent variable is placed on the y axis
22.) Where are the dependent and independent variables placed on a graph?
Section
1.3
.

Graphing Data
The line that is drawn as close to all the data points as possible. The line of best fit is used for predictions.
23.) What is the line of best fit?
Section
1.3
.

Graphing Data
Scatter plots of data may take many different shapes, suggesting different relationships.
Linear Relationships
Section
1.3

Graphing Data
When the line of best fit is a straight line.
24.) What is a linear relationship?
Section
1.3
The relationship can be written as an equation.
b is the y intercept
m is the slope

Graphing Data
The slope is the ratio of the vertical change to the horizontal change. To find the slope, select two points, A and B, far apart on the line. The vertical change, or rise, Δy, is the difference between the vertical values of A and B. The horizontal change, or run, Δx, is the difference between the horizontal values of A and B.
Linear Relationships
Section
1.3

Graphing Data
Slope is the ratio of the vertical change to the horizontal change.
Slope is easy and fun, its simply rise over run.
m= rise / run
m= Δy / Δx
Note : Δ (delta) means “change in”
25.) What is slope?
Section
1.3

Graphing DataIf y gets smaller when x gets larger the slope is negative.
If y gets larger when x gets larger the slope is positive.
Section
1.3

Graphing Data
When the graph is not a straight line, it means that the relationship between the dependent variable and the independent variable is not linear.
26.) What are two types of nonlinear graphs ( graphs that are not straight lines)?
There are many types of nonlinear relationships in science. Two of the most common are the quadratic and inverse relationships.
Nonlinear Relationships
Section
1.3

Graphing Data
The graph shown in the figure is a quadratic relationship.
27.) What is a quadratic relationship?
Section
1.3
A quadratic relationship exists when one variable depends on the square of another.
A quadratic relationship can be represented by the following equation:

Graphing Data
The graph in the figure shows how the current in an electric circuit varies as the resistance is increased. This is an example of an inverse relationship.
28.) What is an inverse relationship?
Section
1.3
An inverse relationship can be represented by the following equation:
In an inverse relationship, a hyperbola results when one variable depends on the inverse of the other.

Graphing Data
There are various mathematical models available apart from the three relationships you have learned. Examples include: sinusoids—used to model cyclical phenomena; exponential growth and decay—used to study radioactivity
Combinations of different mathematical models represent even more complex phenomena.
Nonlinear Relationships
Section
1.3

Graphing Data
Relations, either learned as formulas or developed from graphs, can be used to predict values you have not measured directly.
Physicists use models to accurately predict how systems will behave: what circumstances might lead to a solar flare, how changes to a circuit will change the performance of a device, or how electromagnetic fields will affect a medical instrument.
Predicting Values
Section
1.3

Which type of relationship is shown following graph?
Question 1
Section
1.3 Section Check
A. Linear
B. Inverse
C. Parabolic
D. Quadratic
Section Check
Answer: B
Answer 1
Section
1.3
Reason: In an inverse relationship a hyperbola results when one variable depends on the inverse of the other.

Section Check
What is line of best fit?
Question 2
Section
1.3
A. The line joining the first and last data points in a graph.
B. The line joining the two center-most data points in a graph.
C. The line drawn close to all data points as possible.
D. The line joining the maximum data points in a graph.
Section Check
Answer: C
Answer 2
Section
1.3
Reason: The line drawn closer to all data points as possible, is called a line of best fit. The line of best fit is a better model for predictions than any one or two points that help to determine the line.

Section Check
Which relationship can be written as y = mx?
Question 3
Section
1.3
A. Linear relationship
B. Quadratic relationship
C. Parabolic relationship
D. Inverse relationship

Section Check
Answer: A
Answer 3
Section
1.3
Reason: Linear relationship is written as y = mx + b, where b is the y intercept. If y-intercept is zero, the above equation can be rewritten as y = mx.

End of Chapter
Graphing DataSection
1.3

Mathematics and Physics
Electric Current
The potential difference, or voltage, across a circuit equals the current multiplied by the resistance in the circuit. That is, V (volts) = I (amperes) × R (ohms). What is the resistance of a lightbulb that has a 0.75 amperes current when plugged into a 120-volt outlet?
Section
1.1
Click the Back button to return to original slide.