a performance analysis of sba's loan and investment programs
TRANSCRIPT
A PERFORMANCE ANALYSIS OF SBA’S LOAN AND INVESTMENT PROGRAMS
Final Report January 2008
Prepared for:
U.S. Small Business Administration
Prepared by:
The Urban Institute
2100 M Street, NW ● Washington, DC 20037

A Performance Analysis of SBA’s Loan and Investment Programs
Final Report
January 2008
Prepared By:
Rachel Brash Megan Gallagher
The Urban Institute Metropolitan Housing and Communities
Policy Center 2100 M Street, NW
Washington, DC 20037
Submitted To:
U.S. Small Business Administration 409 Third Street, SW
Washington, DC 20416
Contract No. GS23F8198H UI No. 07112-020-00
The Urban Institute is a nonprofit, nonpartisan policy research and educational organization that examines the social, economic, and governance problems facing the nation. The views expressed are those of the authors and should not be attributed to the Urban Institute, its trustees, or its funders.
A Performance Analysis of SBA’s Loan and Investment Programs
CONTENTS
INTRODUCTION ..........................................................................................................................1
BACKGROUND............................................................................................................................2
Research Questions................................................................................................................ 2
Program Overviews................................................................................................................. 7
Section 7(a) Loan Guarantee Program................................................................................ 8
Certified Development Company (504) Loan Program........................................................ 8
Debenture Small Business Investment Company (SBIC) Program..................................... 9
METHODOLOGY .........................................................................................................................9
Samples from SBA Portfolios ................................................................................................ 10
Dun & Bradstreet (D&B) Data ............................................................................................... 10
D&B Data Match Rates ......................................................................................................... 11
Measures............................................................................................................................... 12
Firm Performance.............................................................................................................. 12
Other Firm Characteristics................................................................................................. 14
Financing Characteristics .................................................................................................. 15
Market Characteristics ....................................................................................................... 15
Descriptive Analyses ............................................................................................................. 16
Multivariate Analyses ............................................................................................................ 16
FINDINGS...................................................................................................................................17
What Happens to Sales, Employment, and Survival before and after Firms Receive Financing from the SBA? ...................................................................................................... 17
Average Sales ................................................................................................................... 17
Percent Change in Sales................................................................................................... 20
A Performance Analysis of SBA’s Loan and Investment Programs
Average Employment ........................................................................................................ 21
Percent Change in Employment ........................................................................................ 23
Survival .............................................................................................................................. 24
What Explains the Changes Observed after Firms Receive Financing from the SBA? ............................................................................................................................... 26
7(a) Program: Factors that Explain Percent Change in Sales and Employment ............... 28
504 Program: Factors that Explain Percent Change in Sales and Employment ............... 30
SBIC: Factors that Explain Percent Change in Sales and Employment............................ 32
CONCLUSIONS AND POLICY IMPLICATIONS .......................................................................34
REFERENCES ...........................................................................................................................36
APPENDIX TABLES ..................................................................................................................38

A Performance Analysis of SBA’s Loan and Investment Programs
1
INTRODUCTION
The question this analysis set out to answer was Does assistance from the U.S. Small Business Administration (SBA) help the firms that receive it? Answering this question definitively would require an impact analysis that is beyond the scope of this project. However, it is possible to assess whether SBA loans are associated with firm performance, and what role other factors play. Using administrative data collected by the SBA, as well as data collected privately by Dun & Bradstreet (D&B), this is a rigorous, quantitative analysis of the performance over time of businesses that received assistance through the SBA’s Section 7(a) Loan Guarantee Program, Certified Development Company (504) Loan Program, or Small Business Investment Company (SBIC) Program between 1999 and 2001. The study adds to a body of research that examines the firm characteristics that influence business outcomes such as sales and employment growth. In addressing the question of whether SBA assistance helps the firms that receive it, this study asked two related questions and employed different analytical tools to answer each:
1. What happens to sales, employment, and survival before and after firms receive financing from the SBA?
2. What explains the changes observed in sales or employment after firms receive financing from the SBA?
Three commonly used business outcomes—annual sales, number of employees, and survival—were used to determine the characteristics associated with firm performance. Descriptive analyses of average sales and employment levels were employed to answer the first question. The descriptive analyses allow one to track changes in the overall average of annual sales or business size over time, but do not control for other factors that might be contributing to these changing levels. Multivariate analyses, the second analytic approach used in this study, permit one to disentangle the influence that different factors, such as firm or market characteristics, have on a firm’s size or bottom line.
The findings were similar for the 7(a), 504, and SBIC programs for both the descriptive and multivariate analyses. The descriptive analyses found that average sales, measured in 2005 dollars, increased over time for firms in all three programs, as did average employment. The multivariate analysis found that firm age, industry, and region of the country were significantly related to percent change in sales and employment for all three programs. For the 7(a) program, for both percent change in sales and percent change in employment, younger firms experienced greater growth than older firms, and firms in the mining industry experienced greater growth than firms in the manufacturing industry. Pre-financing sales growth, minority ownership, being in the wholesale industry (relative to being in the manufacturing industry), and
A Performance Analysis of SBA’s Loan and Investment Programs
2
region of the country were also significant factors for 7(a) firms, although not for both sales and employment growth. For firms in the 504 program, younger firms demonstrated more growth than older firms for both percent change in sales and percent change in employment. Additionally, being located in the West (relative to being in the Midwest or Outlying Areas), being engaged in the “other services”1 industry (relative to being in the manufacturing industry), and financing amount were found to be significant factors, although not for both percent change in sales and employment. For the SBIC program, younger firms demonstrated greater growth than older firms for both sales and employment outcomes, and firms in the wholesale industry saw greater growth (compared to those in manufacturing). Commercial credit score had a significant, but very small association with percent change in sales.
Owner and financing characteristics were not significant explanatory factors. Specifically, female ownership, veteran ownership, credit score (with the exception of the small relationship for SBIC investment recipients), financing interest rate, and regional unemployment rate were not significantly related to percent change in sales or employment.
This report is organized as follows: a background section discusses the research relevant to this study and presents overviews of the three SBA programs under study. Next follows a methods section in which the statistical methods and data preparation are discussed. The findings of both the descriptive and multivariate analyses are then presented, followed by a section on the conclusions and policy implications that can be drawn from the analyses.
BACKGROUND
Research Questions
The research question this analysis set out to answer was Does SBA assistance help the firms that receive it? A survey of assisted businesses was conducted as part of this evaluation (see Hayes 2008), and although the perceptions of small businesses about the benefits of SBA programs are important, they do not provide the most rigorous evidence about program performance. Therefore, this rigorous, quantitative analysis seeks to assess the performance of assisted businesses over time. This study adds to a body of research that examines the firm characteristics that influence business outcomes such as sales and employment growth. In
1 The “other services” sector consists of firms engaged in equipment and machinery repair, promoting or
administering religious activities, grant-making, advocacy, dry cleaning and laundry services, personal care services, death care services, pet care services, photo-finishing services, temporary parking services, and dating services. Private households that employ workers in their homes to aid with the operation of the household are also included in this sector (U.S. Census Bureau 2007).

A Performance Analysis of SBA’s Loan and Investment Programs
3
addition, the study adds to the body of work analyzing the influence of government-funded programs including SBA’s Section 7(a) Loan Guarantee Program, Certified Development Company (504) Loan Program, or Small Business Investment Company (SBIC) Program on these outcomes.
In addressing the question of whether SBA assistance helps the firms that receive it, the study asks two related questions and employs different analytical tools to answer each:
1. What happens to sales, employment, and survival before and after firms receive financing from the SBA?
2. What explains the changes observed in sales or employment after firms receive financing from the SBA?
Three commonly used business outcomes—annual sales, number or employees, and survival—were used to determine the characteristics associated with firm performance. Descriptive analyses in which the average sales and employment levels are examined were employed to answer the first question. The descriptive analyses allow one to track changes in the overall average of annual sales or business size over time, but do not control for other factors that might be contributing to these changing levels. Multivariate analyses, the other approach used in this study, permit one to disentangle the influence that different factors, such as firm or market characteristics, have on a firm’s size or bottom line. These methods are described in greater detail in the Methodology section.
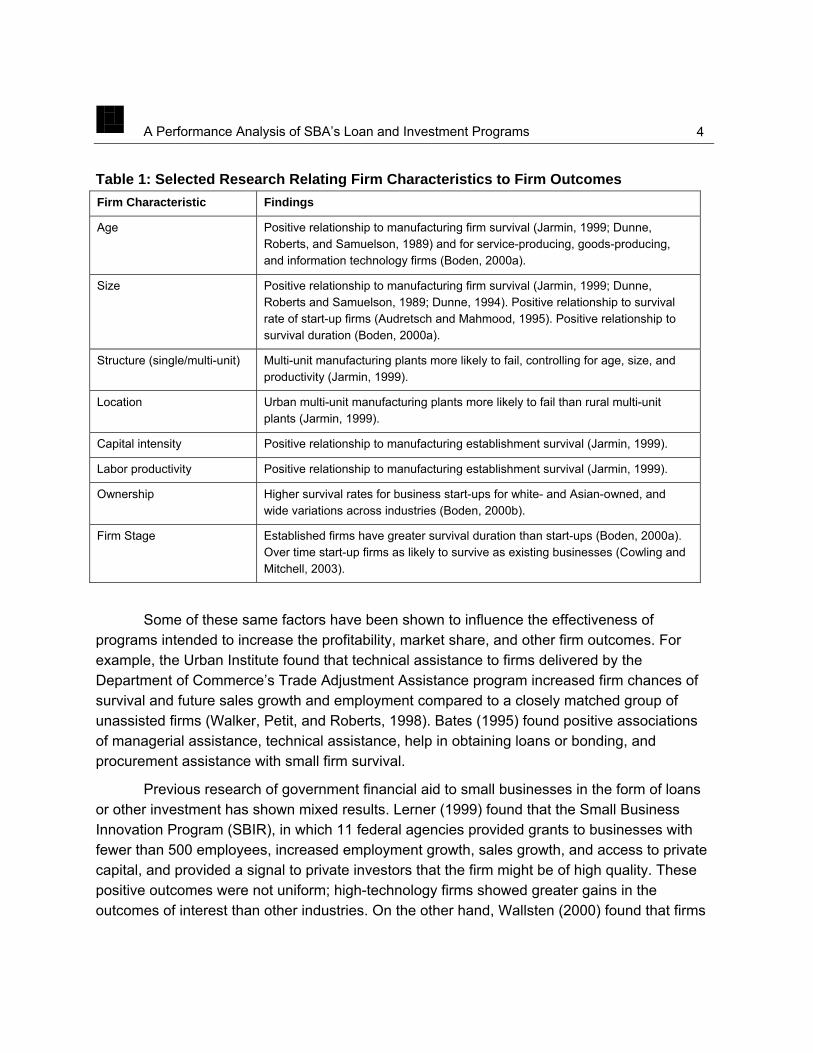
Previous research has shown that firm outcomes are linked to characteristics of firms themselves, the markets in which they operate, and to some extent, the programs of technical and financial assistance aimed at firms with special information or capital need. Within particular industries, characteristics such as firm age, employment size, sales size, location, structure (i.e., single establishment or part of multi-establishment firm), and other characteristics have been linked to firm survival rates and sales and employment growth. Further, evidence from studies of business dynamics, as well as evaluations of assistance program effectiveness seem to show that firm stage, which refers to the start-up, early growth, stabilization, and ultimate exit of the firm (through dissolution, change of corporate form, or acquisition), appears to have a considerable influence on the kinds of resources most needed to ensure survival and growth (see Table 1).
A Performance Analysis of SBA’s Loan and Investment Programs
4
Table 1: Selected Research Relating Firm Characteristics to Firm Outcomes Firm Characteristic Findings
Age Positive relationship to manufacturing firm survival (Jarmin, 1999; Dunne, Roberts, and Samuelson, 1989) and for service-producing, goods-producing, and information technology firms (Boden, 2000a).
Size Positive relationship to manufacturing firm survival (Jarmin, 1999; Dunne, Roberts and Samuelson, 1989; Dunne, 1994). Positive relationship to survival rate of start-up firms (Audretsch and Mahmood, 1995). Positive relationship to survival duration (Boden, 2000a).
Structure (single/multi-unit) Multi-unit manufacturing plants more likely to fail, controlling for age, size, and productivity (Jarmin, 1999).
Location Urban multi-unit manufacturing plants more likely to fail than rural multi-unit plants (Jarmin, 1999).
Capital intensity Positive relationship to manufacturing establishment survival (Jarmin, 1999).
Labor productivity Positive relationship to manufacturing establishment survival (Jarmin, 1999).
Ownership Higher survival rates for business start-ups for white- and Asian-owned, and wide variations across industries (Boden, 2000b).
Firm Stage Established firms have greater survival duration than start-ups (Boden, 2000a). Over time start-up firms as likely to survive as existing businesses (Cowling and Mitchell, 2003).
Some of these same factors have been shown to influence the effectiveness of programs intended to increase the profitability, market share, and other firm outcomes. For example, the Urban Institute found that technical assistance to firms delivered by the Department of Commerce’s Trade Adjustment Assistance program increased firm chances of survival and future sales growth and employment compared to a closely matched group of unassisted firms (Walker, Petit, and Roberts, 1998). Bates (1995) found positive associations of managerial assistance, technical assistance, help in obtaining loans or bonding, and procurement assistance with small firm survival.
Previous research of government financial aid to small businesses in the form of loans or other investment has shown mixed results. Lerner (1999) found that the Small Business Innovation Program (SBIR), in which 11 federal agencies provided grants to businesses with fewer than 500 employees, increased employment growth, sales growth, and access to private capital, and provided a signal to private investors that the firm might be of high quality. These positive outcomes were not uniform; high-technology firms showed greater gains in the outcomes of interest than other industries. On the other hand, Wallsten (2000) found that firms

A Performance Analysis of SBA’s Loan and Investment Programs
5
with more employees receive SBIR awards, but the SBIR program did not result in increased employment.
Past research on SBA programs has provided evidence of positive associations with firm performance. Using a telephone survey, Warden Associates and Price Waterhouse (1998) concluded that firms receiving assistance through the SBA’s 7(a) program had four-year survival rates exceeding those of a comparison group of small businesses, a rate correlated with the pace of job creation in the years immediately after receipt of assistance. The results also seemed to indicate that firms did better than a comparison group of businesses on other outcome measures, such as growth in net income, revenues, employment, payroll, average annual pay, net assets, and growth in debts and liabilities. Similarly, an earlier Price Waterhouse study (1992), relying on the same basic methodology, found that 7(a) borrowers experienced lower failure rates and higher average revenue and employment rates than a carefully selected group of comparison companies. While some of these studies are experimental or quasi-experimental, they nonetheless demonstrate the potential for statistically significant associations of loan characteristics with firm performance outcomes. This analysis, however, is not intended to measure the impact of SBA programs on firms, but rather to look at the association of performance with a broader array of characteristics.
This study went beyond previous studies in three respects: the use of better-quality data on firm outcomes, larger sample sizes, and more powerful statistical analysis.
• First, data from D&B on characteristics of assisted businesses were used. These data were superior in quality to the information obtainable through the telephone surveys. Additionally, these data can be routinely refreshed by the agency in future years to update performance goals and track actual outcomes against these goals.
• Second, larger sample sizes allowed for more precise estimates of performance, relying on thousands of businesses, rather than the hundreds surveyed by phone in past research.
• Third, larger sample sizes and higher-quality data allowed the use of relatively sophisticated multivariate analyses, rather than single-variable comparisons, that take account of the levels and trends of outcome indicators before and after SBA assistance.
In order to set performance targets for businesses assisted under SBA programs, SBA needs empirical estimates of how assisted businesses have performed, controlling for key exogenous characteristics likely to be associated with firm performance. These estimates could be used to forecast the performance of more recently assisted businesses. When modeling outcomes for goal-setting purposes, it is critical to recognize that the current composition of assisted businesses in the analyses will influence the results. Since the composition of these

A Performance Analysis of SBA’s Loan and Investment Programs
6
pools change from year to year, appropriate specification of performance targets should take account of these changes. Otherwise, program managers will risk setting performance targets too high because the current cohort contains a large proportion of companies with comparatively poor prospects, or too low because the current cohort contains companies that are relatively well-endowed. Therefore, analysis should ensure that whatever the composition of future pools is, research results can help determine what the expected outcomes for these pools will be. This analysis seeks to ensure the generalizability of the results by employing multiple cohorts (years 1999, 2000, and 2001) from each of the programs.
Firm outcomes are expected to be related to four different classes of variables. These are:
• Firm characteristics, including: number of employees, annual sales, age, start-up status, credit score, and Competitive Opportunity Gap (COG) characteristics like ownership by women, minorities, or veterans.
• Market characteristics, including: metropolitan area unemployment and change in particular industries and regions.
• Financing characteristics, including: program type, amount of financing received, interest rate, and maturity term.
It should be noted that although this study is more rigorous than some past performance reviews of SBA programs and other similar loan and investment programs, data limitations still exist. As will be discussed in the Methodology section, D&B collects what data it can, but relies on modeling when it cannot obtain full information from businesses. In general, small businesses are seen as “informationally opaque” because they often do not keep the detailed balance sheets and other detailed financial records that larger businesses do. Credit providers have found this opacity hinders their ability to assess credit worthiness and increases the risks associated with providing capital to small businesses (see discussion in Temkin and Theodos, 2008). This opacity—i.e., incomplete record keeping or information reporting—also complicates quantitative studies such as this one by limiting the amount of information available for any given business. Additionally, incomplete information makes it difficult to compare SBA-assisted businesses with firms that have not received SBA assistance, but are similarly situated. Lastly, another general data limitation this and other quantitative performance reviews face is that certain important factors influencing business performance—such as local market conditions, the availability of other government assistance programs, or a firm owner’s business acumen—are very hard to quantify and are therefore not included in this analysis.
A Performance Analysis of SBA’s Loan and Investment Programs
7
Program Overviews
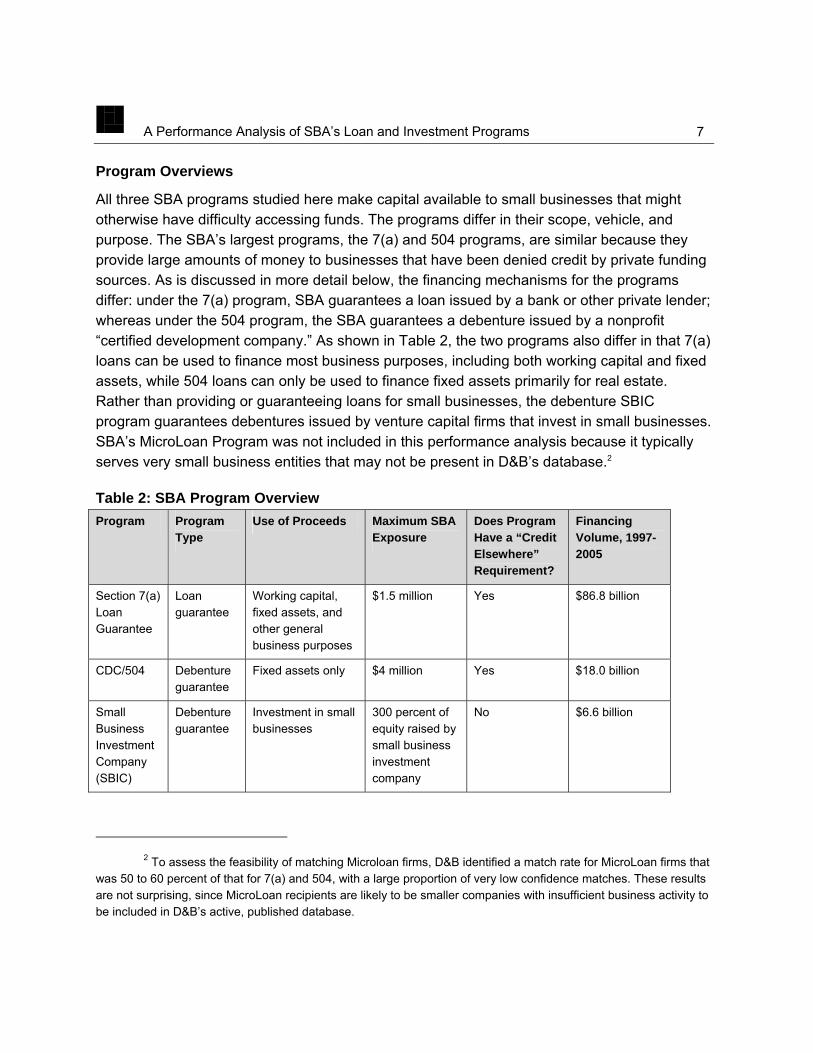
All three SBA programs studied here make capital available to small businesses that might otherwise have difficulty accessing funds. The programs differ in their scope, vehicle, and purpose. The SBA’s largest programs, the 7(a) and 504 programs, are similar because they provide large amounts of money to businesses that have been denied credit by private funding sources. As is discussed in more detail below, the financing mechanisms for the programs differ: under the 7(a) program, SBA guarantees a loan issued by a bank or other private lender; whereas under the 504 program, the SBA guarantees a debenture issued by a nonprofit “certified development company.” As shown in Table 2, the two programs also differ in that 7(a) loans can be used to finance most business purposes, including both working capital and fixed assets, while 504 loans can only be used to finance fixed assets primarily for real estate. Rather than providing or guaranteeing loans for small businesses, the debenture SBIC program guarantees debentures issued by venture capital firms that invest in small businesses. SBA’s MicroLoan Program was not included in this performance analysis because it typically serves very small business entities that may not be present in D&B’s database.2
Table 2: SBA Program Overview Program Program
Type Use of Proceeds Maximum SBA
Exposure Does Program Have a “Credit Elsewhere” Requirement?
Financing Volume, 1997-2005
Section 7(a) Loan Guarantee
Loan guarantee
Working capital, fixed assets, and other general business purposes
$1.5 million Yes $86.8 billion
CDC/504 Debenture guarantee
Fixed assets only $4 million Yes $18.0 billion
Small Business Investment Company (SBIC)
Debenture guarantee
Investment in small businesses
300 percent of equity raised by small business investment company
No $6.6 billion
2 To assess the feasibility of matching Microloan firms, D&B identified a match rate for MicroLoan firms that
was 50 to 60 percent of that for 7(a) and 504, with a large proportion of very low confidence matches. These results are not surprising, since MicroLoan recipients are likely to be smaller companies with insufficient business activity to be included in D&B’s active, published database.

A Performance Analysis of SBA’s Loan and Investment Programs
8
Section 7(a) Loan Guarantee Program
The Section 7(a) Loan Guarantee Program provides loan financing to small businesses deemed unable to obtain financial assistance on reasonable terms in the private credit markets. The Office of Management and Budget (OMB) PART Assessment for the 7(a) program states: “the loans guaranteed by SBA are of a lower quality from what the private sector is willing to make…” (Office of Management and Budget, 2005). Most of the small businesses aided in the 7(a) program are minority-, women-, or veteran-owned, or located either in rural areas or in special zones determined by federal legislation to be in special need of economic development aid. About one-third of businesses are start-ups.
The Section 7(a) program is delivered by private lenders that make, service, and liquidate loans. Under the program, the SBA guarantees up to 85 percent of principal and interest of any loan. Lenders set loan terms and conditions according to the purpose of the loan and form of collateral (e.g., real estate or equipment), loan size, and perceived risk, consistent with maximum rates and terms set by SBA. SBA charges a loan guarantee fee, which is usually paid by the borrower. These loans are intended to supply the kinds of credit that may not be easily available to the class of borrowers the program targets. This credit includes loans of longer maturity to borrowers of higher credit risk, who can offer only single-purpose collateral and have limited equity (Office of Management and Budget, 2005).
The maximum amount that the SBA guarantees under the program is $1.5 million. Interest rates are negotiated between the borrower and the lender, but are subject to SBA maximums, which are pegged to the prime rate. Businesses can use 7(a) loans to finance working capital and fixed assets, and for limited refinancing of existing debt. Refinancing is permitted in limited cases; a borrower cannot use 7(a) loan proceeds to pay a creditor in a position to sustain a certain loss that would be shifted to the SBA. Between 1997 and 2005, the SBA guaranteed $86.8 billion in loans under the 7(a) program.
Certified Development Company (504) Loan Program
Like the 7(a) program, the 504 program provides loan financing to small businesses deemed unable to obtain financial assistance on reasonable terms in the private credit market. It differs from the 7(a) program in three main ways: (1) loans obtained through the program can only be used for fixed assets (i.e., land and buildings); (2) the 504 loans have fixed interest rates (under the 7(a) program, rates are fixed or variable); and (3) 504 loans are larger than 7(a) loans. Under the 504 program, businesses obtain loans through a certified development company (CDC), local nonprofit organizations that work with the SBA, and a private-sector lender. There are about 270 CDCs nationwide. The typical 504 project includes a loan secured with a senior lien from a private-sector lender, covering up to 50 percent of the project cost; a
A Performance Analysis of SBA’s Loan and Investment Programs
9
loan secured with a junior lien from a CDC, covering 40 percent of the project cost (backed by a 100 percent SBA-guaranteed debenture); and a contribution of at least 10 percent equity from the small business.
Maximum amounts allowed under the program vary based on the goal of the loan. Under the 504 program, the maximum debenture for businesses other than small manufacturers is $1.5 million. For small manufacturers, the maximum debenture is set considerably higher, at $4 million. Refinancing is permitted under the 504 program in very limited circumstances. Interest rates are pegged to an increment above the current market rate for five- and ten-year U.S. Treasury issues. Program fees are approximately three percent and can be financed with the loan (U.S. Small Business Administration 2006). From 1997 to 2005, the SBA guaranteed $18.0 billion in loans under the program (SBA administrative data).
Debenture Small Business Investment Company (SBIC) Program
The debenture SBIC program makes capital available to small business investment companies that are privately-owned, for-profit companies licensed by the SBA to provide venture capital to start-up and expanding small businesses. Rather than provide assistance directly to small businesses, under the debenture SBIC program, the SBA allows privately-operated venture capital funds to leverage their capital through SBA-guarantees. Debenture SBICs may issue securities that provide for a maximum of 300 percent leverage of equity raised by the SBIC (U.S. Small Business Administration, 2004). Debentures issued by SBICs pay market interest rates to investors through semiannual interest payments for ten-year terms. Debenture SBICs may prepay their securities at any time; prepayments after five years carry no penalty (U.S. Small Business Administration, 2004). Debenture SBICs are obligated to make all payments to investors, and so companies in which debenture SBICs invest must have sufficient cash flow to allow the SBIC to service its debt by the time the first semi-annual interest payment is due.
Debenture SBICs provide equity capital, long-term loans, near-equity investments, and management assistance to qualifying small businesses, using their own funds and funds borrowed or otherwise obtained at favorable rates with SBA guarantees. In general, assistance provided by debenture SBICs is some form of mezzanine financing: subordinate debt3 that also includes warrants or options that can be exercised by the SBIC to take an equity position in the company. From 1997 to 2005, the SBA provided $6.6 billion in guarantees to debenture SBICs.
METHODOLOGY
3 The debt instrument originated by the debenture SBIC is often subordinate to other debt–which could be
conventional or SBA guaranteed–that the firm already has on its balance sheet.
A Performance Analysis of SBA’s Loan and Investment Programs
10
This study used data from SBA administrative files for firms that received assistance in 1999, 2000, and 2001. Then, for a sample of firms, D&B data were combined with SBA administrative data in order to conduct descriptive and multivariate analyses of firm performance. This section outlines the process used to identify the samples, develop the analytical files, code the key measures, and perform the descriptive and multivariate analyses.
Samples from SBA Portfolios
Throughout the analyses, firms participating in 7(a), 504, and SBIC were examined separately. Samples of firms participating in SBA programs were obtained through stratified sampling based on program (7(a), 504, SBIC), loan year (1999-2001), and race of the business owner (minority status of owner was used for SBIC). Samples were drawn proportionately from each stratum. For each program sample, firms from each of the three cohorts (1999, 2000, and 2001) were combined. Reserve samples were identified for use if the match rates for the main samples were not high enough; this reserve sample was used seamlessly with the main sample because its sampling frame was identical. (See Appendix Table A for characteristics of SBA portfolios and Appendix Table B for characteristics of Performance Analysis samples.)
Dun & Bradstreet (D&B) Data
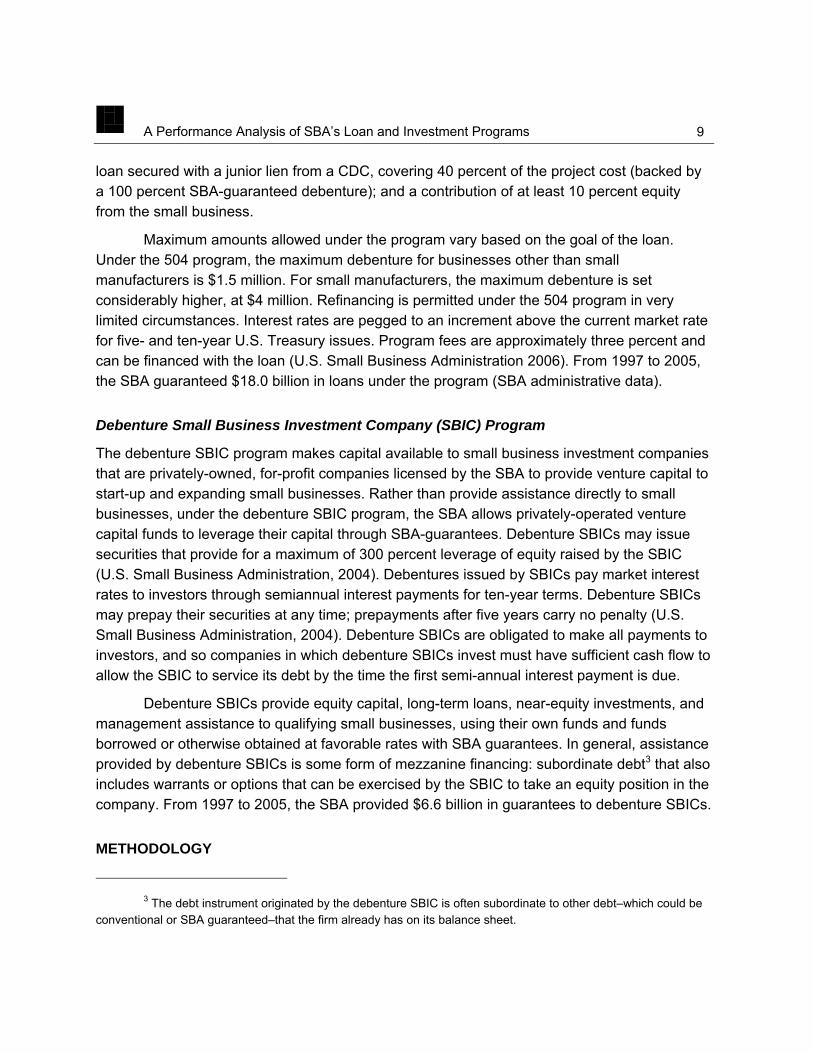
Historical data were requested for each sampled firm. Table 3 below presents the general outline of the D&B data for each loan year cohort. For each cohort, historical data for the three years before financing, and four to six years after financing were licensed.
Table 3: General Outline of D&B Data for Assisted Firms
Analysis Data reference year1996 1997 1998 1999 2000 2001 2002 2003 2004 2005
1999 cohort X X X X X X X X X X2000 cohort X X X X X X X X X2001 cohort X X X X X X X X
D&B data were provided to the Urban Institute in two databases—the Predictive Marketing Database (PMD) and the Strategic Marketing Archive Database (SMAD). Because historical data, as well as more recent data were required, both databases were employed for the analyses. According to D&B, the PMD file was developed in the early 1990’s for modeling purposes and was used through 2003. In 2001, D&B started researching additional firm attributes, and eventually replaced the PMD in 2003 with the SMAD, which has more fields and reportedly is more accurate.

A Performance Analysis of SBA’s Loan and Investment Programs
11
Since most of the data required for the analyses came from the PMD (1996-2002), it was used as the main data source. SMAD fields are made to be consistent with PMD fields and merged on to the PMD. A handful of variables were adjusted to ensure consistency between data years from PMD and data years from SMAD.
D&B Data Match Rates
Two issues were raised in assessing the D&B match success for firms in the Performance Analysis samples. First was whether or not firms were found in the D&B databases. Second was whether D&B provided adequate historical data for the firms to be included in the performance analysis.
D&B used an algorithm to match firms in the Performance Analysis sample with firms in their database. The quality of the match was conveyed through the confidence code. Consistent with the standards employed by SBA’s Office of Lender Oversight for this type of study, this analysis used matches with confidence codes of seven or more. Some firms were not found in the D&B database or had confidence codes lower than seven. Failure to match firms to records in the D&B database was due to one or more of the following factors: (1) incomplete name and address information in the SBA administrative data, (2) firms missing in the D&B database, or (3) D&B’s firm name and address matching process dates back just two years, while the SBA administrative data for this analysis were from 1999 to 2001. Firms matched with a confidence code of sever or higher represent 21 percent of 7(a) and 504 firms in stratified samples sent by UI to D&B, and 39 percent of sampled SBIC firms. Despite the imperfect match rates, the firms found in the D&B database were similar to all firms in the SBA universe on a variety of dimensions—female and veteran ownership, minority status or specific race of owner, start-up status, region, industry, number of employees, and size of SBA investment (see Appendix Table C for characteristics of SBA firms in Urban Institute samples that were matched by D&B). However, match rates for taxi medallions in the SBIC program were very low, and were causing a distinct mismatch between the SBIC firms available for analysis and all SBIC firms in the SBA portfolio. Therefore, taxi medallions were explicitly eliminated from the analysis, and the results from the SBIC performance analysis do not apply to taxi medallions.
Even when a D&B match was found for a firm from the sample, sometimes data were only available for the years preceding or following the initial year of financing. Although the econometric models initially required seven years of historical data for each firm (three years before financing and three years after the initial year of financing), this approach eliminated too many start-up businesses. Thus, the final econometric models required a slightly less demanding longitudinal sample: firms with data one year before financing and three years after
A Performance Analysis of SBA’s Loan and Investment Programs
12
financing. Still, a large proportion lacked historical data necessary for analysis—47 percent of 7(a) matches, 29 percent of 504 matches, and 62 percent of SBIC matches did not have one year of data before financing and three years of data after financing.4 Yet D&B matches with historical data were similar to all firms in the SBA portfolio, with the following exceptions: start-ups were somewhat underrepresented, and SBIC firms were slightly more likely to be in the manufacturing industry and slightly less likely to be in the information industry. (See Appendix Tables D and E for characteristics of SBA firms in Performance Analysis samples that were matched by D&B and had the historical data necessary to be used in multivariate analyses.)
Finally, it is important to note that when D&B data were not available for a firm in a particular year, it was difficult to discern whether that firm continued to exist, had been purchased, or had gone out of business. With one exception, all descriptive and multivariate analyses employed firms with data available the year before financing and three years after financing. In these cases, firms missing data for one or more years in this five-year period were excluded from the analysis. For examining survival rates, firms with missing data in a given year, as well as firms missing all D&B data, were included.
Measures
This section outlines the key measures used in the analysis, including firm performance and other characteristics.
Firm Performance
Measures of firm performance include firm sales, employment, and survival. D&B’s measure of total annual sales volume for the firm was used. All sales numbers were adjusted to 2005 dollars using the Consumer Price Index for All Urban Consumers (CPI-U) so that changes over time reflect real changes in sales, rather than changes due to inflation. To examine changes in sales over time, the percent change in sales from the year of financing to three years after financing was calculated.5
To represent the firm’s performance in terms of employment, D&B’s measure of total number of employees for the organization was used. For firms with multiple sites, this number
4 D&B maintains an inactive longitudinal database. In which missing information subsequently discovered
on firms remains omitted from the historical file. 5 Specifically, the sales variable was calculated as the difference between sales three years after financing
and sales at the time of financing, divided by sales at the time of financing: ((Sales Year 3 – Sales Year 0) / Sales Year 0).
A Performance Analysis of SBA’s Loan and Investment Programs
13
reflected employees at all of the sites. To examine changes in employment over time, the percent change in employment from the year of financing to three years after financing was calculated.6
Since neither D&B, nor SBA, data included an indicator of whether a firm has failed, missing data were used as an indicator that the firm has not survived. Two different samples, both of which are distinct from the samples used for the sales and employment analyses, were employed. The first includes all firms chosen for the Urban Institute sample, including those firms without data from D&B (see Appendix Table B). The second includes only those firms in the Urban Institute stratified sample that have data from D&B (see Appendix Table C). Using the first sample, a conservative estimate was calculated by assuming that firms without D&B matches or firms with missing D&B data failed, while firms with D&B data survived. Using the second sample, a slightly less conservative estimate was calculated by assuming that firms with missing D&B data failed, while firms with D&B data survived.
It is important to note that D&B provided both reported and estimated sales and employment values. In other words, the data from D&B includes some cases where the figure is the actual figure reported by the company and some cases where the figure is estimated because D&B was unable to obtain the actual amount. To produce the estimates, D&B used two models, a segmentation (cluster) analysis and a multiple regression analysis. The explanatory variables, or predictors, in the models included total employees, firm structure (single location, headquarters, or branch), industry code, business age, geographic region, and population. According to D&B, there is a 0.8 correlation between actual sales and estimated sales, although the correlation varies by industry. However, it is a proprietary model so they could only provide limited information. A sensitivity test was performed to determine whether the multivariate relationships differed greatly when using reported values and estimated values. No substantial differences were found, so the analyses use both reported and estimated values. This yields a larger sample size, which provides greater power to detect statistically significant associations.
When sales and employment values were unknown, firms were excluded from the analyses. Likewise, firms with extreme values at the tails were also excluded from the analyses.
6 The employment variable was calculated as the difference between employment three years after
financing and employment at the time of financing, divided by employment at the time of financing: ((Employment Year 3 – Employment Year 0) / Employment Year 0).

A Performance Analysis of SBA’s Loan and Investment Programs
14
Other Firm Characteristics
SBA’s measures of whether the firm is at least 50 percent female-owned or whether the firm is veteran-owned were used. For 504 and 7(a), the race/ethnicity of the owner was available (i.e., White, African-American, Hispanic, Asian, Native American, Multiple Race, or Unknown, Undetermined, or Undefined). For SBIC, the specific race/ethnicity of the owner was not available; however, the data did indicate the owner’s minority status and this is used in its place.
The start-up indicator from SBA was used for 7(a) and 504 even though it produces some inconsistency when compared with the D&B firm tenure measure. Some firms designated as start-ups have D&B data for more than three years prior to assistance. However, because it was not clear which measure (D&B tenure or SBA start-up indicator) was correct, the SBA start-up indicator was used. The new business indicator provided in the SBA administrative data was not used for SBIC, because SBIC staff recommended against it. Instead, they recommended using the date that the firm was established to determine its start-up designation.
Because SBA’s definition of a new business and the calculated age of a business based on date of firm establishment (from D&B) were not always consistent, an alternative firm age and start-up status definition was employed in the multivariate analyses. First, firms were categorized according to start-up status using SBA’s designation. Then, all non-start-ups were placed in one of four mutually-exclusive age groups (less than six years, six to ten years, more than ten years, and missing).
The credit score is used to predict delinquency in paying creditors.7 This analysis employed the credit score from the year of financing when available, but used the score from the year closest to the year of financing, up to three years before the year of financing when necessary.
7 Specifically, the D&B U.S. Commercial Credit Score, which predicts the likelihood that a company will pay
its bills in a severely delinquent manner (+90 days past term), obtain legal relief from creditors, or cease operations without paying all creditors in full during the next 12 months. A severely delinquent firm is defined as a business with at least 25 percent of its payments slow and at least 10% of its payments 90 days or more past due. The Commercial Credit Score uses statistical probabilities to classify companies into three risk classifications: a 101–670 Credit Risk Score; a 1–100 Percentile Ranking, and a 1–5 Risk Class segmentation. These classifications are based on the chance of a business experiencing the above definition of “bad” payment performance during the next 12-month period (D&B Risk Management Solutions, June 2002, 1). These analyses employ the Credit Risk Score classification.

A Performance Analysis of SBA’s Loan and Investment Programs
15
Financing Characteristics
Financing amounts, rates, and terms were provided in SBA’s administrative files. Financing amounts were adjusted to 2005 dollars using the CPI-U. Interest rate at the time of origination and loan term were available for 7(a) and 504 only. However, because the loan term is standard for 504 participants, it was not included in multivariate analyses for 504 firms. Loan guarantees provided under the 7(a) program can have both a fixed-rate portion and a variable-rate portion. For cases where this was so, a weighted rate and weighted term were created based on the fixed-rate and variable-rate loan amounts. Because interest rate and maturity term are not applicable for SBIC investments, they are not included in multivariate analyses for SBIC firms.
Market Characteristics
SBA firms were grouped into Census Regions, including Northeast, Midwest, South, West, and outlying areas (e.g., Puerto Rico). The local area unemployment rate provides information about the financial health of the metropolitan area in which the firm was located. For a small proportion of firms missing adequate address data and firms located outside metropolitan areas, the state unemployment rate was used. The Standard Industry Code (SIC) and North American Industry Classification System (NAICS) code were used to assign each firm to a broad industry category. In the multivariate analyses, the following broad categories are used to represent groups of industries:
• Agriculture and Mining: Agriculture, Forestry, Fishing, Hunting, Mining, Utilities, and Construction
• Manufacturing: Manufacturing
• Wholesale: Wholesale Trade, Retail Trade, and Transportation and Warehousing
• Information: Information, Finance, Insurance, Real Estate, Rental, Leasing Professional, Scientific, Technical, Administrative, Support, Waste Management, and Remediation Services
• Education: Educational Services, Health Care, and Social Assistance
• Arts: Arts, Entertainment, Recreation, Accommodation, and Food Services
• Other Services: Public Administration and Other Services (excluding Educational Services, Health Care, Social Assistance, Arts, Entertainment, Recreation, Accommodation, Food Services)
A Performance Analysis of SBA’s Loan and Investment Programs
16
Descriptive Analyses
Descriptive analyses were employed to examine sample characteristics and overall trends in the outcome measures. These were conducted using cross-tabulations and frequency distributions.
Multivariate Analyses
Multivariate Ordinary Least Squares (OLS) regression was conducted to examine the independent influences of various firm, financing, and market characteristics on sales and employment growth. The dependent variables for the multivariate models were defined as the employment and sales growth from the time of financing to three years after financing. They were interpreted as the percent change in sales or employment between the time of the financing and three years after financing. Explanatory variables included firm characteristics at the time of financing (including COG characteristics), financing characteristics, and market characteristics. Coefficients on the explanatory variables were interpreted as the percentage point difference in sales or employment between firms with a particular characteristic and firms without a particular characteristic, after controlling for other factors. The final specifications for the performance analysis models were:
For firm i
Yi = Xiβ1 + Ziβ2 + Wiβ3 + Ei
where
Y represented the outcome of interest (e.g., percent change in sales between year of financing and three years after financing; percent change in employment between year of financing and three years after financing),
X represented characteristics of the firm (e.g., average sales or employment growth in the year before financing, minority ownership, female ownership, veteran ownership, start-up status, age of firm, credit score, and industry),
Z represented characteristics outside of the firm (including industry, region, and local unemployment rate),
W represented financing characteristics (including financing amount, interest rate, and maturity term), and
E represents the error term.
Because the firm age, region, and industry measures are categorical, dummy variables were created for their inclusion in the model. This approach requires the exclusion of one or more of the categories so that it can be used as a reference for the other categories. The

A Performance Analysis of SBA’s Loan and Investment Programs
17
reference age group is those greater than ten years old, the reference region is the Midwest and Outlying Areas, and the reference industry is manufacturing.
FINDINGS
This section presents the findings from analyses conducted to assess the performance of a sample of firms that received assistance through the 7(a), 504, and SBIC programs between 1999 and 2001. 8 The analyses focus on firm sales, employment, and survival and employ both descriptive and multivariate statistical methods.
What Happens to Sales, Employment, and Survival before and after Firms Receive Financing from the SBA?
The following section presents the findings from descriptive analyses, which are used to describe trends in sales, employment, and survival before and after financing. It uses the samples described in the Methodology section, those firms with complete data one year before financing and three years after financing. These analyses examine the levels of sales and employment over a period three years before financing was received until three years after financing. They also examine the percent change in sales or employment from the year of financing until three years after financing, allowing for an understanding of the proportional increase in sales or employment, rather than the absolute level alone. For all three programs, both sales and employment levels increased over this time period. Percent change in sales and employment appeared to be greatest in the years following financing, and then slowed by year three with a few exceptions. Survival rates were examined from the year of financing until six years after financing, and dropped steadily over that period, but varied by program.
Average Sales
Sales values for all firms were averaged to provide an estimate of mean sales in each of the three years leading up to financing, the year of financing, and each of the three years after financing. Average sales, measured in 2005 dollars, increased over time for firms in all three programs (Figures 1, 2, and 3). For all three programs, the increase in the three years prior to financing was greater than the increase in the three years following financing. The difference in the pre-financing and post-financing years was most pronounced in the 504 program, where the average sales increased more than twice as much in the three years before financing (from
8 Taxi medallions have been excluded from the SBIC analysis because D&B data were not reliable for this
subgroup.
A Performance Analysis of SBA’s Loan and Investment Programs
18
$2.7 million to $3.4 million average) relative to the three years after financing (from $3.4 million to $3.5 million on average). Both the 7(a) and 504 programs saw a slight dip in sales in the year after financing, followed by an upswing in sales.
One should take care in interpreting sales data for the year of financing because these data may represent sales before or after SBA assistance. In addition, it should be noted that the composition of firms shown in the pre-financing years may be slightly different from the composition of firms in the post-financing years. Specifically, because the key analytical samples include firms with at least one year of data before financing and at least three years of data after financing, the outcomes presented two and three years before financing are based on a subset of firms in the key analytical sample.
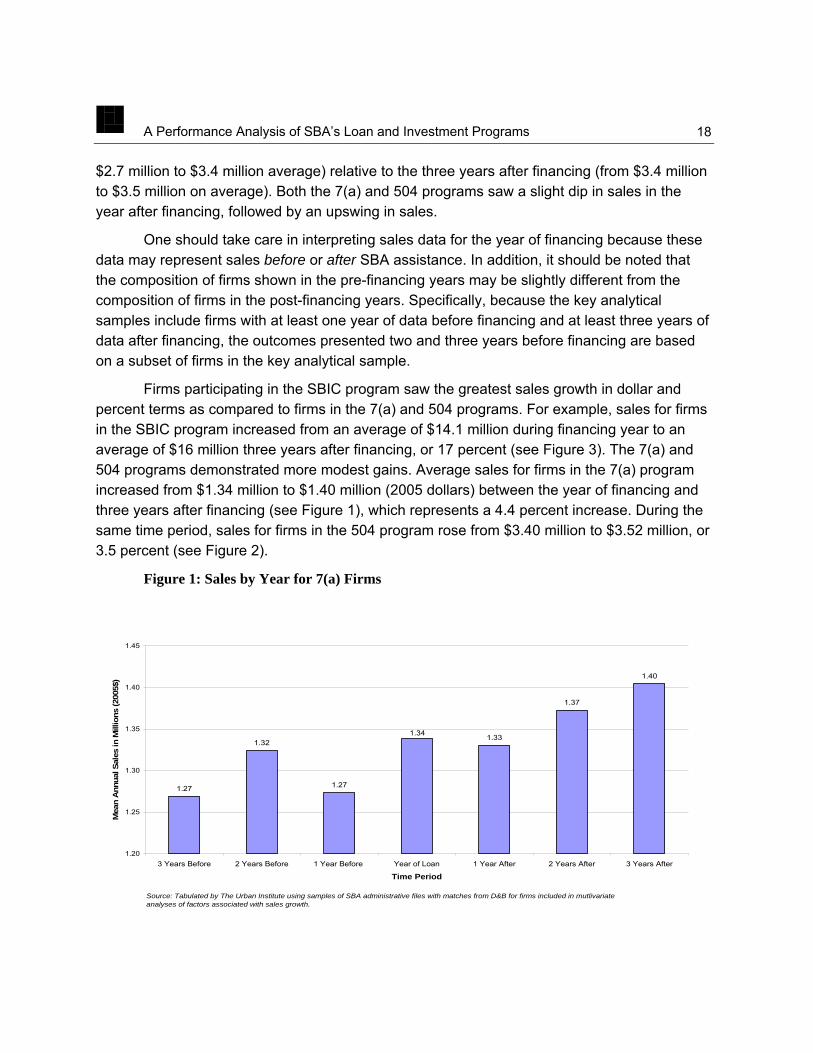
Firms participating in the SBIC program saw the greatest sales growth in dollar and percent terms as compared to firms in the 7(a) and 504 programs. For example, sales for firms in the SBIC program increased from an average of $14.1 million during financing year to an average of $16 million three years after financing, or 17 percent (see Figure 3). The 7(a) and 504 programs demonstrated more modest gains. Average sales for firms in the 7(a) program increased from $1.34 million to $1.40 million (2005 dollars) between the year of financing and three years after financing (see Figure 1), which represents a 4.4 percent increase. During the same time period, sales for firms in the 504 program rose from $3.40 million to $3.52 million, or 3.5 percent (see Figure 2).
Figure 1: Sales by Year for 7(a) Firms
1.27
1.32
1.27
1.33
1.37
1.40
1.34
1.20
1.25
1.30
1.35
1.40
1.45
3 Years Before 2 Years Before 1 Year Before Year of Loan 1 Year After 2 Years After 3 Years After
Time Period
Mea
n A
nnua
l Sal
es in
Mill
ions
(200
5$)
Source: Tabulated by The Urban Institute using samples of SBA administrative files with matches from D&B for firms included in mutlivariate analyses of factors associated with sales growth.

A Performance Analysis of SBA’s Loan and Investment Programs
19
Figure 2: Sales by Year for 504 Firms
2.7
3.1
3.5 3.53.4
2.9
3.3
0.0
0.5
1.0
1.5
2.0
2.5
3.0
3.5
4.0
3 Years Before 2 Years Before 1 Year Before Year of Loan 1 Year After 2 Years After 3 Years After
Time Period
Mea
n A
nnua
l Sal
es in
Mill
ions
(200
5$)
Source: Tabulated by The Urban Institute using samples of SBA administrative files with matches from D&B for firms included in mutlivariate analyses of factors associated with sales growth.
Figure 3: Sales by Year for SBIC Firms, Taxis Excluded
10
1112
14
1616
15
0
2
4
6
8
10
12
14
16
18
3 Years Before 2 Years Before 1 Year Before Year of Loan 1 Year After 2 Years After 3 Years After
Time Period
Mea
n A
nnua
l Sal
es in
Mill
ions
(200
5$)
Source: Tabulated by The Urban Institute using samples of SBA administrative files with matches from D&B for firms included in mutlivariate analyses of factors associated with sales growth.

A Performance Analysis of SBA’s Loan and Investment Programs
20
Percent Change in Sales
Percent change allows one to take into consideration the sales of the individual firm during the year of financing, and measures the proportional increase for that firm during a three-year period. This helps to account for the circumstances of both large and small firms.
The descriptive analysis shows somewhat greater sales growth in years immediately following receipt of financing. For example, the percent change in sales between the year of financing and one year after financing was 18 percent for firms in the 7(a) program; it rose by 18 percentage points to 36 percent by two years after financing, and then it only rose by 6 percentage points to 42 percent by three years after financing (see Figure 4).
SBIC firms had the highest rate of change. For example, while the percent change in sales between the year of financing and one year after financing was 18 percent for firms in the 7(a) program, it was 54 percent for firms in the SBIC program (see Figure 4).
Figure 4: Difference in Sales After Financing for 7(a), 504, and SBIC Firms
1822
54
36 34
74
4244
82
0
10
20
30
40
50
60
70
80
90
7(a) 504 SBIC
Program
Perc
ent C
hang
e
Loan Year to 1 Year AfterLoan Year to 2 Years AfterLoan Year to 3 Years After
Source: Tabulated by The Urban Institute using samples of SBA administrative files with matches from D&B for firms included in mutlivariate analyses of factors associated with sales growth.
A Performance Analysis of SBA’s Loan and Investment Programs
21
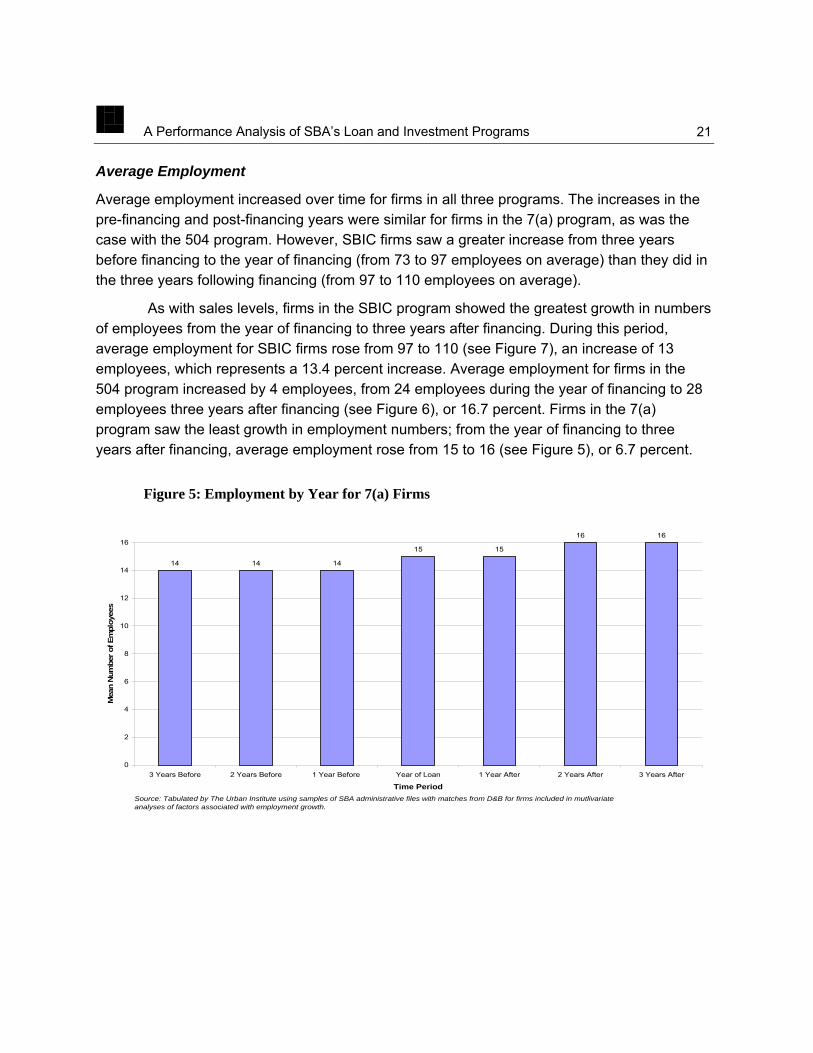
Average Employment
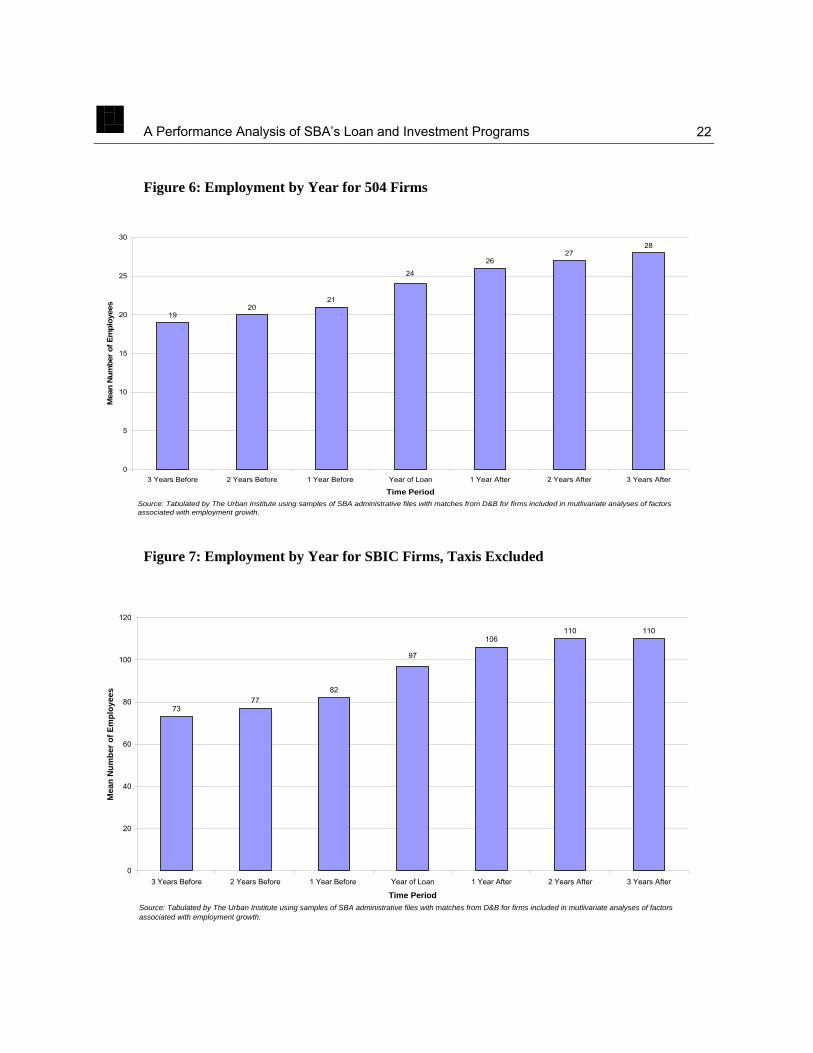
Average employment increased over time for firms in all three programs. The increases in the pre-financing and post-financing years were similar for firms in the 7(a) program, as was the case with the 504 program. However, SBIC firms saw a greater increase from three years before financing to the year of financing (from 73 to 97 employees on average) than they did in the three years following financing (from 97 to 110 employees on average).
As with sales levels, firms in the SBIC program showed the greatest growth in numbers of employees from the year of financing to three years after financing. During this period, average employment for SBIC firms rose from 97 to 110 (see Figure 7), an increase of 13 employees, which represents a 13.4 percent increase. Average employment for firms in the 504 program increased by 4 employees, from 24 employees during the year of financing to 28 employees three years after financing (see Figure 6), or 16.7 percent. Firms in the 7(a) program saw the least growth in employment numbers; from the year of financing to three years after financing, average employment rose from 15 to 16 (see Figure 5), or 6.7 percent.
Figure 5: Employment by Year for 7(a) Firms
14 14 14
15 15
16 16
0
2
4
6
8
10
12
14
16
3 Years Before 2 Years Before 1 Year Before Year of Loan 1 Year After 2 Years After 3 Years After
Time Period
Mea
n N
umbe
r of E
mpl
oyee
s
Source: Tabulated by The Urban Institute using samples of SBA administrative files with matches from D&B for firms included in mutlivariate analyses of factors associated with employment growth.
A Performance Analysis of SBA’s Loan and Investment Programs
22
Figure 6: Employment by Year for 504 Firms
1920
21
2627
28
24
0
5
10
15
20
25
30
3 Years Before 2 Years Before 1 Year Before Year of Loan 1 Year After 2 Years After 3 Years After
Time Period
Mea
n N
umbe
r of E
mpl
oyee
s
Source: Tabulated by The Urban Institute using samples of SBA administrative files with matches from D&B for firms included in mutlivariate analyses of factors associated with employment growth.
Figure 7: Employment by Year for SBIC Firms, Taxis Excluded
7377
82
106110 110
97
0
20
40
60
80
100
120
3 Years Before 2 Years Before 1 Year Before Year of Loan 1 Year After 2 Years After 3 Years After
Time Period
Mea
n N
umbe
r of E
mpl
oyee
s
Source: Tabulated by The Urban Institute using samples of SBA administrative files with matches from D&B for firms included in mutlivariate analyses of factors associated with employment growth.

A Performance Analysis of SBA’s Loan and Investment Programs
23
Again, one should take care in interpreting employment data for the year of financing because this may represent employment both before and after SBA assistance. And, one should note that the composition of firms shown in the pre-financing years may be slightly different from the composition of firms in the post-financing years (i.e., the outcomes presented two and three years before financing are based on a subset of firms in the key analytical sample).
Percent Change in Employment
As with sales, a percent change analysis was employed to measure proportional increases at the firm level, which helps to take into account relative changes for both large and small firms.
Figure 8: Difference in Employment after Financing for 7(a), 504, and SBIC Firms
13
30
25
2931
35
59
17
48
0
10
20
30
40
50
60
70
7(a) 504 SBIC
Program
Perc
ent C
hang
e
Loan Year to 1 Year AfterLoan Year to 2 Years AfterLoan Year to 3 Years After
Source: Tabulated by The Urban Institute using samples of SBA administrative files with matches from D&B for firms included in mutlivariate analyses of factors associated with employment growth.
The analysis found that percent change in employment is greater in the years immediately following receipt of financing. SBIC firms had the highest rate of change, and 7(a) firms had lowest. Firms in the SBIC program experienced a 30 percent increase in employment between the year of financing and one year after financing, but it took another two years for the overall increase in employees to reach 59 percent (see Figure 8). Similarly, firms in the 504

A Performance Analysis of SBA’s Loan and Investment Programs
24
program experienced a 17 percent increase in employment in the first year after financing, but took another two years to double the increase to 34.9 percent from the year of financing. Firms in the 7(a) program saw a lower percentage change in employment than firms in the 504 or SBIC program, but the rate of increase did not taper as it did with those two programs. In the first year, 7(a) firms saw a 13 percent increase in employment, while in the second year that increase almost doubled to 25.0 percent. By the third year, the rate of increase slowed to 5.5 percentage points, for a total increase of 30.5 percent from the year of financing to three years after financing.
Survival
Survival rates up to six years after financing were examined for existing and start-up firms, both together and separately. The survival analysis employed two samples of firms, each of which were more broadly defined than those used to analyze sales or employment. One provides an upper-bound estimate, and the other provides a lower-bound estimate of firm survival. For both estimates, firms were assumed to have survived if D&B had information on those firms in 2005. All firms in the Performance Analysis samples (regardless of whether D&B found a match), were used to calculate the upper-bound estimates, based on the assumption that if D&B did not find a match for the firm or the firm was missing data for a given year, the firm did not survive (see Table 4). This was considered to be an upper-bound because firms may not have had D&B matches for reasons other than going out of business (i.e., being bought or acquired). The lower-bound estimate used firms from the Performance Analysis samples that had D&B matches. The estimate was based on an assumption that if the firm was missing D&B data for a given year, the firm did not survive. This was considered a lower-bound estimate because it included firms that were successfully matched by D&B and may have been slightly more successful than those not matched by D&B. The “real” survival rate for SBA-assisted businesses, therefore, may lie somewhere between the rates that appear below.
A Performance Analysis of SBA’s Loan and Investment Programs
25
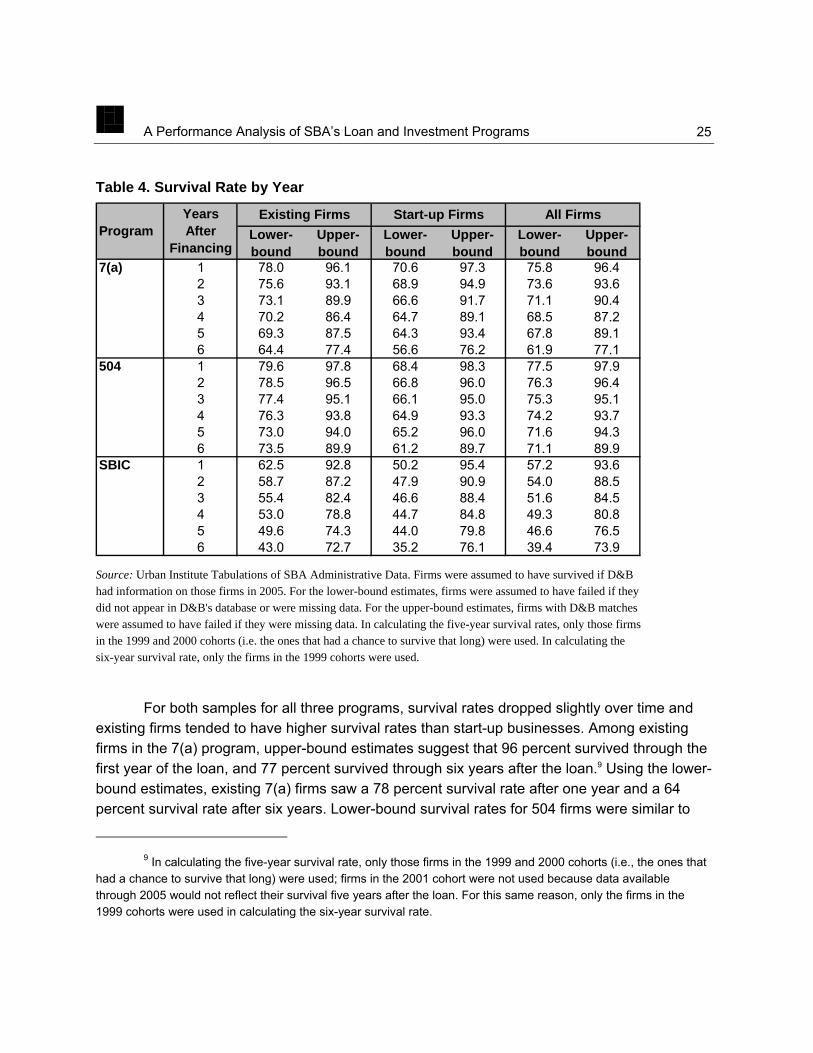
Table 4. Survival Rate by Year
Lower-bound
Upper-bound
Lower-bound
Upper-bound
Lower-bound
Upper-bound
7(a) 1 78.0 96.1 70.6 97.3 75.8 96.42 75.6 93.1 68.9 94.9 73.6 93.63 73.1 89.9 66.6 91.7 71.1 90.44 70.2 86.4 64.7 89.1 68.5 87.25 69.3 87.5 64.3 93.4 67.8 89.16 64.4 77.4 56.6 76.2 61.9 77.1
504 1 79.6 97.8 68.4 98.3 77.5 97.92 78.5 96.5 66.8 96.0 76.3 96.43 77.4 95.1 66.1 95.0 75.3 95.14 76.3 93.8 64.9 93.3 74.2 93.75 73.0 94.0 65.2 96.0 71.6 94.36 73.5 89.9 61.2 89.7 71.1 89.9
SBIC 1 62.5 92.8 50.2 95.4 57.2 93.62 58.7 87.2 47.9 90.9 54.0 88.53 55.4 82.4 46.6 88.4 51.6 84.54 53.0 78.8 44.7 84.8 49.3 80.85 49.6 74.3 44.0 79.8 46.6 76.56 43.0 72.7 35.2 76.1 39.4 73.9
ProgramExisting Firms Start-up Firms All FirmsYears
After Financing
Source: Urban Institute Tabulations of SBA Administrative Data. Firms were assumed to have survived if D&B had information on those firms in 2005. For the lower-bound estimates, firms were assumed to have failed if they did not appear in D&B's database or were missing data. For the upper-bound estimates, firms with D&B matches were assumed to have failed if they were missing data. In calculating the five-year survival rates, only those firms in the 1999 and 2000 cohorts (i.e. the ones that had a chance to survive that long) were used. In calculating the six-year survival rate, only the firms in the 1999 cohorts were used.
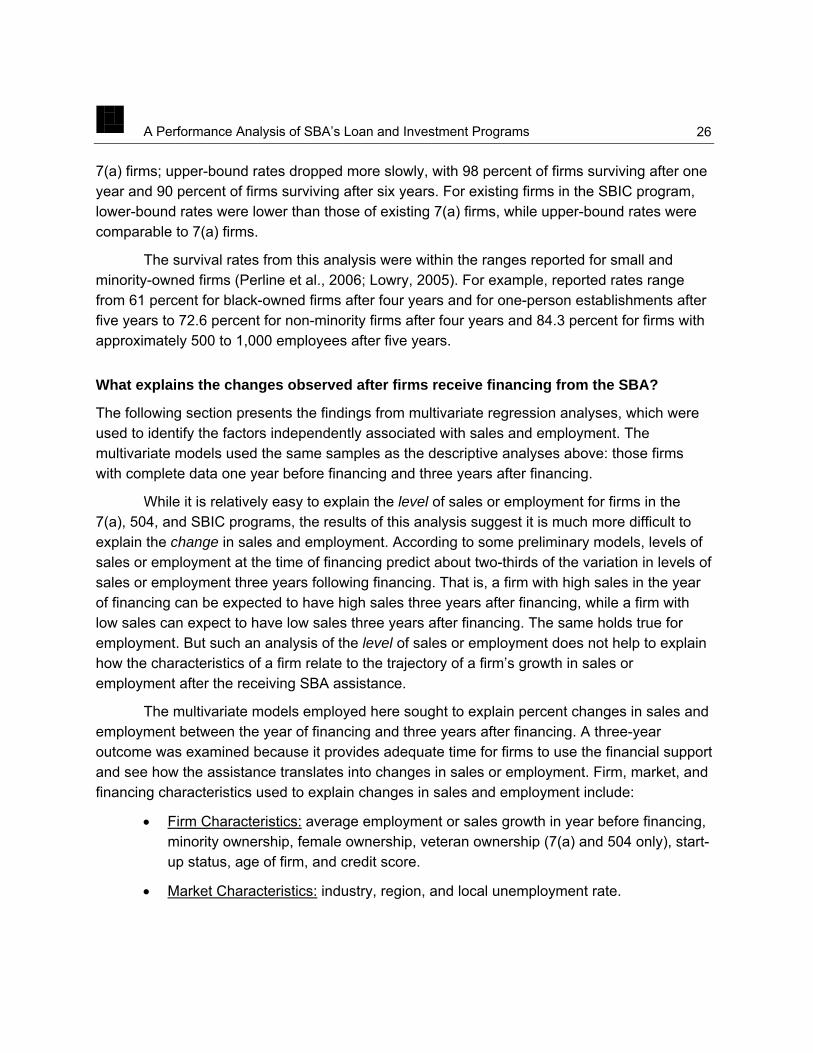
For both samples for all three programs, survival rates dropped slightly over time and existing firms tended to have higher survival rates than start-up businesses. Among existing firms in the 7(a) program, upper-bound estimates suggest that 96 percent survived through the first year of the loan, and 77 percent survived through six years after the loan.9 Using the lower-bound estimates, existing 7(a) firms saw a 78 percent survival rate after one year and a 64 percent survival rate after six years. Lower-bound survival rates for 504 firms were similar to
9 In calculating the five-year survival rate, only those firms in the 1999 and 2000 cohorts (i.e., the ones that
had a chance to survive that long) were used; firms in the 2001 cohort were not used because data available through 2005 would not reflect their survival five years after the loan. For this same reason, only the firms in the 1999 cohorts were used in calculating the six-year survival rate.
A Performance Analysis of SBA’s Loan and Investment Programs
26
7(a) firms; upper-bound rates dropped more slowly, with 98 percent of firms surviving after one year and 90 percent of firms surviving after six years. For existing firms in the SBIC program, lower-bound rates were lower than those of existing 7(a) firms, while upper-bound rates were comparable to 7(a) firms.
The survival rates from this analysis were within the ranges reported for small and minority-owned firms (Perline et al., 2006; Lowry, 2005). For example, reported rates range from 61 percent for black-owned firms after four years and for one-person establishments after five years to 72.6 percent for non-minority firms after four years and 84.3 percent for firms with approximately 500 to 1,000 employees after five years.
What explains the changes observed after firms receive financing from the SBA?
The following section presents the findings from multivariate regression analyses, which were used to identify the factors independently associated with sales and employment. The multivariate models used the same samples as the descriptive analyses above: those firms with complete data one year before financing and three years after financing.
While it is relatively easy to explain the level of sales or employment for firms in the 7(a), 504, and SBIC programs, the results of this analysis suggest it is much more difficult to explain the change in sales and employment. According to some preliminary models, levels of sales or employment at the time of financing predict about two-thirds of the variation in levels of sales or employment three years following financing. That is, a firm with high sales in the year of financing can be expected to have high sales three years after financing, while a firm with low sales can expect to have low sales three years after financing. The same holds true for employment. But such an analysis of the level of sales or employment does not help to explain how the characteristics of a firm relate to the trajectory of a firm’s growth in sales or employment after the receiving SBA assistance.
The multivariate models employed here sought to explain percent changes in sales and employment between the year of financing and three years after financing. A three-year outcome was examined because it provides adequate time for firms to use the financial support and see how the assistance translates into changes in sales or employment. Firm, market, and financing characteristics used to explain changes in sales and employment include:
• Firm Characteristics: average employment or sales growth in year before financing, minority ownership, female ownership, veteran ownership (7(a) and 504 only), start-up status, age of firm, and credit score.
• Market Characteristics: industry, region, and local unemployment rate.
A Performance Analysis of SBA’s Loan and Investment Programs
27
• Financing Characteristics: loan or investment amount, interest rate (7(a) and 504 only), and maturity term (7(a) only).
Together, the variables in the multivariate models predicted from two to ten percent of the variation in percent changes in sales and employment. The section below focuses on statistically significant factors related to percent change in sales and employment. All factors reported were significant at the p<.10 level (see Appendix Table F).
The findings were similar for all three programs. Firm age, industry, and region of the country were found to be significantly related to percent change in sales and employment for all three programs. For all three programs, firms that were less than six years old (but not categorized by SBA as start-ups) outperformed firms that were greater than ten years old in both the sales and employment outcomes.10 Firms located in the West had a significant advantage over firms located in the Midwest or outlying areas in two cases, while firms located in the South had a significant advantage over firms in the Midwest and outlying groups in one case. As discussed below, being in the wholesale industry was found to have both a positive and a negative effect (relative to being in the manufacturing industry) depending on which program and which outcome was examined.
For the 7(a) program, for both percent change in sales and percent change in employment, younger firms experienced greater growth than older firms, and firms in the mining industry experienced greater growth than firms in the manufacturing industry. Pre-loan sales growth, minority ownership, being in the wholesale industry, and region of the country were also significant for 7(a) firms, although not for both sales and employment growth. For firms in the 504 program, younger firms demonstrated more growth than older firms for both percent change in sales and percent change in employment. Additionally, being located in the West (relative to the Midwest or outlying areas), being in the “other services”11 industry (relative to manufacturing), and loan amount were found to be significant, although not for both percent change in sales and employment. For the SBIC program, younger firms demonstrated greater
10 As mentioned in the Methodology section, categorical measures were used in analyzing firm age, region
and industry. This approach requires the exclusion of one or more of the categories so that it can be used a reference for the other categories. The reference age group was firms older than 10 years, the reference region was the Midwest and outlying areas, and the reference industry was manufacturing. The reference categories were excluded not because they represent the ‘best’ or ‘worst,’ but because they comprise a large enough portion of all firms to compare with firms in the remaining categories.
11 For example, firms engaged in equipment and machinery repair, promoting or administering religious activities, grant-making, advocacy, dry cleaning and laundry services, personal care services, death care services, pet care services, photo-finishing services, temporary parking services, and dating services (U.S. Census Bureau, 2007).

A Performance Analysis of SBA’s Loan and Investment Programs
28
growth than older firms for both sales and employment outcomes, and firms in the wholesale industry saw greater growth (relative to those in the manufacturing industry). Credit score had a significant, but very small effect on percent change in sales.
Female ownership, veteran ownership, credit score (with the exception of the small influence on SBIC investment recipients), interest rate, and regional unemployment rate were not significantly related to percent change in sales or employment.
7(a) Program: Factors that Explain Percent Change in Sales and Employment
For the 7(a) program, for both percent change in sales and percent change in employment, younger firms experienced greater growth than older firms, and firms in the mining industry experienced greater growth than firms in the manufacturing industry. Pre-loan sales growth, minority ownership, being in the wholesale industry, and region of the country were also significant for 7(a) firms, although not for both sales and employment growth.
As shown in Figure 9, four characteristics significantly were associated with sales outcomes for 7(a) firms: pre-loan sales growth, minority ownership, firm age, and industry. Firms with higher sales growth during the year before the loan have lower sales growth in the three years after the loan than firms with lower sales growth during the year before the loan.
Figure 9: Difference in Sales Growth for 7(a) Firms Associated with Certain Characteristics, Controlling for Other Factors
-6
26
41
65
-10
0
10
20
30
40
50
60
70
Average sales growth before loan Minority-owned Age: Under 6 (compared to firmsover 10)
Industry: Agriculture and mining(compared to manufacturing)
Characteristics
Perc
enta
ge P
oint
Diff
eren
ce
Source: The Urban Institute. Based on ordinary least squares (OLS) regression with percentage change in sales from year of loan to three years after the loan as the dependent variable. Explanatory variables include: Average sales growth in year before loan; Minority ownership; Female ownership; Veteran ownership; Start-up status; Age of firm; Credit score; Industry; Region; Loan amount, interest rate, and maturity term; and Regional unemployment rate.
A Performance Analysis of SBA’s Loan and Investment Programs
29
Minority-owned firms demonstrated sales growth that was 26 percentage points greater than non-minority-owned firms. Firms that were less than six years old (but not considered to be start-ups by SBA) demonstrated sales growth that was 41 percentage points greater than firms that had been in business for more than ten years. Finally, firms in the agricultural and mining industries had sales growth rates that were 65 percentage points higher than firms in the manufacturing industry.
Factors not associated with sales growth for 7(a) firms include: female ownership, veteran ownership, start-up status, credit score, region, local unemployment rate, loan amount, interest rate, and maturity term.
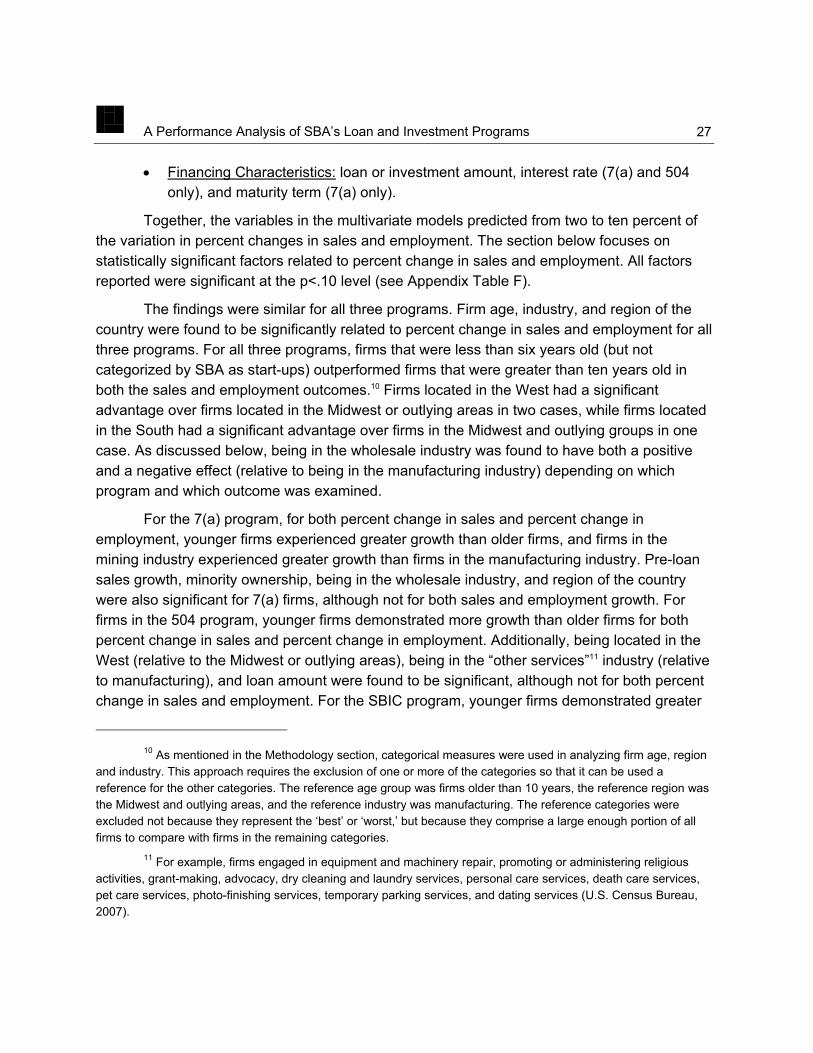
As shown in Figure 10, five characteristics in three categories—firm age, industry, and region—were significantly related to percent change in employment for firms receiving 7(a) loans. Firms that were less than six years old (but not considered to be start-ups by SBA) demonstrated employment growth that was 38 percentage points greater than firms that have been in business for more than ten years. Firms in the agricultural and mining industries had employment growth rates that were 44 percentage points higher than firms in the manufacturing industry. Firms in the wholesale industry had employment growth rates that were 26 percentage points lower than firms in the manufacturing industry. Compared to firms located in the Midwest and outlying areas, employment growth rates for firms in the West were 25 percentage points higher, and firms in the South were 23 percentage points higher.
Figure 10: Difference in Employment Growth for 7(a) Firms Associated with Certain Characteristics, Controlling for Other Factors
38
-26
2325
44
-30
-20
-10
0
10
20
30
40
50
Age: Under 6 (compared tofirms over 10)
Industry: Agriculture and mining(compared to manufacturing)
Industry: Wholesale (comparedto manufacturing)
Region: South (compared to theMidwest and outlying areas)
Region: West (compared to theMidwest and outlying areas)
Characteristics
Perc
enta
ge P
oint
Diff
eren
ce
Source: The Urban Institute. Based on ordinary least squares (OLS) regression with percentage change in employment from year of loan to three years after the loan as the dependent variable. Explanatory variables include: Average employment growth in year before loan; Minority ownership; Female ownership; Veteran ownership; Start-up status; Age of firm; Credit score; Industry; Region; Loan amount, interest rate, and maturity term; and Regional unemployment rate.

A Performance Analysis of SBA’s Loan and Investment Programs
30
Factors not associated with employment growth for 7(a) firms include: employment growth in the year before the loan, minority ownership, female ownership, veteran ownership, start-up status, credit score, local unemployment rate, loan amount, interest rate, and maturity term.
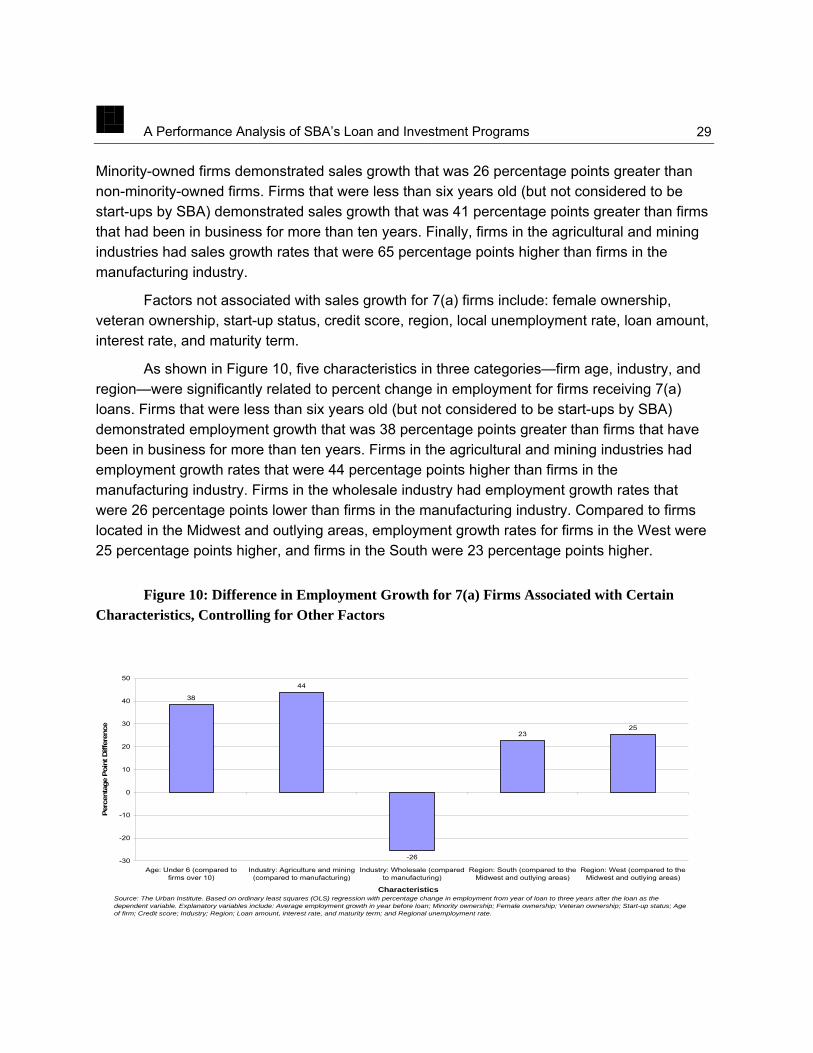
504 Program: Factors that Explain Percent Change in Sales and Employment
For firms in the 504 program, younger firms demonstrated more growth than older firms for both percent change in sales and percent change in employment. Additionally, being located in the West, being engaged in the “other services” industry, and loan amount were found to be significant, although not for both percent change in sales and employment.
As shown in Figure 11, four factors in two categories—firm age and region—were significantly related to percent change in sales for 504 firms. Firms considered start-ups by SBA demonstrated sales growth that was 60 percentage points greater than firms that have been in business for more than ten years. Firms that were less than six years old (but not considered to be start-ups by SBA) demonstrated sales growth that was 45 percentage points higher than firms that have been in business for more than ten years. Firms that were six to ten years old showed sales growth that was 20 percentage points greater than firms older than ten years. As for region, sales growth rates for firms in the West were 23 percentage points higher than firms located in the Midwest and outlying areas.
Figure 11: Difference in Sales Growth for 504 Firms Associated with Certain Characteristics, Controlling for Other Factors
60
45
2023
0
10
20
30
40
50
60
70
Start-up Age: Under 6 (compared to firms over10)
Age: 6 to 10 (compared to firms over 10) Region: West (compared to the Midwestand outlying areas)
Characteristics
Perc
enta
ge P
oint
Diff
eren
ce
Source: The Urban Institute. Based on ordinary least squares (OLS) regression with percentage change in sales from year of loan to three years after the loan as the dependent variable. Explanatory variables include: Average sales growth in year before loan; Minority ownership; Female ownership; Veteran ownership; Start-up status; Age of firm; Credit score; Industry; Region; Loan amount and interest rate; and Regional unemployment rate.
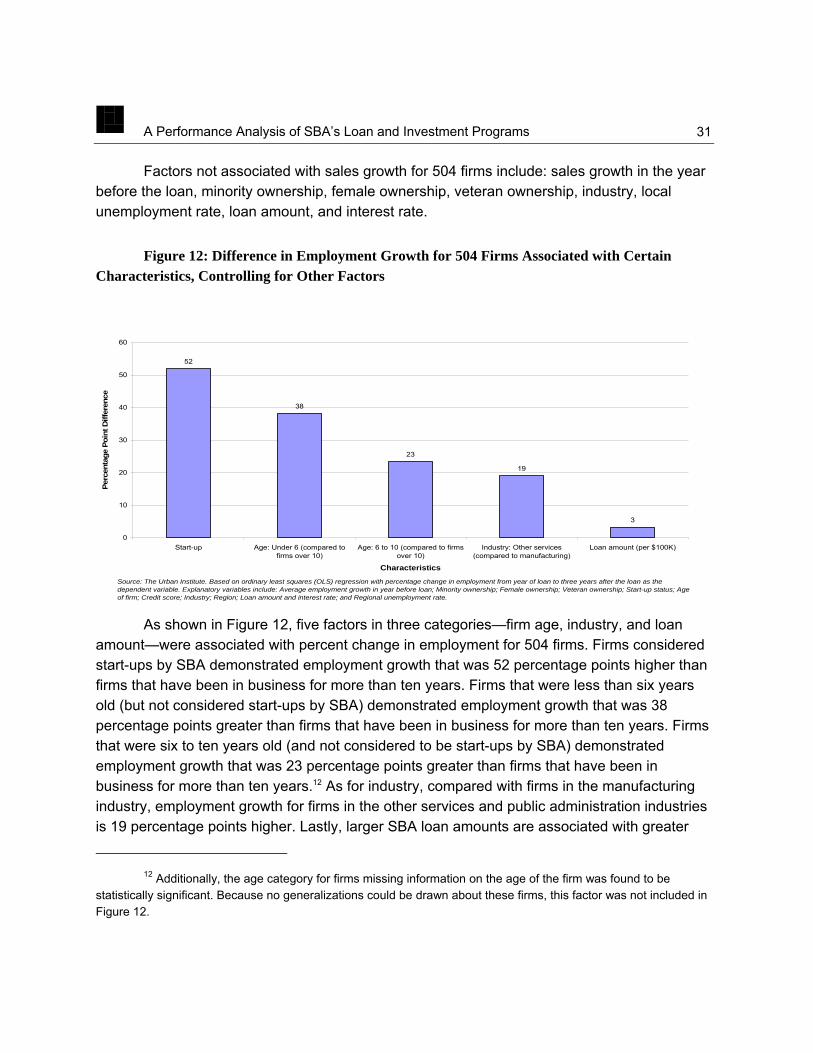
A Performance Analysis of SBA’s Loan and Investment Programs
31
Factors not associated with sales growth for 504 firms include: sales growth in the year before the loan, minority ownership, female ownership, veteran ownership, industry, local unemployment rate, loan amount, and interest rate.
Figure 12: Difference in Employment Growth for 504 Firms Associated with Certain Characteristics, Controlling for Other Factors
52
38
23
19
3
0
10
20
30
40
50
60
Start-up Age: Under 6 (compared tofirms over 10)
Age: 6 to 10 (compared to firmsover 10)
Industry: Other services(compared to manufacturing)
Loan amount (per $100K)
Characteristics
Perc
enta
ge P
oint
Diff
eren
ce
Source: The Urban Institute. Based on ordinary least squares (OLS) regression with percentage change in employment from year of loan to three years after the loan as the dependent variable. Explanatory variables include: Average employment growth in year before loan; Minority ownership; Female ownership; Veteran ownership; Start-up status; Age of firm; Credit score; Industry; Region; Loan amount and interest rate; and Regional unemployment rate.
As shown in Figure 12, five factors in three categories—firm age, industry, and loan amount—were associated with percent change in employment for 504 firms. Firms considered start-ups by SBA demonstrated employment growth that was 52 percentage points higher than firms that have been in business for more than ten years. Firms that were less than six years old (but not considered start-ups by SBA) demonstrated employment growth that was 38 percentage points greater than firms that have been in business for more than ten years. Firms that were six to ten years old (and not considered to be start-ups by SBA) demonstrated employment growth that was 23 percentage points greater than firms that have been in business for more than ten years.12 As for industry, compared with firms in the manufacturing industry, employment growth for firms in the other services and public administration industries is 19 percentage points higher. Lastly, larger SBA loan amounts are associated with greater
12 Additionally, the age category for firms missing information on the age of the firm was found to be
statistically significant. Because no generalizations could be drawn about these firms, this factor was not included in Figure 12.

A Performance Analysis of SBA’s Loan and Investment Programs
32
employment growth; an additional $100,000 is associated with a small (3 percentage point), but significant increase in employees.
Factors not associated with employment growth for 504 firms include: employment growth in the year before the loan, minority ownership, female ownership, veteran ownership, credit score, region, local unemployment rate, and interest rate.
SBIC: Factors that Explain Percent Change in Sales and Employment
For the SBIC program, younger firms demonstrated greater growth than older firms for both sales and employment outcomes, and firms in the wholesale industry saw greater growth (compared to those in manufacturing). Credit score had a significant, but very small relationship to percent change in sale.
Figure 13: Difference in Sales Growth for SBIC Firms Associated with Certain Characteristics, Controlling for Other Factors
120
63
0.240
20
40
60
80
100
120
140
Age: Under 6 (compared to firms over 10) Credit score Industry: Wholesale (compared to manufacturing)
Characteristics
Perc
enta
ge P
oint
Diff
eren
ce
Source: The Urban Institute. Based on ordinary least squares (OLS) regression with percentage change in sales from year of loan to three years after the loan as the dependent variable. Explanatory variables include: Average sales growth in year before loan; Minority ownership; Female ownership; Veteran ownership; Start-up status; Age of firm; Credit score; Industry; Region; Loan amount; and Regional unemployment rate.
As shown in Figure 13, three characteristics were significantly associated with percent increases in sales: firm age, credit score, and industry. Firms that were less than six years old (but not considered to be start-ups by SBA) demonstrated employment growth that was 120
A Performance Analysis of SBA’s Loan and Investment Programs
33
percentage points greater than firms that have been in business for more than ten years.13 Firms with higher credit scores had higher employment growth than firms with lower credit scores: A 10-point increase in the commercial credit score was associated with very small (0.24 percentage point) increase in employment. Firms in the wholesale industry had employment growth rates that were 63 percentage points higher than firms in the manufacturing industry.
Factors not associated with sales growth for SBIC firms include: sales growth in the year before financing, minority ownership, female ownership, veteran ownership, start-up status, region, local unemployment rate, and financing amount.
Figure 14: Difference in Employment Growth for SBIC Firms Associated with Certain Characteristics, Controlling for Other Factors
99
129
0
20
40
60
80
100
120
140
Age: Under 6 (compared to firms over 10) Industry: Education (compared to manufacturing)
Characteristics
Perc
enta
ge P
oint
Diff
eren
ce
Source: The Urban Institute. Based on ordinary least squares (OLS) regression with percentage change in employment from year of loan to three years after the loan as the dependent variable. Explanatory variables include: Average employment growth in year before loan; Minority ownership; Female ownership; Veteran ownership; Start-up status; Age of firm; Credit score; Industry; Region; Loan amount; and Regional unemployment rate.
As shown in Figure 14, two factors were significantly related to percent change in employment for firms receiving SBIC investment: firm age and industry. Firms that were less than six years old (but not considered to be start-ups by SBA) demonstrated employment growth that was 99 percentage points greater than firms that have been in business for more
13 Additionally, the age category for firms missing information on the age of the firm was found to be statistically significant. Because no generalizations could be drawn about these firms, this factor was not included in Figure 13.
A Performance Analysis of SBA’s Loan and Investment Programs
34
than ten years. Firms in the education industry demonstrated employment growth that was 129 percentage points higher than firms in the manufacturing industry.
Factors not associated with employment growth for SBIC firms include: employment growth in the year before financing, minority ownership, female ownership, veteran ownership, start-up status, credit score, region, local unemployment rate, and financing amount.
CONCLUSIONS AND POLICY IMPLICATIONS
The descriptive analyses found that average sales increased over time for firms in 7(a), 504, and SBIC programs, as did average employment. These increases began before the year financing was received and continued each year after financing. The average sales and employment numbers suggest that financing did not give a big boost to firms in terms of level of sales or employment; in most cases, a greater increase was found in the pre-financing years than in the post-financing years. Increases in performance in the pre-financing years may be due in part to the firm’s preparations for the financing application or anticipation of impending financing. It is also conceivable that pre-financing success may have motivated the firms’ interest in seeking financing to leverage and expand the gains that had already been realized. Increases observed in the post-financing years may or may not be associated with financing received; multivariate analyses were used to identify the independent influence of firm, market, and financing characteristics.
The multivariate analyses further suggest that differences in the term, interest rate, and amount of SBA financing are not significantly associated with increasing sales or employment among firms receiving SBA financing. Instead, the analyses found that firm age, industry, and region of the country were significantly related to percent change in sales and employment for all three programs. For all three programs, younger firms demonstrated more employment and sales growth than older firms. When setting performance standards, SBA may want to take into account the advantages (or disadvantages) these characteristics confer on businesses.
Relatively few factors were significantly related to percent change in sales or employment. That certain explanatory variables were found to be statistically insignificant in relation to these two important outcomes—e.g., firm characteristics such as minority, female, or veteran ownership and credit score and market characteristics such as regional unemployment rate—does not mean that these characteristics were not associated with sales or employment growth. However, these characteristics do not seem to influence the outcomes in a systematic manner, which suggests performance standards need not be different for firms that vary across these categories.
A Performance Analysis of SBA’s Loan and Investment Programs
35
Age of firm, industry, and region were responsible for explaining two to ten percent of the variation in firm performance. Unmeasured characteristics must be responsible for much of the remaining variation. For example, local economic conditions that were not captured in the data available—local zoning regulations, local tax rates, or local and state business assistance programs—may influence the success or failure of an SBA-assisted firm. Other business characteristics that are difficult to quantify, such as a business owner’s charisma or business acumen, may play a role in how well a business performs after receipt of SBA financing.
Lastly, it should be noted that if SBA conducts similar research in the future, the agency may want to consider augmenting its administrative data by using sources that can provide updated information or additional elements that may be useful for the agency’s performance monitoring efforts. For example, banks that make SBA guaranteed loans could be required to provide interim outcome data and updated contact information for SBA borrowers. Furthermore, SBA could consider establishing an active and more complete longitudinal database with data from multiple sources, including D&B. An active longitudinal database might reduce the difficulties of limited or missing information encountered in the current analysis.
A Performance Analysis of SBA’s Loan and Investment Programs
36
REFERENCES
Audretsch, David B., and Talat Mahmood. 1995. “New Firm Survival: New Results Using a Hazard Function.” The Review of Economics and Statistics. Vol. 77, No. 1. (Feb. 1995), pp. 97-103.
Bates, Timothy. 1995. Small Businesses Do Appear to Benefit from State/Local Government Economic Development Assistance. Center for Economic Studies, Bureau of the Census.
Boden, Richard. 2000a. Establishment Employment Change and Survival, 1992-1996. Final Report prepared for the Office of Advocacy of the U.S. Small Business Administration.
Boden, Richard. 2000b. Analyses of Business Dissolution by Demographic Category of Business Ownership. Final Report prepared for the Office of Advocacy of the U.S. Small Business Administration.
Cowling, Marc and Peter Mitchell. 2003. “Is the Small Firms Loan Guarantee Scheme Hazardous for Banks or Helpful to Small Business?” Small Business Economics. Vol. 21, pp. 63-71.
D & B Risk Management Solutions. 2002. “Understanding the D & B Commercial Credit Score.”
Dunne, Timothy, Mark J. Roberts, and Larry Samuelson. 1989. “The Growth and Failure of U.S. Manufacturing Plants.” The Quarterly Journal of Economics. Vol. 104, No. 4 (Nov. 1989), pp. 671-698.
Hayes, Chris. 2008. An Assessment of Small Business Administration Loan and Investment Performance: Survey of Assisted Businesses. Washington, DC, Urban Institute. Report.
Jarmin, Ronald. 1999. Government Technical Assistance Programs and Plant Survival: The Role of Plant Ownership Type. CES 99-2, Center for Economic Studies, Bureau of the Census.
Lerner, Josh. 1999. “The Government as Venture Capitalist: The Long-Run Impact of the SBIR Program.” The Journal of Business. Vol. 72, No. 3 (July 1999), pp. 285-318.
Lowrey, Ying. 2005. "Research Summary: Dynamics of Minority-Owned Employer Establishments, 1997-2001." Washington, D.C.: U.S. Small Business Administration, Office of Advocacy.
Office of Management and Budget. 2005. Small Business Administration PART Assessments. Washington, D.C. Executive Office of the President, Office of Management and Budget.

A Performance Analysis of SBA’s Loan and Investment Programs
37
Perline, Rich, Robert Axell, and Daniel Teitelbaum. 2006. "Volatility and Asymmetry of Small Firm Growth Rates Over Increasing Time Frames." Washington, D.C.: U.S. Small Business Administration, Office of Advocacy.
Price Waterhouse. 1992. Evaluation of the 7(a) Guaranteed Business Loan Program, Final Report prepared for the U.S. Small Business Administration.
Temkin, Kenneth and Brett Theodos. 2008. Competitive and Special Competitive Opportunity Gap Analysis of the 7(a) and 504 Programs. Washington, DC, Urban Institute. Report.
U.S. Census Bureau. 2007. “2002 NAICS Definitions. 81. Other Services (Except Public Administration.” Accessed on-line at http://www.census.gov/epcd/naics02/def/ NDEF81.HTM on July 4, 2007.
U.S. Small Business Administration. 2006. “Financing: the Basics.” Accessed on-line at www.sba.gov/financing/index.html on March 23, 2006.
U.S. Small Business Administration. 2004. FY2005 Congressional Budget Request. Accessed on-line at www.wipp.org/Press/20040307_budget.doc.
Walker, Christopher, Kathy Petit, and Brandon Roberts. 1998. Effective Aid to Trade-Impacted Manufacturers: An Evaluation of the Trade Adjustment Assistance Program. Prepared for the Economic Development Administration, U.S. Department of Commerce: Washington, D.C.
Wallsten, Scott J. 2000. “The Effects of Government-Industry R&D Programs on Private R&D: The Case of the Small business Innovation Research Program.” The Rand Journal of Economics. Vol. 1 (Spring 2003), pp. 82-100.
Warden Associates and Price Waterhouse. 1998. Evaluation of the SBA Loan Programs. Prepared for the U.S. Small Business Administration, Borrower and Lender Services.

A Performance Analysis of SBA’s Loan and Investment Programs
38
APPENDIX TABLES
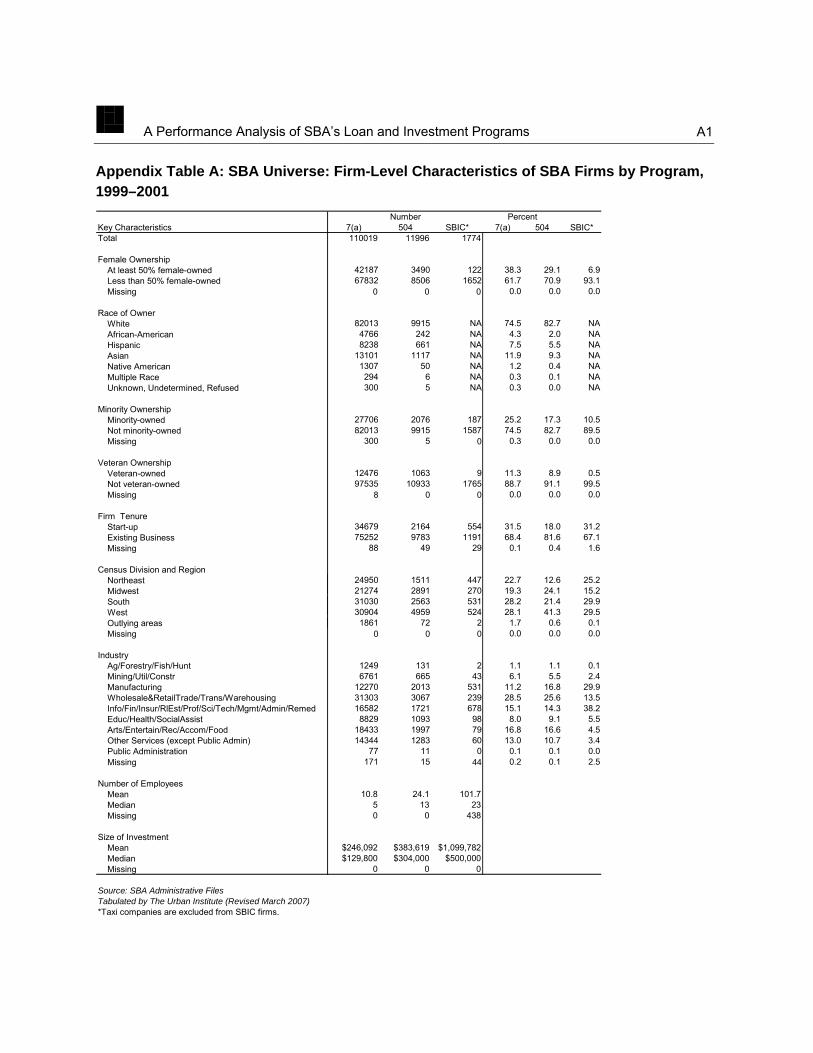
A Performance Analysis of SBA’s Loan and Investment Programs
A1
Appendix Table A: SBA Universe: Firm-Level Characteristics of SBA Firms by Program, 1999–2001
Key Characteristics 7(a) 504 SBIC* 7(a) 504 SBIC*Total 110019 11996 1774
Female OwnershipAt least 50% female-owned 42187 3490 122 38.3 29.1 6.9Less than 50% female-owned 67832 8506 1652 61.7 70.9 93.1Missing 0 0 0 0.0 0.0 0.0
Race of OwnerWhite 82013 9915 NA 74.5 82.7 NAAfrican-American 4766 242 NA 4.3 2.0 NAHispanic 8238 661 NA 7.5 5.5 NAAsian 13101 1117 NA 11.9 9.3 NANative American 1307 50 NA 1.2 0.4 NAMultiple Race 294 6 NA 0.3 0.1 NAUnknown, Undetermined, Refused 300 5 NA 0.3 0.0 NA
Minority OwnershipMinority-owned 27706 2076 187 25.2 17.3 10.5Not minority-owned 82013 9915 1587 74.5 82.7 89.5Missing 300 5 0 0.3 0.0 0.0
Veteran OwnershipVeteran-owned 12476 1063 9 11.3 8.9 0.5Not veteran-owned 97535 10933 1765 88.7 91.1 99.5Missing 8 0 0 0.0 0.0 0.0
Firm TenureStart-up 34679 2164 554 31.5 18.0 31.2Existing Business 75252 9783 1191 68.4 81.6 67.1Missing 88 49 29 0.1 0.4 1.6
Census Division and RegionNortheast 24950 1511 447 22.7 12.6 25.2Midwest 21274 2891 270 19.3 24.1 15.2South 31030 2563 531 28.2 21.4 29.9West 30904 4959 524 28.1 41.3 29.5Outlying areas 1861 72 2 1.7 0.6 0.1Missing 0 0 0 0.0 0.0 0.0
IndustryAg/Forestry/Fish/Hunt 1249 131 2 1.1 1.1 0.1Mining/Util/Constr 6761 665 43 6.1 5.5 2.4Manufacturing 12270 2013 531 11.2 16.8 29.9Wholesale&RetailTrade/Trans/Warehousing 31303 3067 239 28.5 25.6 13.5Info/Fin/Insur/RlEst/Prof/Sci/Tech/Mgmt/Admin/Remed 16582 1721 678 15.1 14.3 38.2Educ/Health/SocialAssist 8829 1093 98 8.0 9.1 5.5Arts/Entertain/Rec/Accom/Food 18433 1997 79 16.8 16.6 4.5Other Services (except Public Admin) 14344 1283 60 13.0 10.7 3.4Public Administration 77 11 0 0.1 0.1 0.0Missing 171 15 44 0.2 0.1 2.5
Number of EmployeesMean 10.8 24.1 101.7Median 5 13 23Missing 0 0 438
Size of InvestmentMean $246,092 $383,619 $1,099,782Median $129,800 $304,000 $500,000Missing 0 0 0
Source: SBA Administrative FilesTabulated by The Urban Institute (Revised March 2007)
Number Percent
*Taxi companies are excluded from SBIC firms.
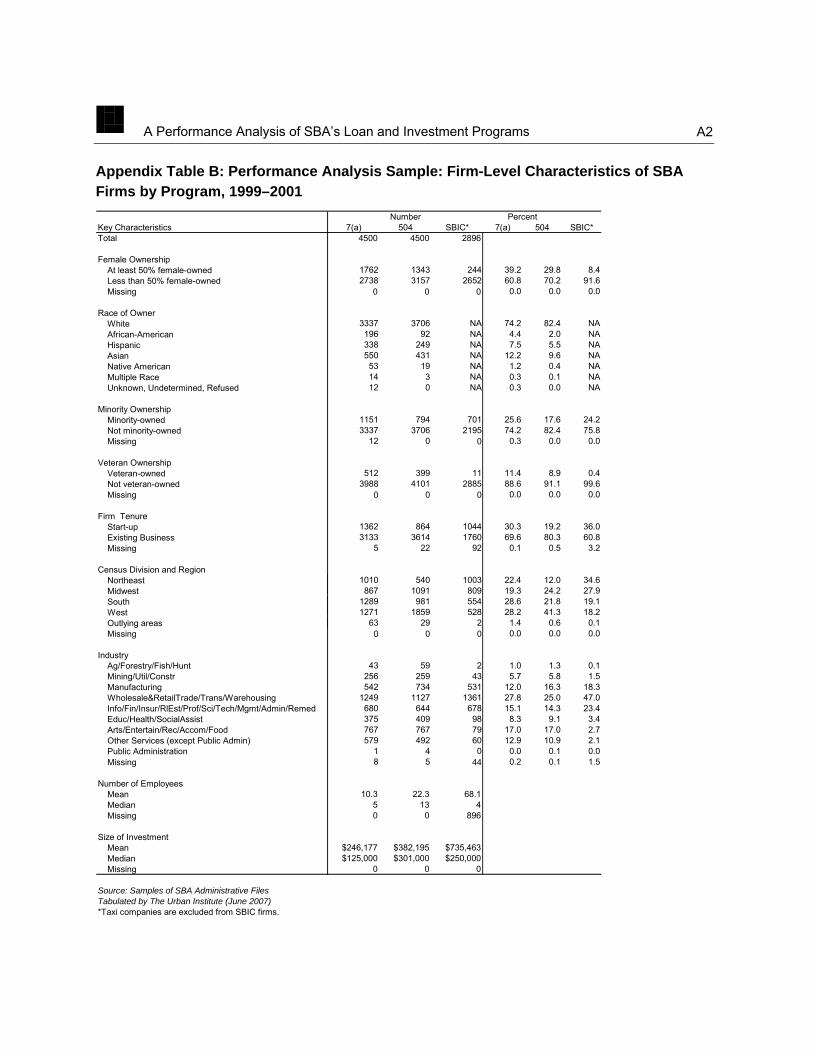
A Performance Analysis of SBA’s Loan and Investment Programs
A2
Appendix Table B: Performance Analysis Sample: Firm-Level Characteristics of SBA Firms by Program, 1999–2001
Key Characteristics 7(a) 504 SBIC* 7(a) 504 SBIC*Total 4500 4500 2896
Female OwnershipAt least 50% female-owned 1762 1343 244 39.2 29.8 8.4Less than 50% female-owned 2738 3157 2652 60.8 70.2 91.6Missing 0 0 0 0.0 0.0 0.0
Race of OwnerWhite 3337 3706 NA 74.2 82.4 NAAfrican-American 196 92 NA 4.4 2.0 NAHispanic 338 249 NA 7.5 5.5 NAAsian 550 431 NA 12.2 9.6 NANative American 53 19 NA 1.2 0.4 NAMultiple Race 14 3 NA 0.3 0.1 NAUnknown, Undetermined, Refused 12 0 NA 0.3 0.0 NA
Minority OwnershipMinority-owned 1151 794 701 25.6 17.6 24.2Not minority-owned 3337 3706 2195 74.2 82.4 75.8Missing 12 0 0 0.3 0.0 0.0
Veteran OwnershipVeteran-owned 512 399 11 11.4 8.9 0.4Not veteran-owned 3988 4101 2885 88.6 91.1 99.6Missing 0 0 0 0.0 0.0 0.0
Firm TenureStart-up 1362 864 1044 30.3 19.2 36.0Existing Business 3133 3614 1760 69.6 80.3 60.8Missing 5 22 92 0.1 0.5 3.2
Census Division and RegionNortheast 1010 540 1003 22.4 12.0 34.6Midwest 867 1091 809 19.3 24.2 27.9South 1289 981 554 28.6 21.8 19.1West 1271 1859 528 28.2 41.3 18.2Outlying areas 63 29 2 1.4 0.6 0.1Missing 0 0 0 0.0 0.0 0.0
IndustryAg/Forestry/Fish/Hunt 43 59 2 1.0 1.3 0.1Mining/Util/Constr 256 259 43 5.7 5.8 1.5Manufacturing 542 734 531 12.0 16.3 18.3Wholesale&RetailTrade/Trans/Warehousing 1249 1127 1361 27.8 25.0 47.0Info/Fin/Insur/RlEst/Prof/Sci/Tech/Mgmt/Admin/Remed 680 644 678 15.1 14.3 23.4Educ/Health/SocialAssist 375 409 98 8.3 9.1 3.4Arts/Entertain/Rec/Accom/Food 767 767 79 17.0 17.0 2.7Other Services (except Public Admin) 579 492 60 12.9 10.9 2.1Public Administration 1 4 0 0.0 0.1 0.0Missing 8 5 44 0.2 0.1 1.5
Number of EmployeesMean 10.3 22.3 68.1Median 5 13 4Missing 0 0 896
Size of InvestmentMean $246,177 $382,195 $735,463Median $125,000 $301,000 $250,000Missing 0 0 0
Source: Samples of SBA Administrative FilesTabulated by The Urban Institute (June 2007)
Number Percent
*Taxi companies are excluded from SBIC firms.
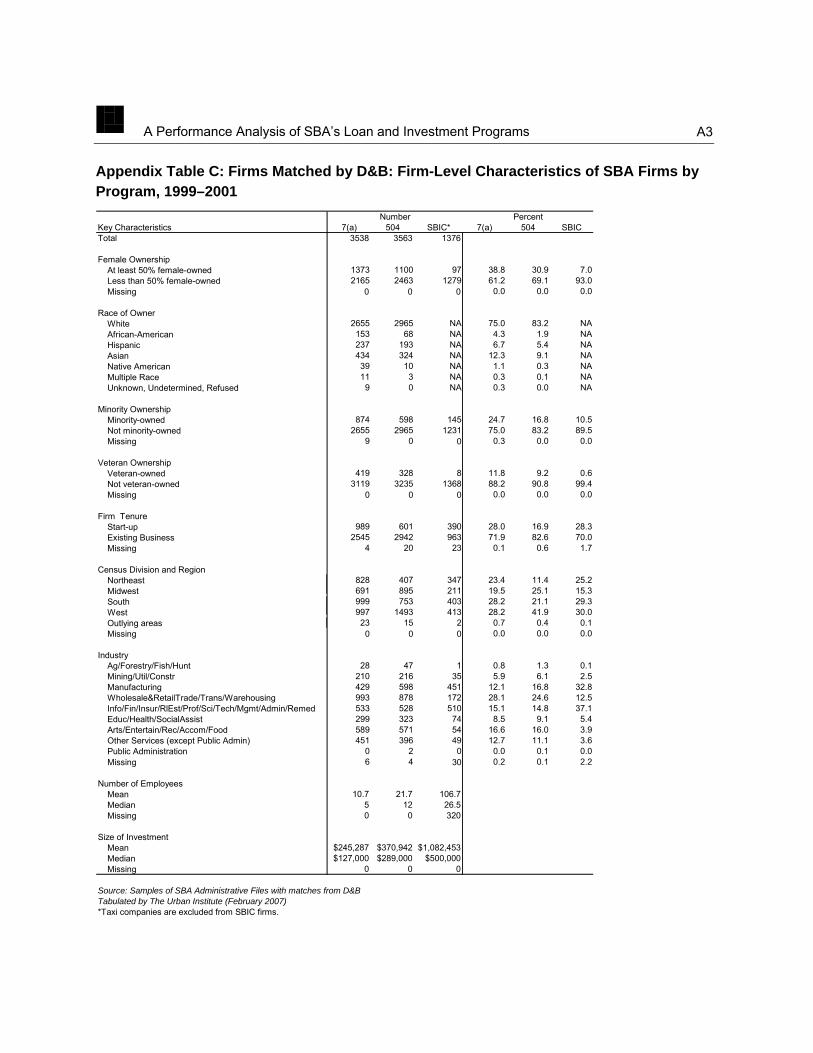
A Performance Analysis of SBA’s Loan and Investment Programs
A3
Appendix Table C: Firms Matched by D&B: Firm-Level Characteristics of SBA Firms by Program, 1999–2001
Key Characteristics 7(a) 504 SBIC* 7(a) 504 SBICTotal 3538 3563 1376
Female OwnershipAt least 50% female-owned 1373 1100 97 38.8 30.9 7.0Less than 50% female-owned 2165 2463 1279 61.2 69.1 93.0Missing 0 0 0 0.0 0.0 0.0
Race of OwnerWhite 2655 2965 NA 75.0 83.2 NAAfrican-American 153 68 NA 4.3 1.9 NAHispanic 237 193 NA 6.7 5.4 NAAsian 434 324 NA 12.3 9.1 NANative American 39 10 NA 1.1 0.3 NAMultiple Race 11 3 NA 0.3 0.1 NAUnknown, Undetermined, Refused 9 0 NA 0.3 0.0 NA
Minority OwnershipMinority-owned 874 598 145 24.7 16.8 10.5Not minority-owned 2655 2965 1231 75.0 83.2 89.5Missing 9 0 0 0.3 0.0 0.0
Veteran OwnershipVeteran-owned 419 328 8 11.8 9.2 0.6Not veteran-owned 3119 3235 1368 88.2 90.8 99.4Missing 0 0 0 0.0 0.0 0.0
Firm TenureStart-up 989 601 390 28.0 16.9 28.3Existing Business 2545 2942 963 71.9 82.6 70.0Missing 4 20 23 0.1 0.6 1.7
Census Division and RegionNortheast 828 407 347 23.4 11.4 25.2Midwest 691 895 211 19.5 25.1 15.3South 999 753 403 28.2 21.1 29.3West 997 1493 413 28.2 41.9 30.0Outlying areas 23 15 2 0.7 0.4 0.1Missing 0 0 0 0.0 0.0 0.0
IndustryAg/Forestry/Fish/Hunt 28 47 1 0.8 1.3 0.1Mining/Util/Constr 210 216 35 5.9 6.1 2.5Manufacturing 429 598 451 12.1 16.8 32.8Wholesale&RetailTrade/Trans/Warehousing 993 878 172 28.1 24.6 12.5Info/Fin/Insur/RlEst/Prof/Sci/Tech/Mgmt/Admin/Remed 533 528 510 15.1 14.8 37.1Educ/Health/SocialAssist 299 323 74 8.5 9.1 5.4Arts/Entertain/Rec/Accom/Food 589 571 54 16.6 16.0 3.9Other Services (except Public Admin) 451 396 49 12.7 11.1 3.6Public Administration 0 2 0 0.0 0.1 0.0Missing 6 4 30 0.2 0.1 2.2
Number of EmployeesMean 10.7 21.7 106.7Median 5 12 26.5Missing 0 0 320
Size of InvestmentMean $245,287 $370,942 $1,082,453Median $127,000 $289,000 $500,000Missing 0 0 0
Source: Samples of SBA Administrative Files with matches from D&BTabulated by The Urban Institute (February 2007)
Number Percent
*Taxi companies are excluded from SBIC firms.
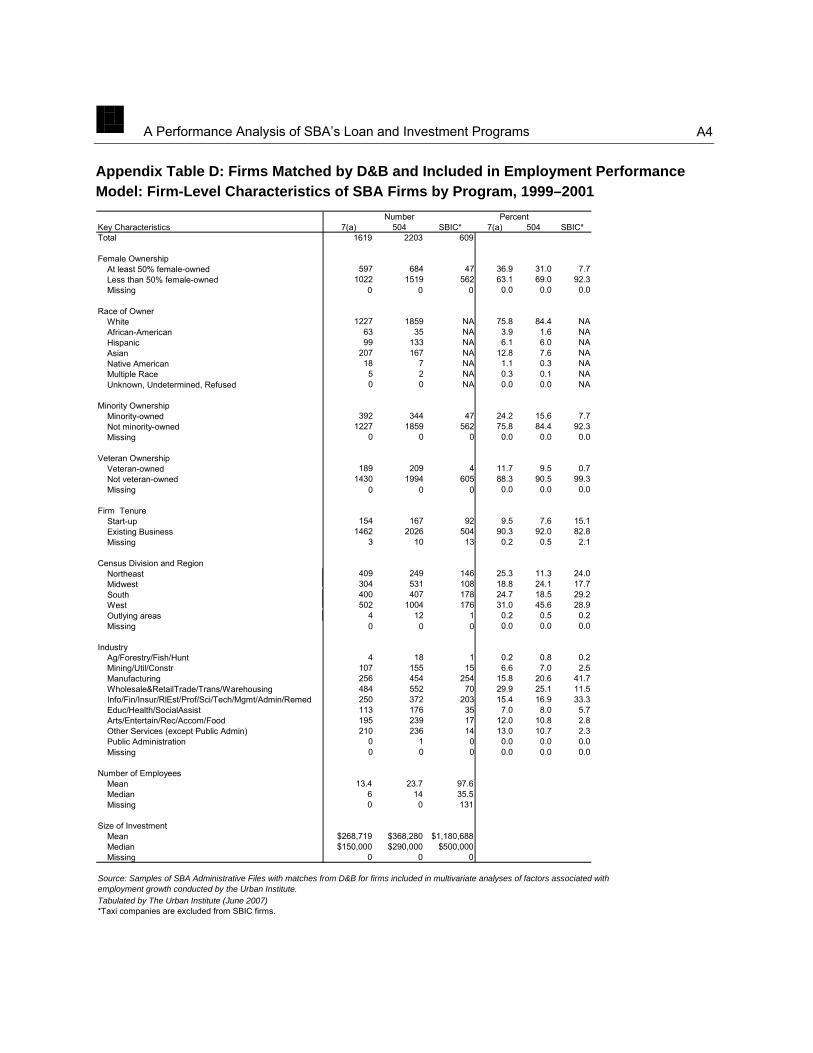
A Performance Analysis of SBA’s Loan and Investment Programs
A4
Appendix Table D: Firms Matched by D&B and Included in Employment Performance Model: Firm-Level Characteristics of SBA Firms by Program, 1999–2001
Key Characteristics 7(a) 504 SBIC* 7(a) 504 SBIC*Total 1619 2203 609
Female OwnershipAt least 50% female-owned 597 684 47 36.9 31.0 7.7Less than 50% female-owned 1022 1519 562 63.1 69.0 92.3Missing 0 0 0 0.0 0.0 0.0
Race of OwnerWhite 1227 1859 NA 75.8 84.4 NAAfrican-American 63 35 NA 3.9 1.6 NAHispanic 99 133 NA 6.1 6.0 NAAsian 207 167 NA 12.8 7.6 NANative American 18 7 NA 1.1 0.3 NAMultiple Race 5 2 NA 0.3 0.1 NAUnknown, Undetermined, Refused 0 0 NA 0.0 0.0 NA
Minority OwnershipMinority-owned 392 344 47 24.2 15.6 7.7Not minority-owned 1227 1859 562 75.8 84.4 92.3Missing 0 0 0 0.0 0.0 0.0
Veteran OwnershipVeteran-owned 189 209 4 11.7 9.5 0.7Not veteran-owned 1430 1994 605 88.3 90.5 99.3Missing 0 0 0 0.0 0.0 0.0
Firm TenureStart-up 154 167 92 9.5 7.6 15.1Existing Business 1462 2026 504 90.3 92.0 82.8Missing 3 10 13 0.2 0.5 2.1
Census Division and RegionNortheast 409 249 146 25.3 11.3 24.0Midwest 304 531 108 18.8 24.1 17.7South 400 407 178 24.7 18.5 29.2West 502 1004 176 31.0 45.6 28.9Outlying areas 4 12 1 0.2 0.5 0.2Missing 0 0 0 0.0 0.0 0.0
IndustryAg/Forestry/Fish/Hunt 4 18 1 0.2 0.8 0.2Mining/Util/Constr 107 155 15 6.6 7.0 2.5Manufacturing 256 454 254 15.8 20.6 41.7Wholesale&RetailTrade/Trans/Warehousing 484 552 70 29.9 25.1 11.5Info/Fin/Insur/RlEst/Prof/Sci/Tech/Mgmt/Admin/Remed 250 372 203 15.4 16.9 33.3Educ/Health/SocialAssist 113 176 35 7.0 8.0 5.7Arts/Entertain/Rec/Accom/Food 195 239 17 12.0 10.8 2.8Other Services (except Public Admin) 210 236 14 13.0 10.7 2.3Public Administration 0 1 0 0.0 0.0 0.0Missing 0 0 0 0.0 0.0 0.0
Number of EmployeesMean 13.4 23.7 97.6Median 6 14 35.5Missing 0 0 131
Size of InvestmentMean $268,719 $368,280 $1,180,688Median $150,000 $290,000 $500,000Missing 0 0 0
Tabulated by The Urban Institute (June 2007)
Number Percent
*Taxi companies are excluded from SBIC firms.
Source: Samples of SBA Administrative Files with matches from D&B for firms included in multivariate analyses of factors associated with employment growth conducted by the Urban Institute.
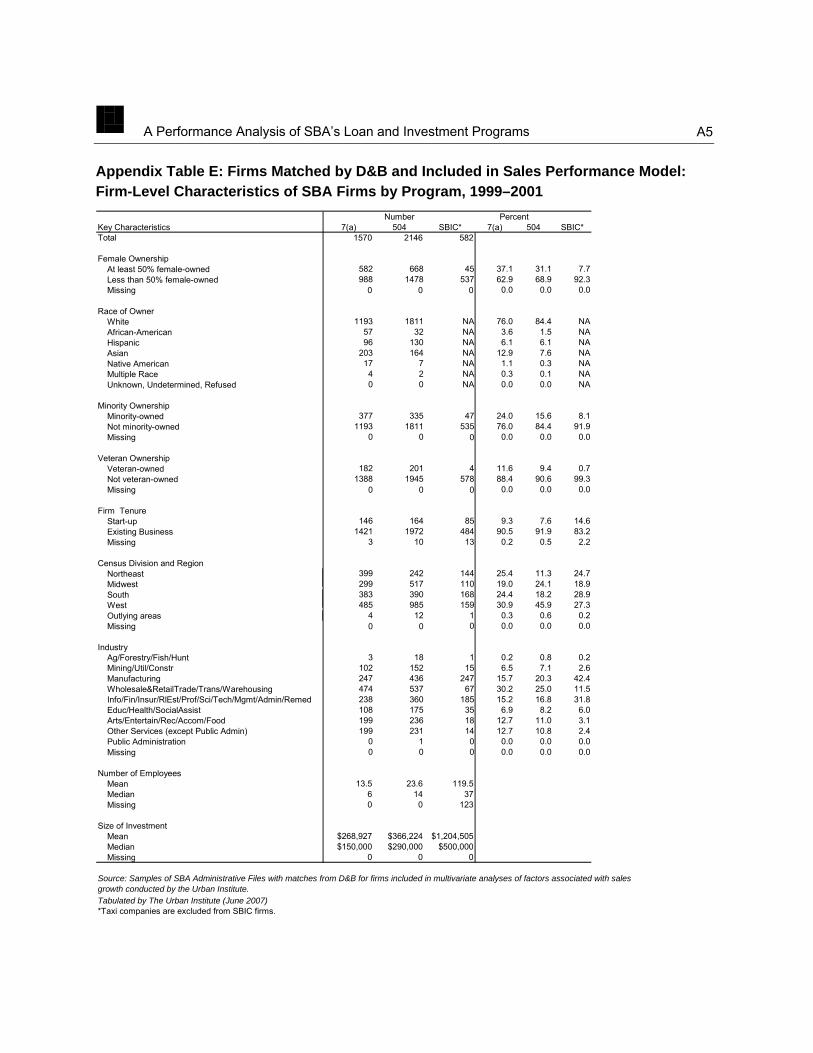
A Performance Analysis of SBA’s Loan and Investment Programs
A5
Appendix Table E: Firms Matched by D&B and Included in Sales Performance Model: Firm-Level Characteristics of SBA Firms by Program, 1999–2001
Key Characteristics 7(a) 504 SBIC* 7(a) 504 SBIC*Total 1570 2146 582
Female OwnershipAt least 50% female-owned 582 668 45 37.1 31.1 7.7Less than 50% female-owned 988 1478 537 62.9 68.9 92.3Missing 0 0 0 0.0 0.0 0.0
Race of OwnerWhite 1193 1811 NA 76.0 84.4 NAAfrican-American 57 32 NA 3.6 1.5 NAHispanic 96 130 NA 6.1 6.1 NAAsian 203 164 NA 12.9 7.6 NANative American 17 7 NA 1.1 0.3 NAMultiple Race 4 2 NA 0.3 0.1 NAUnknown, Undetermined, Refused 0 0 NA 0.0 0.0 NA
Minority OwnershipMinority-owned 377 335 47 24.0 15.6 8.1Not minority-owned 1193 1811 535 76.0 84.4 91.9Missing 0 0 0 0.0 0.0 0.0
Veteran OwnershipVeteran-owned 182 201 4 11.6 9.4 0.7Not veteran-owned 1388 1945 578 88.4 90.6 99.3Missing 0 0 0 0.0 0.0 0.0
Firm TenureStart-up 146 164 85 9.3 7.6 14.6Existing Business 1421 1972 484 90.5 91.9 83.2Missing 3 10 13 0.2 0.5 2.2
Census Division and RegionNortheast 399 242 144 25.4 11.3 24.7Midwest 299 517 110 19.0 24.1 18.9South 383 390 168 24.4 18.2 28.9West 485 985 159 30.9 45.9 27.3Outlying areas 4 12 1 0.3 0.6 0.2Missing 0 0 0 0.0 0.0 0.0
IndustryAg/Forestry/Fish/Hunt 3 18 1 0.2 0.8 0.2Mining/Util/Constr 102 152 15 6.5 7.1 2.6Manufacturing 247 436 247 15.7 20.3 42.4Wholesale&RetailTrade/Trans/Warehousing 474 537 67 30.2 25.0 11.5Info/Fin/Insur/RlEst/Prof/Sci/Tech/Mgmt/Admin/Remed 238 360 185 15.2 16.8 31.8Educ/Health/SocialAssist 108 175 35 6.9 8.2 6.0Arts/Entertain/Rec/Accom/Food 199 236 18 12.7 11.0 3.1Other Services (except Public Admin) 199 231 14 12.7 10.8 2.4Public Administration 0 1 0 0.0 0.0 0.0Missing 0 0 0 0.0 0.0 0.0
Number of EmployeesMean 13.5 23.6 119.5Median 6 14 37Missing 0 0 123
Size of InvestmentMean $268,927 $366,224 $1,204,505Median $150,000 $290,000 $500,000Missing 0 0 0
Tabulated by The Urban Institute (June 2007)
Number Percent
*Taxi companies are excluded from SBIC firms.
Source: Samples of SBA Administrative Files with matches from D&B for firms included in multivariate analyses of factors associated with sales growth conducted by the Urban Institute.

A Performance Analysis of SBA’s Loan and Investment Programs
A6
Appendix Table F. Association of Firm, Market, and Financing Characteristics with Percent Change in Sales and Employment, Controlling for Other Factors
Intercept 0.16 -0.25 -0.09 0.46 -0.42 -0.15 Average Growth in Year Before Loan -0.06 * -0.06 0.00 -0.02 0.00 0.00 Minority Ownership
(Non-Minority)Minority 0.26 * 0.04 -0.18 -0.10 -0.55 -0.28
Female Ownership(Less than 50% Female Owned)At least 50% Female Owned 0.14 0.03 0.00 -0.10 -0.59 -0.41
Veteran Ownership(Non-Veteran)Veteran 0.06 -0.10 -0.12 -0.08
Firm Age and Start-up Status(Non-start-up, age is greater than 10 years old)Start-up, any age 0.26 0.10 0.60 *** 0.52 *** 0.06 0.48 Non-start-up, age is less than 6 years old 0.41 *** 0.38 *** 0.45 *** 0.38 *** 1.20 *** 0.99 ***Non-start-up, age is 6 to 10 years old 0.14 0.02 0.20 * 0.23 *** -0.08 0.01 Non-start-up, age is missing -0.32 -0.10 -0.05 0.44 * 2.10 *** 0.47
Credit Score 0.0009 0.0005 -0.0004 -0.0005 0.0024 ** 0.0017 Industry
(Manufacturing)Ag/Forestry/Fish/Hunt/Mining/Util/Constr 0.65 ** 0.44 ** 0.16 0.07 -0.52 0.00 Wholesale&RetailTrade/Trans/Warehousing -0.16 -0.26 ** -0.09 0.10 0.63 * 0.04 Info/Fin/Insur/RlEst/Prof/Sci/Tech/Mgmt/Admin/Rem 0.13 -0.01 -0.20 0.07 -0.31 0.18 Educ/Health/SocialAssist 0.02 -0.17 -0.29 0.01 0.57 1.29 ***Arts/Entertain/Rec/Accom/Food -0.23 -0.11 -0.09 0.15 0.16 -0.38 Other Services/Public Admin -0.18 -0.23 -0.13 0.19 * -0.17 -0.18
Region(Midwest and Outlying Areas)Northeast 0.01 0.03 -0.09 -0.04 -0.24 -0.15 South 0.02 0.23 * 0.21 -0.01 0.33 -0.02 West 0.04 0.25 ** 0.23 * 0.11 0.56 -0.12
Unemployment Rate Two Years After Loan -0.04 0.02 0.04 -0.03 -0.03 -0.06 Financing Amount (per $100,000) 0.02 0.01 0.00 0.03 *** 0.00 0.00 Interest Rate -0.01 0.01 0.05 -0.01 Maturity Term 0.00 0.00 N 1,570 1,619 2,146 2,203 582 609Adjusted Wald F 1.60 ** 2.41 *** 1.79 ** 3.07 *** 3.18 *** 1.74 ***Adjusted R2 0.01 0.02 0.01 0.02 0.07 0.02
Note: 504 model excludes loan maturity term, SBIC model excludes veteran ownership, loan interest rate, and loan maturity term. *p< .10, **p<.05, ***p<.01
Sales Employment
7(a)
Source: The Urban Institute. Based on ordinary least squares (OLS) regression with percentage change in sales or employment from year of financing to three years after financing as the dependent variable. Explanatory variables include: Average sales or employment growth in year before loan (consistent with dependent variable); Minority ownership; Female ownership; Veteran ownership; Start-up status; Age of firm; Credit score; Industry; Region; Financing amount, interest rate, and maturity term; and Regional unemployment rate.
504
Sales Employment
SBIC
Sales Employment