a nutrient-dependent division antagonist is regulated post
TRANSCRIPT

RESEARCH ARTICLE Open Access
A nutrient-dependent division antagonist isregulated post-translationally by the Clpproteases in Bacillus subtilisNorbert S. Hill1,2, Jason D. Zuke1,3, P. J. Buske1,4, An-Chun Chien1,5 and Petra Anne Levin1*
Abstract
Background: Changes in nutrient availability have dramatic and well-defined impacts on both transcription andtranslation in bacterial cells. At the same time, the role of post-translational control in adaptation to nutrient-poorenvironments is poorly understood. Previous studies demonstrate the ability of the glucosyltransferase UgtP toinfluence cell size in response to nutrient availability. Under nutrient-rich medium, interactions with its substrateUDP-glucose promote interactions between UgtP and the tubulin-like cell division protein FtsZ in Bacillus subtilis,inhibiting maturation of the cytokinetic ring and increasing cell size. In nutrient-poor medium, reductions in UDP-glucose availability favor UgtP oligomerization, sequestering it from FtsZ and allowing division to occur at a smallercell mass.
Results: Intriguingly, in nutrient-poor conditions UgtP levels are reduced ~ 3-fold independent of UDP-glucose. B.subtilis cells cultured under different nutrient conditions indicate that UgtP accumulation is controlled through anutrient-dependent post-translational mechanism dependent on the Clp proteases. Notably, all three B. subtilis Clpchaperones appeared able to target UgtP for degradation during growth in nutrient-poor conditions.
Conclusions: Together these findings highlight conditional proteolysis as a mechanism for bacterial adaptation to arapidly changing nutritional landscape.
Keywords: Cell cycle, Cell size, Cell division, ClpP, UgtP, UDP-glucose
BackgroundAs single-celled organisms, bacteria constantly alter theirphysiology to adapt to their environment. Nutrients inparticular can dramatically impact bacterial growth andmorphology. Escherichia coli, Salmonella, and Bacillussubtilis cells grow several times faster and are up tothree times larger when cultured in nutrient-richmedium than when cultured in nutrient-poor medium[1–3]. Nutrient-dependent increases in cell size appearto be a means of accommodating the concomitant in-crease in macromolecular biosynthesis at faster growthrates, particularly the additional DNA generated by mul-tifork replication [4, 5].The nutrient-dependent regulation of biosynthesis has
been an area of intense interest for many years.
Numerous studies have explored how changes in nutri-ent composition and growth rate impact transcriptionand translation, which in large part is a response medi-ated via accumulation of the signaling molecule guano-sine pentaphosphate ((p)ppGpp) [6–9]. Although post-translational regulation has been implicated in adapta-tion to changes in growth phase (e.g. carbon starvation[10, 11]), how fluctuations in nutritional content andgrowth rate impact post-translational regulation at themolecular level is poorly defined.In previous work, we identified a class of division an-
tagonists responsible for coordinating cell size with nu-trient availability in B. subtilis and E. coli [4, 5]. Bothorganisms employ unrelated, yet functionally similar,glucosyltransferases—UgtP in B. subtilis and OpgH in E.coli—to inhibit division and increase size during growthin carbon-rich medium [12, 13]. In both cases, bindingto their substrate, UDP-glucose, stimulates interactionbetween UgtP and OpgH and the tubulin-like cell
* Correspondence: [email protected] of Biology, Washington University, St. Louis 63130, MO, USAFull list of author information is available at the end of the article
© The Author(s). 2018 Open Access This article is distributed under the terms of the Creative Commons Attribution 4.0International License (http://creativecommons.org/licenses/by/4.0/), which permits unrestricted use, distribution, andreproduction in any medium, provided you give appropriate credit to the original author(s) and the source, provide a link tothe Creative Commons license, and indicate if changes were made. The Creative Commons Public Domain Dedication waiver(http://creativecommons.org/publicdomain/zero/1.0/) applies to the data made available in this article, unless otherwise stated.
Hill et al. BMC Microbiology (2018) 18:29 https://doi.org/10.1186/s12866-018-1155-2

division protein FtsZ. The net result of these interactionsis a delay the maturation of the cytokinetic ring and anincrease cell size. Loss-of-function mutations in ugtP oropgH and in genes required for UDP-glucose biosyn-thesis reduce cell size by as much as 35% during growthin nutrient-rich conditions.UgtP and OpgH both have additional roles as glucosyl-
transferases that contribute to cell envelope biogenesis.UgtP transfers glucose from UDP-glucose to diacylglyc-erol to form the diglucosyl-diacylglycerol membrane an-chor for lipoteichoic acid (LTA) [14]. OpgH transfersglucose from UDP-glucose to the periplasm as an initialstep toward the synthesis of osmoregulated periplasmicglucans (OPGs) [15]. LTA and OPGs are proposed tohave similar functions [16] based on the conservation ofenzymes involved in their synthesis, their location withinthe cellular envelope [17, 18], and their contribution toosmoprotection [13, 19].In B. subtilis, UDP-glucose increases UgtP’s affinity for
FtsZ [20]. During growth in nutrient-rich conditions UgtPis localized throughout the cytoplasm, where the largestpool of FtsZ is located, and can also be found at the cyto-kinetic ring and at cell poles [4]. During growth incarbon-poor conditions or when synthesis of UDP-glucose is disrupted, UgtP self-assembles into large oligo-mers, sequestering it from FtsZ and permitting division tooccur at a reduced cell size [20]. In vitro studies suggestUDP-glucose acts as a molecular rheostat, preciselymodulating UgtP’s affinity for itself and FtsZ to coordinatesize with growth rate and nutrient availability [20]. Curi-ously, while the UgtP homolog in the Gram-positivepathogen Staphylococcus aureus interacts with FtsZ andother divisome proteins, it does not exhibit the same dy-namic localization pattern it does in B. subtilis nor does itappear to make a significant contribution to cell size [17].In addition to UDP-glucose-dependent changes in its
affinity for FtsZ, UgtP is also subject to nutrient-dependent changes in concentration. UgtP levels are re-duced several-fold during growth in nutrient-poor con-ditions [4]. Defects in the UDP-glucose biosynthesispathway have no discernable impact on the intracellularconcentration of UgtP, suggesting that nutrient-dependent changes in accumulation are independent ofthe signaling molecule [4].The striking difference in UgtP levels, together with
previous work suggesting protein turnover might be in-creased in nutrient-poor conditions [10], prompted us toinvestigate the mechanism underlying this additionallayer of UgtP regulation. Here we report that UgtPnutrient-dependent accumulation is governed by a post-translational mechanism involving all three substraterecognition components of the B. subtilis Clp proteasesystem. We find that some of the clp chaperone genesare upregulated during growth in nutrient-poor medium,
suggesting a possible mechanism for increased UgtPdegradation under these conditions. These findings sug-gest an important role for conditional proteolysis in thenutrient-dependent regulation of cellular processes.
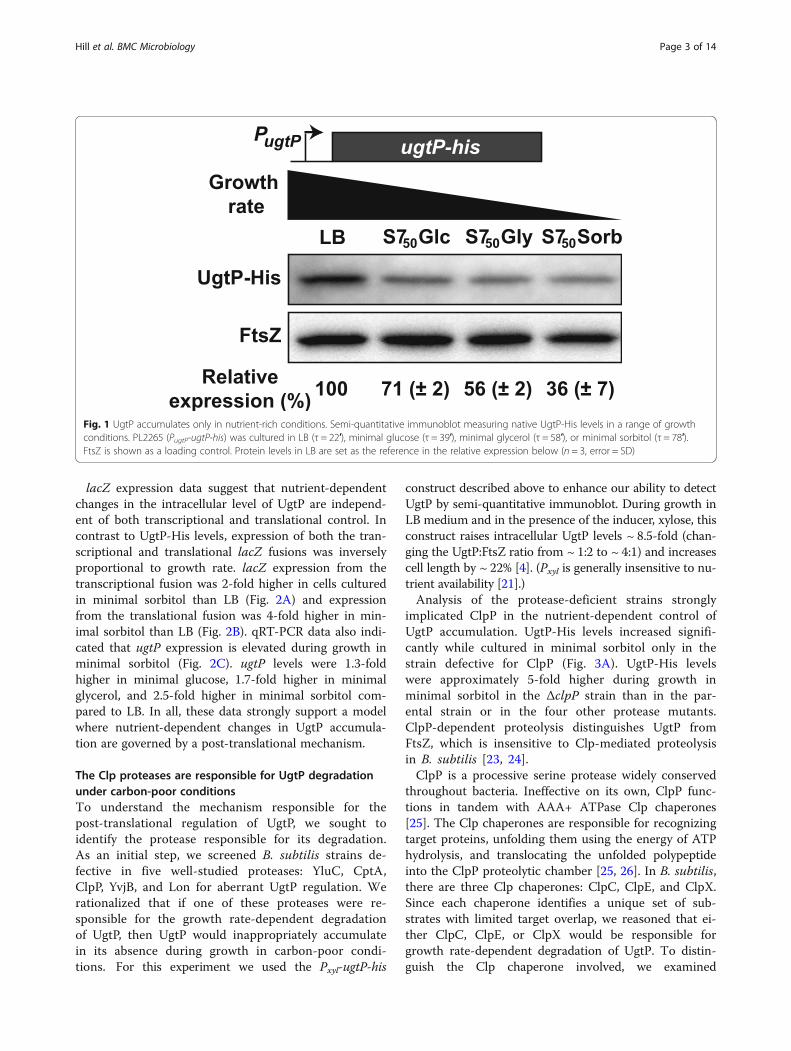
ResultsUgtP accumulation is subject to nutrient-dependentpost-translational regulationIn our initial investigation, we observed that the intracel-lular concentration of a UgtP-6XHis fusion protein wasthree to four-fold lower when cells were cultured undercarbon-poor conditions, but unaffected by the absenceof UDP-glucose [4]. Nutrient-dependent changes in con-centration contrast strongly with FtsZ, whose levels areessentially constant across a wide range of growth condi-tions [21]. The net result is a reduction in the UgtP:FtsZratio from ~ 1:2 in LB to as low as ~ 1:8 in min-imal medium based on previous calculations of absoluteFtsZ and UgtP concentrations per cell [4, 22]. To expandon this observation we measured levels of the sameUgtP-His fusion across four different nutrient condi-tions: Lysogeny Broth [LB], S750 + 1% glucose (minimalglucose), S750 + 1% glycerol (minimal glycerol), and S750+ 1% sorbitol (minimal sorbitol). Under each condition,the respective mass doubling time of this strain (PugtP-ugtP-his) was 22′, 39′, 58′, and 78′.Consistent with our previous findings, UgtP-His levels
increased linearly with nutrient availability and growthrate, as evidenced by a semi-quantitative immunoblotprobed with an α-His antibody (Fig. 1). The intracellularconcentration of UgtP-His was ~ 3-fold lower in cellscultured in minimal sorbitol, the most carbon-poor con-dition we examined, than in those cultured in LB, themost nutrient-rich condition examined. To control forthe possibility that the His-tag was impacting the stabil-ity of UgtP-His, we also measured YFP-UgtP levels in astrain expressing the fusion protein from a xylose-inducible promoter (Pxyl-yfp-ugtP), cultured in both LB+ 0.5% xylose and minimal sorbitol + 0.5% xylose. As weobserved with UgtP-His, YFP-UgtP levels were ~ 3-foldlower in minimal sorbitol compared to LB supporting amodel in which UgtP (and not the His or YFP tag) is theprimary target for degradation during growth in minimalsorbitol medium (Additional file 1:Figure S1).To determine if UgtP is subject to transcriptional or
post-transcriptional modes of regulation, we generatedtwo ugtP-lacZ fusion constructs. In the first construct, areporter for ugtP transcription, the 700 base pairs imme-diately upstream of the ugtP start codon were fused tolacZ, leaving the lacZ Shine-Dalgarno sequence intact.In the second construct, a reporter for UgtP translation,lacZ was fused in-frame downstream of the first 30 co-dons of the ugtP open reading frame that included thenative ugtP Shine-Dalgarno sequence.
Hill et al. BMC Microbiology (2018) 18:29 Page 2 of 14
lacZ expression data suggest that nutrient-dependentchanges in the intracellular level of UgtP are independ-ent of both transcriptional and translational control. Incontrast to UgtP-His levels, expression of both the tran-scriptional and translational lacZ fusions was inverselyproportional to growth rate. lacZ expression from thetranscriptional fusion was 2-fold higher in cells culturedin minimal sorbitol than LB (Fig. 2A) and expressionfrom the translational fusion was 4-fold higher in min-imal sorbitol than LB (Fig. 2B). qRT-PCR data also indi-cated that ugtP expression is elevated during growth inminimal sorbitol (Fig. 2C). ugtP levels were 1.3-foldhigher in minimal glucose, 1.7-fold higher in minimalglycerol, and 2.5-fold higher in minimal sorbitol com-pared to LB. In all, these data strongly support a modelwhere nutrient-dependent changes in UgtP accumula-tion are governed by a post-translational mechanism.
The Clp proteases are responsible for UgtP degradationunder carbon-poor conditionsTo understand the mechanism responsible for thepost-translational regulation of UgtP, we sought toidentify the protease responsible for its degradation.As an initial step, we screened B. subtilis strains de-fective in five well-studied proteases: YluC, CptA,ClpP, YvjB, and Lon for aberrant UgtP regulation. Werationalized that if one of these proteases were re-sponsible for the growth rate-dependent degradationof UgtP, then UgtP would inappropriately accumulatein its absence during growth in carbon-poor condi-tions. For this experiment we used the Pxyl-ugtP-his
construct described above to enhance our ability to detectUgtP by semi-quantitative immunoblot. During growth inLB medium and in the presence of the inducer, xylose, thisconstruct raises intracellular UgtP levels ~ 8.5-fold (chan-ging the UgtP:FtsZ ratio from ~ 1:2 to ~ 4:1) and increasescell length by ~ 22% [4]. (Pxyl is generally insensitive to nu-trient availability [21].)Analysis of the protease-deficient strains strongly
implicated ClpP in the nutrient-dependent control ofUgtP accumulation. UgtP-His levels increased signifi-cantly while cultured in minimal sorbitol only in thestrain defective for ClpP (Fig. 3A). UgtP-His levelswere approximately 5-fold higher during growth inminimal sorbitol in the ΔclpP strain than in the par-ental strain or in the four other protease mutants.ClpP-dependent proteolysis distinguishes UgtP fromFtsZ, which is insensitive to Clp-mediated proteolysisin B. subtilis [23, 24].ClpP is a processive serine protease widely conserved
throughout bacteria. Ineffective on its own, ClpP func-tions in tandem with AAA+ ATPase Clp chaperones[25]. The Clp chaperones are responsible for recognizingtarget proteins, unfolding them using the energy of ATPhydrolysis, and translocating the unfolded polypeptideinto the ClpP proteolytic chamber [25, 26]. In B. subtilis,there are three Clp chaperones: ClpC, ClpE, and ClpX.Since each chaperone identifies a unique set of sub-strates with limited target overlap, we reasoned that ei-ther ClpC, ClpE, or ClpX would be responsible forgrowth rate-dependent degradation of UgtP. To distin-guish the Clp chaperone involved, we examined
Fig. 1 UgtP accumulates only in nutrient-rich conditions. Semi-quantitative immunoblot measuring native UgtP-His levels in a range of growthconditions. PL2265 (PugtP-ugtP-his) was cultured in LB (τ = 22′), minimal glucose (τ = 39′), minimal glycerol (τ = 58′), or minimal sorbitol (τ = 78′).FtsZ is shown as a loading control. Protein levels in LB are set as the reference in the relative expression below (n = 3, error = SD)
Hill et al. BMC Microbiology (2018) 18:29 Page 3 of 14

accumulation of UgtP-His from a xylose-inducible pro-moter in ΔclpC, ΔclpE, and ΔclpX cells cultured in min-imal sorbitol.Deletion of clpC, clpE, and clpX alone or in pairwise
combination had little impact on UgtP-His levels in min-imal sorbitol. UgtP-His accumulated to levels similar to thatobserved in the ΔclpP mutant only in a strain defective forall three chaperones (Fig. 3B). These data suggest that allthree Clp chaperones function redundantly to control UgtPaccumulation in a growth rate-dependent manner.To confirm that the Clp proteases are indeed re-
sponsible for degradation of UgtP, as our data sug-gested, we employed an in vivo proteolysis assaysimilar to that described in [27]. Briefly, we culturedPxyl-ugtP-his and the congenic ΔclpP strains in min-imal sorbitol with xylose to an A600 of ~ 0.2. We thenadded chloramphenicol to inhibit new protein synthe-sis and sampled cells every 30 min for 2 h. UgtP-Hislevels were determined via semi-quantitative immuno-blot. Consistent with UgtP being directly targeted byClpP, UgtP-His levels decreased rapidly in clpP+ cellsover time, but were stable in the absence of the pro-tease (Fig. 3C and Additional file 2: Figure S2).
Consistent with the Clp proteases serving as nutrient-dependent regulators of protein stability, expression ofclpC and clpE were elevated in minimal sorbitol (Fig. 3D).qRT-PCR indicated that expression of clpC and clpE areupregulated > 4-fold, while clpX and clpP are marginallyupregulated (~ 1.5-fold) in minimal sorbitol, our poorestcarbon source, relative to LB. These findings are consist-ent with those of the Hecker lab who observed ClpXP andClpCP drive proteolysis of a large group of proteins, mostnotably enzymes involved in central carbon metabolism,upon glucose starvation (UgtP was not identified as a Clpsubstrate in this study) [10].
Defects in UgtP’s hexose-binding site increases susceptibilityto proteolysis in vivoIn an attempt to identify regions of UgtP required forrecognition by the Clp chaperones, we screened a seriesof UgtP mutants for sensitivity to Clp-mediated degrad-ation in vivo. Of particular interest were regions of UgtPthat mediate interaction with UDP-glucose, FtsZ, or it-self. To test the impact of UDP-glucose binding andoligomerization on Clp-dependent degradation, weemployed three UgtP mutants, generated based on
a b
c
Fig. 2 UgtP accumulation is subject to post-translational control. lacZ encoding β-galactosidase fused to either (a) 700 bp upstream of the ugtPstart site (PugtP) to generate a transcriptional fusion (PL1967) or (b) an additional 90 bases downstream of the ugtP start codon to generate atranslational fusion (PL2034). Both strains were cultured in a range of nutrient conditions to generate four different growth rates. Bars indicatemean ± SD of specific β-galactosidase activity (n = 3) and an unpaired T-test was used to access significance (***p < 0.001, ** p < 0.01, *p < 0.05,ns p > 0.05). (c) qRT-PCR measurements of ugtP expression levels. Expression in three defined media is normalized to expression in LB. Values aremean ± SD (n = 3). An unpaired T-test was applied to the ΔCt values to access significance (*p < 0.05, ns p > 0.05)
Hill et al. BMC Microbiology (2018) 18:29 Page 4 of 14

structural data from the UgtP homologue, mongalacto-syldiacylglycerol (MGDG) synthase [28]: one defective inits putative uracil-binding site (URA-: F112A V117A),one defective in the putative hexose-binding site (HEX-:E306A N309A), and one in the predicted dimerization/oligomerization domain (OLI-: I142A E146A).All three UgtP mutants behaved as predicted based on
structural and biochemical data from the MGDG synthase(Fig. 4A) [28]. Both UgtPURA- and UgtPHEX- are defectiveas sugar transferases, exhibit a punctate localization pat-tern during growth in nutrient-rich medium, and fail tocomplement a ugtP null strain for cell size, all of which isconsistent with increased self-association and a loss ofinteraction with FtsZ [20]. In support of our model thatoligomerization serves to sequester UgtP from FtsZ, dur-ing growth in the absence of UDP-glucose the putativeoligomerization mutant (UgtPOLI-) exhibited less punctate(self-associated) localization (Additional file 3: FigureS3A) and antagonized division to increase cell length bymore than 30% (Additional file 3: Figure S3B).For analysis of UgtP mutant accumulation, His-tagged
versions of all three UgtP variants (URA-, HEX- andOLI-) were expressed from an ectopic locus under thecontrol of a xylose-inducible promoter in a ugtP nullbackground. UgtP mutant accumulation under nutrient-rich (LB) and carbon-poor conditions (minimal sorbitol)
was monitored by semi-quantitative immunoblot in earlyexponential phase. For reasons that are unclear, bothUgtPURA--His and UgtPHEX--His exhibited migrationpatterns different from wild type UgtP-His when sepa-rated by SDS-PAGE prior to immunoblotting (Fig. 4).This difference may reflect conformational changes inmutant protein structure.Of the three mutants, only UgtPHEX--His exhibited
ClpP-dependent differential in accumulation comparedto wild type UgtP-His, suggesting hexose binding mightprotect UgtP from proteolysis. UgtPHEX--His accumu-lated to only ~ 35% of UgtP-His (WT) levels duringgrowth in LB (Fig. 4B). Even in minimal sorbitol, Ugt-PHEX--His levels were ~ 65% of UgtP-His (Fig. 4C). Ugt-PURA--His and UgtPOLI--His were indistinguishable fromwild type UgtP-His with regard to ClpP-dependentchanges in accumulation, arguing against a role for inter-action with FtsZ or homo-oligomerization in shieldingUgtP from Clp recognition. Importantly, each of the con-structs exhibited congruent mRNA levels measured byqRT-PCR and UgtPHEX--His is at WT levels in a ΔclpPbackground strain in both LB and minimal sorbitol, indi-cating that the change in stability is directly due to ClpP-mediated degradation (Additional file 4: Figure S4).Together these data suggest that interaction with the
hexose moiety of UDP-glucose, which we have measured
a
c
b
d
Fig. 3 UgtP is subject to nutrient-dependent, post-translational regulation by the Clp proteases. Semi-quantitative immunoblot of UgtP-His expressedfrom a xylose-inducible promoter (Pxyl-ugtP-his) in the absence of (a) 5 proteases, YluC, CptA, ClpP, YvjB, and Lon (PL2022, PL2028, PL2102, PL2032, andPL2033, BH10 as WT) or (b) single/combinatorial deletions of the Clp chaperones (ClpC, ClpE, and/or ClpX) (BH127, BH128, BH130, PL2102,BH135, BH136, BH137, BH138). Cells were cultured in either LB + 0.5% xylose or minimal sorbitol + 0.5% xylose, and immunoblotted againstHis and FtsZ. Samples shown in (a) and also for (b) were run on the same blot, but cropped during image processing. (c) Fold changein UgtP-His levels for Pxyl-ugtP-his (BH10) and Pxyl-ugtP-his + ΔclpP (BH129) after adding spectinomycin to inhibit translation. Cells were cultured inminimal sorbitol + 0.5% xylose, sampled every 30 min after spectinomycin addition, and subjected to immunoblotting against His antibody. Values aremean ± SD (n = 3). A two-way ANOVA was used to assess differences in UgtP-His levels ± clpP over time (P < 0.0001) and a Bonferroni multiplecomparisons test (shown) was used to determine significance between the two strains at specific time intervals (***p < 0.001, **p < 0.01).(d) qRT-PCR measurements of clpC, clpE, clpX, and clpP expression in minimal sorbitol versus LB. Values are mean ± SD (n = 4). An unpaired T-test wasapplied to the ΔCt values to access significance (***p < 0.001, **p < 0.01, ns p > 0.05)
Hill et al. BMC Microbiology (2018) 18:29 Page 5 of 14

as being more prevalent when cultured in nutrient-richconditions (Additional file 5: Figure S5), may providesome protection from Clp-mediated proteolysis. At thesame time, however, this observation is inconsistent withour previous observation that UgtP accumulation is in-dependent of UDP-glucose synthesis [4], a point we ad-dress in the discussion.
UgtP is targeted by ClpXP for proteolysis in vitroTo clarify whether Clp recognition of UgtP is direct orreliant on a nutrient-dependent adaptor protein, we nextdetermined if UgtP could be degraded directly by ClpXPin vitro. Although our genetic data indicate all three Clpchaperones are capable of degrading UgtP (Fig. 3B), wefocused on ClpX as the most prevalent chaperone (thereare an estimated 1400 ClpX, 250 ClpC, and 100 ClpEhexamers per cell during growth in LB) [29].For these experiments, we expressed and purified
ClpX and ClpP as previously described and a His-UgtPwe constructed for this study [24]. We employed thewell-characterized ClpXP substrate Spx [30] as a positivecontrol, and a non-targeted protein, Thioredoxin-His, asa negative control. As expected, Spx was subject to ro-bust ATP-dependent ClpXP mediated degradation, whileThioredoxin-His was retractile to ClpXP proteolysis(Additional file 6: Figure S6). Due to the size-similaritybetween His-UgtP and ClpX used in the degradation as-says (44 kDa vs 46 kDa), we could not distinguish be-tween the two when separated by standard SDS-PAGE.
Instead, we employed a monoclonal anti-His antibody todistinguish between His-UgtP and ClpX via immunoblot.Please note that because we detected UgtP by immuno-blot and the anti-His antibody (monoclonal THE™ anti-body, Genscript) interacted strongly with nanogramamounts of the His-UgtP fusion protein, we found it ne-cessary to utilize significantly lower concentrations ofHis-UgtP relative to the Spx and Thioredoxin-His con-trol proteins to remain in linear range. While His-UgtPlevels were monitored by immunoblot, Spx andThioredoxin-His were monitored by Coomassie staining.Consistent with our genetic analysis, in vitro data
strongly support a model in which UgtP is degraded byClpXP facilitated through a direct interaction betweenthis Clp complex and UgtP (Fig. 5A). Incubating purifiedHis-UgtP with the ClpXP complex without ATP resultedin minimal degradation (13%). In stark contrast, whenATP was added to reactions 88% of His-UgtP was pro-teolyzed. Though the possibility of contaminating non-specific ATP-dependent proteases in the purified proteinpreparations contributing to the observed His-UgtP deg-radation exists, we did not observe any degradation ofour negative control, Thioredoxin-His (Additional file 6:Figure S6).Based on our in vivo data supporting a model in which
hexose binding may shield UgtP from Clp-mediated pro-teolysis (Fig. 4), we speculated that adding UDP-glucoseor simply glucose to the ClpXP proteolysis assays mighthinder UgtP degradation. To test this model we added
a
c
b
Fig. 4 Mutations in UgtP’s putative hexose-binding site enhance susceptibility to proteolysis in vivo. (a) A schematic representation of YFP-UgtPlocalization and cell size for wild type, uracil-binding (URA-), hexose-binding (HEX-), and self-oligomerization (OLI-) mutants in either LB or minimalsorbitol (Additional file 3:Figure S3 & [20]). UgtP-His variants BH736 (WT), BH742 (URA-), BH752 (HEX-), BH740 (OLI-) were cultured in either (b) LB+ 0.5% xylose or (c) minimal sorbitol + 0.5% xylose and subjected to semi-quantitative immunoblotting against His and FtsZ (loading control)antibodies. Relative expression compared to WT (BH736) UgtP-His is shown (n = 3, error = SD)
Hill et al. BMC Microbiology (2018) 18:29 Page 6 of 14

UDP-glucose or glucose 6-phosphate in excess to theClpXP in vitro proteolysis reactions described above.However, we saw no difference in UgtP proteolysis inthe presence of either sugar (Fig. 5B).
Clp-mediated UgtP degradation during growth in minimalsorbitol medium does not significantly impact cell size ordiglucosyl-diacylglycerol productionIn an effort to illuminate the potential “rationale” forClp mediated degradation of UgtP during growth incarbon-poor medium we examined the impact of Clp ac-tivity on cell size and production of diglucosyl-diacylglycerol (DGD), the anchor for LTA. UgtP exhibitsa high affinity for FtsZ (38 nM) even in the absence ofUDP-glucose [20]. Nutrient-dependent degradation maythus serve as an additional control to prevent UgtP-mediated division inhibition during growth in carbon-poor conditions.For these experiments, we took advantage of two
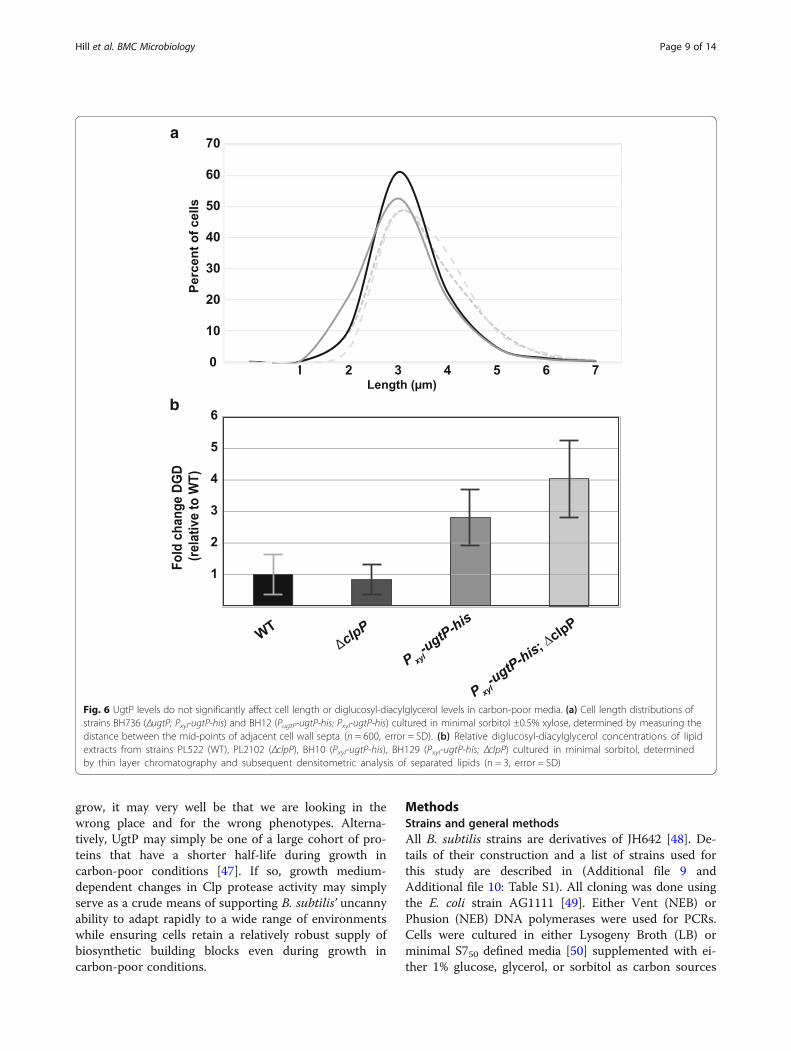
strains capable of producing a range of UgtP concentra-tions in minimal sorbitol: BH736 (ΔugtP; Pxyl-ugtP-his)and BH12 (PugtP-ugtP-his; Pxyl-ugtP-his). Semi-quantitative immunoblots indicate that non-inducedBH736 produces no detectible UgtP-His, induced BH736and non-induced BH12 produce similar levels of UgtP-His, and induced BH12 produces approximately 60%more UgtP-His than BH12 non-induced (Additional file 7:Figure S7). If cell size under carbon-poor conditions issensitive to UgtP concentration, then we would expect tosee a gradient of cell sizes with cell size increasing in pro-portion to UgtP concentration. We opted not to measurethe impact of ClpP on cell size since clpP is highly pleotro-pic and deletion could feasibly alter cell length independ-ent of UgtP degradation.Somewhat surprisingly, we did not observe a signifi-
cant difference in cell size between strains regardless ofthe presence of xylose. Average cell size was not signifi-cantly different between any set of conditions, including
the UgtP-null (BH736 –xylose) and UgtP-overexpressionconditions (BH12 + xylose) (Table 1, p = 0.28). Addition-ally, cell size distributions for each condition are not ob-viously different from one another (Fig. 6A). These datafail to support a model in which Clp-mediated UgtPdegradation is important for maintaining cell size incarbon-poor medium.Another possible explanation for the degradation of
UgtP in carbon-poor conditions is the preservation ofintracellular glucose by curtailing production of UgtP’sproduct, diglucosyldiacylglycerol [14]. To test this possi-bility we measured DGD levels in wild type and ΔclpPstrains, as well as their isogenic Pxyl-ugtP counterparts,cultured in minimal sorbitol (with xylose added whengrowing Pxyl-ugtP strains). Briefly, we purified mem-branes from these strains, performed a methanol:chloro-form lipid extraction, separated the lipids using thin-layer chromatography, stained for DGD using iodine gas,and quantified DGD. Lipids were also extracted fromΔugtP cells for use as a negative control.Despite the 3-fold difference in UgtP concentration,
DGD levels were not significantly different between WT/ΔclpP cells (p = 0.78) or induced Pxyl-ugtP cells ± clpP (p= 0.30) (Fig. 6B). As expected, ΔugtP cells produced no de-tectible DGD (Additional file 8: Figure S8). These datasuggest that while UgtP is necessary for DGD production,degradation of UgtP via the Clp proteases is irrelevant formodulating DGD concentration. It is therefore unlikelythat degradation of UgtP occurs in carbon-poor condi-tions as a means of conserving glucose, as production ofglucose-rich DGD is not affected by UgtP degradation.
DiscussionOur results indicate UgtP accumulation is controlled ina nutrient-dependent manner via a post-translational,Clp-dependent mechanism. This additional layer ofregulation governing UgtP activity, distinct from UDP-glucose-mediated changes in UgtP’s affinity for itself and
a b
Fig. 5 ClpXP targets UgtP for proteolysis in vitro independent of UDP-glucose. (a) Immunoblot of purified His-UgtP after incubation with purifiedClpXP. Reactions consisting of 3 μM ClpX, 6 μM ClpP, 3 μM His-UgtP, and 5 mM ATP were incubated for 45 min at room temperature. ClpXPsubstrate controls are shown in Additional file 6: Figure S6. (b) In vitro ClpXP cleavage assay ± UDP-glucose or glucose-6P. The assayused 3 μM ClpX, 6 μM ClpP, 3 μM His-UgtP, 5 mM ATP, and 2 mM of either UDP-glucose or glucose-6P. α-His was used to visualize His-UgtPlevels by immunoblot. Each cognate set was used to gauge relative degradation (%) as shown below (n = 3, error = SD)
Hill et al. BMC Microbiology (2018) 18:29 Page 7 of 14

FtsZ, ensures that active UgtP accumulates only undernutrient-rich growth conditions when it antagonizes celldivision. While there are several prominent examplesof conditional proteolysis coupled to growth phase[31–33], there are only a handful of examples inwhich proteolysis has been linked to growth rate and/or nutrient availability. Two such examples are fromthe Narberhaus lab: 1) The DNA-binding replicationinhibitor CspD is selectively proteolyzed by the Lonprotease during growth in nutrient-rich medium [34]and 2) LpxC, a deacetylase involved in lipid A biosyn-thesis, is degraded only when cultured at slowergrowth rates by the protease FtsH [35].We were somewhat surprised by our finding that UgtP
proteolysis in vivo is accomplished via the redundant ac-tivity of ClpCP, ClpEP, and ClpXP (Fig. 3B). While ZapCis recognized and degraded by ClpXP and ClpAP in E.coli, to our knowledge UgtP is the first published ex-ample of a Clp substrate recognized by all the Clpchaperone proteins in B. subtilis [36]. Further, we findthat genes encoding two of the clp chaperones, clpC andclpE, are expressed at higher levels during slowergrowth, which likely contributes toward the growthmedium-dependent regulation of UgtP (Fig. 3D). It isnoteworthy that ClpX, previously identified as a directinhibitor of FtsZ assembly in B. subtilis independent ofits role in proteolysis, also modulates the stability of anentirely different FtsZ inhibitor [24].Since AAA+ proteases exhibit distinct substrate-
binding repertoires with only minor overlap in targetspecificity [37], it is curious how and why all three Clpchaperones are able to target UgtP. These chaperones ei-ther recognize unstructured peptide sequence tags(known as degrons) within a client protein or adaptorproteins bound to target substrates. ClpC exclusivelyuses adaptor proteins (MecA, YpbH, and McsB) torecognize substrate as well as to promote the activationof the ClpC hexamer [38–41]. Although ClpXP is cap-able of degrading UgtP in vitro (Fig. 5), we were unableto identify putative degrons for any of the three Clp
chaperone proteins within the UgtP primary sequencethrough comparison with other verified and putative B.subtilis Clp substrates [10, 42, 43]. It thus remains anopen question whether ClpXP, ClpCP, and ClpEP share acommon degron or adaptor protein, or use distinctmechanisms, to target UgtP for degradation.UgtP degradation was enhanced in vivo by two point
mutations (E306A N309A) in its putative hexose-binding site suggesting ligand binding might afford someprotection from ClpP-specific proteolysis (Fig. 4). Whilethere is precedent in both prokaryotic and eukaryoticsystems of small molecule ligands governing proteolyticsusceptibility [44–46], our data do not cohesively sup-port that UDP-glucose shields UgtP from degradation.Neither defects in UDP-glucose biosynthesis [4] nor mu-tations disrupting the putative nucleotide binding site(URA-, F112A V117A) had an impact on UgtP accumu-lation (Fig. 4). Instead, these data suggest ligand bindingis largely irrelevant to UgtP stability and the hexose-binding mutation (E306A N309A) may simply lead to aconformation that exposes a Clp recognition sequence.Although we are unaware of any literature supporting anegative relationship between clp expression or activityand cell size, enrichment of the Clp proteases—particu-larly ClpC and ClpE—under nutrient-poor conditions asthe most parsimonious, albeit still theoretical, explan-ation for UgtP degradation under these conditions (Fig.3D).
ConclusionsAs a whole, our data point to UgtP being subject to anelaborate set of multilayered controls. Not only is it un-clear why three Clp chaperones would be needed forUgtP degradation in minimal medium, it is also notreadily apparent why a carbon-starved cell would spendenergy to transcribe and translate ugtP only to immedi-ately have it proteolyzed, consuming ATP at each step.We were unable to identify a phenotypic explanation forthe nutrient-dependent degradation of UgtP. Given themyriad of conditions under which B. subtilis is able to
Table 1 Cell length in response to differential UgtP levels in minimal sorbitol
Strain Relative UgtPExpression
AverageCell Length [μm]
Change inLength (%)
BH736 – xylose(ΔugtP; Pxyl-ugtP-his)
0 2.63 ± 0.27 Reference
BH736 + xylose(ΔugtP; Pxyl-ugtP-his)
99 ± 45 2.72 ± 0.11 + 3.4%
(PugtP-ugtP-his; Pxyl-ugtP-his)BH12 – xylose
100 ± 24 3.07 ± 0.20 + 16.7%
(PugtP-ugtP-his; Pxyl-ugtP-his)BH12 + xylose
155 ± 33 2.95 ± 0.25 + 12.2%
Average cell length of strains BH736 (ΔugtP; Pxyl-ugtP-his) and BH12 (PugtP-ugtP-his; Pxyl-ugtP-his) cultured in minimal sorbitol ±0.5% xylose, determined bymeasuring the distance between the mid-points of adjacent cell wall septa (n = 600, error = SD). Relative UgtP expression is demonstrated in Additional file 7:Figure S7
Hill et al. BMC Microbiology (2018) 18:29 Page 8 of 14
grow, it may very well be that we are looking in thewrong place and for the wrong phenotypes. Alterna-tively, UgtP may simply be one of a large cohort of pro-teins that have a shorter half-life during growth incarbon-poor conditions [47]. If so, growth medium-dependent changes in Clp protease activity may simplyserve as a crude means of supporting B. subtilis’ uncannyability to adapt rapidly to a wide range of environmentswhile ensuring cells retain a relatively robust supply ofbiosynthetic building blocks even during growth incarbon-poor conditions.
MethodsStrains and general methodsAll B. subtilis strains are derivatives of JH642 [48]. De-tails of their construction and a list of strains used forthis study are described in (Additional file 9 andAdditional file 10: Table S1). All cloning was done usingthe E. coli strain AG1111 [49]. Either Vent (NEB) orPhusion (NEB) DNA polymerases were used for PCRs.Cells were cultured in either Lysogeny Broth (LB) orminimal S750 defined media [50] supplemented with ei-ther 1% glucose, glycerol, or sorbitol as carbon sources
a
b
Fig. 6 UgtP levels do not significantly affect cell length or diglucosyl-diacylglycerol levels in carbon-poor media. (a) Cell length distributions ofstrains BH736 (ΔugtP; Pxyl-ugtP-his) and BH12 (PugtP-ugtP-his; Pxyl-ugtP-his) cultured in minimal sorbitol ±0.5% xylose, determined by measuring thedistance between the mid-points of adjacent cell wall septa (n = 600, error = SD). (b) Relative diglucosyl-diacylglycerol concentrations of lipidextracts from strains PL522 (WT), PL2102 (ΔclpP), BH10 (Pxyl-ugtP-his), BH129 (Pxyl-ugtP-his; ΔclpP) cultured in minimal sorbitol, determinedby thin layer chromatography and subsequent densitometric analysis of separated lipids (n = 3, error = SD)
Hill et al. BMC Microbiology (2018) 18:29 Page 9 of 14

and appropriate amino acid supplements. For strainscontaining ΔclpP or ΔclpCEX, cells were always first cul-tured in LB prior to growth in other growth media.
Semi-quantitative immunoblottingBacterial cells cultured to A600 0.20–0.40 were lysed bycentrifuging 1 mL of culture then re-suspending in50 μL lysis buffer (20 mM tris pH 8.0, 12.5 mM MgCl2,1 mM CaCl2, 2 mg/mL lysozyme, 1X Halt™ Protease In-hibitor Cocktail), incubating 10 min at 42 °C, then add-ing SDS to 1% (v/v). Laemmli buffer was added to 1X,lysates were incubated 10 min at 100 °C, then lysate wasnormalized to OD and subjected to SDS-PAGE. Proteinswere transferred to PVDF membranes using Bio-RadTrans-Blot® Turbo™ instrument as described on pg. 15 ofthe operation manual. Subsequent to transfer, but priorto blocking PVDF membranes were stained with 1XPonceau S solution in 5% acetic acid for 5 min and totalprotein per lane used as a loading control [51]. Mem-branes were then blocked with 5% nonfat milk in PBSfor 1 h.Two different Anti-His antibodies to detect His-tagged
UgtP were employed in this study: 1) His-probe mono-clonal antibody (Santa Cruz Biotechnology) used at1:1000 (used in Fig. 3), and 2) monoclonal THE™ HisTag (Genscript) α-His antibodies incubated at 1:1000.Rabbit polyclonal (Genscript) α-GFP antibodies incu-bated (at 1:1000) were used to detect YFP-tagged UgtP.FtsZ was detected using an affinity-purified polyclonalrabbit α-FtsZ antibody (at 1:5000) [52]. Cognate goat α-rabbit or goat α-mouse (Genscript) HRP secondary anti-bodies were used (at 1:5000). The membranes were de-veloped using ECL substrate (Bio-Rad #1705060) andimaged using a Li-COR Odyssey FC instrument that de-tected saturation and autocorrected exposure time.Loading was first normalized to cell density measured byA600, then total protein per lane was calculated usingPonceau-S prior to blocking. Blot density was quantifiedusing ImageJ (NIH) by subtracting background and nor-malizing to total protein (Ponceau S staining). In somecases, FtsZ is shown as the loading control because itwas largely invariant with Ponceau-S staining.
In vivo UgtP degradation assayProtocol was adapted from [27]. Strains were culturedin 5 mL LB + 0.5% xylose at 37 °C with shaking untilA600 = 0.20–0.40. These cultures were then dilutedinto 20 mL minimal sorbitol + 0.5% xylose to A600 =0.005. Once A600 reached 0.20–0.40, spectinomycinwas added to 200 μg/mL. Cultures were sampled(1 mL) at 0, 30, 60, 90, and 120 min after spectino-mycin addition, and the samples were frozen at − 80 °Cfor future use. These samples were then subjected to
semi-quantitative immunoblotting for UgtP-His, the pro-tein was quantified using ImageJ (NIH) and processed inMicrosoft Excel.
β-galactosidase activity in liquid culturesSpecific activity was calculated essentially as described in[53]. Strains encoding lacZ fusions were cultured at 37 °Cto early/mid-log (A600 0.30–0.40). Prior to sampling, thecultures were diluted 1:2 in their respective mediumand absorbance at A600 was recorded. 30 μl of tolu-ene and 30 μl of a 0.1% sodium dodecyl sulfate solu-tion were added to 2 ml of bacterial culture topermeabilize cells. Incubating cells at 37 °C for45 min then evaporated the toluene. Cells were thenmixed with Z-buffer (60 mM Na2HPO4, 40 mMNaH2PO4, 10 mM KCl, 1 mM MgSO4, 50 mM β-mercaptoethanol) and tubes were incubated at 25 °Cfor 5′. Reactions were started by adding 0.25 ml of0.4% o-nitrophenol-β-galactoside in Z-buffer andstopped by adding 0.5 ml of 1 M Na2CO3. A420 wasthen recorded. The specific unit value was calculatedusing the equation: = 200 × (A420 of the culture −A420 in the control tube)/minutes of incubation × di-lution factor.
Quantitative real-time polymerase chain reactionRNA was harvested from B. subtilis cells in early-log(A600 = 0.20–0.40) with RiboPure™ Kit (Ambion), treatedwith the Turbo DNA-Free Kit™ (Ambion), and reversetranscribed for 1 h at 42 °C using the RETROscript® Kit(Ambion). Template was diluted 10-fold, added to iTaqSYBR Green Supermix (Bio-Rad) with appropriate oligo-nucleotide pairs. Oligonucleotides used in this study aredescribed in (Additional file 11: Table S2). Data were ac-quired using an Applied Biosystems model 7500 thermo-cycler. Results were analyzed using the comparativePfaffl method [54].
Protein purificationAll plasmids encoding genes used for purification weremini-prepped from storage E. coli strain AG1111 andfreshly transformed into C41(DE3) cells and conse-quently used for expression of protein (no frozen stockswere used). Briefly, 1 L of LB medium was inoculated1:100 with overnight culture from a single colony. Cellswere grown at 37 °C with the exception of ClpP andClpX, which were grown at room temperature. WhenA600 ~ 0.6, cells were induced with isopropyl 1-thio-β-D-galactopyranoside to a final concentration of 1 mM.Cells were grown for an additional 4-8 h and then cellswere harvested by centrifugation, and cell pellets werestored at − 80 °C.
Hill et al. BMC Microbiology (2018) 18:29 Page 10 of 14
ClpP and ClpX were purified using the IMPACT Sys-tem (NEB) as described previously [24]. Spx was alsopurified as previously described [24] with the followingmodifications: Spx-His was purified from a Ni-NTA col-umn with a 50-500 mM imidazole gradient and peakfractions pooled. An N-terminal 6X–His tag was thenremoved by cleavage with AcTev protease (Life Tech-nologies). Spx was further purified using size exclusionchromatography over an S-300 column in buffer con-taining 50 mM Tris pH 7.5, 50 mM KCl, and 10% gly-cerol. Peak fractions were collected, pooled, andconcentrated using an Amicon-10 kDa centrifugationcolumn, flash frozen on liquid nitrogen, and stored at −80 °C.His-UgtP in pET28a(+) (PL3521) was purified as
follows: Starting from frozen pellets, cells werethawed on ice and re-suspended in Buffer A (50 mMTris pH 8.0, 500 mM NaCl, 10 mM Imidazole, 10%glycerol). Pefabloc-SC (Sigma) was then added as aprotease inhibitor. Re-suspended cells were then lysedby three times by French press at a pressure of10,000 psi. The lysed cells were then cleared by cen-trifugation, spinning at 120,000×g for 45 min at 4 °C.The resulting supernatant was brought up to a vol-ume of 50 mL and loaded onto a DynaLoop con-nected to a DuoFlow F10 FPLC system (Bio-Rad).The supernatant was then applied over two 5 mLBio-Scale Mini Profinity IMAC cartridges connectedin series (Bio-Rad). The columns were then washedwith 10 column volumes of Buffer A followed by 5column volumes of Buffer B (50 mM Tris pH 8.0,500 mM NaCl, 20 mM Imidazole, 10% glycerol). Pro-tein was then eluted off of the columns with 5 col-umn volumes of Buffer C (50 mM Tris pH 8.0,500 mM NaCl, 500 mM Imidazole, 10% glycerol).Peak fractions were collected and concentrated to avolume of ~ 1 mL using an Amicon-10KDa centrifu-gation column. The concentrated protein was loadedonto a 1 mL loop and applied over a HiPrep 16/60 Sepha-cryl S-300 HR size exclusion column (GE Healthcare).The column was washed and protein was then eluted offthe column in Buffer D (50 mM HEPES pH 7.5, 100 mMKCl, 10% glycerol). Peak fractions were checked by SDS-PAGE and then aliquot, flash frozen on liquid nitrogenand stored at − 80 °C.
In vitro ClpXP proteolysis assayReactions were carried out in 50 mM HEPES pH 7.6,50 mM KCl, 15 mM Mg acetate, 5 mM DTT, 5 mMATP, 10 mM creatine phosphate, and 0.1 μg/μl creat-ine kinase (Sigma). 500 ng of His-UgtP was incubatedat 37 °C in the presence of ClpP (6 μM) and ClpX(3 μM) in a 100 μl reaction mixture. Each reactionwas initiated by the addition of 5 mM ATP. At 0 and
30 or 45 min, samples of the reactions were takencontaining what corresponded to 125 ng His-UgtP atthe start of the reaction. Samples were then dilutedto 2.5 ng/μl with 2X sample buffer. 50 ng of His-UgtP was then loaded per lane on a 10% SDS-PAGE.After electrophoresis, proteins were transferred viaWestern blot to a PVDF membrane. Membranes wereblocked, then incubated with mouse monoclonalTHE™ His Tag (Genscript) at a 1:4000 dilution over-night at 4 °C. Control reactions with Spx and Thio-Hiswere performed as with His-UgtP except at a concentra-tion of 3 μM. At 0 and 60 min, 15 μl of the samples wascollected and analyzed on a 15% SDS-PAGE followed bystaining with Coomassie blue.
Fluorescence microscopy and cell length measurementsSamples were first fixed as previously described [55].Briefly, cells were fixed by treating with 2.575% parafor-maldehyde and 0.0008% glutaraldehyde. Fixed sampleswere permeabilized with 0.01 mg/mL lysozyme for twominutes, and then treated with 10 μg/mL wheat germagglutinin tetramethylrhodamine conjugate (WGA-Rhod, ThermoFisher #W849) in PBS to stain cell wallsepta for 10 min. 5 μL of prepared samples were appliedto 1% agarose in PBS pads, allowed to dry, and then cov-ered with a coverslip. Cells were imaged using a NikonTI-E microscope equipped with a Texas Red/mCherry/AlexaFluor 594 filter set for fluorescence microscopy(Chroma # 39010).Cell length was determined using Nikon Elements by
measuring the distance between the midpoints of adja-cent cell wall septa for cells stained with WGA-Rhod. T-test analysis was employed to test for significant differ-ences between conditions.
Lipid extractionBacterial cultures (1 L volumes) were centrifuged at15,000 x g for 1 min, decanted, and then resus-pended in 100 mL 100 mM sodium citrate pH 4.7.Cells were lysed using a French press. Lysates werecentrifuged at 12,000 g for 20 min to pellet mem-branes. Pellets were weighed and resuspended to0.4 g/mL in 100 mM sodium citrate pH 4.7. Metha-nol and chloroform were added to obtain a ratio of2:1:0.8 methanol:chloroform:sodium citrate. Mixturewas vortexed 30 s every 15 min for 2 h. Chloroformand sodium citrate were added to obtain a ratio of1:1:0.9 methanol:chloroform:sodium citrate. The mix-ture was vortexed for 1 min and centrifuged at 4000x g for 10 min. Bottom chloroform layer was trans-ferred to a new tube. Methanol and sodium citratewere added to obtain a ratio of 1:1:0.9 methanol:chloroform:sodium citrate. Mixture was vortexed for1 min and centrifuged at 4000 x g for 10 min.
Hill et al. BMC Microbiology (2018) 18:29 Page 11 of 14

Bottom chloroform layer was transferred to new tube andallowed to dry in fume hood. Dried lipids were weighedand resuspended in 1:1 methanol:chloroform to a finalconcentration of 600 mg/mL and stored at − 20 °C.
Lipid thin-layer chromatography and diglucosyl-diacylglycerolquantification140 mL chloroform and 60 mL methanol were added to aglass TLC development chamber. Placed filter paper intodeveloping solution, thoroughly wetted blot paper, andthen placed the paper along the chamber walls. A TLCplate (Analtech #p46021) was pre-run in developing solu-tion by placing it in the chamber, covering the chamberwith its glass lid, and allowing the solvent to run to thetop of the plate. The plate was dried at 100 °C for 10 min.Using a pencil, a line was drawn across the width of theplate approximately 1 cm from the bottom. Lipid samples(2 μL) were spotted along this line and allowed to dry.Samples were repeatedly spotted and allowed to dry 5additional times. Once the spots were dry, the plate wasplaced back into the chamber, the lid was placed on top,and the solvent was allowed to run to 1 cm from the topof the plate. The plate was taken out of the developmentchamber, the solvent line was quickly marked with pencil,and the plate was dried. The plate was then placed insidea polystyrene container with a few iodine crystals, sealed,and stained for 16 h with iodine gas. The stained platewas scanned to acquire images. The stained plate wasscanned to acquire images. ImageJ was used to quantifythe amount of DGD present, and another band (indicatedin Additional file 8: Figure S8) was used as a loading con-trol. T-test analysis was employed to test for significantdifferences between conditions.
Statistical analysisStatistical parameters and significance are reported inthe figures and the figure legends. Asterisks designatestatistical significance as: *, p < 0.05; **, p < 0.01; ***, p <0.001; ****, p < 0.0001. Statistical analysis was performedin GraphPad PRISM 6.
Additional files
Additional file 1: Figure S1. YFP-UgtP is degraded in minimal sorbitol;this file shows ectopically expressed YFP-UgtP cultured in nutrient-richand nutrient-poor media. (PDF 817 kb)
Additional file 2: Figure S2. Representative immunoblot for in vivoUgtP degradation experiment; this file shows an immunoblot of UgtP-Hisfrom cells with and without clpP, cultured in nutrient-poor media over a2-h period, after addition of spectinomycin. (PDF 967 kb)
Additional file 3: Figure S3. UgtP oligomer mutant has WT localizationand delays cell division in a ΔpgcA background; this file showsimmunofluorescence images of cells harboring either yfp-ugtP or yfp-ugtPOLI- in a UDP-glucose null background cultured in nutrient-rich media,and also shows cell length distributions for the previously mentionedstrains. (PDF 278 kb)
Additional file 4: Figure S4. ugtPHEX--his is expressed at the same levelas WT and UgtPHEX--His is stabilized in a ΔclpP background; this file showsqRT-PCR data for ugtP binding mutants compared to WT ugtP, and alsoshows semi-quantitative immunoblots for UgtP-His from the previouslymentioned strains cultured in both nutrient-rich and nutrient-poor media.(PDF 220 kb)
Additional file 5: Figure S5. A comparison of UDP-glucose moleculesper cell during growth in LB and minimal sorbitol; this file shows UDP-glucose molecules per cell from WT, ΔpgcA, and ΔugtP cells cultured innutrient-rich media (and WT in nutrient-poor media) as measured by LC-MS/MS. (PDF 112 kb)
Additional file 6: Figure S6. Positive and negative controls for theClpXP in vitro proteolysis assay; this file shows proteolysis of both aknown substrate for ClpXP (Spx), and a non-targeted protein (Thiore-doxin-His). (PDF 117 kb)
Additional file 7: Figure S7. UgtP concentration can be modulated inminimal sorbitol; this file shows semi-quantitative immunoblots for UgtP-His from strains containing either one inducible copy of ugtP-his, or oneinducible copy and one “native” copy of ugtP-his, cultured in nutrient-poor media. (PDF 175 kb)
Additional file 8: Figure S8. Representative TLC of membrane lipids,including diglucosyl-diacylglycerol; this file shows lipid extracts fromstrains producing variable amounts of UgtP cultured in nutrient-poormedia, separated on a TLC plate. (PDF 6249 kb)
Additional file 9: Supplemental Methods and References. Methods andreferences for the experiments performed in (Additional file 1: Figure S1,Additional file 2: Figure S2, Additional file 3: Figure S3, Additional file 4:Figure S4, Additional file 5: Figure S5, Additional file 6: Figure S6,Additional file 7: Figure S7, Additional file 8: Figure S8). (DOCX 23 kb)
Additional file 10: Table S1. Bacterial strains used in this study; this filecontains a table of strains, their genotypes, and their sources used in thisstudy. (DOCX 26 kb)
Additional file 11: Table S2. Oligonucleotide sequences used for qRT-PCR; this file contains a table of the oligonucleotide sequences used forqRT-PCR of various genes. (DOCX 53 kb)
AbbreviationsDGD: Diglucosyl-diacylglycerol; LB: Lysogeny Broth; LTA: Lipoteichoic Acid;Minimal Glucose: S750 + 1% Glucose; Minimal Glycerol: S750 + 1% Glycerol;Minimal Sorbitol: S750 + 1% Sorbitol; OPG: Osmoregulated Periplasmic Glucan
AcknowledgementsWe are indebted to Richard Losick, Peter Zuber, and David Dubnau for thekind gift of strains and reagents. We thank EKB, MAH, OJB, and RSM for theircritical reading. Finally, we thank all members of the Levin lab for thoughtfuldiscussions. This work was supported by a National Institutes of Health grant(NIH GM64671) to PAL.
FundingThis work was supported by a National Institutes of Health grant (NIHGM64671) to PAL. The funding agency had no role in design of this study,collection, analysis, and interpretation of data, nor writing of this manuscript.
Availability of data and methodsThe datasets used and/or analyzed during the current study are availablefrom the corresponding author on reasonable request.
Authors contributionsNH designed and performed all aspects of the experimentation exceptas noted below, analyzed data, and drafted the manuscript. JZ performed andanalyzed data for the in vivo UgtP-His proteolysis assay in (Fig. 3C), cellmeasurements and membrane lipid TLC in (Fig. 6 and Table 1), Westernblots of YFP-UgtP in (Additional file 1: Figure S1), Western blots to demonstratedifferences in UgtP-His expression in (Additional file 7: Figure S7). JZ alsodesigned the cell measurement experiment in (Fig. 6A and Table 1) andassisted in drafting the manuscript. PB performed, designed, and analyzed thein vitro His-UgtP proteolysis assay in (Fig. 5 and Additional file 6: Figure S6)including the purification of ClpXP and UgtP. PB also assisted in drafting
Hill et al. BMC Microbiology (2018) 18:29 Page 12 of 14

the manuscript. AC constructed the hexose/uracil/oligomerization mutantforms of ugtP used in (Fig. 4 and Additional file 4: Figure S4). PAL helped designexperiments and draft the manuscript. All authors read and approved the finalmanuscript.
Ethics approval and consent to participateNot Applicable.
Consent for publicationNot Applicable.
Competing interestsThe authors declare that they have no competing interests.
Publisher’s NoteSpringer Nature remains neutral with regard to jurisdictional claims inpublished maps and institutional affiliations.
Author details1Department of Biology, Washington University, St. Louis 63130, MO, USA.2Present address: Department of Molecular and Cell Biology, University ofCalifornia, Berkeley 94720, CA, USA. 3Present address: Department ofBacteriology, University of Wisconsin, Madison 53706, WI, USA. 4Presentaddress: Clinical Immunology and Bioanalysis, MedImmune LLC, South SanFrancisco 94080, CA, USA. 5Leukaemia & Blood Cancer Research Unit,University of Auckland, Private Bag 92019, Auckland 1142, New Zealand.
Received: 15 August 2017 Accepted: 8 February 2018
References1. Schaechter M, Maaløe O, Kjeldgaard NO. Dependency on medium and
temperature of cell size and chemical composition during balanced grownof Salmonella typhimurium. J Gen Microbiol. 1958;19:592–606.
2. Sargent MG. Control of cell length in Bacillus subtilis. J Bacteriol. 1975;123:7–19.
3. Pierucci O. Dimensions of Escherichia coli at various growth rates: model forenvelope growth. J Bacteriol. 1978;135:559–74.
4. Weart RB, Lee AH, Chien A-C, Haeusser DP, Hill NS, Levin PA. A metabolicsensor governing cell size in bacteria. Cell. 2007;130:335–47.
5. Hill NS, Buske PJ, Shi Y, Levin PA. A moonlighting enzyme links Escherichiacoli cell size with central metabolism. PLoS Genet. 2013;9:e1003663.
6. Vadia S, Levin PA. Growth rate and cell size: a re-examination of the growthlaw. Curr Opin Microbiol. 2015;24:96–103.
7. Potrykus K, Murphy H, Philippe N, Cashel M. ppGpp is the major source ofgrowth rate control in E. coli. Environ Microbiol. 2011;13:563–75.
8. Dalebroux ZD, Swanson MS. ppGpp: magic beyond RNA polymerase. NatRev Microbiol. 2012;10:203–12.
9. Ehrenberg M, Bremer H, Dennis PP. Medium-dependent control of thebacterial growth rate. Biochimie. 2013;95:643–58.
10. Gerth U, Kock H, Kusters I, Michalik S, Switzer RL, Hecker M. Clp-dependentproteolysis down-regulates central metabolic pathways in glucose-starvedBacillus subtilis. J Bacteriol. 2008;190:321–31.
11. Battesti A, Majdalani N, Gottesman S. The RpoS-mediated general stressresponse in Escherichia coli. Annu Rev Microbiol. 2011;65:189–213.
12. Price KD, Roels S, Losick R. A Bacillus subtilis gene encoding a protein similarto nucleotide sugar transferases influences cell shape and viability. JBacteriol. 1997;179:4959–61.
13. Kennedy EP, Rumley MK. Osmotic regulation of biosynthesis of membrane-derived oligosaccharides in Escherichia coli. J Bacteriol. 1988;170:2457–61.
14. Jorasch P, Wolter FP, Zahringer U, Heinz E. A UDP glucosyltransferase fromBacillus Subtilis successively transfers up to four glucose residues to 1,2-diacylglycerol: expression of ypfP in Escherichia coli and structural analysis ofits reaction products. Mol Microbiol. 1998;29:419–30.
15. Therisod H, Weissborn AC, Kennedy EP. An essential function for acyl carrierprotein in the biosynthesis of membrane-derived oligosaccharides ofEscherichia coli. P Natl Acad Sci USA. 1986;83:7236–40.
16. Percy MG, Gründling A. Lipoteichoic acid synthesis and function in gram-positive bacteria. Annu Rev Microbiol. 2014;68:81–100.
17. Reichmann NT, Piçarra Cassona C, Monteiro JM, Bottomley AL, Corrigan RM,Foster SJ, et al. Differential localization of LTA synthesis proteins and their
interaction with the cell division machinery in Staphylococcus aureus. MolMicrobiol. 2014;92:273–86.
18. Matias VRF, Beveridge TJ. Lipoteichoic acid is a major component of theBacillus subtilis periplasm. J Bacteriol American Society for Microbiology.2008;190:7414–8.
19. Lazarevic V, Soldo B, Medico N, Pooley H, Bron S, Karamata D. Bacillussubtilis Alpha-phosphoglucomutase is required for normal cell morphologyand biofilm formation. Appl Environ Microbiol. 2005;71:39–45.
20. Chien A-C, Zareh SKG, Wang YM, Levin PA. Changes in the oligomerizationpotential of the division inhibitor UgtP co-ordinate Bacillus subtilis cell sizewith nutrient availability. Mol Microbiol. 2012;86:594–610.
21. Weart RB, Levin PA. Growth rate-dependent regulation of medial FtsZ ringformation. J Bacteriol. 2003;185:2826–34.
22. Feucht A, Lucet I, Yudkin MD, Errington J. Cytological and biochemicalcharacterization of the FtsA cell division protein of Bacillus subtilis. MolMicrobiol. 2001;40:115–25.
23. Haeusser DP, Lee AH, Weart RB, Levin PA. ClpX inhibits FtsZ assembly in amanner that does not require its ATP hydrolysis-dependent chaperoneactivity. J Bacteriol. 2009;191:1986–91.
24. Weart RB, Nakano S, Lane BE, Zuber P, Levin PA. The ClpX chaperone modulatesassembly of the tubulin-like protein FtsZ. Mol Microbiol. 2005;57:238–49.
25. Baker TA, Sauer RT. ClpXP, an ATP-powered unfolding and protein-degradation machine. Biochim Biophys. 2012;1823:15–28.
26. Kress W, Maglica Z, Weber-Ban E. Clp chaperone-proteases: structure andfunction. Res Microbiol. 2009;160:618–28.
27. Camberg JL, Hoskins JR, Wickner S. ClpXP protease degrades thecytoskeletal protein, FtsZ, and modulates FtsZ polymer dynamics. P NatlAcad Sci USA. 2009;106:10614–9.
28. Botté C, Jeanneau C, Snajdrova L, Bastien O, Imberty A, Breton C, et al.Molecular modeling and site-directed mutagenesis of plant chloroplastmonogalactosyldiacylglycerol synthase reveal critical residues for activity. JBiol Chem. 2005;280:34691–701.
29. Gerth U, Kirstein J, Mostertz J, Waldminghaus T, Miethke M, Kock H, et al.Fine-tuning in regulation of Clp protein content in Bacillus subtilis. JBacteriol. 2004;186:179–91.
30. Nakano S, Zheng G, Nakano MM, Zuber P. Multiple pathways of Spx (YjbD)proteolysis in Bacillus subtilis. J Bacteriol. 2002;184:3664–70.
31. Turgay K, Hahn J, Burghoorn J, Dubnau D. Competence in Bacillus subtilis iscontrolled by regulated proteolysis of a transcription factor. EMBO J. 1998;17:6730–8.
32. Pan Q, Garsin DA, Losick R. Self-reinforcing activation of a cell-specifictranscription factor by proteolysis of an anti-sigma factor in B. subtilis. MolCell. 2001;8:873–83.
33. Zhou Y, Gottesman S, Hoskins JR, Maurizi MR, Wickner S. The RssB responseregulator directly targets sigma(S) for degradation by ClpXP. Genes Dev.2001;15:627–37.
34. Langklotz S, Narberhaus F. The Escherichia coli replication inhibitor CspD issubject to growth-regulated degradation by the Lon protease. MolMicrobiol. 2011;80:1313–25.
35. Schäkermann M, Langklotz S, Narberhaus F. FtsH-mediatedcoordination of lipopolysaccharide biosynthesis in Escherichia colicorrelates with the growth rate and the alarmone (p)ppGpp. JBacteriol. 2013;195(9):1912.
36. Buczek MS, Cardenas Arevalo AL, Janakiraman A. ClpXP and ClpAP controlthe Escherichia coli division protein ZapC by proteolysis. Microbiology. 2016;162:909–20.
37. Sauer RT, Baker TA. AAA+ proteases: ATP-fueled machines of proteindestruction. Annu Rev Biochem. 2011;80:587–612.
38. Elsholz AKW, Birk MS, Charpentier E, Turgay K. Functional diversity of AAA+protease complexes in Bacillus subtilis. Front Mol Biosci. 2017;4:44.
39. Kirstein J, Dougan DA, Gerth U, Hecker M, Turgay K. The tyrosine kinaseMcsB is a regulated adaptor protein for ClpCP. EMBO J. 2007;26:2061–70.
40. Persuh M, Mandic-Mulec I, Dubnau D. A MecA paralog, YpbH, binds ClpC,affecting both competence and sporulation. J Bacteriol. 2002;184:2310–3.
41. Schlothauer T, Mogk A, Dougan DA, Bukau B, Turgay K. MecA, an adaptorprotein necessary for ClpC chaperone activity. P Natl Acad Sci USA. 2003;100:2306–11.
42. Pan Q, Losick R. Unique degradation signal for ClpCP in Bacillus subtilis. JBacteriol. 2003;185:5275–8.
43. Wiegert T, Schumann W. SsrA-mediated tagging in Bacillus subtilis. JBacteriol. 2001;183:3885–9.
Hill et al. BMC Microbiology (2018) 18:29 Page 13 of 14

44. Salahudeen AA, Thompson JW, Ruiz JC, Ma H-W, Kinch LN, Li Q, et al. An E3ligase possessing an iron-responsive hemerythrin domain is a regulator ofiron homeostasis. Science. 2009;326:722–6.
45. Zhu J, Winans SC. The quorum-sensing transcriptional regulator TraRrequires its cognate signaling ligand for protein folding, protease resistance,and dimerization. P Natl Acad Sci USA. 2001;98:1507–12.
46. Vashisht AA, Zumbrennen KB, Huang X, Powers DN, Durazo A, Sun D, et al.Control of iron homeostasis by an iron-regulated ubiquitin ligase. Science.2009;326:718–21.
47. Hecker M. A proteomic view of cell physiology of Bacillus subtilis–bringingthe genome sequence to life. Adv Biochem Eng Biotechnol. 2003;83:57–92.
48. Perego M, Spiegelman GB, Hoch JA. Structure of the gene for the transitionstate regulator, abrB: regulator synthesis is controlled by the spo0Asporulation gene in Bacillus subtilis. Mol Microbiol. 1988;2:689–99.
49. Ireton K, Rudner DZ, Siranosian KJ, Grossman AD. Integration of multipledevelopmental signals in Bacillus subtilis through the Spo0A transcriptionfactor. Genes Dev. 1993;7:283–94.
50. Jaacks KJ, Healy J, Losick R, Grossman AD. Identification and characterizationof genes controlled by the sporulation-regulatory gene spo0H in Bacillussubtilis. J Bacteriol. 1989;171:4121–9.
51. Arjes HA, Lai B, Emelue E, Steinbach A, Levin PA. Mutations in the bacterialcell division protein FtsZ highlight the role of GTP binding and longitudinalsubunit interactions in assembly and function. BMC Microbiol. 2015;15:209.
52. Hill NS, Kadoya R, Chattoraj DK, Levin PA. Cell size and the initiation of DNAreplication in bacteria. PLoS Genet. 2012;8:e1002549.
53. Zhang X, Bremer H. Control of the Escherichia coli rrnB P1 promoterstrength by ppGpp. J Biol Chem. 1995;270:11181–9.
54. Pfaffl MW. A new mathematical model for relative quantification in real-timeRT-PCR. Nucleic Acids Res. 2001;29:e45.
55. Levin PA. Light Microscopy Techniques for Bacterial Cell Biology. In:Sansonetti PJ, Zychlinsky A, editors. Molecular Cellular Microbiology. 2002.pp. 115–32.
• We accept pre-submission inquiries
• Our selector tool helps you to find the most relevant journal
• We provide round the clock customer support
• Convenient online submission
• Thorough peer review
• Inclusion in PubMed and all major indexing services
• Maximum visibility for your research
Submit your manuscript atwww.biomedcentral.com/submit
Submit your next manuscript to BioMed Central and we will help you at every step:
Hill et al. BMC Microbiology (2018) 18:29 Page 14 of 14