a novel technique for simultaneous velocity and interface profile measurements on micro-structured...
TRANSCRIPT
Soft Matter
PAPER
Publ
ishe
d on
07
Janu
ary
2013
. Dow
nloa
ded
by C
arne
gie
Mel
lon
Uni
vers
ity o
n 26
/10/
2014
07:
43:2
2.
View Article OnlineView Journal | View Issue
aInstitut Lumiere Matiere, UMR5306 Univ
69622 Villeurbanne cedex, France. E-mail: gbSurface du Verre et Interfaces, UMR 125 CN
F-93303 Aubervilliers, Cedex, France
† Present address: Department of ChemKensington Campus, SW7 2AZ, London, U
Cite this: Soft Matter, 2013, 9, 2239
Received 1st August 2012Accepted 7th December 2012
DOI: 10.1039/c2sm26781k
www.rsc.org/softmatter
This journal is ª The Royal Society of
A novel technique for simultaneous velocity andinterface profile measurements on micro-structuredsurfaces
G. Bolognesi,†*a C. Cottin-Bizonne,a E. M. Guene,b J. Teisseireb and C. Pirata
We present a novel approach which allows simultaneous measurement of the velocity field and the
interface profile close to a composite liquid–gas and solid–gas interface. The proposed scheme is the
method of choice for the characterization of those flows where the velocity field is highly dependent on
the actual shape and position assumed by liquid–gas and liquid–solid interfaces. The new method is
based on the digital processing of microscopy images of a flow seeded with fluorescent passive tracers.
The relative position and the shape of both liquid–gas and liquid–solid interfaces can be determined
with a resolution of few tens of nanometers. The results for the liquid–solid interfaces are also
compared to an additional detection method we devised to accurately determine the absolute position
of the solid walls.
1 Introduction
Direct measurements of velocity elds in micrometer-sizeddevices have played a central role in understanding, analysing,developing and evaluating lab-on-a-chip systems and thephysical–chemical processes occurring therein. Accordingly, amanifold of methods for microscale ow visualization andcharacterization have been proposed in the last twenty years.1
Nevertheless, in certain kinds of ows the velocity eldmeasurements are not enough to fully capture the ow prop-erties and the determination of position and shape of liquid–solid and liquid–gas interfaces below the micrometric scale hasto be performed as well.
Examples of such systems are the at plate heat pipes(FPHPs), where liquid pockets ll the cavities of a micro-structured surface. FPHPs are microuidic chips designed forthermal management of electronic components.2 Such systemstransfer the heat by vaporization of the liquid and condensationof the vapor which take place in a capillary structure made ofmicrogrooves and meshes. The analysis of FPHPs requiresmonitoring of the shape and position of liquid–gas menisciwithin the cavities and a confocal microscopy-based technique3
has recently been presented to perform this task.Superhydrophobic surfaces (SHSs) are another remarkable
example of a two-phase system, where gas bubbles lie inside
ersite Lyon 1-CNRS, Universite de Lyon
RS/Saint-Gobain, 39, quai Lucien Lefranc,
istry, Imperial College London, SouthK.
Chemistry 2013
surface cavities (the so-called Cassie state). The presence of gaspockets entrapped by the surface roughness removes the no-slipconstraint at the channel wall, promoting the reduction of theliquid–solid friction.4 The lower the friction is, the higher is theaverage velocity of the liquid at the SHS interface. Such avelocity is proportional to the shear rate and the coefficient ofproportionality is called effective slip length, which quantiesthe friction reduction.
Several techniques have been proposed to measure theeffective slip length either directly or indirectly,5 but the majorissue of those measurements is that the slip length is highlydependent on both the solid wall position and the meniscusshape.6 As regards solid walls, the localization of uorescentcolloids stuck to the wall has been suggested as a possibledetection scheme.7 On the other hand, a few techniques havealso been introduced to measure the liquid–gas interfaceprole. Direct observations of menisci are performed througheither confocal microscopy8,9 or laser displacement measure-ments,10 while indirect measurements based on the elastic forceresponse of the system due to microbubble elasticity can beobtained with a dynamic surface force apparatus.11 However,none of those techniques has been used to simultaneouslymeasure the interface proles and the velocity eld close tothem. Nevertheless, the ow and the liquid–gas interfaces mayhighly affect each other and an ideal characterization of thesystem would necessarily require a technique capable ofmeasuring the velocity eld and, simultaneously, locating theliquid–gas and liquid–solid interfaces. Menisci can be veryunstable and they may assume quite different shapes (even forthe same sample), as they depend on several, oen uncon-trolled, parameters (e.g. local pressure of both liquid and gas,
Soft Matter, 2013, 9, 2239–2244 | 2239

Soft Matter Paper
Publ
ishe
d on
07
Janu
ary
2013
. Dow
nloa
ded
by C
arne
gie
Mel
lon
Uni
vers
ity o
n 26
/10/
2014
07:
43:2
2.
View Article Online
presence of contaminants and surface imperfections, etc.).Consequently, the measured velocity prole can be directlyrelated to the actual shape and position of the menisci only ifthose measurements are performed at the same time.
In this paper, we introduce a novel technique which tacklesthe problem of simultaneous measurements of velocity eldsand interface proles. The technique is based on digital pro-cessing of uorescencemicroscopy images of a ow seeded withuorescent passive tracers. Such a scheme allows the determi-nation of interface proles at both liquid–gas and liquid–solidboundaries next to micro-structured surfaces. The samemicroscopy images are then used to determine the velocity eldthroughout the channel via cross-correlation analysis. Theproof-of-concept is performed with a pressure-driven ow in amicrochannel, equipped with either a silicon surface withlongitudinal micro-grooves or a glass surface with ellipse-sha-ped pillars. The results at the liquid–solid boundaries arecompared to an additional new detection method which is alsobased on digital processing of the same uorescence micros-copy images. The effectiveness and the limitations of the pre-sented method are emphasised in the specic framework of sliplength measurement, while they can obviously be adapted toother situations.
2 Experimental section2.1 Experimental set-up
A micro-Particle Image Velocimetry12 (m-PIV) set-up is realizedwith an inverted optical microscope (Nikon Eclipse TE 2000-U),mounted on an isolated optical breadboard and tted with awater immersion microscope objective (�60 NA 1.2). A sche-matic view of the set-up is shown in Fig. 1. The light beam of aDPSS laser (Cni MLL532, 400 mW at 532 nm) is guided by amultimode ber to the acousto-optic-modulator AOM (AAOptoelectronics MT80). The microchannel is placed on an xystage and a ow control system (Fluigent MFCS-Flex) suppliesthe microchannel with a constant water ow. The axialdisplacement of the objective is performed via a stepper motordriven by an external controller (Marzhauser Tango Desktop).
Fig. 1 Scheme of the experimental set-up. The sample is evenly illuminated by aDPSS (green) laser, whose beam is modulated by an acousto-optic-modulator(AOM). The (red) fluorescent light emitted by the passive tracers is recorded by theCCD camera sensor. A filter prevents the laser light to reach the camera sensor.
2240 | Soft Matter, 2013, 9, 2239–2244
The uorescent light of the excited colloids is recorded using aCCD camera (Allied Vision Technologies), equipped with a 640� 480 sensor. The pixel size is 7.4 mm � 7.4 mm. To prevent thereected laser beam from reaching the camera sensor, a lter isplaced in front of the camera aperture. The microchannel islled with ultrapure Milli-Q water seeded with red uorescent0.3 mm diameter polystyrene microspheres (Thermo ScienticFluoro-Max), 0.02% in solid concentration. The channel inletand outlet are connected to the reservoirs of the ow controlsystem, across which a pressure difference of 5 mbar is main-tained. Triggering the laser and the AOM, the camera is exposedto the incoming light for 10 ms, whereas the camera frame rate is200 Hz.
2.2 Microuidic chips
In the following, a silicon micro-grooved surface and a glasssurface with ellipse-shaped pillars are considered. The siliconsuperhydrophobic surface is patterned with longitudinal micro-grooves, 16 mm in width and 50 mm in depth, evenly spaced by 16mm (Fig. 2). The pattern is transferred on a 60 mm � 20 mmsilicon slide via photolithography and plasma etching. Thesecond surface is fabricated via silica sol–gel nanoimprintlithography (SSGNIL). The process13 consists in transferringpatterns from a polydimethylsiloxane (PDMS) mould into adeformable material deposited on a glass substrate (silicacoating made by the sol–gel process). Patterns are ellipse-shapedpillars whose major and minor axes are 30 mm and 10 mm,respectively. The pillars are 10 mm in height and they are placedon a hexagonal grating with a 50 mm pitch in the directionparallel to the pillar major axes and a 25 mm pitch in theperpendicular direction. The details of the silica patterned layerfabrication are reported elsewhere. To promote the Cassie state,surfaces are rst oxidized by UV-ozone treatment then silanizedvia standard vapor deposition of 1H,1H,2H,2H-peruorooctyltri-chlorosilane; 97% (ABCR). For both patterned surfaces, tofabricate the rest of the channel, we spin-coated a 25.4 mm� 60mmmicroscope cover slip with 30 mm thick lm of PDMS (RTV-615). Subsequently, we engraved a 2 mm � 40 mm area in
Fig. 2 Three dimensional schematic view of the microchannel, fitted with thesilicon micro-grooved surface. The ultrapure water and the fluorescent colloidsflow in the direction parallel to the microgrooves, wherein air pockets aretrapped.
This journal is ª The Royal Society of Chemistry 2013

Paper Soft Matter
Publ
ishe
d on
07
Janu
ary
2013
. Dow
nloa
ded
by C
arne
gie
Mel
lon
Uni
vers
ity o
n 26
/10/
2014
07:
43:2
2.
View Article Online
the PDMS lm. The resulting high aspect-ratio transversecross-section of the channel (30 mm � 2 mm) makes theconnement effects on the uid ow negligible. Finally, thePDMS-coated cover slip and the micro-structured surfaces areclamped one against the other, via a custom Plexiglas clamp-ing device.14
Fig. 3 Experimental velocity profile (solid circles) fitted to a 1D Poiseuille profileplus the specular reflection at the solid wall (solid line). The vertical dashed linerepresents the position of the axis of symmetry (i.e. the reflective wall) for thebest-fit curve. In the inset, a picture shows the working principle of the reflection-based detection method.
2.3 Image capture and processing
The velocity measurements are performed via m-PIV cross-correlation analysis of several images recorded for each focalplane. The details of such an image processing are reportedelsewhere.9 The number N of images per plane, over which theaverage velocity prole is worked out, is chosen so that theBrownian motion component of the colloids can be neglected.Indeed, the Brownian velocity component of the particles,averaged on N frames, can be estimated to be Vb ¼ ffiffiffiffiffiffiffiffi
2Dtp
=ffiffiffiffiN
pt,
where D is the particle diffusion coefficient and t is the elapsedtime between two consecutive frames. If we assume that �Vb
should be less than 1% of the minimum detectable ow velocityVmin, we get N > 104� 2D/tVmin
2. For Vminx 30 mm s�1, it resultsN$ 3200. Accordingly, we choose N¼ 4000 for the scan close tothe surface and N ¼ 3200 in the bulk.
We introduce a reference coordinate system (see Fig. 2) withthe z coordinate parallel to the optical axis and positivelyoriented from the surface to the cover slip. The z axis origin isalways set at the liquid–solid interface. The y and x axes areparallel and transverse to the ow direction, respectively. Theaxial step of the objective position is 0.3 mm in the bulk and 0.1mmclose to the surface. Processing algorithms are implementedvia custom Matlab codes.
3 Interface detection
Here we discuss a novel technique which is able to recover theinterfaces' relative positions and shapes with a typical resolu-tion of tens of nanometers while simultaneously determiningthe velocity prole throughout the channel. First, to assess theaccuracy and precision of the method, we present a new solid–liquid interface detection algorithm, based on the reectiveproperty of the solid walls.
3.1 Reection-based detection of liquid–solid interface
We rst present the method we devised to determine withnanometer accuracy the absolute position of a at solid wallwithin a microuidic chip. The method takes advantage of asimple physical property of the wall material like the opticalreectivity. Such a detection scheme only requires an appro-priate post-processing of the recorded frames of excited uo-rescent colloids owing in the channel and, thus, no additionalhardware and modication with respect to a standard m-PIV set-up are needed. When the wall to be detected is made of areective material as silicon, the liquid–solid interface acts as amirror and, hence, both the real and virtual (reected) imagesof the uorescent colloids can be recorded. If the reective wallis at, the streamwise velocity prole along the channel depth,computed with both real and virtual colloids, is symmetric with
This journal is ª The Royal Society of Chemistry 2013
respect to the wall position. Fig. 3 shows an example of such aprole. For that case, the reective surface is a at silicon wall.To the best of our knowledge, the fact that a reective wall of amicrouidic channel acts as a mirror has never been exploitedin m-PIV measurements as an effective method to accuratelydetermine the position where uid velocity vanishes to zero.Measuring the velocity prole via m-PIV and determining theposition of the axis of symmetry (dashed line in Fig. 3) lead us toan accurate localization of the wall. More specically, such aposition is determined by tting the measured prole to theone-dimensional Poiseuille velocity prole plus the specularreection at the wall (z ¼ 0).15 In Fig. 3, the solid line representsthe best t while the dashed line shows the resulting wallposition.
3.2 Excluded volume-based detection of liquid–solid andliquid–gas interfaces
We now introduce a novel technique for the determination ofboth position and shape of liquid–solid and liquid–gas inter-faces. Particularly, the proposed algorithm determines the axialposition of the center of those colloids which owed closest tothose interfaces. In other words it locates the boundary of theexcluded-volume, namely the region next to the interfaceswhich is not accessible to the center of moving colloids. Thedistance between the actual interfaces and the excluded volumeboundary represents the thickness of the depletion layer. Weremark that the post-processing algorithm is applied to thesame uorescence microscopy images used for both thereection-based detection scheme and the m-PIV velocityanalysis.
Let us denote as In(x,y,z) the pixel intensity of the nth frame(out of N) recorded when the axial position of the focal plane isz. Splitting the frame in overlapping rectangular interrogationwindows S, we compute for each one of them an averageintensity dened as follows
Soft Matter, 2013, 9, 2239–2244 | 2241
Soft Matter Paper
Publ
ishe
d on
07
Janu
ary
2013
. Dow
nloa
ded
by C
arne
gie
Mel
lon
Uni
vers
ity o
n 26
/10/
2014
07:
43:2
2.
View Article Online
ISðzÞ ¼ 1
N
XN
n¼1
maxðx;yÞ˛S
Inðx; y; zÞ (1)
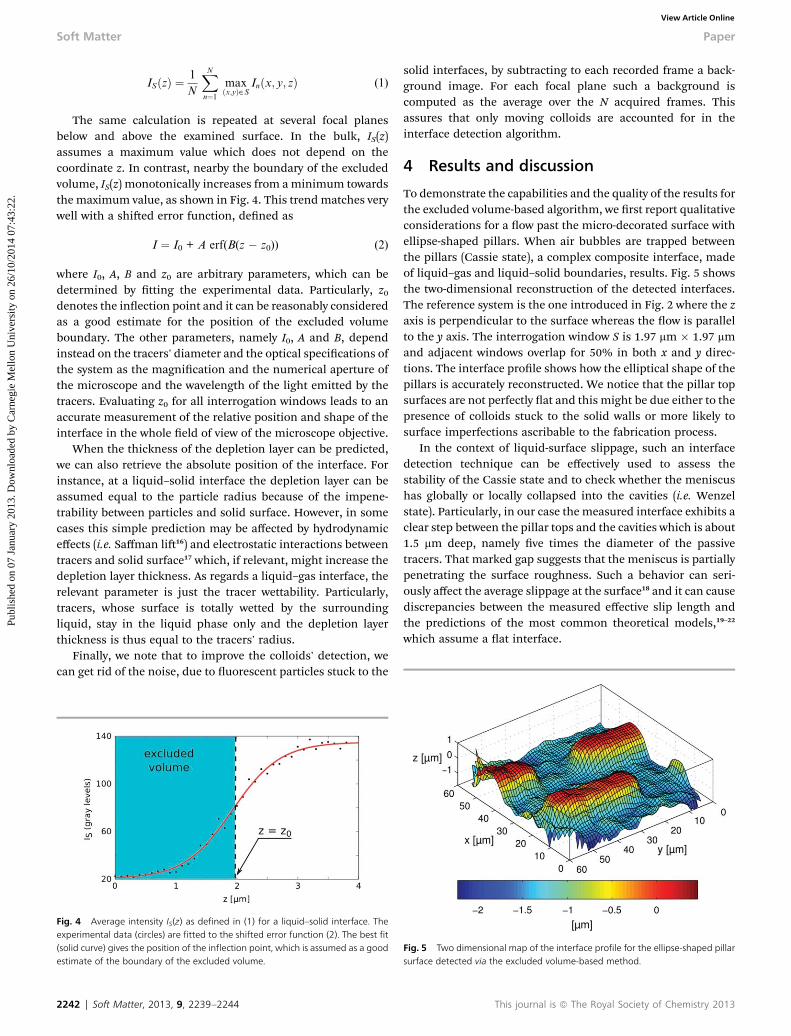
The same calculation is repeated at several focal planesbelow and above the examined surface. In the bulk, IS(z)assumes a maximum value which does not depend on thecoordinate z. In contrast, nearby the boundary of the excludedvolume, IS(z) monotonically increases from aminimum towardsthe maximum value, as shown in Fig. 4. This trend matches verywell with a shied error function, dened as
I ¼ I0 + A erf(B(z � z0)) (2)
where I0, A, B and z0 are arbitrary parameters, which can bedetermined by tting the experimental data. Particularly, z0denotes the inection point and it can be reasonably consideredas a good estimate for the position of the excluded volumeboundary. The other parameters, namely I0, A and B, dependinstead on the tracers' diameter and the optical specications ofthe system as the magnication and the numerical aperture ofthe microscope and the wavelength of the light emitted by thetracers. Evaluating z0 for all interrogation windows leads to anaccurate measurement of the relative position and shape of theinterface in the whole eld of view of the microscope objective.
When the thickness of the depletion layer can be predicted,we can also retrieve the absolute position of the interface. Forinstance, at a liquid–solid interface the depletion layer can beassumed equal to the particle radius because of the impene-trability between particles and solid surface. However, in somecases this simple prediction may be affected by hydrodynamiceffects (i.e. Saffman li16) and electrostatic interactions betweentracers and solid surface17 which, if relevant, might increase thedepletion layer thickness. As regards a liquid–gas interface, therelevant parameter is just the tracer wettability. Particularly,tracers, whose surface is totally wetted by the surroundingliquid, stay in the liquid phase only and the depletion layerthickness is thus equal to the tracers' radius.
Finally, we note that to improve the colloids' detection, wecan get rid of the noise, due to uorescent particles stuck to the
Fig. 4 Average intensity IS(z) as defined in (1) for a liquid–solid interface. Theexperimental data (circles) are fitted to the shifted error function (2). The best fit(solid curve) gives the position of the inflection point, which is assumed as a goodestimate of the boundary of the excluded volume.
2242 | Soft Matter, 2013, 9, 2239–2244
solid interfaces, by subtracting to each recorded frame a back-ground image. For each focal plane such a background iscomputed as the average over the N acquired frames. Thisassures that only moving colloids are accounted for in theinterface detection algorithm.
4 Results and discussion
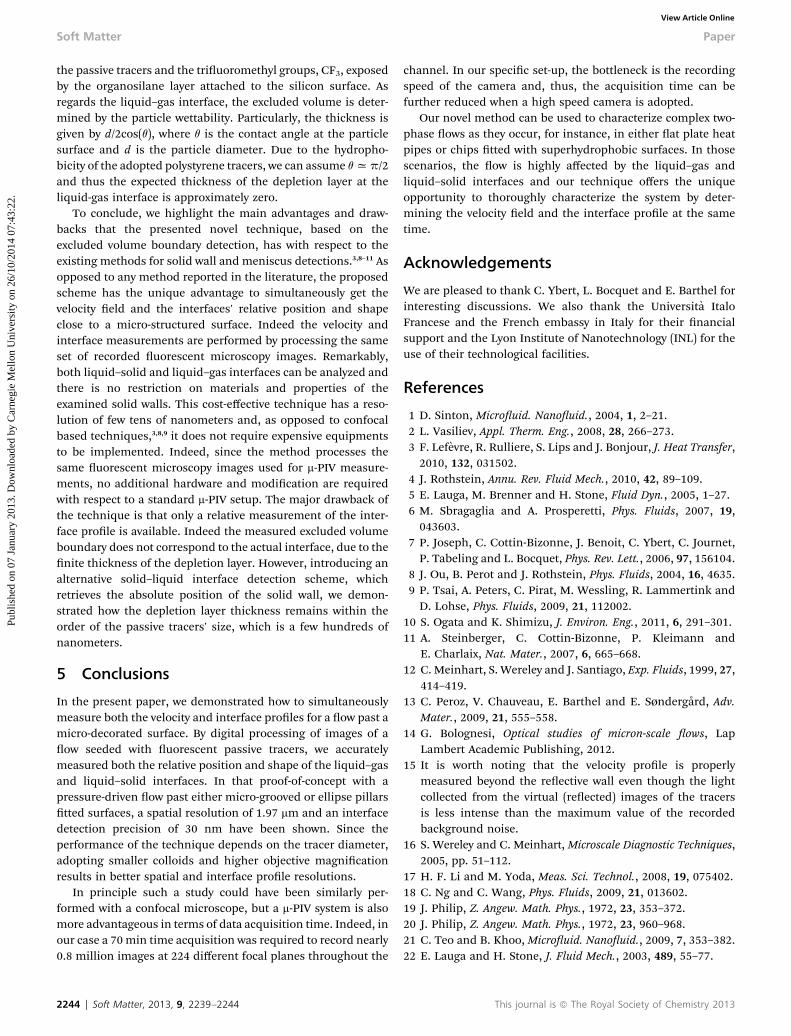
To demonstrate the capabilities and the quality of the results forthe excluded volume-based algorithm, we rst report qualitativeconsiderations for a ow past the micro-decorated surface withellipse-shaped pillars. When air bubbles are trapped betweenthe pillars (Cassie state), a complex composite interface, madeof liquid–gas and liquid–solid boundaries, results. Fig. 5 showsthe two-dimensional reconstruction of the detected interfaces.The reference system is the one introduced in Fig. 2 where the zaxis is perpendicular to the surface whereas the ow is parallelto the y axis. The interrogation window S is 1.97 mm � 1.97 mmand adjacent windows overlap for 50% in both x and y direc-tions. The interface prole shows how the elliptical shape of thepillars is accurately reconstructed. We notice that the pillar topsurfaces are not perfectly at and this might be due either to thepresence of colloids stuck to the solid walls or more likely tosurface imperfections ascribable to the fabrication process.
In the context of liquid-surface slippage, such an interfacedetection technique can be effectively used to assess thestability of the Cassie state and to check whether the meniscushas globally or locally collapsed into the cavities (i.e. Wenzelstate). Particularly, in our case the measured interface exhibits aclear step between the pillar tops and the cavities which is about1.5 mm deep, namely ve times the diameter of the passivetracers. That marked gap suggests that the meniscus is partiallypenetrating the surface roughness. Such a behavior can seri-ously affect the average slippage at the surface18 and it can causediscrepancies between the measured effective slip length andthe predictions of the most common theoretical models,19–22
which assume a at interface.
Fig. 5 Two dimensional map of the interface profile for the ellipse-shaped pillarsurface detected via the excluded volume-based method.
This journal is ª The Royal Society of Chemistry 2013

Paper Soft Matter
Publ
ishe
d on
07
Janu
ary
2013
. Dow
nloa
ded
by C
arne
gie
Mel
lon
Uni
vers
ity o
n 26
/10/
2014
07:
43:2
2.
View Article Online
The same analysis is conducted for the siliconmicro-groovedsurface. Thanks to the reective ability of silicon, in addition tothe excluded-volume based method we use the reection-basedmethod to determine the actual position of the liquid–solidinterface. We then compare the results of the two techniques. Atwo-dimensional map of the excluded volume boundary isshown in Fig. 6a. Again, the solid–liquid interfaces are not atand the circular spots, which are as large as the particle diam-eter (i.e. 300 nm), testify that the method resolution is goodenough to detect colloids stuck to the solid wall. The interro-gation window size and overlap are the same as the previousanalysis. As reported in Fig. 2, the colloids are owing parallel tothe grooves' axes and the ow is invariant along that direction(namely, y axis). Consequently, we can work out anew theexcluded volume boundary and this time the interrogationwindows have been extended to the whole frame size in the ydirection (namely, 59.2 mm). The resulting interface prole isreported in Fig. 6b with solid circles. For comparison, thenominal size of the passive tracers is represented by the largesolid circle in the center of the same gure. As it occurs forthe ellipse-shaped pillar surface, a at meniscus is slightly
Fig. 6 Interface detection on the silicon micro-grooved surface. (a) Two-dimensional map of the interface profile obtained via the excluded volume-baseddetection and a scanning electroscope microscopy image of the patternedsurface (inset). (b) Interface profiles along the transverse direction x, determinedwith the excluded volume-based (solid circles) and the reflection-based algo-rithms (empty circles). The error bars are within the symbols' size.
This journal is ª The Royal Society of Chemistry 2013
penetrating the micro-grooves. The precision of the method,given by the calculated uncertainties in the z0 parameter of (2),is about 30 nm, namely one tenth of the particle diameter.
In order to apply the reection-based method at the liquid–solid interface, we rst measure the streamwise velocity prolesalong the channel depth. The interrogation window used for them-PIV cross-correlation analysis is 3.94 mm � 7.87 mm, whereasthe overlap is 50% in both directions. Fig. 7 shows a typical m-PIV velocity eld on a plane of a few microns distance from themicro-grooved surface. Such a eld has been obtained from thesame images used for the interface detection in Fig. 6. Thevelocity proles, similar to the one shown in Fig. 3, are thenanalyzed and the resulting liquid–solid interface prole isreported with empty circles in Fig. 6b. It is worth noting that theposition of the reective surface can be worked out only at thosepoints corresponding to interrogation windows which lieentirely above the solid–liquid interfaces. Indeed, if the inter-rogation windows correspond to the liquid–gas interface or liein between, the assumption of a at reective wall is no longervalid. The t uncertainty of the wall position parameter is about10 nm, which reects the precision and accuracy of the detec-tion algorithm.
As shown in Fig. 6b, the interface proles detected with thetwo techniques are in very good agreement. At the liquid–solidinterfaces, the mean thickness of the depletion layer can beestimated as the average distance between the solid and emptycircles, which is about 440 nm. In our case, the particle deple-tion at the solid surface is mainly due to the impenetrability ofthe moving tracers with the solid surface or the possible tracersstuck to it. Other possible phenomena which generally affectthe depletion layer are the hydrodynamic Saffman li16 and theelectrostatic interactions between particles and solid surfaces.17
However, in our experiments those phenomena do not play asignicant role. Indeed, due to the weak velocity gradient closeto the surface, the Saffman li velocity is estimated to be lessthan 10�5 of the streamwise local velocity. We can also neglectany electrostatic effect because of the weak interaction between
Fig. 7 Velocity field measured at a focal plane of a few microns distance fromthe micro-grooved surface. The dashed lines represent the boundaries betweenthe liquid–gas and liquid–solid interfaces.
Soft Matter, 2013, 9, 2239–2244 | 2243
Soft Matter Paper
Publ
ishe
d on
07
Janu
ary
2013
. Dow
nloa
ded
by C
arne
gie
Mel
lon
Uni
vers
ity o
n 26
/10/
2014
07:
43:2
2.
View Article Online
the passive tracers and the triuoromethyl groups, CF3, exposedby the organosilane layer attached to the silicon surface. Asregards the liquid–gas interface, the excluded volume is deter-mined by the particle wettability. Particularly, the thickness isgiven by d/2cos(q), where q is the contact angle at the particlesurface and d is the particle diameter. Due to the hydropho-bicity of the adopted polystyrene tracers, we can assume qxp/2and thus the expected thickness of the depletion layer at theliquid-gas interface is approximately zero.
To conclude, we highlight the main advantages and draw-backs that the presented novel technique, based on theexcluded volume boundary detection, has with respect to theexisting methods for solid wall and meniscus detections.3,8–11 Asopposed to any method reported in the literature, the proposedscheme has the unique advantage to simultaneously get thevelocity eld and the interfaces' relative position and shapeclose to a micro-structured surface. Indeed the velocity andinterface measurements are performed by processing the sameset of recorded uorescent microscopy images. Remarkably,both liquid–solid and liquid–gas interfaces can be analyzed andthere is no restriction on materials and properties of theexamined solid walls. This cost-effective technique has a reso-lution of few tens of nanometers and, as opposed to confocalbased techniques,3,8,9 it does not require expensive equipmentsto be implemented. Indeed, since the method processes thesame uorescent microscopy images used for m-PIV measure-ments, no additional hardware and modication are requiredwith respect to a standard m-PIV setup. The major drawback ofthe technique is that only a relative measurement of the inter-face prole is available. Indeed the measured excluded volumeboundary does not correspond to the actual interface, due to thenite thickness of the depletion layer. However, introducing analternative solid–liquid interface detection scheme, whichretrieves the absolute position of the solid wall, we demon-strated how the depletion layer thickness remains within theorder of the passive tracers' size, which is a few hundreds ofnanometers.
5 Conclusions
In the present paper, we demonstrated how to simultaneouslymeasure both the velocity and interface proles for a ow past amicro-decorated surface. By digital processing of images of aow seeded with uorescent passive tracers, we accuratelymeasured both the relative position and shape of the liquid–gasand liquid–solid interfaces. In that proof-of-concept with apressure-driven ow past either micro-grooved or ellipse pillarstted surfaces, a spatial resolution of 1.97 mm and an interfacedetection precision of 30 nm have been shown. Since theperformance of the technique depends on the tracer diameter,adopting smaller colloids and higher objective magnicationresults in better spatial and interface prole resolutions.
In principle such a study could have been similarly per-formed with a confocal microscope, but a m-PIV system is alsomore advantageous in terms of data acquisition time. Indeed, inour case a 70 min time acquisition was required to record nearly0.8 million images at 224 different focal planes throughout the
2244 | Soft Matter, 2013, 9, 2239–2244
channel. In our specic set-up, the bottleneck is the recordingspeed of the camera and, thus, the acquisition time can befurther reduced when a high speed camera is adopted.
Our novel method can be used to characterize complex two-phase ows as they occur, for instance, in either at plate heatpipes or chips tted with superhydrophobic surfaces. In thosescenarios, the ow is highly affected by the liquid–gas andliquid–solid interfaces and our technique offers the uniqueopportunity to thoroughly characterize the system by deter-mining the velocity eld and the interface prole at the sametime.
Acknowledgements
We are pleased to thank C. Ybert, L. Bocquet and E. Barthel forinteresting discussions. We also thank the Universita ItaloFrancese and the French embassy in Italy for their nancialsupport and the Lyon Institute of Nanotechnology (INL) for theuse of their technological facilities.
References
1 D. Sinton, Microuid. Nanouid., 2004, 1, 2–21.2 L. Vasiliev, Appl. Therm. Eng., 2008, 28, 266–273.3 F. Lefevre, R. Rulliere, S. Lips and J. Bonjour, J. Heat Transfer,2010, 132, 031502.
4 J. Rothstein, Annu. Rev. Fluid Mech., 2010, 42, 89–109.5 E. Lauga, M. Brenner and H. Stone, Fluid Dyn., 2005, 1–27.6 M. Sbragaglia and A. Prosperetti, Phys. Fluids, 2007, 19,043603.
7 P. Joseph, C. Cottin-Bizonne, J. Benoit, C. Ybert, C. Journet,P. Tabeling and L. Bocquet, Phys. Rev. Lett., 2006, 97, 156104.
8 J. Ou, B. Perot and J. Rothstein, Phys. Fluids, 2004, 16, 4635.9 P. Tsai, A. Peters, C. Pirat, M. Wessling, R. Lammertink andD. Lohse, Phys. Fluids, 2009, 21, 112002.
10 S. Ogata and K. Shimizu, J. Environ. Eng., 2011, 6, 291–301.11 A. Steinberger, C. Cottin-Bizonne, P. Kleimann and
E. Charlaix, Nat. Mater., 2007, 6, 665–668.12 C. Meinhart, S. Wereley and J. Santiago, Exp. Fluids, 1999, 27,
414–419.13 C. Peroz, V. Chauveau, E. Barthel and E. Søndergard, Adv.
Mater., 2009, 21, 555–558.14 G. Bolognesi, Optical studies of micron-scale ows, Lap
Lambert Academic Publishing, 2012.15 It is worth noting that the velocity prole is properly
measured beyond the reective wall even though the lightcollected from the virtual (reected) images of the tracersis less intense than the maximum value of the recordedbackground noise.
16 S. Wereley and C. Meinhart, Microscale Diagnostic Techniques,2005, pp. 51–112.
17 H. F. Li and M. Yoda, Meas. Sci. Technol., 2008, 19, 075402.18 C. Ng and C. Wang, Phys. Fluids, 2009, 21, 013602.19 J. Philip, Z. Angew. Math. Phys., 1972, 23, 353–372.20 J. Philip, Z. Angew. Math. Phys., 1972, 23, 960–968.21 C. Teo and B. Khoo, Microuid. Nanouid., 2009, 7, 353–382.22 E. Lauga and H. Stone, J. Fluid Mech., 2003, 489, 55–77.
This journal is ª The Royal Society of Chemistry 2013