a novel model for comparing peak ground acceleration ... · a novel model for comparing peak ground...
TRANSCRIPT
International Journal of Scientific and Research Publications, Volume 8, Issue 9, September 2018 191
ISSN 2250-3153
http://dx.doi.org/10.29322/IJSRP.8.9.2018.p8127 www.ijsrp.org
A novel model for comparing Peak Ground Acceleration
derived from three attenuation laws using an integrated
GIS technique in Sabah area, Malaysia
Ratiranjan Jena, Biswajeet Pradhan
* Centre for Advanced Modelling and Geospatial Information Systems (CAMGIS),
Faculty of Engineering and IT, University of Technology Sydney, NSW 2007, Australia
DOI: 10.29322/IJSRP.8.9.2018.p8127
http://dx.doi.org/10.29322/IJSRP.8.9.2018.p8127
Abstract- Ninety percent of major earthquakes of the world
directly indicating the sources of subduction and collision zones
with shallow, intermediate, and deep focus earthquakes. The
state of Sabah not indicating a high seismic risk zone and not
directly associated with the Ring of fire. Nevertheless, it is
positive towards seismic risk as the state experienced more than
65 earthquakes. However, no attention of researchers on
comparative analysis of PGA map recorded in literature.
Therefore, this study conducted; 1) to analyze the earthquake
hazard and active tectonics of Sabah using PGA map derived
from three methods and; 2) to understand the intersection of
faults that can create isoseismic elongation. More than 90% of
earthquakes are shallow and focused at a hypo-central distance of
(0 ~ 100) km as resulted from this research. Therefore, Sabah
had been experienced a highest magnitude of ~6.3, which can
create the maximum PGA values of ~ (0.075, 0.06 and 0.08)
based on three different attenuation equations proposed in this
study. These earthquakes can produce a maximum intensity of
(MMI~7) that is derived from the resulted PGA values. The
study on active tectonics explains about the major 12 active
faults and their intersection relationship. Therefore, this whole
study has been conducted based on three attenuation relation to
find out the best method for preparing the PGA map and the
stereo net plotting using an integrated GIS technique.
Index Terms- Earthquake; PGA; attenuation model; active
tectonics; GIS
I. INTRODUCTION
he generation of seismic waves are due to earthquakes that
can be resulted from the fault movement or from any other
sources. There are many ways to measure various earthquake
aspects. However, magnitude is the most common one that has
been used for size measurement. There are many scales used for
the magnitude measurement out of which, four magnitude scales
popularly used to calculate magnitude that are globally accepted
such as; Mb, Ms, Ml and Mw. Because of the limitations of all
three-magnitude scales (ML, Mb, and Ms) more uniformly
applicable magnitude scale, known as the moment magnitude
or Mw was developed. Nevertheless, Mw is mostly used in
various countries to find out the exact magnitude of an
earthquake. In general, damages to buildings are depends upon
PGA (Peak ground acceleration) and PGV (Peak ground
velocity). Therefore, it has been recognized that the frequency of
ground motion significantly depends on the characteristics of
lithology of the site (Bazzurro and Cornell, 2004; Borcherdt,
1994).
Many scientists and researchers have investigated from
various perspectives about the problem of amplification of
ground motions by using probabilistic approaches (Lee et al.,
1998; Tsai, 2000). Seismic amplification due to ground motion is
the important and fixed problem can be found in every
seismically active zones. Therefore, equations of ground-motion
prediction has been developed for the classification of sites
(Fukushima et al., 2007). Campbell found that the intensities
resulting from reverse faults are more than that of normal and
strike slip faults (Dowrick 1992; 1999). (Chavez & Presttley,
1985) proposed the Mo Versus Ml relationships for the (1980)
Mamoth Lakes, California Earthquake as a base for conversion
of magnitudes. However, It is described that the body waves
originally contributes the seismic damage and ground
amplification resulted by multi reflection formed due to SH-wave
(Von thun et al., 1988; Sato et al., 2004). For the soil
classification, the important parameter is the average shear
velocity on the top 30 m of the ground surface (Barani et al.,
2008; Akkar and Bommer 2007; Choi and Stewart 2005).
Therefore, due to loose sedimentary deposits shear waves
amplification happens, that causes the strong ground motion.
Malaysia is a country coming under low seismic zone.
However, in the state of Sabah, local earthquakes can be found in
various parts originated from large local faults. It was reported
by USGS (US geological survey) that Sabah had experienced
some earthquakes with highest magnitude of 6.5 on a Richter
scale. Malaysia is located on a stable block called Sundaland and
that is the southern edge of the major Eurasian plate (Simons et
al., 2007). Continental collision between Indian subcontinent and
Eurasian plate genuinely affecting the block (Simons et al.,
2007). However, this block includes not only Vietnam, Thailand
and Malaysia but also the Sunda shelf, Borneo, Sumatra and
Jawa. The major faults that can be found in western Sabah
(MOSTI, 2009) are mostly responsible for high magnitude of
T
International Journal of Scientific and Research Publications, Volume 8, Issue 9, September 2018 192
ISSN 2250-3153
http://dx.doi.org/10.29322/IJSRP.8.9.2018.p8127 www.ijsrp.org
Recent studies have shown that earthquakes in Ranau area are
attributed to the two intersecting faults i.e. Mensaban and Lobou-
Lobou (Mohammed 2012). These fault zones are active as an
evidence from past earthquakes and ground deformation has
resulted in extensive damage to infrastructures in this area,
specifically to schools and teachers quarters (Mohammed 2012).
Peak ground acceleration (PGA) is defined as the
maximum ground acceleration that occurred during earthquake
shaking at a location. Therefore, this is the big problem in Sabah
to categorize the site based on the ground motions and there is no
comprehensive analytic model for PGA map preparation and
comparison. Therefore, we proposed a novel model to choose the
best method for the PGA mapping that could provide good
quality results. The designed model is also able to model the fault
plane solution of large regional faults of Sabah.
In this study, we have ensemble various attributes to investigate
ground motion from the probabilistic point of view. Our study
focusing on the PGA map preparation for the Sabah.
Nevertheless, our proposed method is to make an effective
comparison between various attenuation models to derive the
PGA map. This model tests three global attenuation models for
PGA mapping. Comparative assessment of the PGA mapping is
reliable and effective to find out the accuracy, quality of PGA
maps and to understand the strength, limitations of all the
models. The aim of this research is to identify the best model for
PGA mapping and the focal mechanism analysis in Sabah.
II OBJECTIVES
•Graphical investigation of events to find out the relationship
between depth, distance and magnitude.
•To develop PGA map according to three attenuation laws and
comparative analysis.
•To execute MMI calculation from the PGA values resulting
from the three attenuation laws.
•To analyze active fault mechanism and tectonics from fault data
using stereo net and beach ball diagram.
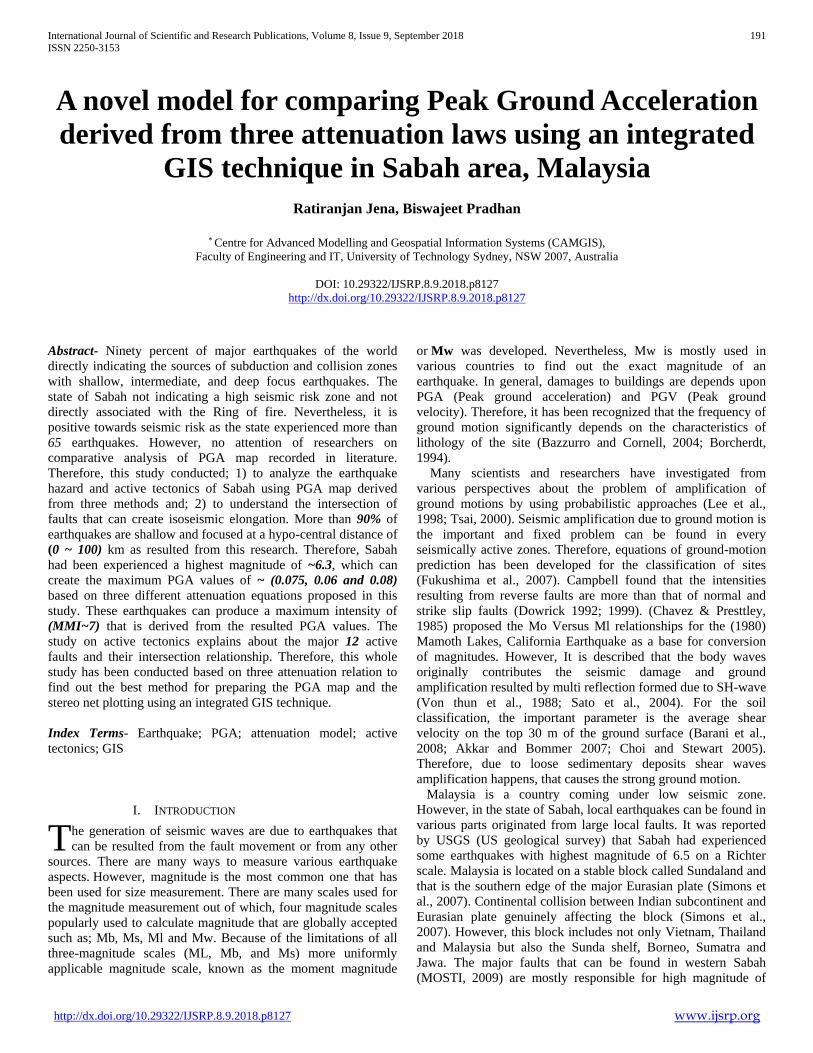
III. STUDY AREA
Sabah is located in the north of the isle of Borneo. In Sabah,
between Ranau and Mount Kinabalu there are at least two active
regional fault zones exist that intersect each other. Sabah of
Malaysia has experienced more than 65 earthquakes with the
highest magnitude of 6.3. The state of Sabah is the highly
hazardous region for earthquakes as compared to other parts of
the country. It is lying at a lat. and long. of 40 to 70 and 1150 to
1200, respectively. The tectonics of Sabah pointed out that
variety of faults and a large number of lineaments, which can be
found in different parts of the state. However, not all the local
faults that can be found in Sabah are active. Nevertheless, 12
major and large active faults can be found in the hilly regions
that are intersecting to each other. Various types of lithological
soils and rocks such as volcanic sediments, basin sediments,
limestones, sandstones, philitic rocks, gneiss and granites
characterize the study area.
Figure 1. Represents the study area of Sabah, Malaysia
International Journal of Scientific and Research Publications, Volume 8, Issue 9, September 2018 193
ISSN 2250-3153
http://dx.doi.org/10.29322/IJSRP.8.9.2018.p8127 www.ijsrp.org
IV. MATERIALS AND METHOD
Earthquake data has been collected from the USGS (US
geological survey) and ISC (International seismological center)
in a proper way. Geological data has been collected from the
geological map published in the journals. Firstly, data were
arranged in a proper scientific manner in excel sheet. In next
step, various calculations has been outperformed to apply in three
attenuation models. Those earthquakes with magnitude below 3
were not considered for the PGA calculation. Because low
magnitude earthquakes cannot shake the ground through which,
destruction can happen. PGA map can be prepared by using the
designed methodology as well as the comparative analysis can be
outperformed. The proposed methodology inclusively used three
attenuation equations. The distance (D) can also be calculated to
apply in attenuation models for PGA calculations. Therefore, D
value can be calculated by the formula;
D= (E^2+7.3^2) ^0.5 Eq (1)
Where, E = Epicentral distance
M = Earthquake Magnitude
Table 1. Types of attenuation models used for PGA analysis.
ID Source Laws
1 Joyner &
Boore-1981
10^(0.249*M-Log(D)-0.00255*D-
1.02, D=(E^2+7.3^2)^0.5
2 Campbell- 1981 0.0185*EXP(1.28*M)*D^(-1.75),
D=E+0.147*EXP(0.732*M)
3 Fukushima &
Tanaka- 1990
(10^(0.41*M-
LOG10(R+0.032*10^(0.41*M))-
0.0034*R+1.30))/980
The estimation of (PGA) peak ground acceleration by using the
event magnitude, source-to-site distance, environment and
tectonic sources will be reliable. Various types of attenuation
relationships are developed for the major research of seismic
hazard analysis. Such relationships have been proposed as well
as the comprehensive reviews also been published in peer
reviewed journals (Boore and Joyner (1982), Campbell (1985),
Joyner and Boore (1988), Abrahamson and Letihiser (1989),
Fukushima and Tanaka (1990)). Most of them are well developed
by using various regional and worldwide data acquired through
the arrays of strong motion. We applied the general equation of
regression models proposed by Campbell (1985), Joyner and
Boore (1988) and Fukushima and Tanaka (1990).
The MMI (Modified Mercali Intensity) can be calculated by
using the formula,
𝑀𝑀𝐼 = 1/0.3 ∗ (𝑙𝑜𝑔10 (𝑃𝐺𝐴 ∗ 980) − 0.014 Eq (2)
Where PGA unit is G.
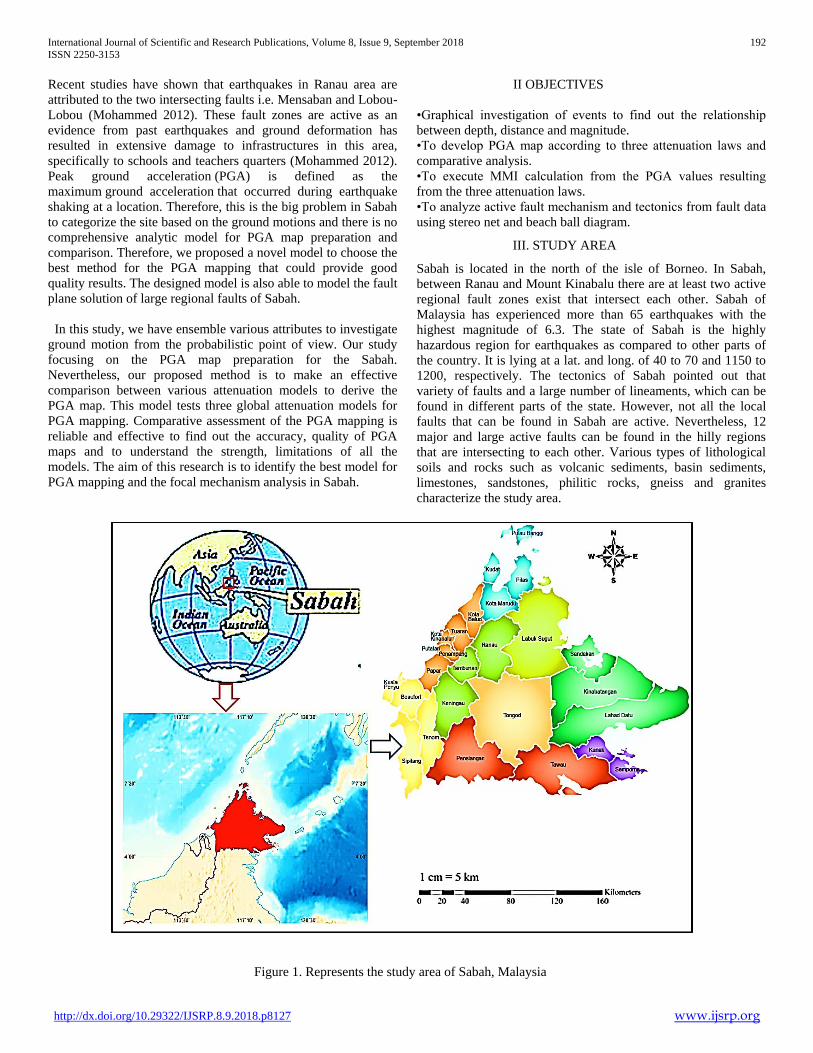
It is feasible to understand the changes in values of MMI
resulting from three attenuation models. The whole process has
been working out as per the designed methodological flowchart.
In the first step, graphical investigation of various attributes of
earthquakes need to perform. In next step, by using the
attenuation laws, PGA and MMI need to be calculated. From
there, PGA density map can be prepared. By using the geological
map, different lithological units have been extracted and assigned
factor values to each units. Developing the amplification factor
map from geological map and amplification values are also
performed. By multiplying the amplification factor map with the
PGA density map, the PGA map can be derived. In next step,
using the data of active faults and stereo net the fault plane
mechanism can be understood and types of faults can be
identified.
Figure 2 represents the overall methodological flowchart of the study.

International Journal of Scientific and Research Publications, Volume 8, Issue 9, September 2018 194
ISSN 2250-3153
http://dx.doi.org/10.29322/IJSRP.8.9.2018.p8127 www.ijsrp.org
V. RESULT AND DISCUSSION
The earthquakes experienced in Sabah, Malaysia recorded by the
three seismic stations are resulted because of local active faults.
The magnitude of all the earthquakes were recorded in Mb.
However, it is not effective and good magnitude to estimate the
size of earthquakes. Nevertheless, Mw is the moment magnitude,
which is much reliable to estimate the size of earthquakes.
Therefore, conversion of Mb to Mw is important to find out the
changes in magnitude value. Because it is inclusively, evaluate
the values based on the fault length, depth and slip. The model
derived between magnitude and depth explains that more than
90% of earthquakes experienced in Sabah are shallow focus
earthquakes and these earthquakes are happening at a depth of 0
to 60 kilometer. Nevertheless, in this area very less intermediate
or deep focus earthquakes have been experienced. The second
model clearly shows that most of the earthquakes happening at a
particular hypocentral distance of 0-200 km. Therefore, very less
earthquakes happened at a distance of approximately 100 km
from the site.
Figure 3 Graphical relationship between various attributes of earthquakes.
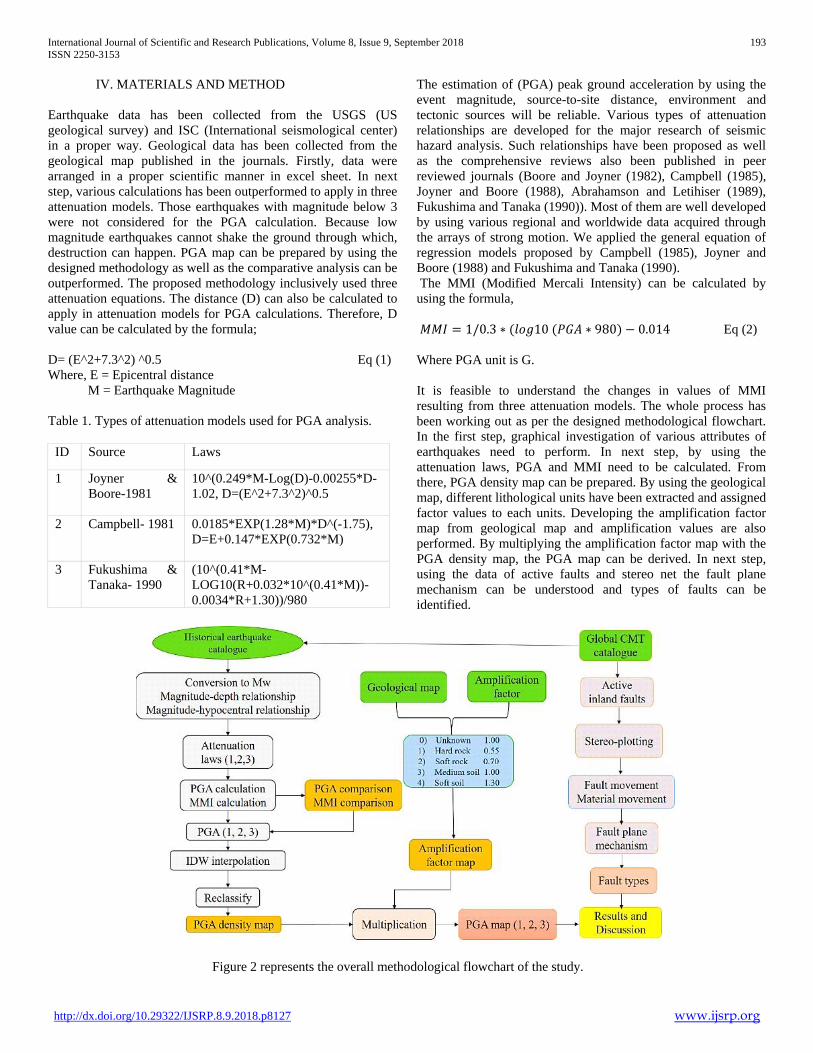
A. PGA calculation and comparison
As we know, the applicability of the distance to Sabah from the
surrounding seismic sources as well as the events magnitude and
the depth information for the PGA calculation. Therefore, it
possible to make an estimation of the Peak Ground Acceleration
of rocks in Sabah as a result of these events. Generally, Input
parameters for the earthquake scenario are location, depth,
magnitude and occurrence time. The relationship between PGA,
epicentral or hypocentral distance and magnitude can be
estimated by using an attenuation function. In the RADIUS
method, PGA can be calculated using three attenuation formulas:
Joyner & Boore (1981), Campbell (1981) or Fukushima &
Tanaka (1990). All the results are presented in the figure 4.
All these three models have been compared by plotting in a
single model, which clearly explains that there is a huge
difference between series one and the series two. At a particular
time period, these two methods developed but in between these
two methods, the series one is much better for the PGA analysis.
Series three can be found in between the series one and two.
However, it follows other two attenuation series. Therefore, third
method is also effective for the preparation of PGA map.
3.5
5.5
3.5 4.5 5.5 6.5
Mw
Mb
Series1
Series2
Series3
Series4
0
1
2
3
4
5
6
7
0 50 100
MA
GN
ITU
DE
DEPTH
Series1
0
1
2
3
4
5
6
7
0 100 200 300
MA
GN
ITU
DE
HYPOCENTRAL DISTANCE
Series1
International Journal of Scientific and Research Publications, Volume 8, Issue 9, September 2018 195
ISSN 2250-3153
http://dx.doi.org/10.29322/IJSRP.8.9.2018.p8127 www.ijsrp.org
Figure 4. PGA calculation and plotting with fault distance.
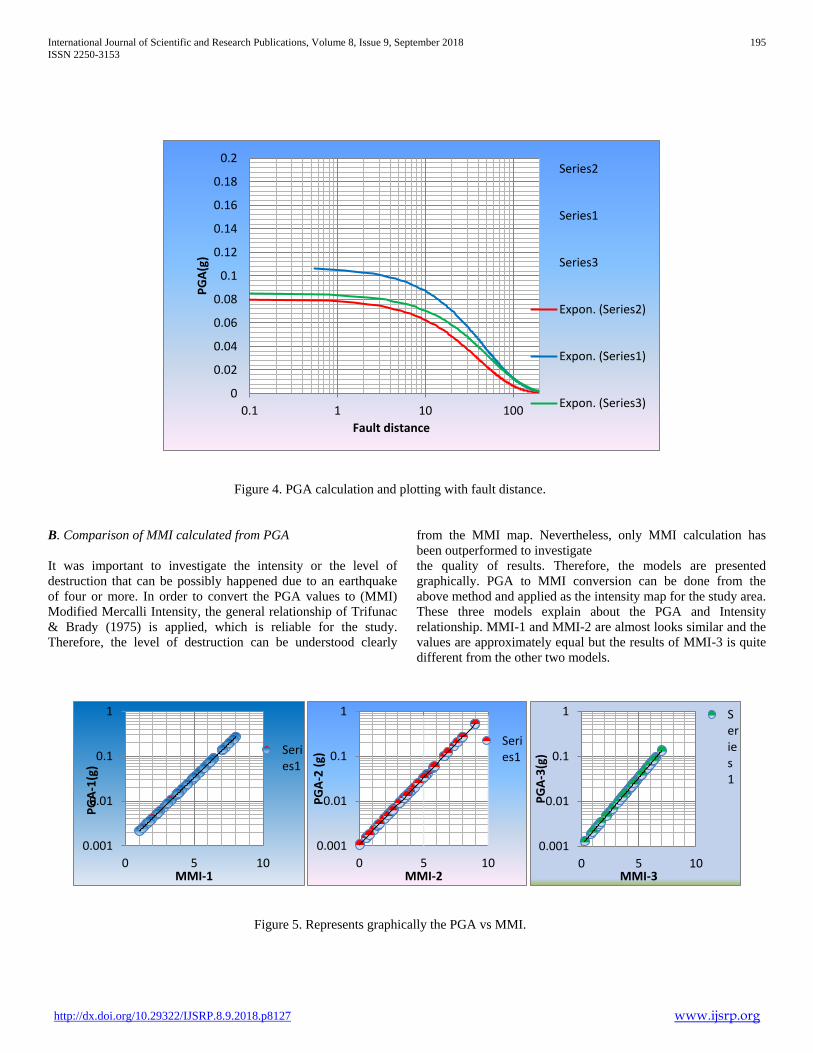
B. Comparison of MMI calculated from PGA
It was important to investigate the intensity or the level of
destruction that can be possibly happened due to an earthquake
of four or more. In order to convert the PGA values to (MMI)
Modified Mercalli Intensity, the general relationship of Trifunac
& Brady (1975) is applied, which is reliable for the study.
Therefore, the level of destruction can be understood clearly
from the MMI map. Nevertheless, only MMI calculation has
been outperformed to investigate
the quality of results. Therefore, the models are presented
graphically. PGA to MMI conversion can be done from the
above method and applied as the intensity map for the study area.
These three models explain about the PGA and Intensity
relationship. MMI-1 and MMI-2 are almost looks similar and the
values are approximately equal but the results of MMI-3 is quite
different from the other two models.
Figure 5. Represents graphically the PGA vs MMI.
0.001
0.01
0.1
1
0 5 10
PG
A-1
(g)
MMI-1
Series1
0.001
0.01
0.1
1
0 5 10
PG
A-2
(g)
MMI-2
Series1
0
0.02
0.04
0.06
0.08
0.1
0.12
0.14
0.16
0.18
0.2
0.1 1 10 100
PG
A(g
)
Fault distance
Series2
Series1
Series3
Expon. (Series2)
Expon. (Series1)
Expon. (Series3)
0.001
0.01
0.1
1
0 5 10
PG
A-3
(g)
MMI-3
Series1
International Journal of Scientific and Research Publications, Volume 8, Issue 9, September 2018 196
ISSN 2250-3153
http://dx.doi.org/10.29322/IJSRP.8.9.2018.p8127 www.ijsrp.org
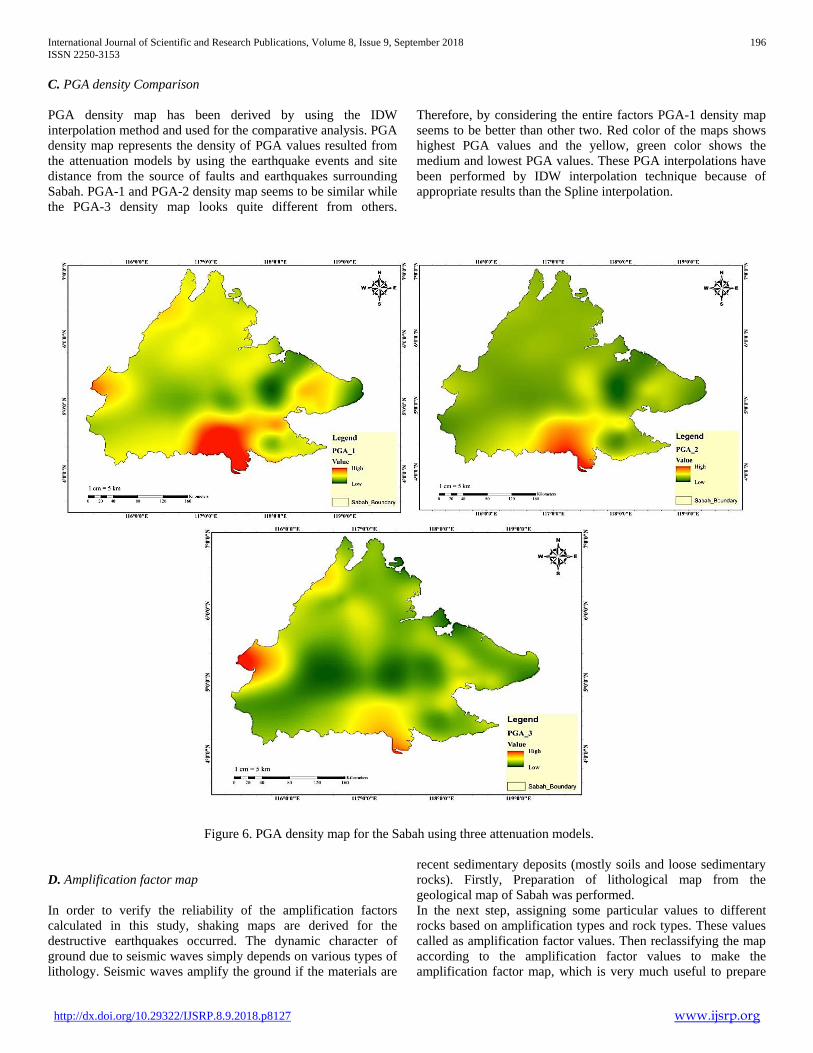
C. PGA density Comparison
PGA density map has been derived by using the IDW
interpolation method and used for the comparative analysis. PGA
density map represents the density of PGA values resulted from
the attenuation models by using the earthquake events and site
distance from the source of faults and earthquakes surrounding
Sabah. PGA-1 and PGA-2 density map seems to be similar while
the PGA-3 density map looks quite different from others.
Therefore, by considering the entire factors PGA-1 density map
seems to be better than other two. Red color of the maps shows
highest PGA values and the yellow, green color shows the
medium and lowest PGA values. These PGA interpolations have
been performed by IDW interpolation technique because of
appropriate results than the Spline interpolation.
Figure 6. PGA density map for the Sabah using three attenuation models.
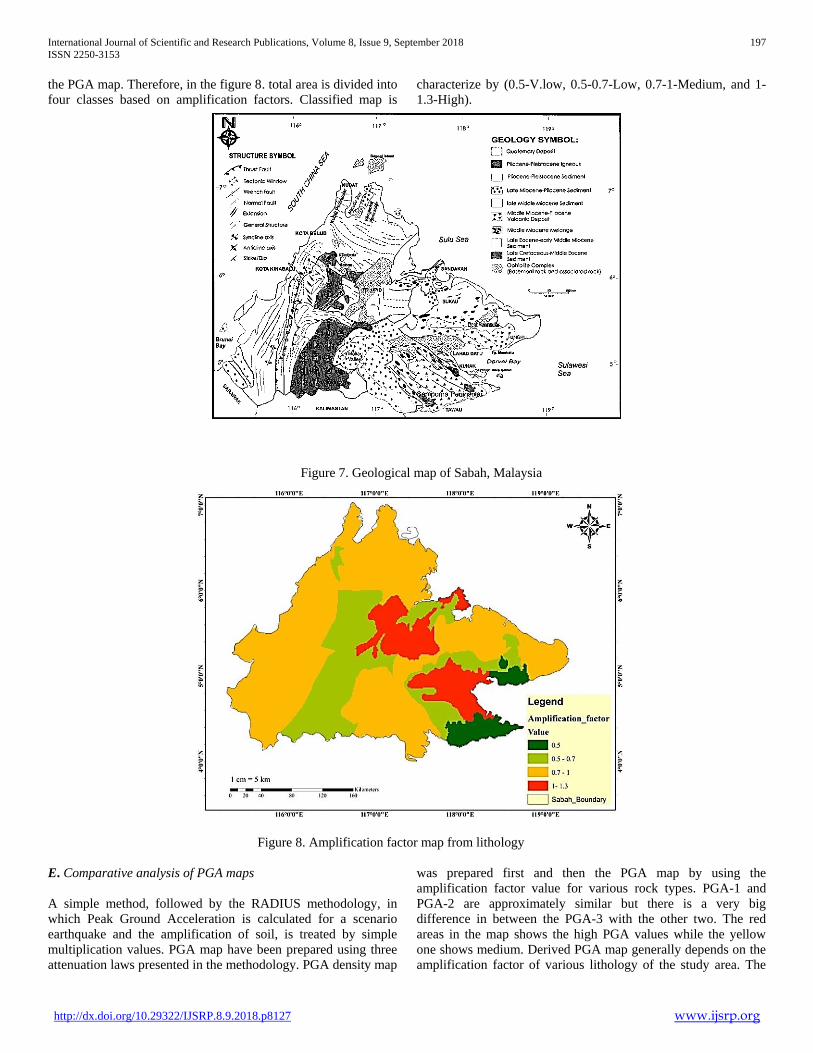
D. Amplification factor map
In order to verify the reliability of the amplification factors
calculated in this study, shaking maps are derived for the
destructive earthquakes occurred. The dynamic character of
ground due to seismic waves simply depends on various types of
lithology. Seismic waves amplify the ground if the materials are
recent sedimentary deposits (mostly soils and loose sedimentary
rocks). Firstly, Preparation of lithological map from the
geological map of Sabah was performed.
In the next step, assigning some particular values to different
rocks based on amplification types and rock types. These values
called as amplification factor values. Then reclassifying the map
according to the amplification factor values to make the
amplification factor map, which is very much useful to prepare
International Journal of Scientific and Research Publications, Volume 8, Issue 9, September 2018 197
ISSN 2250-3153
http://dx.doi.org/10.29322/IJSRP.8.9.2018.p8127 www.ijsrp.org
the PGA map. Therefore, in the figure 8. total area is divided into
four classes based on amplification factors. Classified map is
characterize by (0.5-V.low, 0.5-0.7-Low, 0.7-1-Medium, and 1-
1.3-High).
Figure 7. Geological map of Sabah, Malaysia
Figure 8. Amplification factor map from lithology
E. Comparative analysis of PGA maps
A simple method, followed by the RADIUS methodology, in
which Peak Ground Acceleration is calculated for a scenario
earthquake and the amplification of soil, is treated by simple
multiplication values. PGA map have been prepared using three
attenuation laws presented in the methodology. PGA density map
was prepared first and then the PGA map by using the
amplification factor value for various rock types. PGA-1 and
PGA-2 are approximately similar but there is a very big
difference in between the PGA-3 with the other two. The red
areas in the map shows the high PGA values while the yellow
one shows medium. Derived PGA map generally depends on the
amplification factor of various lithology of the study area. The

International Journal of Scientific and Research Publications, Volume 8, Issue 9, September 2018 198
ISSN 2250-3153
http://dx.doi.org/10.29322/IJSRP.8.9.2018.p8127 www.ijsrp.org
PGA map resulted from the third equation is much better than
other two because of effective values. Producing earthquake
ground-shaking scenarios has become a common practice in
earthquake research and development in the last decade. These
PGA maps, which can be found within a few minutes of an
experienced earthquake via the various Web portals or
communication sites, are useful for public and scientific
consumption. PGA maps are most important, for planning of
emergency response, recovery and assistance during a destructive
earthquake. Generally, the reliability of PGA maps depends on
several factors such as, the ground-motion equation used to
estimate the shaking attenuation laws as a function of event
magnitudes and distance. The geological map used to provide an
estimation of the average shear wave velocity VS, in the upper 30
m, and site correction factors adopted to account for
amplification effects produced by particular soil conditions.
Based on types of soil and rocks the amplification factors are
categorized and added into the database to apply for the
preparation of factor map, which was finally used for the PGA
map development in next step. Therefore, the models are derived
here by proposing the PGA comparison model are correct with
good accuracy and effective.
Figure 9. Comparative analysis of PGA maps.

International Journal of Scientific and Research Publications, Volume 8, Issue 9, September 2018 199
ISSN 2250-3153
http://dx.doi.org/10.29322/IJSRP.8.9.2018.p8127 www.ijsrp.org
Table 2. Represents the PGA and MMI values resulted from the study.
F. Stereo plot of twelve active faults of Sabah, Malaysia
Faults can be represented through the stereo net for a better
understanding. Therefore, almost 12 active faults are plotted in
the stereo net with dip and strike of all faults. All the faults are
active in Sabah resulting medium magnitude of seismicity and
these are major local faults, which are very much responsible for
most of the earthquakes. All the 12 active major faults plotted in
stereo plot representing the fault mechanism. Most of the
earthquakes can be found at the intersection of faults and
lineaments. All the 14 faults explains about the fault movements,
strike, slip, compression, tension and it also describe about the
kind faults are present in Sabah. Most of the faults are reverse
faults that are producing high magnitude of earthquakes. Fault
plane solutions are derived for all the faults to understand the
active mechanism in Sabah. Material movements can be clearly
understood from all the fault plane solutions presented in the
figure 10. All the solutions derived using stereo net and to
validate the resulted beach ball diagrams from the stereo net
plotting the details of information can be found in the Global
Centroid-Moment-Tensor (CMT) Project
(http://www.globalcmt.org/). Again, the same models are also
derived from Arc-GIS, which are plotted at the right side down
of each model to confirm the results are correct. These models
are useful to understand the tectonics of the study area. This
modelling of fault plane solution can also be performed by using
the first P-wave motion, which is not our main interest in this
project. Our main interest is to understand the tectonics of the
active faults in Sabah that can be clearly understood from these
fault plane solutions.
Figure 10. Fault plane solution for 12 active inland faults of Sabah.
PGA Values MMI Values Remarks
PGA-1(0.075) MMI-1(7) Damageable
PGA-2(0.06) MMI-2(6) Negligible damage to well-
developed infrastructure
PGA-3(0.08) MMI-3(7) Damageable

International Journal of Scientific and Research Publications, Volume 8, Issue 9, September 2018 200
ISSN 2250-3153
http://dx.doi.org/10.29322/IJSRP.8.9.2018.p8127 www.ijsrp.org
VI. CONCLUSIONS
All the earthquakes experienced in Sabah area are mostly
shallow focus as resulted from the analysis of magnitude and
distance relationship. Generally, the earthquake magnitudes are
converted to the best size measuring magnitude to make an
effective result, while applying in the attenuation laws. PGA
values resulting from the three attenuation laws are well
expressed in graphs. The results interpreted from the graphs
shows the best method that can be applied for the Sabah. PGA
maps are resulted using all the three attenuation models and
compared to find out the best one. PGA map prepared from
equation 3 is the best method for this study based on, (a)
Lithology and amplification factor (b) Magnitude of
earthquakes and (c) Fault System. By analyzing the results of
PGA map it is quite clear that equation 1 and 2 are almost
similar, while the results from equation 3 is different from others.
The patches of intersection of faults, earthquake magnitudes, and
the types of lithology clearly indicates that possible area of
highest ground acceleration. Therefore, by analyzing and
considering all the factors it is clear that the equation 3 is the best
one for the PGA map preparation in Sabah. By making a very
effective analysis on faults using stereo net plotting fault
movement, compression and dilation can be clearly understood.
Beach ball diagrams are presented to understand the fault
mechanism as well as the types of active inland faults that are
present in Sabah. The overall design of the method is unique and
effective for the PGA comparison. The strength and limitations
of the developed model is totally depends on the types and
completeness of data used. The model is providing very realistic
results to make a useful comparison between PGA models. The
method is cost effective, feasible and accurate.
Acknowledgement
The earthquake and fault data collected from Global centroid
moment tensor (GCMT). Figures were prepared by using ENVI
and ArcGIS 10.4 and Excel
REFERENCES
[1] Akkar, S. and Bommer J.J. 2007. Empirical prediction equations for peak ground velocity derived from strong motion records from Europe and the Middle East, Bull. Seism. Soc. Am., No. 97, pp. 511-530.
[2] Barani, S.R. De Ferrari, G.F. Eva, C. 2008. Assessing the effectiveness of soil parameters for ground response characterization and soil classification, Earthquake Spectra, No. 24, pp. 565-597.
[3] Building Seismic Safety Council. 2003. NEHRP Recommended provisions for seismic regulations for new buildings and other structures, Federal Emergency Management Agency – FEMA, Report No. 450, Washington DC, USA.
[4] Bazzurro, P. and Cornell C.A. 2004. Ground-motion amplification in nonlinear soil sites with uncertain properties, Bull. Seism. Soc. Am., No. 94, pp. 2090-2109.
[5] Borcherdt, R.D. 1994. Estimates of site-dependent response spectra for design (methodology and justification), Earthquake Spectra, No. 10, pp. 617-653.
[6] Chavez David, E. & Presttley Keith, F. 1985. ML Observations in The Great Basin and Mo Versus ML relationships for the (1980) Mamoth Lakes, California Earthquake Sequence. Bulletin of Seismological Society of America (BSSA).
[7] Choi, Y. and Stewart, P. 2005. Nonlinear site amplification as function of 30 m shear wave velocity, Earthquake Spectra, No. 21, pp. 1-30.
[8] Dowrick, D.J. 1992. Attenuation of Modified Mercalli Intensity in New Zealand Earthquakes. Earthquake Engineering and Structural Dynamics, 21, pp.181-196.
[9] Dowrick, D.J & Rhodes, D.A. 1999. Attenuation of Modified Mercalli Intensity in New Zealand Earthquakes. Bulletin of The New Zealand Society for earthquake Engineering, 32, pp.55-89B. Smith, “An approach to graphs of linear forms (Unpublished work style),” unpublished.
[10] Fukushima, Y. Bonilla, F, Scotti, O. Douglas, J. 2007. Site Classification Using Horizontal to vertical Response Spectral Ratios & Its Impact When Deriving Empirical Ground Motion Prediction Equation. Journal of Earthquake Engineering, 11, no.5.
[11] Kayal, J.R. 2006. Seismic Waves and Earthquakes Location. Geological SurveyIndia. http://wwwescweb.wr.usgs.gov/Share/money/SriII2.pdf.
[12] Tsutomu, S. Yutaka, N. and Jun, S. 2004. Evaluation of The Amplification Characteristics of Subsurface Using Micro tremor and Strong motion, - The Studies at Mexico City -, 13th World Conference on Earthquake Engineering, Vancouver, B.C., Canada August 1-6, Paper No. 862.
[13] Von Thun, J.L. Rochim, L.H. Scott, G.A. and Wilson, J.A. 1988. Earthquake ground motions for design and analysis of dams, Earthquake Engineering and Soil Dynamics II – Recent Advance in Ground-Motion Evaluation, Geotechnical Special Publication, No. 20, ASCEE, New York, pp. 463-481.
AUTHORS
First Author – Ratiranjan Jena, University of technology
Sydney
Second Author – Biswajeet Pradhan, University of technology
Sydney