a novel graph neural network to localize eloquent …...a novel graph neural network to localize...
TRANSCRIPT

A Novel Graph Neural Networkto Localize Eloquent Cortex in Brain
Tumor Patients from Resting-State fMRIConnectivity
Naresh Nandakumar1(B), Komal Manzoor2, Jay J. Pillai2, Sachin K. Gujar2,Haris I. Sair2, and Archana Venkataraman1
1 Department of Electrical and Computer Engineering,Johns Hopkins University, Baltimore, USA
[email protected] Department of Neuroradiology,
Johns Hopkins School of Medicine, Baltimore, USA
Abstract. We develop a novel method to localize the language andmotor areas of the eloquent cortex in brain tumor patients based onresting-state fMRI (rs-fMRI) connectivity. Our method leverages therepresentation power of convolutional neural networks through special-ized filters that act topologically on the rs-fMRI connectivity data. ThisGraph Neural Network (GNN) classifies each parcel in the brain intoeloquent cortex, tumor, or background gray matter, thus accommodat-ing varying tumor characteristics across patients. Our loss function alsoreflects the large class-imbalance present in our data. We evaluate ourGNN on rs-fMRI data from 60 brain tumor patients with different tumorsizes and locations. We use motor and language task fMRI for valida-tion. Our model achieves better localization than linear SVM, randomforest, and a multilayer perceptron architecture. Our GNN is able to cor-rectly identify bilateral language areas in the brain even when trainedon patients whose language network is lateralized to the left hemisphere.
Keywords: Rs-fMRI · Graph Neural Network · Language localization
1 Introduction
The eloquent cortex consists of sensorimotor and language areas in the brainthat are essential for human functioning. Given its importance, localizing andsubsequently avoiding the eloquent cortex is a crucial step when planning a neu-rosurgery. However, this localization is challenging due to the varying anatomicalboundaries of these networks and the effects of the tumor. For example, it hasbeen shown that motor and language functionality in brain tumor patients canbe displaced due to neural plasticity [1]. The gold standard for eloquent mappingis intraoperative electrical stimulation, which is highly invasive and requires thec© Springer Nature Switzerland AG 2019M. D. Schirmer et al. (Eds.): CNI 2019, LNCS 11848, pp. 10–20, 2019.https://doi.org/10.1007/978-3-030-32391-2_2

A Novel Graph Neural Network to Localize Eloquent Cortex 11
patient to be awake during surgery. The noninvasive alternative is task-fMRI.However, severely impaired patients, such as those with advanced brain tumors,may not be able to perform these tasks, thus reducing the reliability of thefMRI activation maps. Resting-state fMRI (rs-fMRI) captures spontaneous fluc-tuations in the brain, which can be used to identify functional systems in theabsence of an experimental paradigm. Hence, rs-fMRI may provide an alternativefor motor and language localization in critically ill patients [2].
Automatically identifying the eloquent cortex in brain tumor patients isa challenging problem with limited success in the literature. The work of [3]addresses the problem of shifting anatomical boundaries by matching functionalbrain regions across individuals via a diffusion map representation of task-fMRI.However, this method has yet to generalize to rs-fMRI. With regards to rs-fMRI,the work of [4] describes a method to obtain subject-specific functional parcel-lations of brain tumor patients using a Markov Random Field prior. However,this method is validated on a coarse functional parcellation which is unsuitiblefor presurgical mapping. The work of [5] describes a method to compute lan-guage laterality from rs-fMRI by comparing connectivity between fixed areas ofexpected language activation. However, this study stopped short of localization,which is the main clinical need. The authors of [2] propose a semi-automatedmethod to determine the language network from group ICA maps of rs-fMRIdata. However, this method relies on manual thresholding for each patient.Finally, the work of [6] describes a multi-layer perceptron to classify resting-state networks at the voxel level based on seed correlation maps, which was thenextended to identify the language network in three separate tumor cases [7].However, this method is computationally expensive, requires a large amount oftraining data, and has only been evaluated on a limited dataset.
In this paper, we propose the first end-to-end model that uses convolutionalneural networks (CNNs) to identify eloquent cortex in brain tumor patients.Our problem loosely resembles image segmentation, for which deep learningapproaches using CNNs have made great strides [8]. However, rs-fMRI capturescorrelated patterns of activity rather than local similarities, which cannot berepresented by a traditional spatial convolution. Therefore, deep learning for rs-fMRI has focused almost exclusively on perceptron architectures [6] and patientwise classification [9], rather than network analysis. Our approach blends theideas of image segmentation and functional network extraction. Namely, we con-struct a similarity graph from rs-fMRI data that summarizes functional connec-tivity between ROIs. These graphs are then input to a novel graph neural network(GNN) which leverages convolutional filters designed to act topologically uponsimilarity matrices [10]. The output of our GNN is a vector that classifies eachnode in the graph as either eloquent cortex, tumor, or background gray matter.We train and evaluate four separate GNN’s to perform either language or motorclassification. The motor classes are divided into three regions of the motor stripcorresponding to finger, tongue, or foot movements. Our loss function reflectsthe large class-imbalance in our data, as eloquent cortex and tumor represent a
12 N. Nandakumar et al.
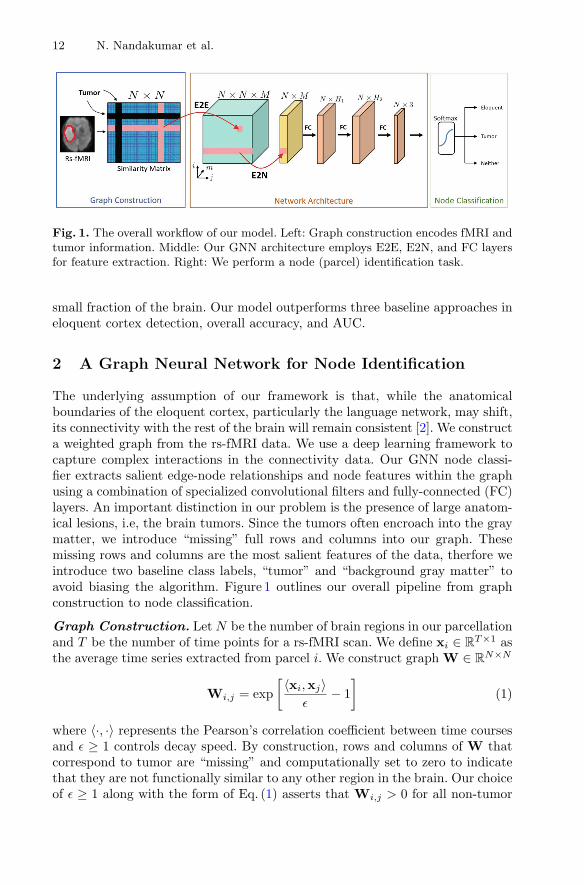
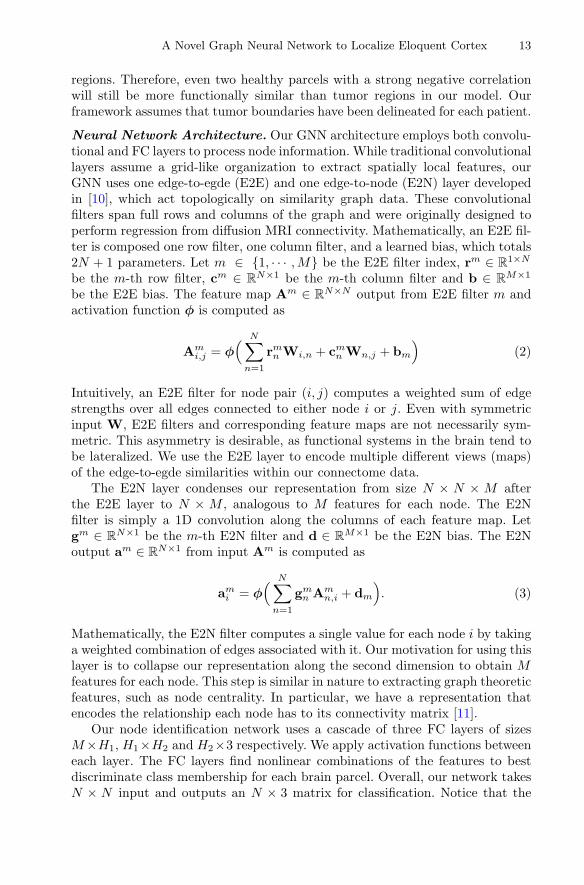
Fig. 1. The overall workflow of our model. Left: Graph construction encodes fMRI andtumor information. Middle: Our GNN architecture employs E2E, E2N, and FC layersfor feature extraction. Right: We perform a node (parcel) identification task.
small fraction of the brain. Our model outperforms three baseline approaches ineloquent cortex detection, overall accuracy, and AUC.
2 A Graph Neural Network for Node Identification
The underlying assumption of our framework is that, while the anatomicalboundaries of the eloquent cortex, particularly the language network, may shift,its connectivity with the rest of the brain will remain consistent [2]. We constructa weighted graph from the rs-fMRI data. We use a deep learning framework tocapture complex interactions in the connectivity data. Our GNN node classi-fier extracts salient edge-node relationships and node features within the graphusing a combination of specialized convolutional filters and fully-connected (FC)layers. An important distinction in our problem is the presence of large anatom-ical lesions, i.e, the brain tumors. Since the tumors often encroach into the graymatter, we introduce “missing” full rows and columns into our graph. Thesemissing rows and columns are the most salient features of the data, therfore weintroduce two baseline class labels, “tumor” and “background gray matter” toavoid biasing the algorithm. Figure 1 outlines our overall pipeline from graphconstruction to node classification.
Graph Construction. Let N be the number of brain regions in our parcellationand T be the number of time points for a rs-fMRI scan. We define xi ∈ R
T×1 asthe average time series extracted from parcel i. We construct graph W ∈ R
N×N
Wi,j = exp[ 〈xi,xj〉
ε− 1
](1)
where 〈·, ·〉 represents the Pearson’s correlation coefficient between time coursesand ε ≥ 1 controls decay speed. By construction, rows and columns of W thatcorrespond to tumor are “missing” and computationally set to zero to indicatethat they are not functionally similar to any other region in the brain. Our choiceof ε ≥ 1 along with the form of Eq. (1) asserts that Wi,j > 0 for all non-tumor
A Novel Graph Neural Network to Localize Eloquent Cortex 13
regions. Therefore, even two healthy parcels with a strong negative correlationwill still be more functionally similar than tumor regions in our model. Ourframework assumes that tumor boundaries have been delineated for each patient.
Neural Network Architecture. Our GNN architecture employs both convolu-tional and FC layers to process node information. While traditional convolutionallayers assume a grid-like organization to extract spatially local features, ourGNN uses one edge-to-egde (E2E) and one edge-to-node (E2N) layer developedin [10], which act topologically on similarity graph data. These convolutionalfilters span full rows and columns of the graph and were originally designed toperform regression from diffusion MRI connectivity. Mathematically, an E2E fil-ter is composed one row filter, one column filter, and a learned bias, which totals2N + 1 parameters. Let m ∈ {1, · · · ,M} be the E2E filter index, rm ∈ R
1×N
be the m-th row filter, cm ∈ RN×1 be the m-th column filter and b ∈ R
M×1
be the E2E bias. The feature map Am ∈ RN×N output from E2E filter m and
activation function φ is computed as
Ami,j = φ
( N∑n=1
rmn Wi,n + cmn Wn,j + bm
)(2)
Intuitively, an E2E filter for node pair (i, j) computes a weighted sum of edgestrengths over all edges connected to either node i or j. Even with symmetricinput W, E2E filters and corresponding feature maps are not necessarily sym-metric. This asymmetry is desirable, as functional systems in the brain tend tobe lateralized. We use the E2E layer to encode multiple different views (maps)of the edge-to-egde similarities within our connectome data.
The E2N layer condenses our representation from size N × N × M afterthe E2E layer to N × M , analogous to M features for each node. The E2Nfilter is simply a 1D convolution along the columns of each feature map. Letgm ∈ R
N×1 be the m-th E2N filter and d ∈ RM×1 be the E2N bias. The E2N
output am ∈ RN×1 from input Am is computed as
ami = φ( N∑
n=1
gmn Am
n,i + dm
). (3)
Mathematically, the E2N filter computes a single value for each node i by takinga weighted combination of edges associated with it. Our motivation for using thislayer is to collapse our representation along the second dimension to obtain Mfeatures for each node. This step is similar in nature to extracting graph theoreticfeatures, such as node centrality. In particular, we have a representation thatencodes the relationship each node has to its connectivity matrix [11].
Our node identification network uses a cascade of three FC layers of sizesM ×H1, H1×H2 and H2×3 respectively. We apply activation functions betweeneach layer. The FC layers find nonlinear combinations of the features to bestdiscriminate class membership for each brain parcel. Overall, our network takesN × N input and outputs an N × 3 matrix for classification. Notice that the

14 N. Nandakumar et al.
first input dimension N is maintained throughout our whole network and isnot transformed. Therefore, our network maintains node structure to ultimatelydiscriminate class membership for all nodes within one connectome at a time.As shown in Fig. 1, one design choice we make is to set H2 > H1. Empircally,this relationship robustly captures the structure of our class membership.
Weighted Loss Function. Naturally, there exists a large class imbalance inour setup, as the majority of nodes considered will be background gray matter.We cannot rely on traditional data augmentation techniques to mitigate thisimbalance, as our model operates on whole-brain connectivity. To accomodatefor the class imbalance, we train our model with a modified version of the Risk-sensitive cross-entropy (RSCE) loss function [12], which is designed to handlemembership imbalance in multi-class classification. Let yn
c be the output prob-ability of our network for assigning node n to class c and yn
c be 1 when node nbelongs to class c and 0 otherwise. The loss function per patient is
L(ync , yn
c ) = − 1N
N∑n=1
C∑c=1
δc · ync log (yn
c ) (4)
where δc is the risk factor associated with class c. If δc is small, then we pay asmaller penalty for misclassifying samples that belong to class c. Our strategy isto penalize misclassifying eloquent nodes (false negatives) larger than misclassi-fying background (false positives) to encourage our model to learn the languageand motor distributions given a small number of language training samples.
Neural Network Implementation Details. We implement our network inPyTorch using the SGD optimizer with weight decay = 5 × 10⁻⁵ for parameterstability, and momentum = 0.9 to improve convergence. For our model, ε = 1 andlayer dimensions are M = 8, H1 = 9, H2 = 27 and C = 3. We train our modelwith learning rate .005 and 80 epochs, which provides for reliable performancewithout overfitting. The LeakyReLU(x) = max(0, x) + 0.33·min(0, x) activationfunction is applied at each hidden layer. Empirically, this activation function isrobust to a range of initializations. A softmax activation is applied at the finallayer for classification. After cross-validation, we set δ = (1.3, .3, .15) for theeloquent cortex, tumor, and background gray matter classes respectively. WithGPU, total training time is within 3–5 min.
2.1 Baseline Comparisons
We evaluate the performance of our GNN against 3 baseline methods. Thefirst baseline is a linear SVM based on graph theoretic measures: node degree,betweenness, closeness, and eigenvector centrality [11]. The second baseline is arandom forest (RF) on the stacked rs-fMRI similarity features of each node. Weomit tumor class and nodes for SVM and RF as the algorithms do not exploitthe spatial consistency of the similarity matrix. The last baseline is a multi-layer perceptron (MLP) to observe how adding specialized E2E and E2N layerschanges performance for this task. The MLP maintains the same input-outputrelationship, total parameter number, activations, and loss function as the GNN.
A Novel Graph Neural Network to Localize Eloquent Cortex 15
3 Experimental Results
Dataset and Preprocessing: We evaluate the GNN on rs-fMRI data from60 patients who underwent preoperative mapping as part of their presurgicalworkup. The data was acquired using a 3.0 T Siemens Trio Tim (TR = 2000ms, TE = 30 ms, FOV = 24 cm, res = 3.59 × 3.59 × 5 mm). The fMRI wasprocessed using SPM8. The steps include slice timing correction, motion cor-rection and registration to the MNI-152 template. The rs-fMRI was bandpassfiltered from 0.01 to 0.1 Hz, spatially smoothed with a 6 mm FWHM Gaussiankernel, scrubbed using the ArtRepair toolbox in SPM, linearly detrended, andunderwent nuisance regression using CompCor.
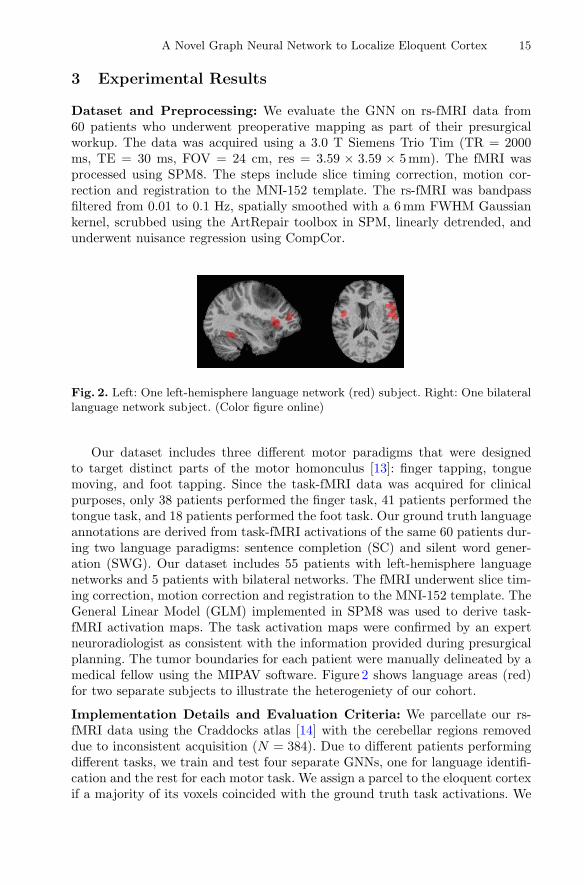
Fig. 2. Left: One left-hemisphere language network (red) subject. Right: One bilaterallanguage network subject. (Color figure online)
Our dataset includes three different motor paradigms that were designedto target distinct parts of the motor homonculus [13]: finger tapping, tonguemoving, and foot tapping. Since the task-fMRI data was acquired for clinicalpurposes, only 38 patients performed the finger task, 41 patients performed thetongue task, and 18 patients performed the foot task. Our ground truth languageannotations are derived from task-fMRI activations of the same 60 patients dur-ing two language paradigms: sentence completion (SC) and silent word gener-ation (SWG). Our dataset includes 55 patients with left-hemisphere languagenetworks and 5 patients with bilateral networks. The fMRI underwent slice tim-ing correction, motion correction and registration to the MNI-152 template. TheGeneral Linear Model (GLM) implemented in SPM8 was used to derive task-fMRI activation maps. The task activation maps were confirmed by an expertneuroradiologist as consistent with the information provided during presurgicalplanning. The tumor boundaries for each patient were manually delineated by amedical fellow using the MIPAV software. Figure 2 shows language areas (red)for two separate subjects to illustrate the heterogeniety of our cohort.
Implementation Details and Evaluation Criteria: We parcellate our rs-fMRI data using the Craddocks atlas [14] with the cerebellar regions removeddue to inconsistent acquisition (N = 384). Due to different patients performingdifferent tasks, we train and test four separate GNNs, one for language identifi-cation and the rest for each motor task. We assign a parcel to the eloquent cortexif a majority of its voxels coincided with the ground truth task activations. We
16 N. Nandakumar et al.
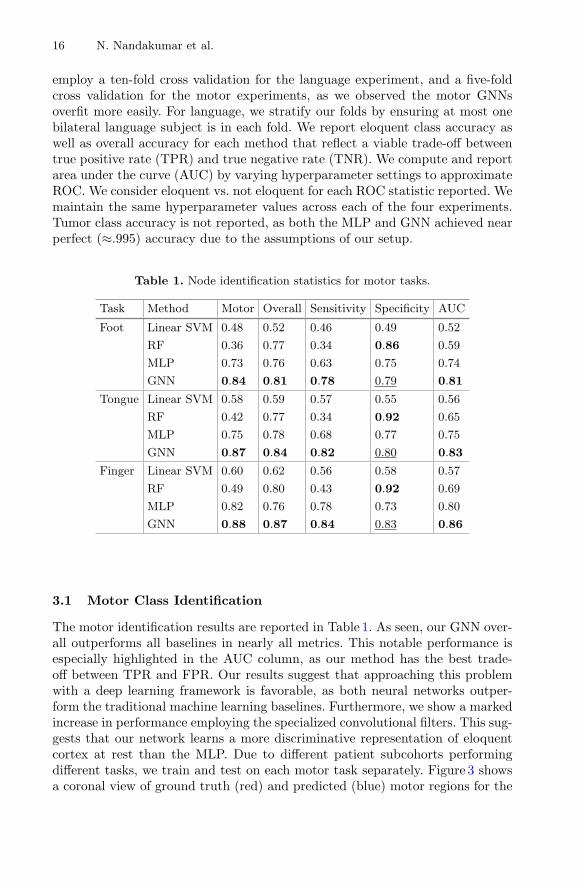
employ a ten-fold cross validation for the language experiment, and a five-foldcross validation for the motor experiments, as we observed the motor GNNsoverfit more easily. For language, we stratify our folds by ensuring at most onebilateral language subject is in each fold. We report eloquent class accuracy aswell as overall accuracy for each method that reflect a viable trade-off betweentrue positive rate (TPR) and true negative rate (TNR). We compute and reportarea under the curve (AUC) by varying hyperparameter settings to approximateROC. We consider eloquent vs. not eloquent for each ROC statistic reported. Wemaintain the same hyperparameter values across each of the four experiments.Tumor class accuracy is not reported, as both the MLP and GNN achieved nearperfect (≈.995) accuracy due to the assumptions of our setup.
Table 1. Node identification statistics for motor tasks.
Task Method Motor Overall Sensitivity Specificity AUC
Foot Linear SVM 0.48 0.52 0.46 0.49 0.52
RF 0.36 0.77 0.34 0.86 0.59
MLP 0.73 0.76 0.63 0.75 0.74
GNN 0.84 0.81 0.78 0.79 0.81
Tongue Linear SVM 0.58 0.59 0.57 0.55 0.56
RF 0.42 0.77 0.34 0.92 0.65
MLP 0.75 0.78 0.68 0.77 0.75
GNN 0.87 0.84 0.82 0.80 0.83
Finger Linear SVM 0.60 0.62 0.56 0.58 0.57
RF 0.49 0.80 0.43 0.92 0.69
MLP 0.82 0.76 0.78 0.73 0.80
GNN 0.88 0.87 0.84 0.83 0.86
3.1 Motor Class Identification
The motor identification results are reported in Table 1. As seen, our GNN over-all outperforms all baselines in nearly all metrics. This notable performance isespecially highlighted in the AUC column, as our method has the best trade-off between TPR and FPR. Our results suggest that approaching this problemwith a deep learning framework is favorable, as both neural networks outper-form the traditional machine learning baselines. Furthermore, we show a markedincrease in performance employing the specialized convolutional filters. This sug-gests that our network learns a more discriminative representation of eloquentcortex at rest than the MLP. Due to different patient subcohorts performingdifferent tasks, we train and test on each motor task separately. Figure 3 showsa coronal view of ground truth (red) and predicted (blue) motor regions for the

A Novel Graph Neural Network to Localize Eloquent Cortex 17
foot (left) and tongue (right) tasks in one patient. As seen, our network is ableto pinpoint both the midline and the peripheral areas of the motor strip. Ourperformance suggests that our method is able to localize specific parts of themotor homonculus, which is important in a preoperative setting.
Table 2. Node identification statistics for language class (N = 60).
Method Language Overall Sensitivity Specificity AUC
Linear SVM 0.56 0.52 0.55 0.49 0.53
RF 0.37 0.77 0.33 0.89 0.63
MLP 0.66 0.73 0.61 0.76 0.70
GNN 0.74 0.86 0.70 0.77 0.76
Fig. 3. Ground truth (red) and predicted (blue) motor regions for foot (left) and tongue(right) tasks in one patient. (Color figure online)
3.2 Language Class Identification
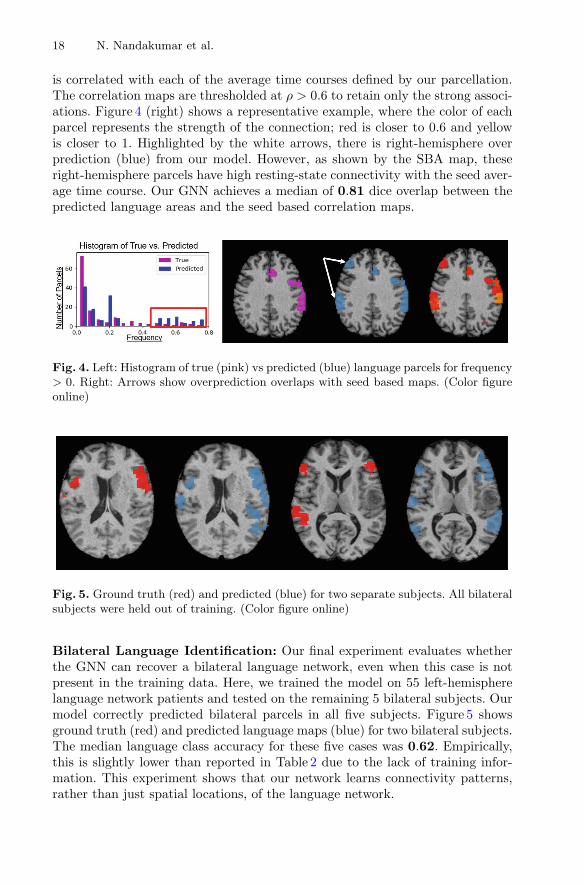
Table 2 reports the language identification performance across all methods. Onceagain, our GNN outperforms the baselines in nearly all methods, with the mostnotable gains in language accuracy and AUC. The specificity of our GNN islower than expected due to the hemispheric symmetry of rs-fMRI data. We sawthat the most frequent misclassification from our model was assigning contralat-eral parcels to the language class. We ran two experiments to probe whetherour GNN is learning connectivity patterns associated with language rather thanmemorizing node locations. In Fig. 4 (left), we plot the histogram of true (pink)vs. predicted (blue) language parcels. The x-axis shows how frequently a certaingroup of parcels was assigned to language in the ground truth and predictedlabels. Each bin represents a different group of parcels. Highlighted by the redbox, we see that our model tends to overpredict the language class. We assertthat this overprediction is viable due to the demands of the clinical applicationof our work. We compared the GNN output with seed based correlation analysis(SBA), where the “seed” for each patient is selected based on the ground truthtask-fMRI activations. The average rs-fMRI time course within the seed location
18 N. Nandakumar et al.
is correlated with each of the average time courses defined by our parcellation.The correlation maps are thresholded at ρ > 0.6 to retain only the strong associ-ations. Figure 4 (right) shows a representative example, where the color of eachparcel represents the strength of the connection; red is closer to 0.6 and yellowis closer to 1. Highlighted by the white arrows, there is right-hemisphere overprediction (blue) from our model. However, as shown by the SBA map, theseright-hemisphere parcels have high resting-state connectivity with the seed aver-age time course. Our GNN achieves a median of 0.81 dice overlap between thepredicted language areas and the seed based correlation maps.
Fig. 4. Left: Histogram of true (pink) vs predicted (blue) language parcels for frequency> 0. Right: Arrows show overprediction overlaps with seed based maps. (Color figureonline)
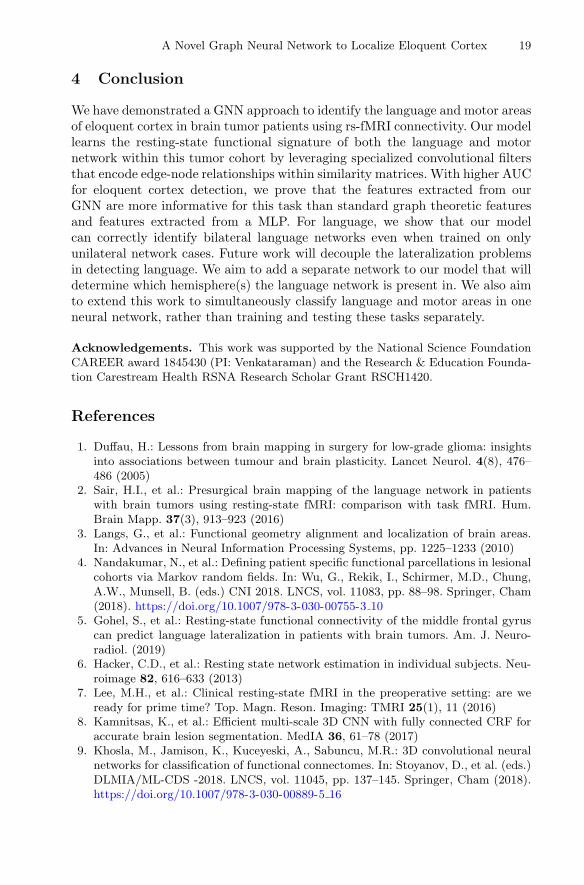
Fig. 5. Ground truth (red) and predicted (blue) for two separate subjects. All bilateralsubjects were held out of training. (Color figure online)
Bilateral Language Identification: Our final experiment evaluates whetherthe GNN can recover a bilateral language network, even when this case is notpresent in the training data. Here, we trained the model on 55 left-hemispherelanguage network patients and tested on the remaining 5 bilateral subjects. Ourmodel correctly predicted bilateral parcels in all five subjects. Figure 5 showsground truth (red) and predicted language maps (blue) for two bilateral subjects.The median language class accuracy for these five cases was 0.62. Empirically,this is slightly lower than reported in Table 2 due to the lack of training infor-mation. This experiment shows that our network learns connectivity patterns,rather than just spatial locations, of the language network.
A Novel Graph Neural Network to Localize Eloquent Cortex 19
4 Conclusion
We have demonstrated a GNN approach to identify the language and motor areasof eloquent cortex in brain tumor patients using rs-fMRI connectivity. Our modellearns the resting-state functional signature of both the language and motornetwork within this tumor cohort by leveraging specialized convolutional filtersthat encode edge-node relationships within similarity matrices. With higher AUCfor eloquent cortex detection, we prove that the features extracted from ourGNN are more informative for this task than standard graph theoretic featuresand features extracted from a MLP. For language, we show that our modelcan correctly identify bilateral language networks even when trained on onlyunilateral network cases. Future work will decouple the lateralization problemsin detecting language. We aim to add a separate network to our model that willdetermine which hemisphere(s) the language network is present in. We also aimto extend this work to simultaneously classify language and motor areas in oneneural network, rather than training and testing these tasks separately.
Acknowledgements. This work was supported by the National Science FoundationCAREER award 1845430 (PI: Venkataraman) and the Research & Education Founda-tion Carestream Health RSNA Research Scholar Grant RSCH1420.
References
1. Duffau, H.: Lessons from brain mapping in surgery for low-grade glioma: insightsinto associations between tumour and brain plasticity. Lancet Neurol. 4(8), 476–486 (2005)
2. Sair, H.I., et al.: Presurgical brain mapping of the language network in patientswith brain tumors using resting-state fMRI: comparison with task fMRI. Hum.Brain Mapp. 37(3), 913–923 (2016)
3. Langs, G., et al.: Functional geometry alignment and localization of brain areas.In: Advances in Neural Information Processing Systems, pp. 1225–1233 (2010)
4. Nandakumar, N., et al.: Defining patient specific functional parcellations in lesionalcohorts via Markov random fields. In: Wu, G., Rekik, I., Schirmer, M.D., Chung,A.W., Munsell, B. (eds.) CNI 2018. LNCS, vol. 11083, pp. 88–98. Springer, Cham(2018). https://doi.org/10.1007/978-3-030-00755-3 10
5. Gohel, S., et al.: Resting-state functional connectivity of the middle frontal gyruscan predict language lateralization in patients with brain tumors. Am. J. Neuro-radiol. (2019)
6. Hacker, C.D., et al.: Resting state network estimation in individual subjects. Neu-roimage 82, 616–633 (2013)
7. Lee, M.H., et al.: Clinical resting-state fMRI in the preoperative setting: are weready for prime time? Top. Magn. Reson. Imaging: TMRI 25(1), 11 (2016)
8. Kamnitsas, K., et al.: Efficient multi-scale 3D CNN with fully connected CRF foraccurate brain lesion segmentation. MedIA 36, 61–78 (2017)
9. Khosla, M., Jamison, K., Kuceyeski, A., Sabuncu, M.R.: 3D convolutional neuralnetworks for classification of functional connectomes. In: Stoyanov, D., et al. (eds.)DLMIA/ML-CDS -2018. LNCS, vol. 11045, pp. 137–145. Springer, Cham (2018).https://doi.org/10.1007/978-3-030-00889-5 16

20 N. Nandakumar et al.
10. Kawahara, J., et al.: BrainNetCNN: convolutional neural networks for brain net-works; towards predicting neurodevelopment. NeuroImage 146, 1038–1049 (2017)
11. Opsahl, T., et al.: Node centrality in weighted networks: generalizing degree andshortest paths. Soc. Netw. 32(3), 245–251 (2010)
12. Suresh, S., et al.: Risk-sensitive loss functions for sparse multi-category classifica-tion problems. Inf. Sci. 178(12), 2621–2638 (2008)
13. Jack Jr., C.R., et al.: Sensory motor cortex: correlation of presurgical mappingwith functional mr imaging and invasive cortical mapping. Radiology 190(1), 85–92 (1994)
14. Craddock, R.C., et al.: A whole brain fmri atlas generated via spatially constrainedspectral clustering. Hum. Brain Mapp. 33(8), 1914–1928 (2012)