a multiple cause analysis of infectious disease mortality in massachusetts,2002- 2011 david meyers
TRANSCRIPT

A Multiple Cause Analysis of Infectious Disease Mortality in Massachusetts,2002-2011DAVID MEYERS
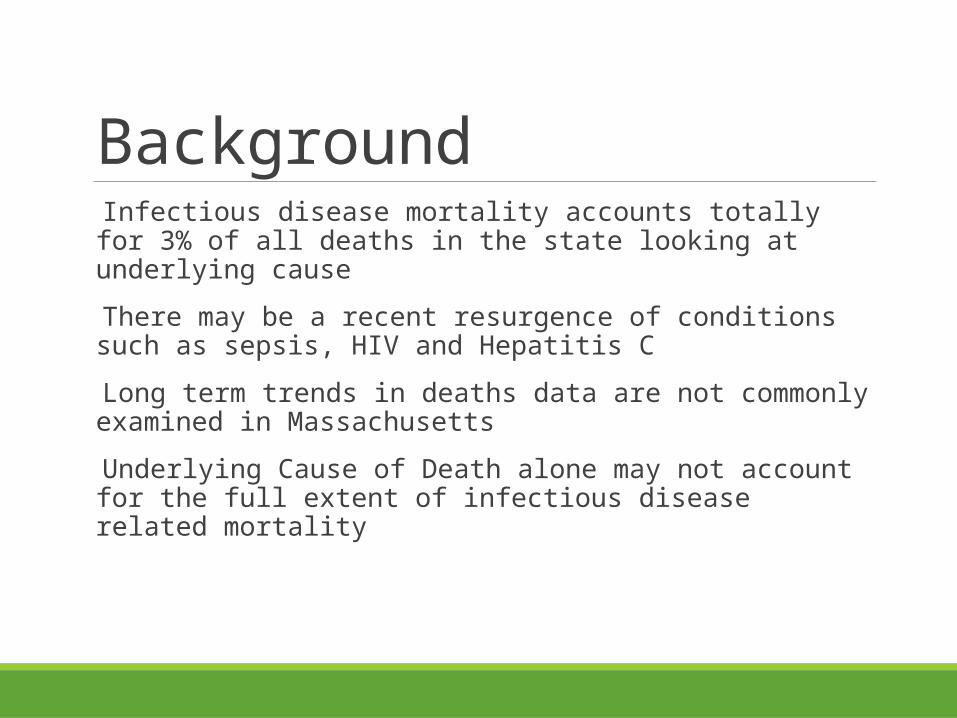
Background Infectious disease mortality accounts totally for 3% of all deaths in the state looking at underlying cause
There may be a recent resurgence of conditions such as sepsis, HIV and Hepatitis C
Long term trends in deaths data are not commonly examined in Massachusetts
Underlying Cause of Death alone may not account for the full extent of infectious disease related mortality

Driving Questions What is the extent of mortality related to infectious disease in Massachusetts over the past decade?
How is infectious disease related mortality in Massachusetts distributed across age, gender, and race?
How is infectious disease related mortality in Massachusetts distributed in space and time?

Methods 4 Infectious Diseases were identified based on prevalence and public health importance to be the focus of analysis
◦ Sepsis, Influenza/Pneumonia, Hepatitis C (HCV), HIV/AIDS
All deaths with any Infectious disease ICD code were pulled from the Massachusetts Death Certificate Database from 2002-2011
Shapefiles for Massachusetts Census Tracts were taken from MassGIS
Analysis and data management took place in SAS, ArcGIS, Joinpoint, and SatScan
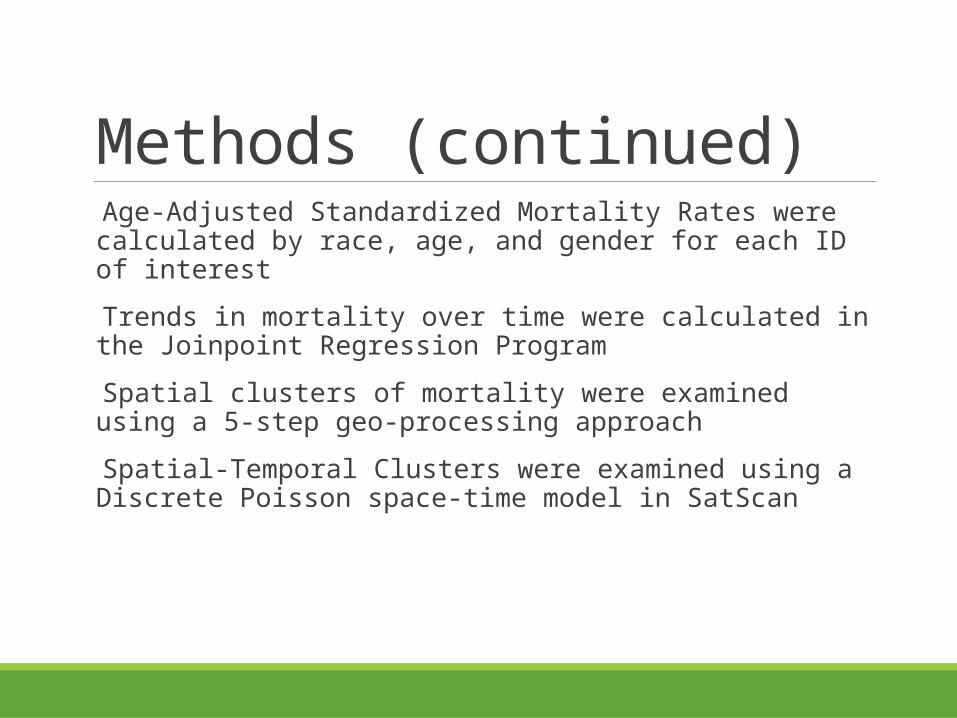
Methods (continued) Age-Adjusted Standardized Mortality Rates were calculated by race, age, and gender for each ID of interest
Trends in mortality over time were calculated in the Joinpoint Regression Program
Spatial clusters of mortality were examined using a 5-step geo-processing approach
Spatial-Temporal Clusters were examined using a Discrete Poisson space-time model in SatScan

Results

Results 91,208 deaths were associated with infectious disease causes over the ten-year period
2,913 deaths were associated with Hepatitis C
1,905 deaths were associated with HIV
33,858 deaths were associated with Sepsis
55,718 deaths were associated with Influenza/Pneumonia

What is the extent of mortality related to HCV over a ten year period?
2002 2003 2004 2005 2006 2007 2008 2009 2010 20110
50100150200250300350400450500
89 63 72 59 67 88 98 110 121 110
271236 250
196 220267 290 295
321 297
Year
HCV
Dea
ths
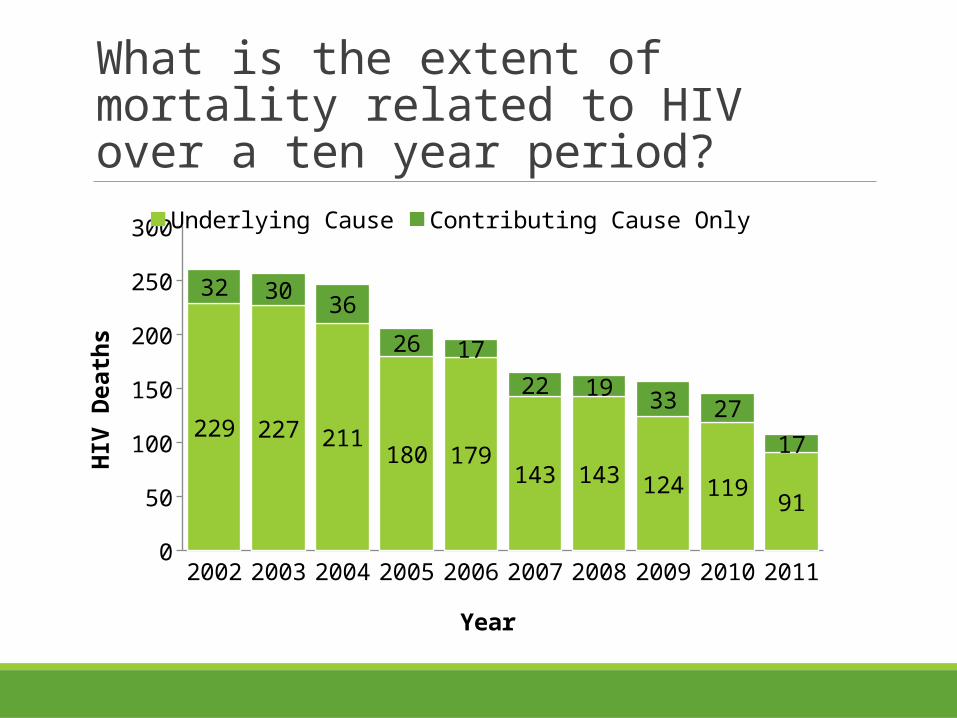
What is the extent of mortality related to HIV over a ten year period?
2002 2003 2004 2005 2006 2007 2008 2009 2010 20110
50
100
150
200
250
300
229 227 211180 179
143 143 124 11991
32 30 36
26 17
22 19 33 2717
Underlying Cause Contributing Cause Only
Year
HIV
Dea
ths

How is HCV Mortality Distributed across Race?
White non-Hispanic Black non-Hispanic Hispanic Asian non-Hispanic Massachusetts Overall0
20
12.6 3.4
0.9 1.21.9
7.47
1.72.4
2.9
10.0 10.4
2.63.6
Contributing Cause Only
Underlying Cause
Age-
adju
sted
HCV
dea
th ra
tes
per 1
00,0
00
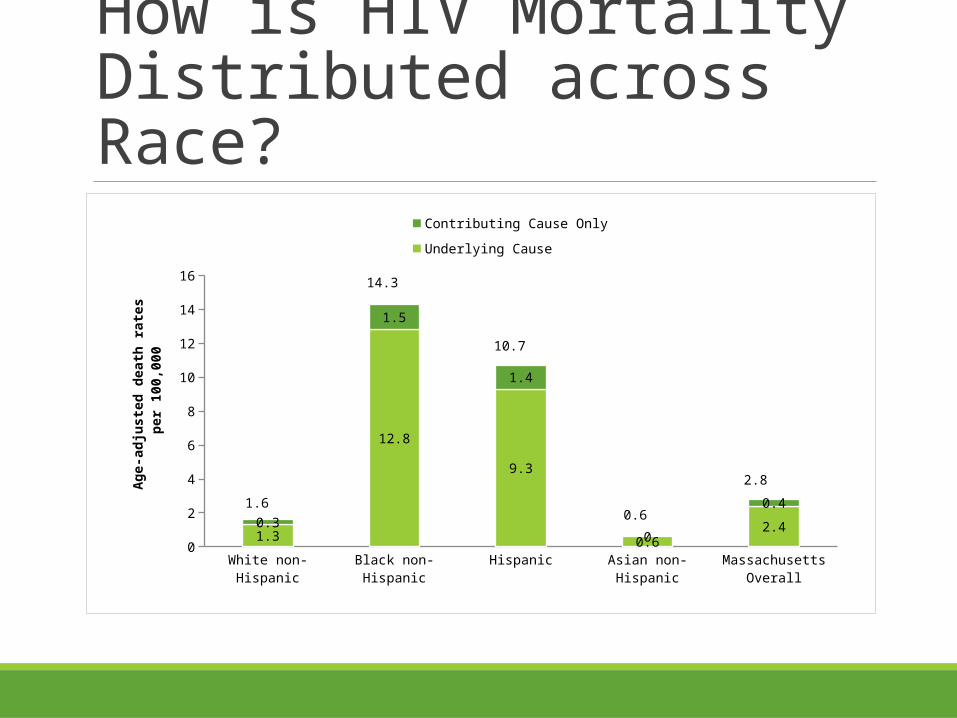
How is HIV Mortality Distributed across Race?
White non-Hispanic Black non-Hispanic Hispanic Asian non-Hispanic Massachusetts Overall0
2
4
6
8
10
12
14
16
1.3
12.8
9.3
0.62.40.3
1.5
1.4
0
0.41.6
14.3
10.7
0.6
2.8
Contributing Cause Only
Underlying Cause
Age-
adju
sted
dea
th ra
tes
per 1
00,0
00

How is HCV Mortality Distributed Across Age?
<15 15-24 25-34 35-44 45- 54 55-64 65- 74 75-84 85+0
200
400
600
800
1,000
1,200
1,400
0 5 8 88377 346
82 70 260 1 35
273
766559
142 9440
Underlying Contributory
Age groups (years)
HCV
Dea
ths

How is HIV Mortality Distributed Across Age?
<15 15-24 25-34 35-44 45- 54 55-64 65- 74 75-84 85+0
50100150200250300350400450500
1 5 888
377 346
82 70261 1 2
64
9972
16 40
ContributoryUnderlying
Age groups (years)
HIV
Dea
ths
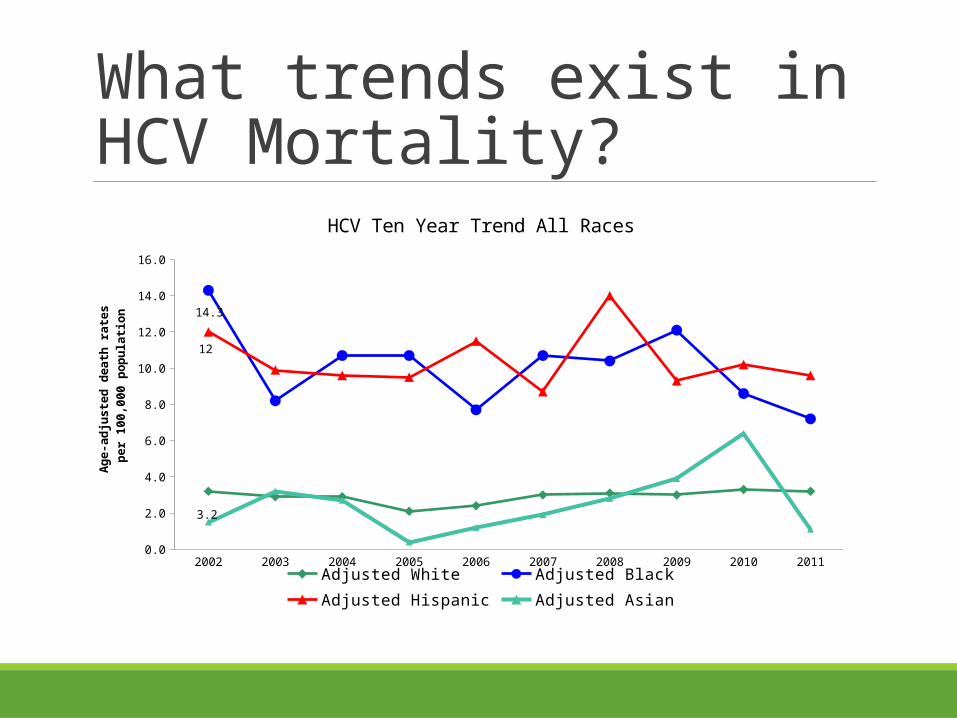
What trends exist in HCV Mortality?
2002 2003 2004 2005 2006 2007 2008 2009 2010 20110.0
2.0
4.0
6.0
8.0
10.0
12.0
14.0
16.0
3.2
14.3
12
HCV Ten Year Trend All Races
Adjusted White Adjusted Black Adjusted Hispanic Adjusted Asian
Ag
e-a
dju
ste
d d
ea
th r
ate
s
pe
r 1
00
,00
0 p
op
ula
tio
n
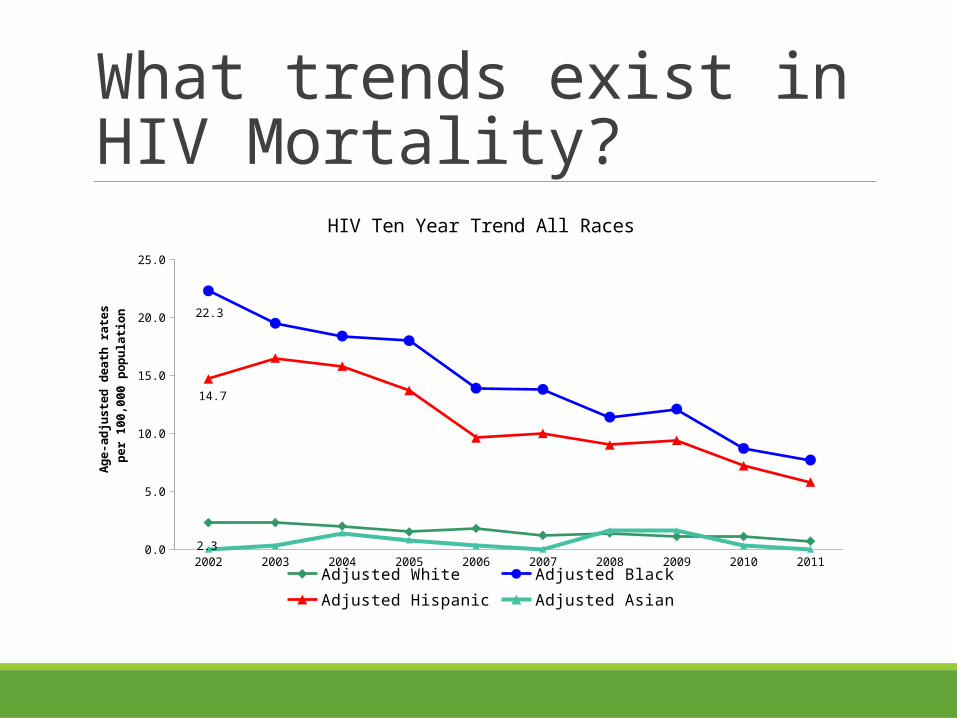
What trends exist in HIV Mortality?
2002 2003 2004 2005 2006 2007 2008 2009 2010 20110.0
5.0
10.0
15.0
20.0
25.0
2.3
22.3
14.7
HIV Ten Year Trend All Races
Adjusted White Adjusted Black Adjusted Hispanic Adjusted Asian
Ag
e-a
dju
ste
d d
ea
th r
ate
s
pe
r 1
00
,00
0 p
op
ula
tio
n
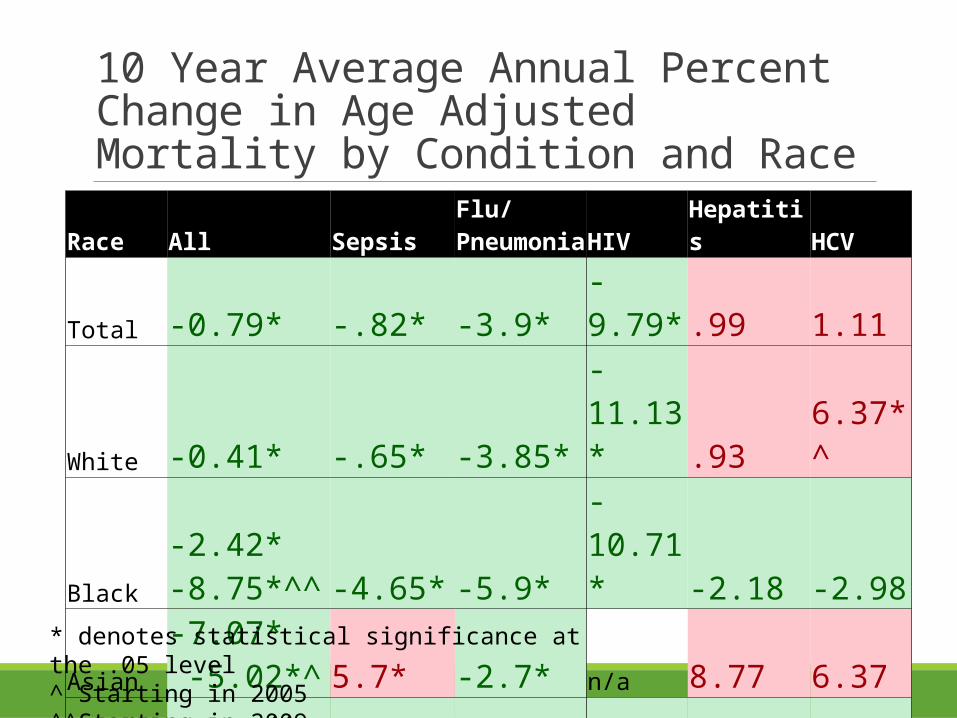
10 Year Average Annual Percent Change in Age Adjusted Mortality by Condition and Race
Race All SepsisFlu/PneumoniaHIV Hepatitis HCV
Total -0.79* -.82* -3.9* -9.79* .99 1.11
White -0.41* -.65* -3.85* -11.13*.93 6.37*^
Black
-2.42*-8.75*^^ -4.65* -5.9* -10.71*-2.18 -2.98
Asian
-7.07* -5.02*^ 5.7* -2.7* n/a 8.77 6.37
Hispanic -5.86* -1.57* -4.18* -10.33*-1.05 -0.65
* denotes statistical significance at the .05 level^ Starting in 2005^^Starting in 2009

Spatial Clusters


Discussion and Conclusions

Discussion Clear disparities exist across race and age groups in each investigated disease
There are clear locations around the state that merit further investigation
◦ South Boston, Worcester, Springfield, New Bedford, Dracut
Significant space-time clustering has occurred

Limitations Death certificates are not always accurate, especially in regards to race and contributing cause of death
Spatial and space-time clusters are difficult to distinguish from noise
It is difficult to select scanning windows in SaTScan
The infectious disease may have been a chronic condition and less of a cause of death

Conclusions Multiple Cause Data is an underutilized resource
There exist clear populations and locations that should be the center of public health focus
Spatial Cluster, and Space-time cluster analyses are valuable resources for mortality data analysis

Acknowledgements Malena Hood
Thomas Stopka
Brandon Olsen
Christine Rioux
Division of Research and Epidemiology, BHIRSE

References Bosetti, C., Bertuccio, P., Levi, F., Lucchini, F., Negri, E., & Vecchia, C. L. (2008). Cancer mortality in the European Union, 1970–2003, with a joinpoint analysis. Annals of Oncology, 19(4), 631–640. doi:10.1093/annonc/mdm597
Brun-Buisson C, Doyon F, Carlet J, & et al. (1995). Incidence, risk factors, and outcome of severe sepsis and septic shock in adults: A multicenter prospective study in intensive care units. JAMA, 274(12), 968–974. doi:10.1001/jama.1995.03530120060042
Burra, T., Jerrett, M., Burnett, R. T., & Anderson, M. (2002). Conceptual and practical issues in the detection of local disease clusters: a study of mortality in Hamilton, Ontario. Canadian Geographer / Le Géographe Canadien, 46(2), 160–171. doi:10.1111/j.1541-0064.2002.tb00737.x
Clegg, L. X., Hankey, B. F., Tiwari, R., Feuer, E. J., & Edwards, B. K. (2009). Estimating average annual per cent change in trend analysis. Statistics in Medicine, 28(29), 3670–3682. doi:10.1002/sim.3733
Feikin, D. R., Schuchat, A., Kolczak, M., Barrett, N. L., Harrison, L. H., Lefkowitz, L., … Jorgensen, J. H. (2000). Mortality from invasive pneumococcal pneumonia in the era of antibiotic resistance, 1995-1997. American Journal of Public Health, 90(2), 223–229.
Getis, A., & Ord, J. K. (1992). The Analysis of Spatial Association by Use of Distance Statistics. Geographical Analysis, 24(3), 189–206. doi:10.1111/j.1538-4632.1992.tb00261.x
Gundogdu, I. B. (2010). Applying linear analysis methods to GIS-supported procedures for preventing traffic accidents: Case study of Konya. Safety Science, 48(6), 763–769. doi:10.1016/j.ssci.2010.02.016
Hsu, C. E., Jacobson, H., & Mas, F. S. (2004). Evaluating the disparity of female breast cancer mortality among racial groups - a spatiotemporal analysis. International Journal of Health Geographics, 3(1), 4. doi:10.1186/1476-072X-3-4
Kanjala, C., Alberts, M., Byass, P., & Burger, S. (2010). Spatial and temporal clustering of mortality in Digkale HDSS in rural northern South Africa. Global Health Action, 3. doi:10.3402/gha.v3i0.5236
Kim, H.-J., Fay, M. P., Feuer, E. J., & Midthune, D. N. (2000). Permutation tests for joinpoint regression with applications to cancer rates. Statistics in Medicine, 19(3), 335–351. doi:10.1002/(SICI)1097-0258(20000215)19:3<335::AID-SIM336>3.0.CO;2-Z
Kulldorff, M., Heffernan, R., Hartman, J., Assunção, R., & Mostashari, F. (2005). A Space–Time Permutation Scan Statistic for Disease Outbreak Detection. PLoS Medicine, 2(3), e59. doi:10.1371/journal.pmed.0020059
Lever, A., & Mackenzie, I. (2007). Sepsis: definition, epidemiology, and diagnosis. BMJ : British Medical Journal, 335(7625), 879–883. doi:10.1136/bmj.39346.495880.AE
Ly, K. N., Xing, J., Klevens, R. M., Jiles, R. B., Ward, J. W., & Holmberg, S. D. (2012). The Increasing Burden of Mortality From Viral Hepatitis in the United States Between 1999 and 2007. Annals of Internal Medicine, 156(4), 271–278. doi:10.7326/0003-4819-156-4-201202210-00004
Mackenbach, J. P., Kunst, A. E., Lautenbach, H., Bijlsma, F., & Oei, Y. B. (1995). Competing Causes of Death: An Analysis using Multiple-Cause-of-Death Data from The Netherlands. American Journal of Epidemiology, 141(5), 466–475.
Manton, K. G. (1980). Sex and Race Specific Mortality Differentials in Multiple Cause of Death Data. The Gerontologist, 20(4), 480–493. doi:10.1093/geront/20.4.480
Martin, G. S., Mannino, D. M., Eaton, S., & Moss, M. (2003). The Epidemiology of Sepsis in the United States from 1979 through 2000. New England Journal of Medicine, 348(16), 1546–1554. doi:10.1056/NEJMoa022139
Melamed, A., & Sorvillo, F. J. (2009). The burden of sepsis-associated mortality in the United States from 1999 to 2005: an analysis of multiple-cause-of-death data. Critical Care, 13(1), R28. doi:10.1186/cc7733
Mj, A., & Ee, M. (1994). The epidemiology of viral hepatitis in the United States. Gastroenterology Clinics of North America, 23(3), 437–455.
Nkhoma, E. T., Hsu, C. E., Hunt, V. I., & Harris, A. M. (2004). Detecting spatiotemporal clusters of accidental poisoning mortality among Texas counties, U.S., 1980 – 2001. International Journal of Health Geographics, 3(1), 25. doi:10.1186/1476-072X-3-25
Qiu, D., Katanoda, K., Marugame, T., & Sobue, T. (2009). A Joinpoint regression analysis of long-term trends in cancer mortality in Japan (1958–2004). International Journal of Cancer, 124(2), 443–448. doi:10.1002/ijc.23911
Redelings, M. D., Sorvillo, F., & Simon, P. (2006). A Comparison of Underlying Cause and Multiple Causes of Death: US Vital Statistics, 2000???2001. Epidemiology, 17(1), 100–103. doi:10.1097/01.ede.0000187177.96138.c6
Rosenberg PS, & Biggar RJ. (1998). Trends in hiv incidence among young adults in the united states. JAMA, 279(23), 1894–1899. doi:10.1001/jama.279.23.1894
Sabel, C. E., Wilson, J. G., Kingham, S., Tisch, C., & Epton, M. (2007). Spatial implications of covariate adjustment on patterns of risk: Respiratory hospital admissions in Christchurch, New Zealand. Social Science & Medicine, 65(1), 43–59. doi:10.1016/j.socscimed.2007.02.040
Soufir, L., MD, Timsit, J., MD, Mahe, C., MD, Carlet, J., MD, Regnier, B., MD, & Chevret, S., MD, PhD. (1999). Attributable Morbidity and Mortality of Catheter Related Septicemia in Critically Ill Patients: A Matched, Risk Adjusted, Cohort Study •. ‐ ‐Infection Control and Hospital Epidemiology, 20(6), 396–401. doi:10.1086/iche.1999.20.issue-6
Stopka, T. J., Krawczyk, C., Gradziel, P., & Geraghty, E. M. (2014). Use of Spatial Epidemiology and Hot Spot Analysis to Target Women Eligible for Prenatal Women, Infants, and Children Services. American Journal of Public Health, 104(S1), S183–S189. doi:10.2105/AJPH.2013.301769
Thompson WW, Shay DK, Weintraub E, & et al. (2003). Mortality associated with influenza and respiratory syncytial virus in the united states. JAMA, 289(2), 179–186. doi:10.1001/jama.289.2.179
Woodhead, M. ., Macfarlane, J. ., Mccracken, J. ., Rose, D. ., & Finch, R. . (1987). PROSPECTIVE STUDY OF THE AETIOLOGY AND OUTCOME OF PNEUMONIA IN THE COMMUNITY. The Lancet, 329(8534), 671–674. doi:10.1016/S0140-6736(87)90430-2