a multiphase mps method for bubbly flows with complex
TRANSCRIPT
Ocean Engineering 238 (2021) 109743
Available online 30 August 20210029-8018/© 2021 Elsevier Ltd. All rights reserved.
A multiphase MPS method for bubbly flows with complex interfaces
Xiao Wen , Weiwen Zhao , Decheng Wan *
Computational Marine Hydrodynamics Lab (CMHL), School of Naval Architecture, Ocean and Civil Engineering, Shanghai Jiao Tong University, Shanghai, 200240, China
A R T I C L E I N F O
Keywords: MPS Numerical simulation Multiphase flows Bubbly flows Complex interface
A B S T R A C T
The bubbly flows have always been a key research object in the field of multiphase simulations. However, when the bubbly flows become violent to cause the large deformations of bubbles, complex interfaces may be generated and bring great challenges to the traditional mesh-based methods. To overcome this challenge, one of the most commonly used mesh-free particle methods - moving particles semi-implicit (MPS) method, is adopted in this paper for the numerical simulations of bubbly flows with complex interfaces. Firstly, a multiphase MPS method is developed by combining the single-phase improved MPS (IMPS) method proposed in our previous study with different multiphase models, including the improved density smoothing scheme, interparticle vis-cosity model, continuous acceleration model, surface tension model, incompressible-compressible model and multiphase collision model. Then, the deformations of 2D/3D square droplets are simulated to validate the surface tension model, and the multiphase MPS method is verified through the benchmark cases of 2D/3D single bubble rising with large density and viscosity ratios (up to 1000 and 100, respectively). Finally, a series of bubbly flows with increasing complexity are performed, including the bubble rising and breaking at a high Reynolds number, the co-axial coalescence of two bubbles with different radiuses, and the violent interactions between a set of bubbles. The MPS results keep fair agreements with other numerical and experimental results, through which the advantages of the present multiphase MPS method in bubbly flows with complex interfaces can be well demonstrated.
1. Introduction
The bubbly flows are not only a kind of complex flow phenomenon commonly found in nature, but also play important roles in various in-dustrial processes such as the oil production (Massoud et al., 2020; Chen et al., 2020), underwater explosion (Klaseboer et al., 2005; Yu et al., 2021), ship wake (Zhang and Liu, 2020; Murai et al., 2020; Zhang et al., 2021), etc. A better understanding of the dynamic characteristics of bubbly flows would be great help to the optimization of industrial processes and design of more efficient and economical equipment. During the past decades, bubbly flows have been widely investigated using advanced experimental facilities and measuring techniques. For example, Trevorrow et al. (1994) employed the acoustic experimental techniques for the bubble wake measurements behind three surface ships, and it is found that the wake bubbles last as strong acoustic scatterers for approximately 7.5 min with a maximum width of 60 m. The bubbles in a CBM wellbore annulus are detected by Wu et al. (2018) using a bubble probe designed based on the apparent difference in
conductivity between two media. According to the results of bubble detection, the two-phase flow patterns can be well monitored and the mean density of the two-phase flow is obtained. Abbaszadeh et al. (2021) proposed a new bubbly flow measurement procedure based on the optical scattering behavior of a laser-beam passing through a bubbly flow, which can be successfully applied to capture the bubbly wake of ship models in the towing tank tests (Abbaszadeh et al., 2020).
Given the complexity and high cost of experimental research, a va-riety of Computational Fluid Dynamics (CFD) methods, such as the Volume Of Fluid (VOF), Level Set (LS) and Front Tracking (FT), are introduced into the numerical simulations of bubbly flows and proven capable to obtain additional information and insight (Annaland et al., 2005; Croce et al., 2010; Pan and Chen., 2014; Ma et al., 2020; Tian et al., 2021). However, an important common feature of the above CFD methods is that they all belong to mesh-based methods, in which the discretization of fluid domain is implemented in a Eulerian mesh system. To trace the phase interfaces in the mesh system, complex interface-capturing or front-tracking algorithms need to be executed at
* Corresponding author. E-mail address: [email protected] (D. Wan).
Contents lists available at ScienceDirect
Ocean Engineering
journal homepage: www.elsevier.com/locate/oceaneng
https://doi.org/10.1016/j.oceaneng.2021.109743 Received 18 May 2021; Received in revised form 20 August 2021; Accepted 23 August 2021
Ocean Engineering 238 (2021) 109743
2
each time step, which brings two main deficiencies. Firstly, the imple-mentation of these algorithms is in fact to reconstruct the interfaces, thus additional computational errors are inevitably produced during this process. Secondly, when the bubbly flows are violent to cause the large deformations of bubbles, complex interfaces may be generated and bring great challenges to the accuracy of these algorithms.
In recent decades, the mesh-free methods, such as smoothed particle hydrodynamics (SPH) method (Gingold and Monaghan, 1977; Lucy,
1977) and moving particle semi-implicit (MPS) method (Koshizuka and Oka, 1996; Koshizuka et al., 1998), have been proposed as the next generation of CFD methods. Different from the mesh-based methods, the discretization of fluid domain in mesh-free methods is carried out by the use of a set of interacting particles. The motions of particles follow the governing equations in Lagrangian description and there is no constant topology relationship existing between particles. From the distribution of particles, the interfaces can be directly obtained without special al-gorithms. Therefore, the mesh-free methods are particularly feasible in dealing with multiphase problems with complex interfaces. In the field of bubbly flows, an early research is conducted by Colagrossi and Landrini (2003), in which the rising and breaking of a single bubble are simulated by SPH method and the captured interface shows a good agreement with the results of Level Set. With an improved multi-fluid SPH formulation, Grenier et al. (2013) performed the simulations of various bubbly flows, including the evolution of an isolated bubble, the merging of two bubbles, and the oil/water separation process. In all cases, good agreements are achieved between SPH results and reference solutions. Moreover, the influence of Bond number on the evolutions of bubbly flows is well analyzed. Considering that most of existing re-searches focused on 2D simulations, Zhang et al. (2015) and Duan et al. (2017) investigated the dynamic behaviors of 3D bubbly flows with the multiphase SPH and MPS methods, respectively.
In MPS method, a semi-implicit algorithm is adopted and the pres-sure field is calculated by solving the Poisson Pressure Equation (PPE), thus the incompressibility of fluids can be guaranteed and the simulation is more stable than SPH method, which adopts an explicit algorithm based on the Equation of State (EoS). Since it was originally proposed by Koshizuka and Oka (1996), the MPS method has been widely used in violent free surface flows (Khayyer and Gotoh, 2008; Zhang et al., 2014; Tang et al., 2016; Zhang and Wan, 2018). However, due to its short
Fig. 1. Schematic sketch of the density smoothing scheme.
Fig. 2. Schematic sketch illustrating the effect of continuous acceleration model.
Fig. 3. Implementation of surface tension force in continuum surface force (CSF) method.
X. Wen et al.

Ocean Engineering 238 (2021) 109743
3
Fig. 4. Description of procedures to calculate interface curvature in CCFS model.
Fig. 5. Flowchart of multiphase MPS method with GPU acceleration technique.
X. Wen et al.
Ocean Engineering 238 (2021) 109743
4
history, the development of multiphase methods in MPS is immature and the applications of MPS method in bubbly flows are far less extensive than that of the mesh-based method or SPH method. Moreover, the calculation efficiency of MPS method is greatly limited by the huge computational cost on neighbor particle searching and PPE solving, thus it is difficult to deal with the more complicated calculation process and the sharp increase of particle number when extended to multiphase flows.
In this paper, a multiphase MPS method would be firstly developed
by introducing a set of multiphase models into the single-phase improved MPS (IMPS) method proposed in our previous studies (Zhang and Wan, 2012, 2017). Specially, the improved density smoothing scheme and interparticle viscosity model (Shakibaeinia and Jin, 2012) are adopted to solve the instability and inaccuracy caused by abrupt drop of density and viscosity across the phase interface. Then, the continuous acceleration model (Duan et al., 2017) is applied to keep the continuity of acceleration field, which is important for multiphase problems with high density ratios. In order to reproduce the bubble
Fig. 6. Schematic diagrams of computational domain for 2D/3D square droplet’s deformations.
Fig. 7. The deformations of the 2D square droplet at different time.
Fig. 8. The calculated pressure drop across the phase interface.
X. Wen et al.

Ocean Engineering 238 (2021) 109743
5
Fig. 9. Simulation results of 3D square droplet’s deformation.
Fig. 10. Schematic diagram of 2D/3D single bubble rising.
X. Wen et al.
Ocean Engineering 238 (2021) 109743
6
deformation, surface tension effects are considered by the use of con-tinuum surface force (CSF) model (Brackbill et al., 1992). Moreover, an incompressible-compressible model (Khayyer and Gotoh, 2016) is employed to solve the liquid and bubble phases as incompressible and compressible, respectively. The multiphase collision model (Shakibaei-nia and Jin, 2012) is adopted to deal with possible particle collisions and keep the uniform particle distribution. Finally, the GPU (Graphics Pro-cessing Unit) acceleration technique (Chen and Wan, 2019) developed in our previous study for single-phase simulations is extended and applied, thus the present multiphase MPS method is capable to simulate large-scale 3D bubbly flows with more than two million particles.
With the proposed multiphase MPS method, a series of bubbly flows with increasing complexity are simulated, with a wide range from 2D to 3D, and from single bubble to multiple bubbles. Firstly, in consideration of its importance in bubbly flows, the surface tension model is validated through the simulations of deformations of 2D/3D square droplets. Then, the multiphase MPS method is applied to sumulate 2D/3D single bubble rising with large density and viscosity ratios (up to 1000 and 100, respectively), and the numerical results are compared with the
benchmark results (Hysing et al., 2008; Alexander et al., 2014). Given that the Reynolds number in the benchmark study is relatively low (Re = 35), the bubble rising and breaking at a high Reynolds number (Re =35843) is further studied. Afterwards, the bubbly flows with two or multiple bubbles are respectively simulated, in which the interfaces become more complex due to the violent interactions between bubbles. The expected advantage of multiphase MPS method in capturing com-plex interfaces is demonstrated by comparison with other numerical and experimental results. Moreover, the relationship between the interface evolution and the Bond number is investigated and the mechanism of dynamic behaviors of bubbly flows is analyzed in detail.
2. Multiphase MPS method
2.1. Governing equations
In MPS method, the motion of particles is governed by the continuity and momentum equations in Lagrangian form (Koshizuka and Oka, 1996), written as
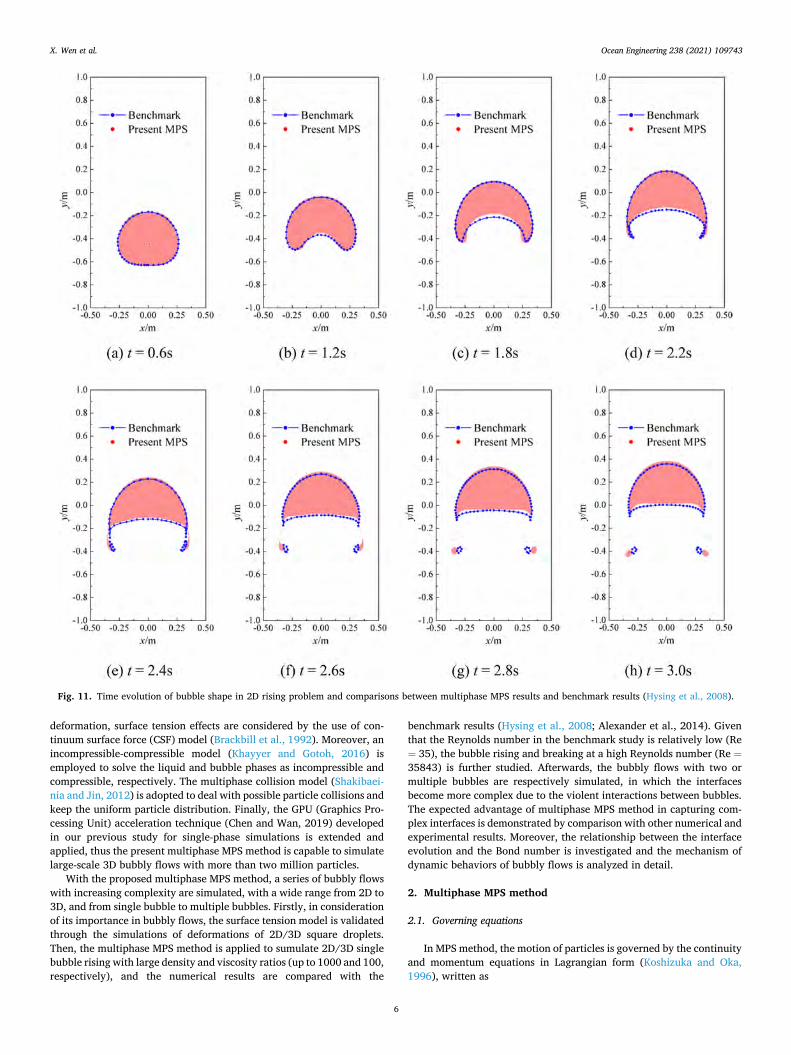
Fig. 11. Time evolution of bubble shape in 2D rising problem and comparisons between multiphase MPS results and benchmark results (Hysing et al., 2008).
X. Wen et al.
Ocean Engineering 238 (2021) 109743
7
DρDt
= − ρ(∇ ⋅ u) (1)
ρ DuDt
= − ∇P + FV + FB + FS (2)
where ρ, u, and P are the density, velocity and pressure, respectively. ∇P, FV, FB and FS denote the pressure gradient, viscous force, body force, and surface tension force, which are the four main forces in the bubbly flows studied in this paper. In the present multiphase MPS method, the multiphase system is considered as a single-fluid system, thus the gov-erning equations for different phases are uniform and can be solved simultaneously. To deal with the abrupt drop of density and viscosity across the phase interface, the multi-density and multi-viscosity models are employed.
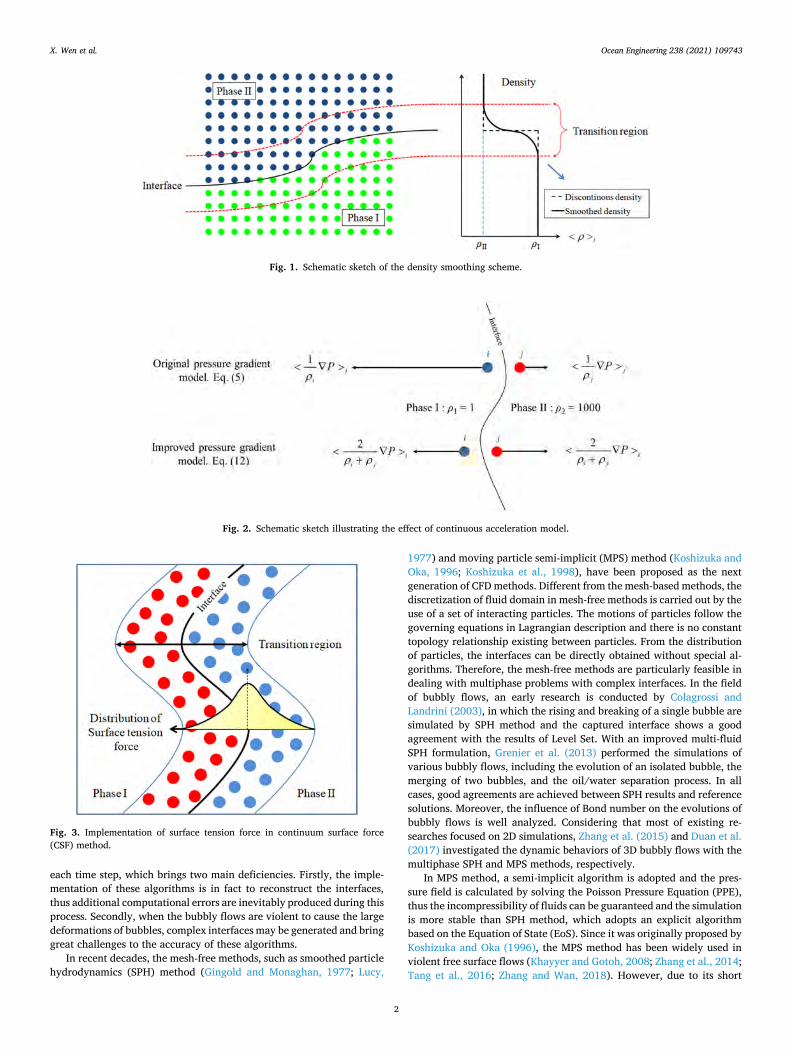
In the multi-density model, an improved density smoothing scheme is proposed on the basis of the scheme of Shakibaeinia and Jin (2012), which realizes the smooth transition of density field by performing the spatial weighted averaging of density for particles near the phase interface, as shown in Fig. 1. With the improved scheme, the smoothed density field can be obtained by
< ρ>i =
ρiWself +∑
j∈IρjW
(rij, re
)
Wself +∑
j∈IW(rij, re
) (3)
where I includes the target particle i and all its neighboring particles. Wself is a weight function to amplify the effect of the target particle itself on the smoothed density, through which the sharpness of density
variation across the phase interface can be better preserved. In the multi-viscosity model, the interparticle viscosity with a har-
monic mean form (Shakibaeinia and Jin, 2012) is employed to substitute the real particle viscosity, so that the viscous force between particles of different phases can be accurately calculated. With the interparticle viscosity, the viscous force term in Eq. (2) can be calculated according to the following formation:
FV = μ∇2u = 2Dn0λ∑
j∕=i
2μiμj
μi + μj
(uj − ui
)⋅W(rij, re
)(4)
2.2. Particle interaction models
Particle interaction models in MPS method are utilized to discretize the differential operators in governing equations, consisted of gradient model, divergence model and Laplacian models (Koshizuka and Oka, 1996), which are respectively defined as
<∇φ>i =Dn0
∑
j∕=i
φj − φirj − ri|
2
(
rj − ri
)
⋅ W
(
rij, re
)
(5)
<∇ ⋅ Φ>i =Dn0
∑
j∕=i
(Φj − Φi
)
rj − ri|
2
(rj − ri
)⋅ W
(
rij, re
)
(6)
<∇2φ>i =2Dn0λ
∑
j∕=i
(φj − φi
)
⋅ W
(
rij, re
)
(7)
where φ is an arbitrary scalar function, Ф is an arbitrary vector, D is the number of space dimensions, n0 is the particle number density at initial arrangement, λ is a parameter defined as
λ=
∑
j∕=iW(
rij, re
)⋅rj − ri|
2
∑
j∕=iW(rij, re
) (8)
which is applied to keep the variance increase equal to that of the analytical solution. The kernel function W(rij, re) used here is the non-singular one suggested by Zhang and Wan (2012):
W(rij, re
)=
⎧⎨
⎩
re
0.85rij + 0.15re − 1 (0 ≤ r < re)
0 (re ≤ r)(9)
where r and re represent the particle distance and the largest radius of the particle interaction, respectively. When the particle distance is larger than a certain threshold, the kernel function becomes zero value and no interaction exists. The improved kernel function obtains a finite value when the particle distance is equal to zero, thus the singularity problem of the original kernel function (Koshizuka and Oka, 1996) can be avoided.
2.3. Semi-implicit algorithm
In MPS method, a semi-implicit algorithm is utilized to keep the incompressibility of fluid, in which each time step is subdivided into two separate steps. In the first step (also called prediction step), the temporal velocity field is explicitly calculated according to viscosity, gravity, and surface tension forces. In the second step (also called correction step), the Poisson Pressure Equation (PPE) is solved to obtain the pressure field, with which the velocity and location of particles are finally updated to the next time step. In this paper, we employ the improved PPE with a mixed source term, which is firstly proposed by Tanaka and Masunaga (2010) and rewritten by Lee et al. (2011a):
< ∇2Pn+1>i = (1 − γ)ρ
Δt∇⋅u*
i − γρ
Δt2< n*>i − n0
n0 (10)
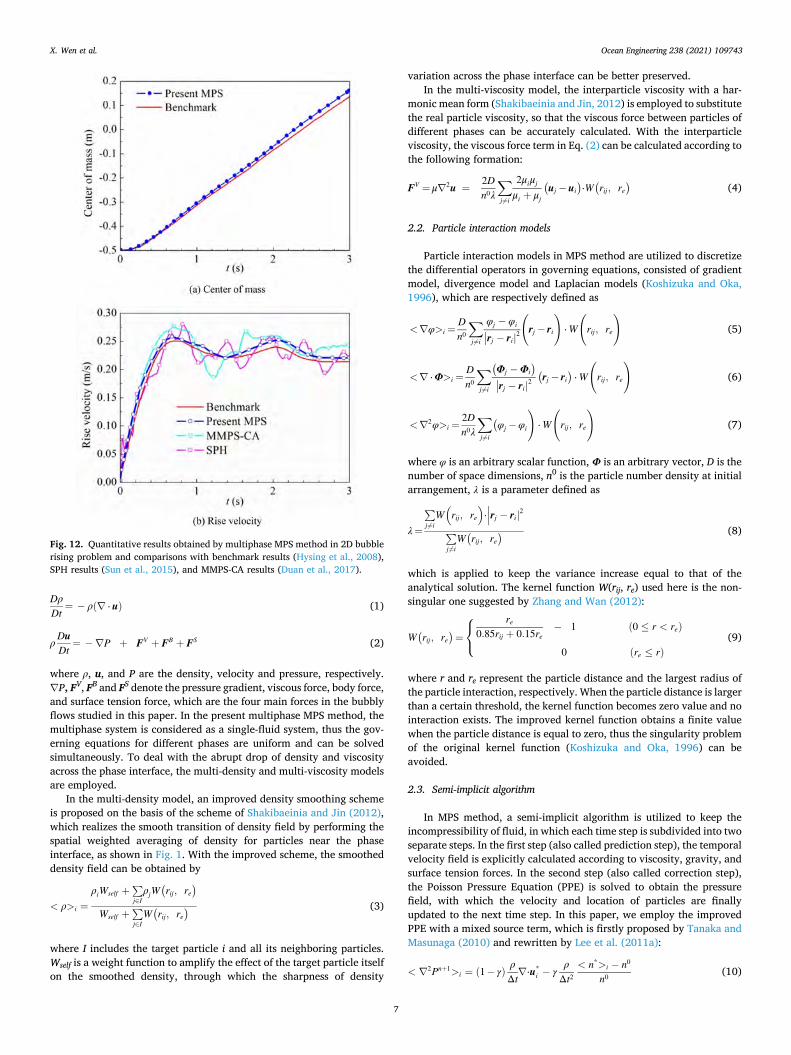
Fig. 12. Quantitative results obtained by multiphase MPS method in 2D bubble rising problem and comparisons with benchmark results (Hysing et al., 2008), SPH results (Sun et al., 2015), and MMPS-CA results (Duan et al., 2017).
X. Wen et al.
Ocean Engineering 238 (2021) 109743
8
where γ is a blending parameter less than 1. The source term on the right-hand of Eq. (10) represents a combination of the divergence-free incompressible condition and the particle number density incompress-ible condition, respectively, which proves to be effective to suppress the pressure oscillations in original MPS method.
To consider the compressibility of bubble phase, an incompressible- compressible model is included in the present multiphase MPS method, by introducing a compressible term into the source term of PPE. Similar with the studies of Khayyer and Gotoh (2016) and Duan el al. (2017), the compressible term derived from Equation of State (EoS) is adopted, with which the formation of PPE turns into:
⟨∇2Pk+1⟩i =(1 − γ)ρ
Δt∇ ⋅ u*
i − γρ
Δt2⟨nk⟩i − n0
n0 +1
Δt2C2sPi
n+1 (11)
where CS is the speed of sound. Moreover, the compressible term could be moved to the left-hand side of PPE in the solution process, thus the diagonal elements of the PPE matrix become larger and the stability of pressure calculation can be improved (Tanaka and Masunaga, 2010).
2.4. Continuous acceleration model
For the bubbly flow with high density ratio, a huge discrepancy of acceleration may exist on two sides of the phase interface. According to the original pressure gradient model of Eq. (5), the pressure gradient forces between a pair of interacting particles have the same value. When the two particles belong to different phases, the acceleration of the lighter particle would be much larger than that of the heavier particle due to the high density ratio, generating a discontinuous acceleration field which may cause blow-up instability.
In the present multiphase MPS method, the continuous acceleration model (Duan et al., 2017) is employed to improve the stability in sim-ulations of bubbly flows with high density ratios. The main ideal of this model is to introduce the concept of interparticle density into both the pressure gradient model and the PPE solving. Firstly, an improved pressure gradient model with the interparticle density should be adop-ted, written as:
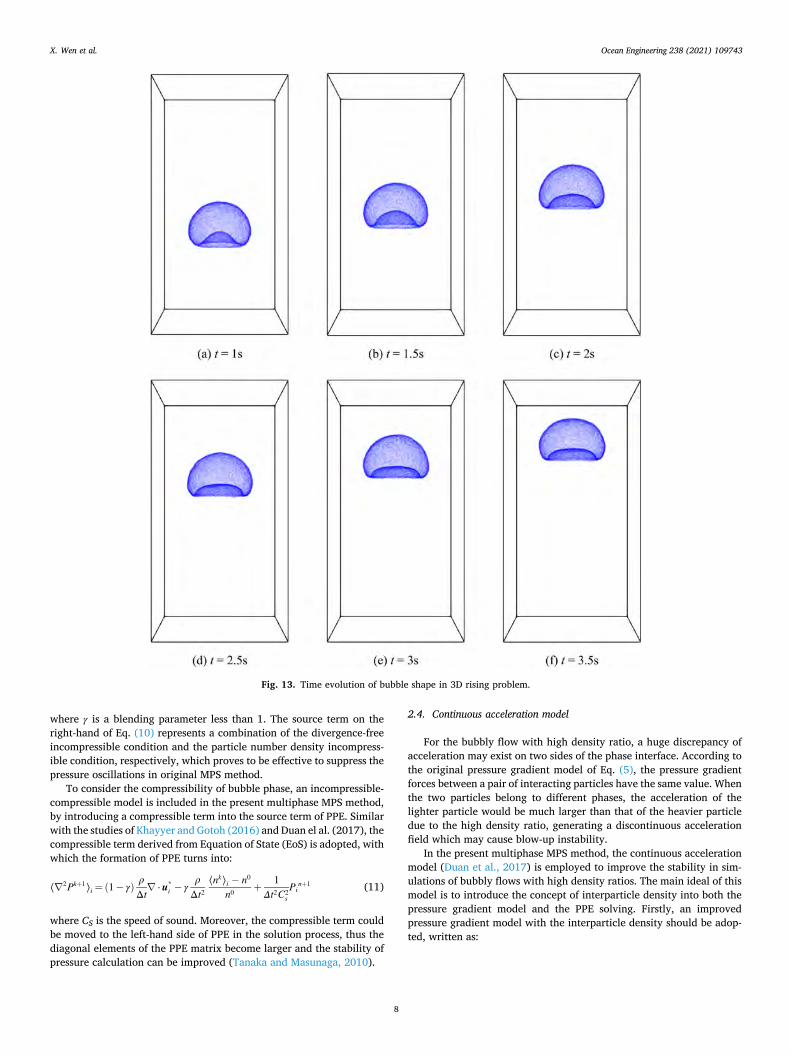
Fig. 13. Time evolution of bubble shape in 3D rising problem.
X. Wen et al.
Ocean Engineering 238 (2021) 109743
9
<2
ρi + ρj∇P>i =
Dn0
∑
j∕=i
2(Pj − Pi
)
ρi + ρj
(rj − ri
)
rj − ri|
2 ⋅ W
(
rij, re
)
+Dn0
∑
j∕=i
(Pi − P′
i,min)
ρi
(rj − ri
)
rj − ri|
2 ⋅ W
(
rij, re
)
(12)
where P′
i,min represents the minimal pressure among the same-phase neighboring particles of particle i. The first term on the right-hand of Eq. (12) is a modified form of the original pressure gradient model, in which the use of interparticle density guarantees an identical accelera-tion for the lighter and heavier particles. As shown in Fig. 2, when the density ratio is equal to 1:1000, the acceleration ratio calculated by original model is also 1:1000, while the improved model can obtain the same particle acceleration on two sides of interface and keep the con-tinuity of acceleration field. The second term on the right-hand of Eq. (12) can be regarded as a particle stabilizing term (PST) which exerts an artificial force on target particles with a direction from the dense particle region to the dilute region, thus the uniform distribution of particles can be better maintained.
Moreover, in the transition region, the pressure field suffers from great changes due to the rapid variation of density field. Therefore, a large pressure gradient may be generated and causes the violent movement of particles, especially for the lighter particles. In order to keep the smoothness of pressure field, the PPE with inter-particle den-sity is adopted in the present multiphase MPS method, with which the left-hand side of PPE can be discretized as:
<2
ρi + ρj∇2Pn+1>i =
2Dn0λ∑
j∕=i
2ρi + ρj
(Pn+1
j − Pn+1i
)⋅W(rij, re
)(13)
2.5. Surface tension model
Surface tension force has important influence on the deformation of bubble. In the present multiphase MPS method, the surface tension model follows the continuum surface force (CSF) model proposed by Brackbill et al. (1992), which is also one of the most widely used surface tension models in mesh-based or mesh-free methods. In CSF model, the surface tension force is converted into a kind of body force distributed in the transition region, as shown in Fig. 3. The value of surface tension
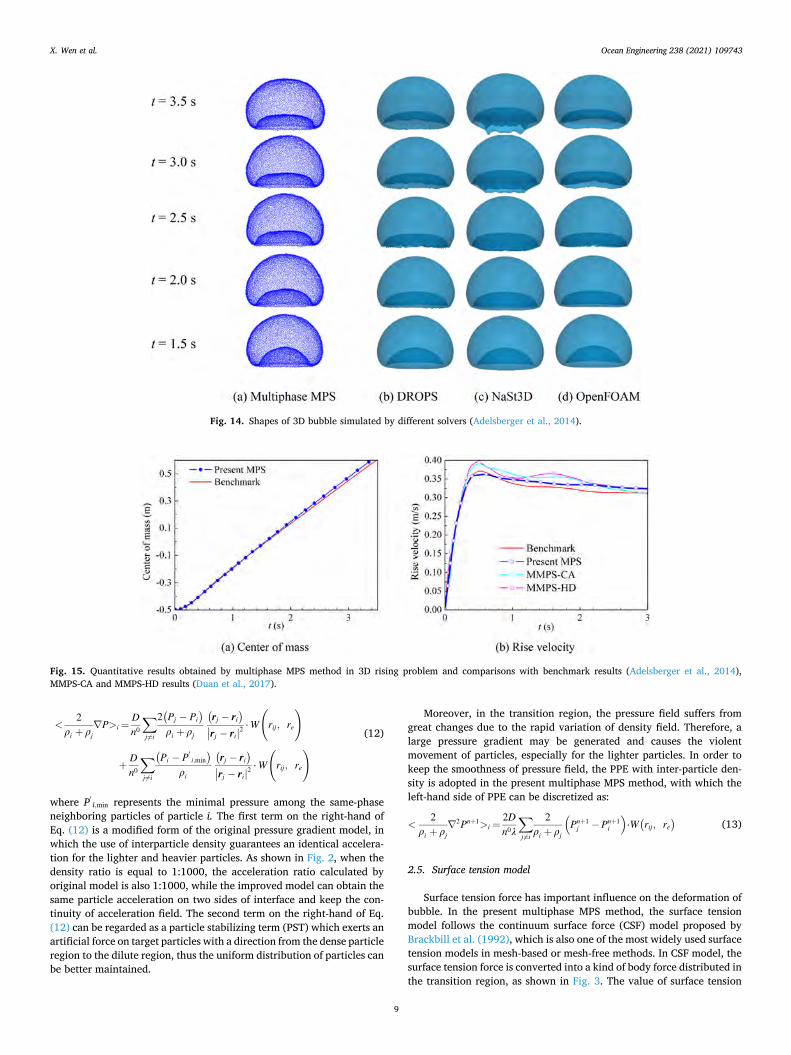
Fig. 14. Shapes of 3D bubble simulated by different solvers (Adelsberger et al., 2014).
Fig. 15. Quantitative results obtained by multiphase MPS method in 3D rising problem and comparisons with benchmark results (Adelsberger et al., 2014), MMPS-CA and MMPS-HD results (Duan et al., 2017).
X. Wen et al.
Ocean Engineering 238 (2021) 109743
10
force can be calculated with the following equation:
FS = − σκ∇C (14)
where σ is the surface tension coefficient, κ is the interface curvature, ∇C is the gradient of color function.
In this paper, the density-weighted color function (Zhang et al., 2015) is employed to keep the continuity of surface tension force, which is defined as
Cij=
⎧⎪⎨
⎪⎩
0 if particle i and j belong to the same phase
2ρi
ρi+ρj if particle i and j belong to different phase
(15)
As to the calculation of interface curvature κ, the analytical method proposed in the contoured continuum surface force (CCSF) model (Duan et al., 2015) is applied. The main ideal of this method is to approximate phase interfaces by the contours of smoothed color function (Fig. 4). In the first step, the smoothed color function f at an arbitrary location (x, y) can be obtained by performing a spatial weighted averaging of the above color function:
f (x, y)=∑
jCjG(rij, rs
)
∑jG(rij, rs
) , G(rij, rs
)=
9πr2
sexp(
−9rij
2
rs2
)
(16)
with the smoothed color function known, the local contour passing through particle i can be obtained through a Taylor series expansion:
fx,i(x − xi)+ fy,i(y − yi)+12fxx,i(x − xi)
2 + fxy,i(x − xi)(y − yi)+12fyy,i(y − yi)
2=0
(17)
where the subscripts x and y represent the partial derivatives with respect to x and y, respectively.
Finally, the interface curvature at particle i can be analytically calculated as
κi =y′′
(1 + y′
i)3/2 =
2fx,ify,ifxy,i − f 2x,ifyy,i − f 2
y,ifxx,i(
f 2x,i + f 2
y,i
)3/2 (18)
Moreover, the above derivation is also be applicable for 3D model. The only difference is that the derivatives of smoothed color function with respect to variable z should be considered. Therefore, the mean curvature in 3D model can be calculated as
2.6. Multiphase collision model
When particle distance becomes too small, the uniform distribution of particles is no longer satisfied and unphysical penetrations between different phases are likely to occur. In the present method, the multi-phase collision model (Shakibaeinia and Jin, 2012) is employed to exert an additional repulsive force when particle distance is below a certain threshold. This model considers the collision of particles as the collision of two spheres with different masses. Initially, different particles are uniformly distributed with an constant distance l0. If the distance be-tween any two particles becomes smaller than α times of l0 during the simulation, the particle collision is assumed to happen and the velocities of particles are corrected based on the following equations:
u′
i = ui −1ρi(1+ ε)
ρiρj
ρi + ρjun
ij (20)
u′
j = uj +1ρj(1+ ε)
ρiρj
ρi + ρjun
ij (21)
where u′
i is the velocity vector of particles after collision, unij is the normal
relative velocity of particles i and j, and ε is the collision ratio.
2.7. Boundary conditions
The wall boundary conditions in MPS include the free-slip and no- slip wall conditions. To impose the boundary conditions, the concept of mirror particle (Lee et al., 2011b) is introduced to replace the wall and dummy particles in the calculation of viscous force. The positions of mirror particles are symmetrical to corresponding fluid particles about the wall, and the velocities of mirror particles are calculated with the follow equations:
(1) free-slip condition
umirror ⋅ t = ui⋅t, umirror⋅n = (2uw − ui)⋅n (22)
(2) no-slip condition
umirror ⋅ t = (2uw − ui)⋅t, umirror⋅n = (2uw − ui)⋅n (23)
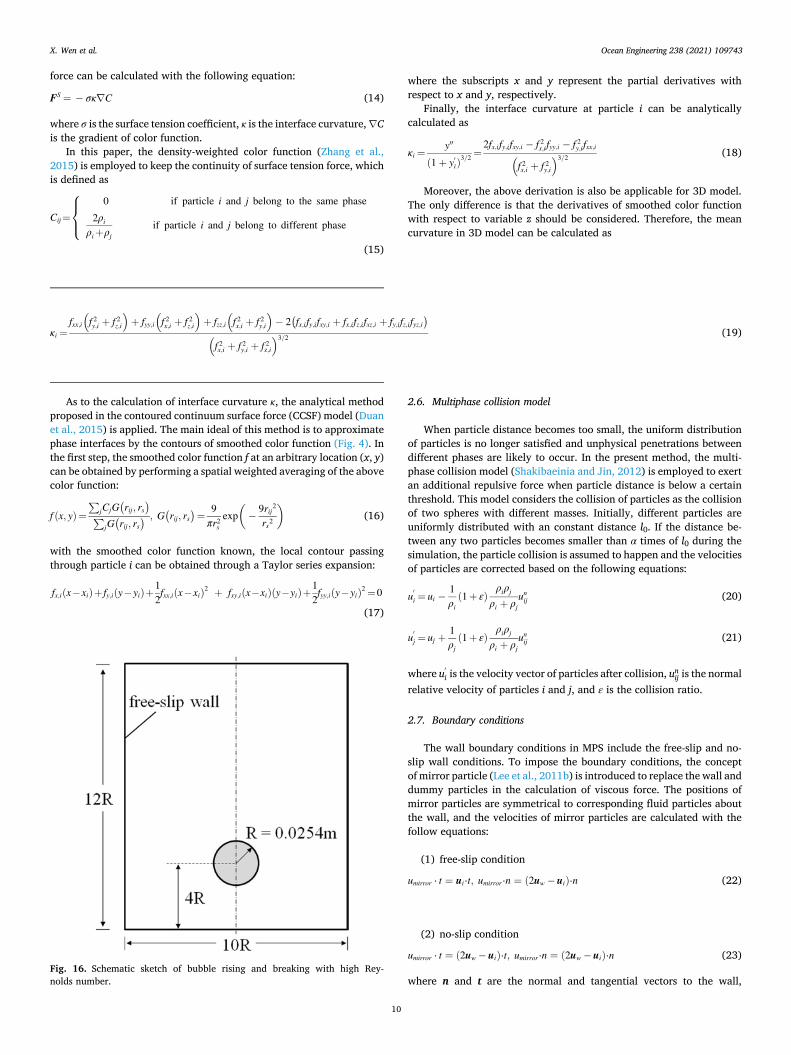
where n and t are the normal and tangential vectors to the wall, Fig. 16. Schematic sketch of bubble rising and breaking with high Rey-nolds number.
κi =fxx,i
(f 2y,i + f 2
z,i
)+ fyy,i
(f 2x,i + f 2
z,i
)+ fzz,i
(f 2x,i + f 2
y,i
)− 2(fx,ify,ifxy,i + fx,ifz,ifxz,i + fy,ifz,ifyz,i
)
(f 2x,i + f 2
y,i + f 2z,i
)3/2 (19)
X. Wen et al.

Ocean Engineering 238 (2021) 109743
11
respectively. The subscripts mirror, w and i represent the mirror, wall and corresponding fluid particles, respectively.
2.8. GPU acceleration technique
Due to its multi-core architecture, GPU (Graphics Processing Unit) is quite suitable for large-scale parallel computing, and has been widely applied in high-performance computing (Crespo et al., 2011; Zhao et al., 2017; Chow et al., 2018). For MPS method, the GPU acceleration technique has been successfully applied in the simulations of single-phase flows (Hori et al., 2011; Zhu et al., 2011; Xie et al., 2020)
However, up to now, there have been few studies on the applications of GPU in the multiphase MPS simulations.
In this paper, the GPU acceleration technique developed based on the IMPS method (Chen and Wan, 2019a, 2019b, 2019b) is further extended into the present multiphase MPS method. Fig. 5 shows the flowchart of multiphase MPS method with GPU acceleration technique. As it can be seen, both CPU and GPU are utilized but with different tasks. The CPU works as a host part to deal with logical works, environment configu-ration, instructions for setting parallelism and communicating data be-tween CPU and GPU. The GPU works as a device part, which is responsible for all the parallel computing. Benefiting from simultaneous
Fig. 17. MPS snapshots of bubble shapes at some typical time instants (upper); The experimental snapshots in study of Walters and Davidson (1962) (lower).
X. Wen et al.
Ocean Engineering 238 (2021) 109743
12
solution of different phase in this paper, the calculation processes of single-phase and multiphase MPS method are basically consistent except for the insertion of above multi-phase models, thus the speedup of GPU in multiphase simulation can be considered as the same as that in single-phase simulation.
3. Numerical simulations
3.1. Deformations of 2D/3D square droplets
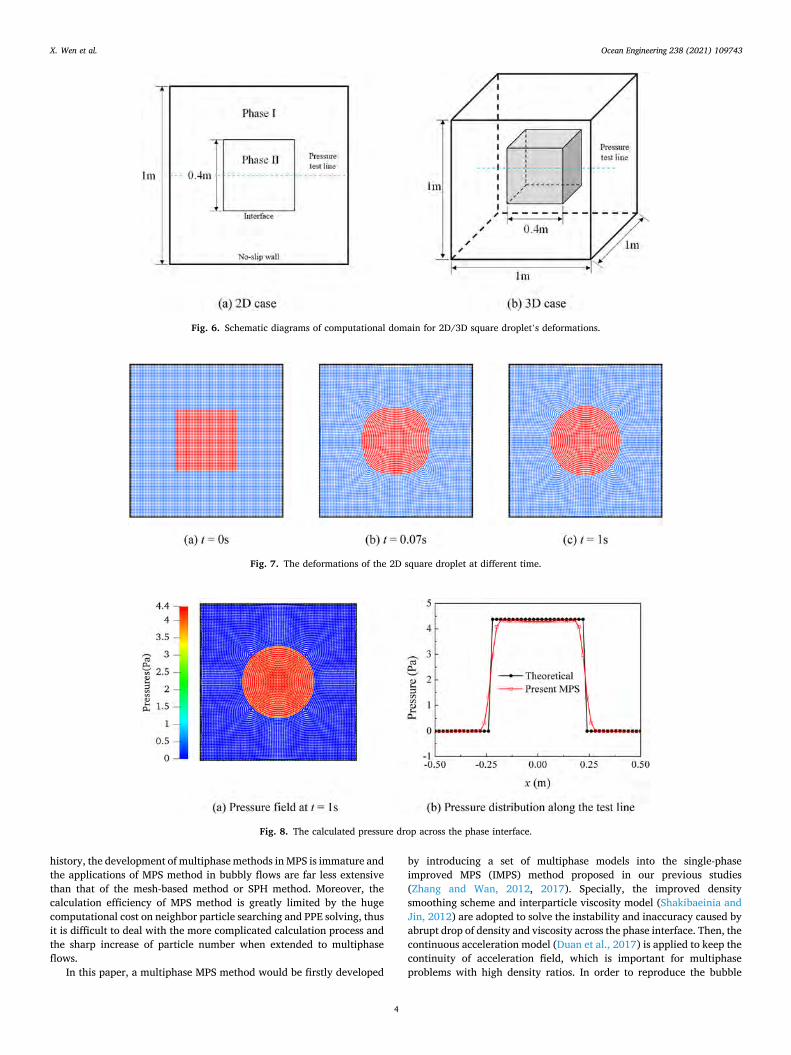
The surface tension model is critical to simulate bubbly flows with deformed interfaces. To validate the surface tension model in the present multiphase MPS method, deformations of 2D/3D square droplets are simulated in this section. The initial conditions for 2D/3D cases are shown in Fig. 6(a) and Fig. 6(b), respectively. In 2D case, an initial square droplet with a length of 0.4 m on each side is arranged in the middle of the calculation domain with a size of 1 m × 1 m. The densities of droplet and surrounding fluids are both 1 kg/m3 and the dynamic viscosities are both 0.2 m2/s. The surface tension coefficient is σ = 1 N/ m, and the gravitational force is ignored. All boundary conditions are set as no-slip wall. The initial condition in 3D case is similar with the 2D case, but the droplet and calculation domain are expanded into 3D. In both cases, the fluid pressures along the horizontal ordinate are measured and recorded.
The deformations of 2D square droplet simulated by multiphase MPS method are presented in Fig. 7. As it can be seen, due to the relatively larger interface curvature, four corners of the square droplet are firstly
drove by surface tension force at t = 0.07 s, and the four edges move away from the center of droplet. Then, the droplet continues to deform and gradually turns into an almost perfect circle at t = 1 s.
According to the Laplace-law, the pressure inside the droplet is ex-pected to be higher than that of the surrounding fluid after the fluid field becomes stable. For 2D droplet, the pressure drop can be estimated as:
ΔP=Pa − Pb =σR=
σπ
√
L(24)
where R is the final radius of the droplet. According to Eq. (24), the theoretical value of pressure drop in this case is equal to 4.431 Pa. In Fig. 8, the pressure distribution and pressure drop predicted by multi-phase MPS method are presented and compared with the theoretical results. From the pressure distribution in Fig. 8(a), obvious pressure drop can be observed between the droplet and surrounding fluid, and in Fig. 8(b), a good agreement is achieved between the calculated pressure profiles with the theoretical value from Laplace-law.
The simulation results of 3D square droplet’s deformation are shown in Fig. 9. From the droplet deformations presented in Fig. 9(a–c), similar trend with the 2D case can be observed. At t = 0.12 s, the eight corners of the 3D droplet are firstly drove by surface tension force and six faces move away from the center of droplet. At t = 1 s, the droplet becomes an almost perfect sphere droplet. Fig. 9(d) compares the calculated pressure profiles with the theoretical value. Noted that in 3D case, the formula-tion used to calculate the pressure drop becomes
ΔP=Pa − Pb =2σR
=2σ ×
4π/33
√
L(25)
Therefore, the theoretical value of pressure drop in 3D case is equal to 8.056 Pa. Again, the calculated pressure profiles show a good agreement with the theoretical value, validating the accuracy of surface tension model in the present multiphase MPS method.
3.2. Benchmark tests of 2D/3D single bubble rising
The single bubble rising is the simplest but also the most common bubbly flow in nature. In this section, the simulations of 2D/3D single
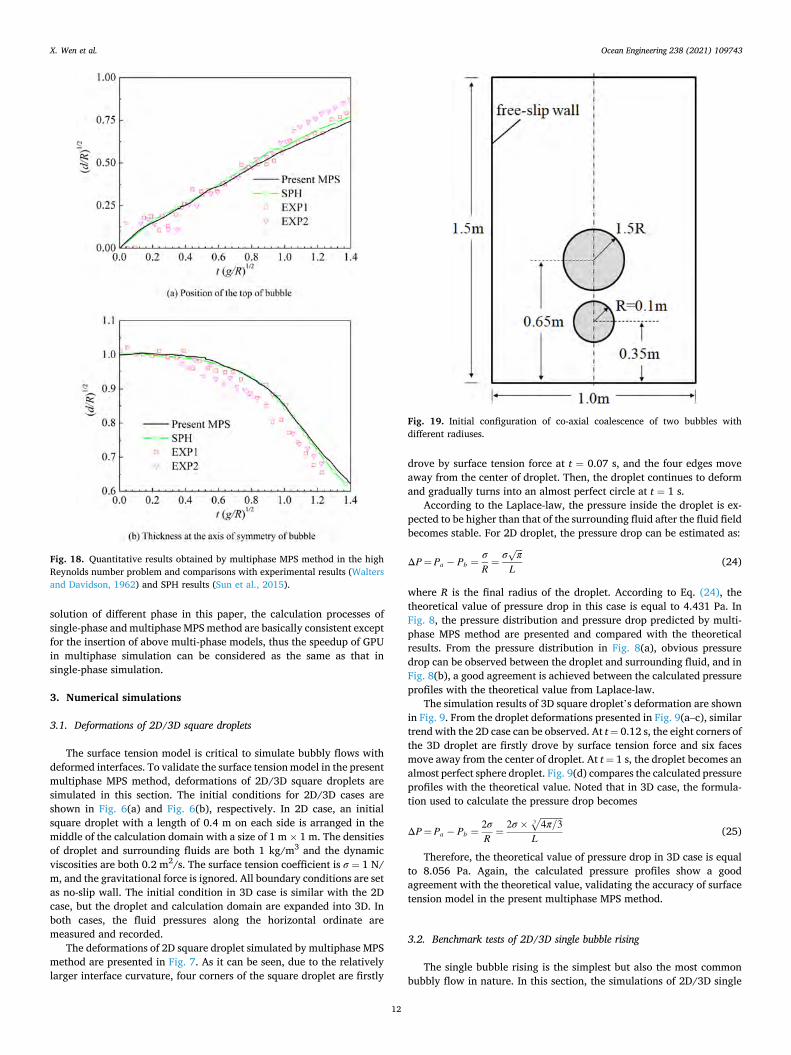
Fig. 18. Quantitative results obtained by multiphase MPS method in the high Reynolds number problem and comparisons with experimental results (Walters and Davidson, 1962) and SPH results (Sun et al., 2015).
Fig. 19. Initial configuration of co-axial coalescence of two bubbles with different radiuses.
X. Wen et al.
Ocean Engineering 238 (2021) 109743
13
bubble rising are carried out and the performance of multiphase MPS method is investigated. The initial configurations are set to be identical with the 2D benchmark study by Hysing et al. (2008) and the 3D benchmark study by Adelsberger et al. (2014), as shown in Fig. 10. In 2D case, a circular bubble with the diameter d = 0.5 m is initially centered at (0.5, 0.5) in a 1 × 2 rectangular container. The no-slip boundary condition is imposed on the top and bottom walls, while the free-slip
boundary condition is imposed on the vertical sidewalls. In 3D case, a sphere bubble with the diameter d = 0.5 m is initially centered at (0.5, 0.5, 0.5) in the 1 × 1 × 2 cuboid container and all boundaries are set as no-slip wall. The gravity acceleration is g = 0.98 m/s2 and points downwards. The physical properties of fluids keep the same as the “case 2” of the benchmark study, in which the density ratio (1000:1) and viscosity ratio (100:1) are relatively higher and the phase interface is more complex. In both 2D and 3D cases, the two main non-dimensional numbers in bubble dynamics, including the Reynolds number (Re) and Bond number (Bo, also known as Eotvos number, Eo), are equal to 35 and 125, respectively. For bubbly flows, the Reynolds number repre-senting the ratio of inertial to viscous effects and the Bond number which gives the ratio of gravitational forces to surface tension effects are defined as
Re=ρ1
gd3
√
μ1, Bo =
ρ1gd2
σ (26)
From the above definition, it can be seen that with the increase of Reynolds number, the inertial force becomes more dominant than the viscous force, which means that the movement of bubble would be more violent; With the increase of Bond number, the inertial force become more dominant than the surface tension force, thus more severe defor-mation would occur during the bubble rising. Considering that the advantage of multiphase MPS method is more significant in the violent flows with complex interfaces, the bubble rising at high Reynolds number will be further studied in Section 3.3, and the bubbly flow with
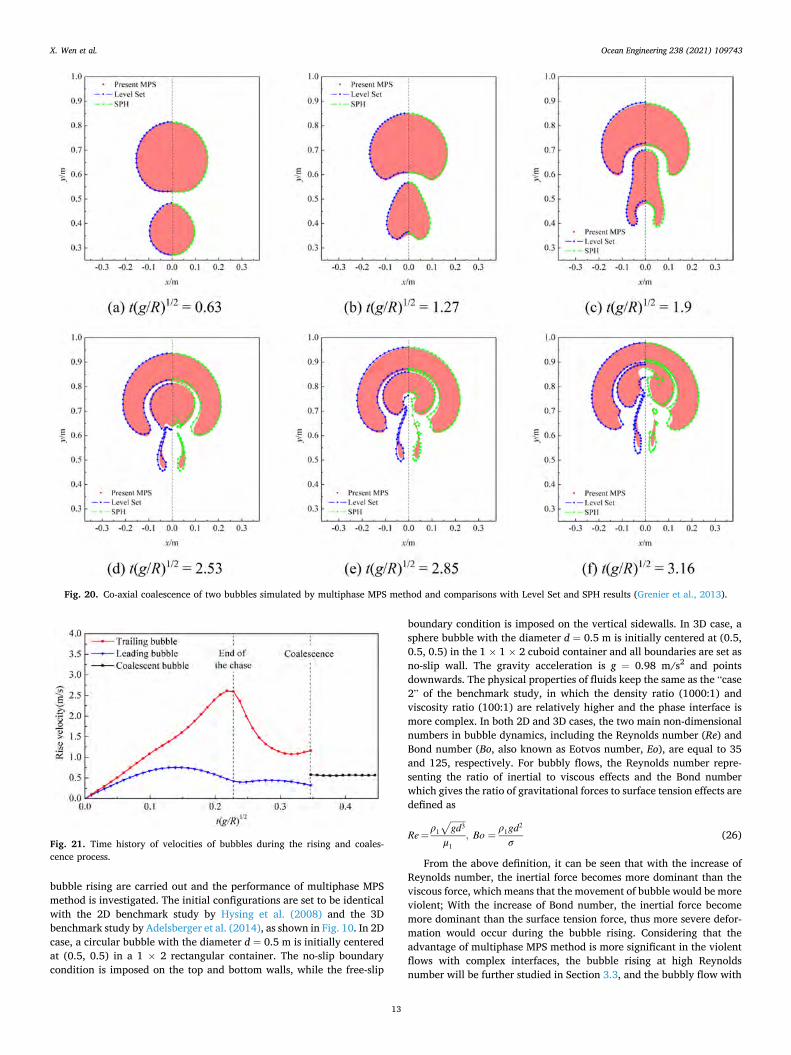
Fig. 20. Co-axial coalescence of two bubbles simulated by multiphase MPS method and comparisons with Level Set and SPH results (Grenier et al., 2013).
Fig. 21. Time history of velocities of bubbles during the rising and coales-cence process.
X. Wen et al.

Ocean Engineering 238 (2021) 109743
14
increasing Bond number will be studied in Section 3.4 and Section 3.5. Time evolution of bubble shape in 2D rising problem is presented in
Fig. 11. Due to the large Bond number, surface tension effects are weak in this case and the bubble experiences strong deformations during the rising process, especially in the later stage, where the breakup of bubble is observed and two tiny bubbles are separated from the skirt part of the main bubble. The interface captured by multiphase MPS method is compared with benchmark results and a good agreement can be observed.
Fig. 12 plots the quantitative results calculated by different methods, including the center of mass and rise velocity of bubble. Compared with SPH (Sun et al., 2015) and MMPS-CA (Duan et al., 2017) methods, the multiphase MPS method gives more consistent results with benchmark results. Besides, the severe oscillations of rise velocity observed in other mesh-free methods are not found in the multiphase MPS results, vali-dating the stability of present method.
Fig. 13 shows the time evolution of bubble shape in 3D rising problem. Similarly, the 3D bubble experiences a large deformation due to the relatively high Bond number and weak surface tension effects. However, the breakup of bubble observed in previous 2D case does not occur in present 3D simulation, which shows a good agreement with the 3D benchmark results (Adelsberger et al., 2014). In the early stage of its buoyant motion, the 3D bubble deforms fast and turns into a dimpled cap at t = 1 s. Afterwards, the diameter of bubble in the vertical direction gradually decreases while the diameter in the horizontal direction in-creases. Finally, the shape of bubble is located in the dimpled ellipsoidal-cap regime at t = 3.5 s, being same as the benchmark results.
In Fig. 14, the shapes of 3D bubble simulated by multiphase MPS method at several typical time instants are compared with the bench-mark results, which is obtained by three different solvers, including DROPS, NaSt3D and OpenFOAM (Adelsberger et al., 2014). In general, the result of multiphase MPS method show a better agreement with the results of DROPS and OpenFOAM. The main difference is observed on the bottom edge of bubble, where the interface curvature is large. The center of mass and rise velocity are presented and compared in Fig. 15. The center of mass calculated by multiphase MPS method agrees well with benchmark result, and more accurate rise velocity can be predicted, compared with MMPS-CA and MMPS-HD methods (Duan et al., 2017).
In summary, the multiphase MPS method proposed in this paper can be well validated through the above simulations of 2D and 3D single bubble rising. There are some slight differences between MPS results and benchmark results, such as the profile of bubble edge and the evolution of tiny bubbles formed after bubble breaking. However, considering that these local deformations bring great challenges to numerical methods
and even the three mesh-based methods used in benchmark study ob-tained different results, the results in present work are regarded as acceptable.
3.3. Bubble rising and breaking with high Reynolds number
It should be noted that in the simulations of section 3.2, the viscos-ities of fluids are large and the gravity is small, resulting in low Reynolds number. In order to further examine the capacity of multiphase MPS method in more violent bubbly flows with high Reynolds number, the rising and breaking of a single bubble in the low-viscosity liquid, which corresponds to the experimental study of Walters and Davidson (1962), are simulated and analyzed in this section. The initial configuration is presented in Fig. 16, where the bubble with a radius R = 0.0254 m is located in the middle of the container with a width of 10R and a height of 12R. The distance from the center of bubble to the container bottom is 4 R. The fluids inside and outside of the bubble are water and air, respectively. The density and viscosity of water phase are 1000 kg/m3
and 0.001 Pa s, while the density and viscosity of the air bubble are 1 kg/m3 and 1.77 × 10− 5 Pa s. Therefore, the density and viscosity ratios in this case reach up to 1000 and 56.5. The surface tension coefficient is 0.0728 N/m and the gravity acceleration is g = 9.8 m/s2. According to the parameters and fluid properties, the Reynolds number in this case is up to 35843.
The MPS snapshots of bubble shapes at some typical time instants are presented in Fig. 17 and compared with experimental snapshots pro-vided in the study of Walters and Davidson (1962). Due to the extremely high Reynolds number, the deformation of bubble observed in present case are more violent than the above benchmark tests. In its rising process, the bubble firstly deforms into a horseshoe shape due to the upwelling water motion below the bubble (t = 0.1375 s). Subsequently, the cavity gradually grows, and the bubble was continuously elongated. At t = 0.2375 s, the breakup of bubble occurs and two small bubbles are separated from the main bubble. Besides, some satellite droplets are formed during the bubble breaking process. After that, the bottom edge of bubble shrink upward rapidly due to the large interface curvature, and the bubble turns into a cap shape finally. From the comparison between numerical and experimental results, a good agreement can be observed, proving that the complex interfaces in bubbly flows can still be accurately captured by multiphase MPS method even if the Reynolds number is high.
Fig. 18 shows the quantitative results obtained by multiphase MPS method in the high Reynolds number problem and the comparison with SPH (Sun et al., 2015) and experimental results (Walters and Davidson,
Fig. 22. Velocity field and streamlines around bubbles.
X. Wen et al.
Ocean Engineering 238 (2021) 109743
15
1962). The quantitative results include the position of the top of bubble and the thickness at the axis of symmetry of bubble, which represent the characteristics of bubble motion and deformation, respectively. From the comparisons, it can be seen that both multiphase MPS method and SPH method are able to accurately predict the bubble characteristics, and the numerical results are in good agreement with experimental data.
3.4. Co-axial coalescence of two bubbles with different radiuses
When the bubbly flow contains more than one bubble, the
interaction between different bubbles may lead to larger bubble defor-mation and more complex evolution of interfaces. In this section, the co- axial coalescence of two bubbles with different radiuses are simulated by multiphase MPS method and the bubble interaction is investigated. The initial configuration is displayed in Fig. 19, which is also used in the studies of Grenier et al. (2013) and Duan et al. (2017). Two close bubbles are located on the same vertical line inside a 1.0 m × 1.5 m rectangular container filled with pure water. The radiuses of lower and upper bub-bles are R = 0.1 m and 1.5R = 0.15 m, respectively. The densities of liquid and bubble phases are 1000 kg/m3 and 100 kg/m3, thus the
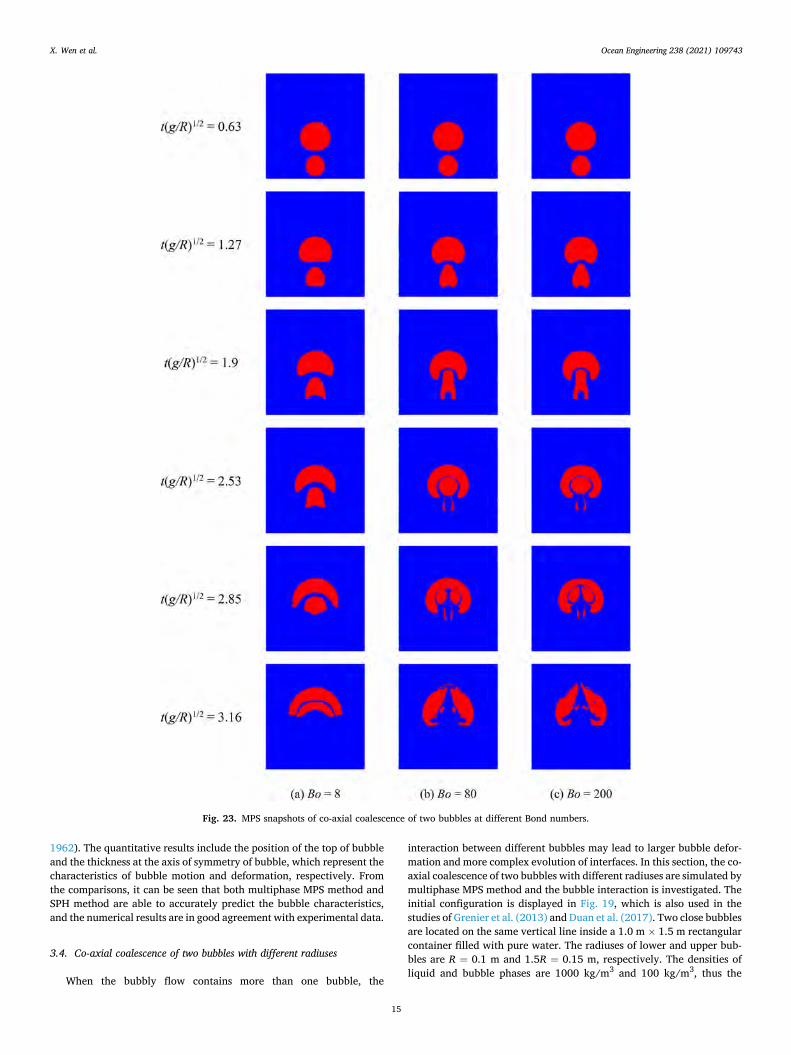
Fig. 23. MPS snapshots of co-axial coalescence of two bubbles at different Bond numbers.
X. Wen et al.
Ocean Engineering 238 (2021) 109743
16
density ratio is equal to 10 in this case. The viscosities of liquid and bubble phases are 0.156 kg/(m.s) and 0.078 kg/(m.s), respectively. Three cases with different surface tension coefficients are considered, including 49 N/m, 4.9 N/m and 1.96 N/m, corresponding to the Bond number of 8, 80 and 200, respectively.
Fig. 20 shows the buoyant motion and coalescence process of two bubbles at Bo = 80, and the comparison with other numerical results in the open literature. As it can be observed, the characteristics of bubbly flow and complex interfaces captured by multiphase MPS method ach-ieve a good agreement with the results of Level Set and SPH (Grenier et al., 2013). Initially, the smaller bubble in the lower location moves with a significantly faster velocity than that of the larger bubble in the upper region. The deformation of the smaller bubbles is more violent and the breakup of bubble is observed at the moment of t(g/R)1/2 = 2.53, with two separated tiny bubbles formed. After the smaller bubble catches up with the larger one, it is gradually sucked into the cavity below the larger bubble. The liquid film between two bubbles becomes thinner and thinner, leading to the coalescence of bubbles finally.
In Fig. 21, time history of velocities of bubbles during the rising and coalescence process is plotted. In general, the trend of rise velocity keeps consistent with the observations in Fig. 20. At the beginning, the rise velocities of both two bubbles increase rapidly, especially the smaller bubble. The rise velocity of the leading bubble reaches its peak soon and starts to decrease, while the smaller bubble keeps being accelerated until it catches up with the larger one at t(g/R)1/2 = 2.3. Afterwards, the velocity of the smaller bubble drops quickly due to the blocking effect of the larger one. At the same time, some upward momentum is transferred from the smaller bubble to the larger bubble, inducing another increase of the large bubble’s rise velocity. Finally, the coalescence of bubbles occurs and average velocity of the merged bubble tends to be steady.
To explore the mechanism of bubble interaction in present case, the velocity field and streamlines around these two bubbles are displayed in Fig. 22. It can be observed that two strong vortex structures are formed on two sides of the larger bubble and stably exists during the bubble rising process. Due to its small size and short distance to the larger bubble, the smaller bubble is completely exposed to influence of the vortex structure. From the distribution of streamlines, it can be found that the smaller bubble is located in the region where the wake flows are moving upward, thus the buoyant motion of the smaller bubble is greatly speeded up.
The surface tension effects on the bubble coalescence are further investigated by performing the simulations with different Bond numbers, as shown in Fig. 23. In the case of Bo = 8, the larger surface tension force could inhibit the deformations of bubbles and the lower bubble is less influenced by the wake flows. Therefore, the bubble coalescence is not observed during the simulation. As the Bond number increases to 80 and 200, the surface tension effects are greatly reduced and the bubbles suffer from much larger deformations. In these two cases, the deformation and coalescence of two bubbles are very similar due to the negligible surface tension effect, but it can still be observed that at t(g/R)1/2 = 2.53 and 3.16, the complex interfaces caused by bubble coalescence is more complex at Bo = 200.
3.5. Violent interactions between a set of bubbles
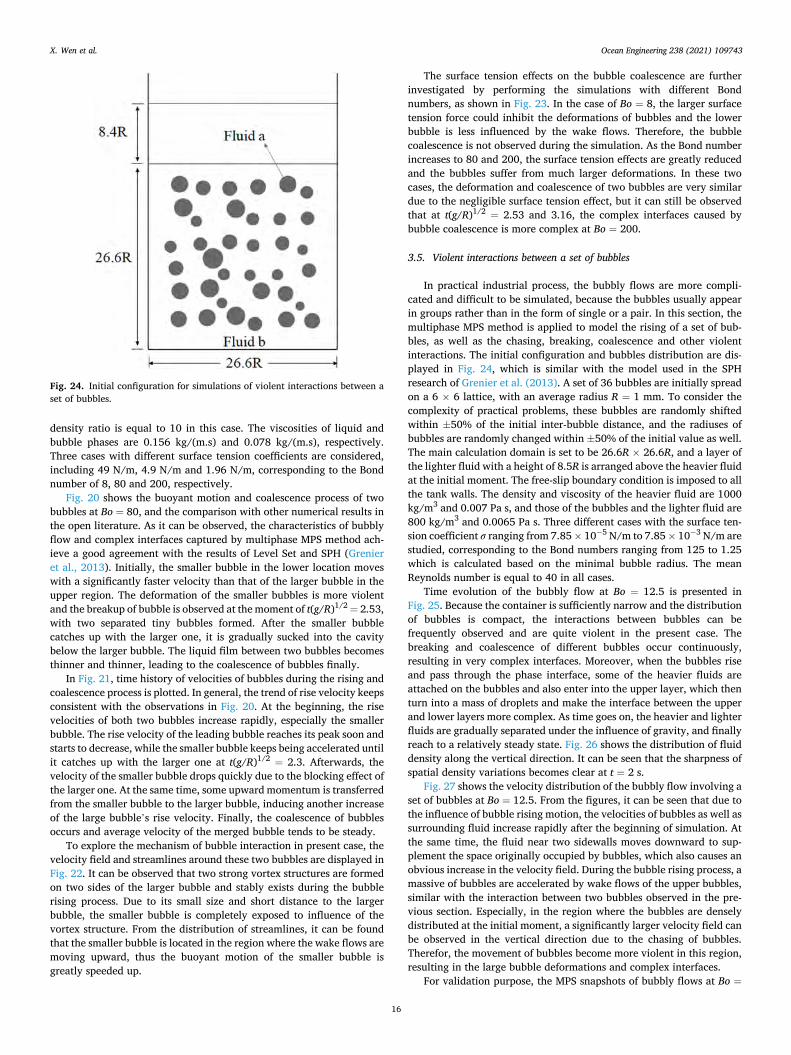
In practical industrial process, the bubbly flows are more compli-cated and difficult to be simulated, because the bubbles usually appear in groups rather than in the form of single or a pair. In this section, the multiphase MPS method is applied to model the rising of a set of bub-bles, as well as the chasing, breaking, coalescence and other violent interactions. The initial configuration and bubbles distribution are dis-played in Fig. 24, which is similar with the model used in the SPH research of Grenier et al. (2013). A set of 36 bubbles are initially spread on a 6 × 6 lattice, with an average radius R = 1 mm. To consider the complexity of practical problems, these bubbles are randomly shifted within ±50% of the initial inter-bubble distance, and the radiuses of bubbles are randomly changed within ±50% of the initial value as well. The main calculation domain is set to be 26.6R × 26.6R, and a layer of the lighter fluid with a height of 8.5R is arranged above the heavier fluid at the initial moment. The free-slip boundary condition is imposed to all the tank walls. The density and viscosity of the heavier fluid are 1000 kg/m3 and 0.007 Pa s, and those of the bubbles and the lighter fluid are 800 kg/m3 and 0.0065 Pa s. Three different cases with the surface ten-sion coefficient σ ranging from 7.85 × 10− 5 N/m to 7.85 × 10− 3 N/m are studied, corresponding to the Bond numbers ranging from 125 to 1.25 which is calculated based on the minimal bubble radius. The mean Reynolds number is equal to 40 in all cases.
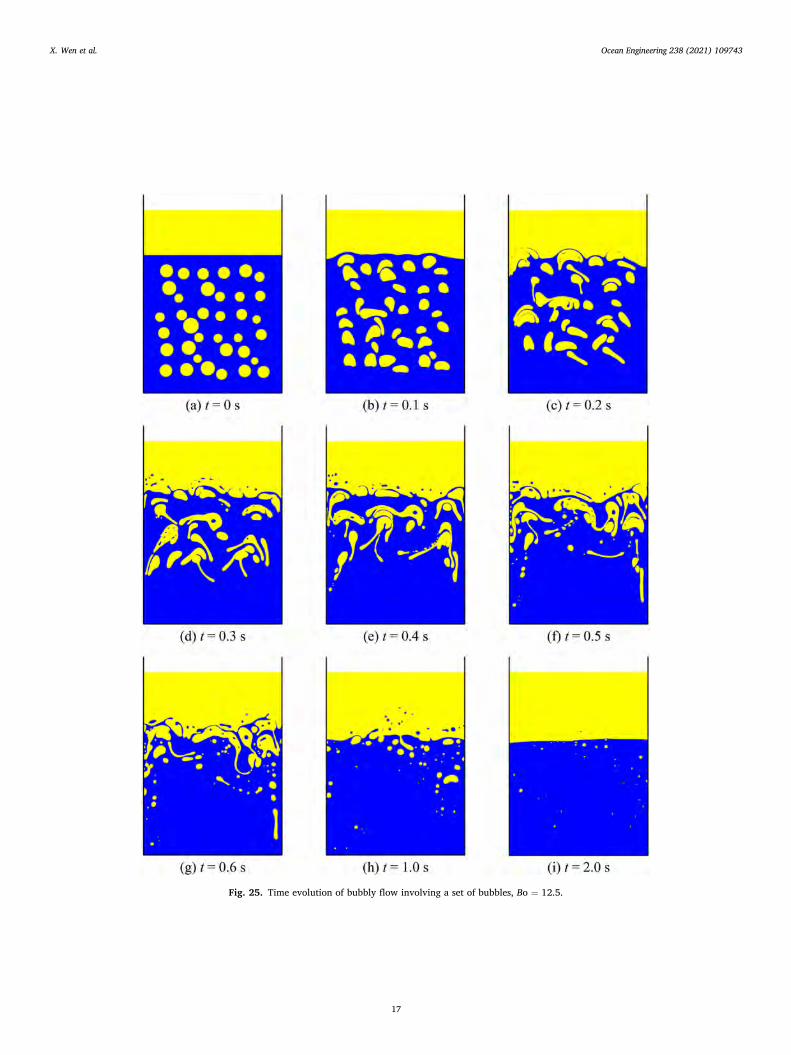
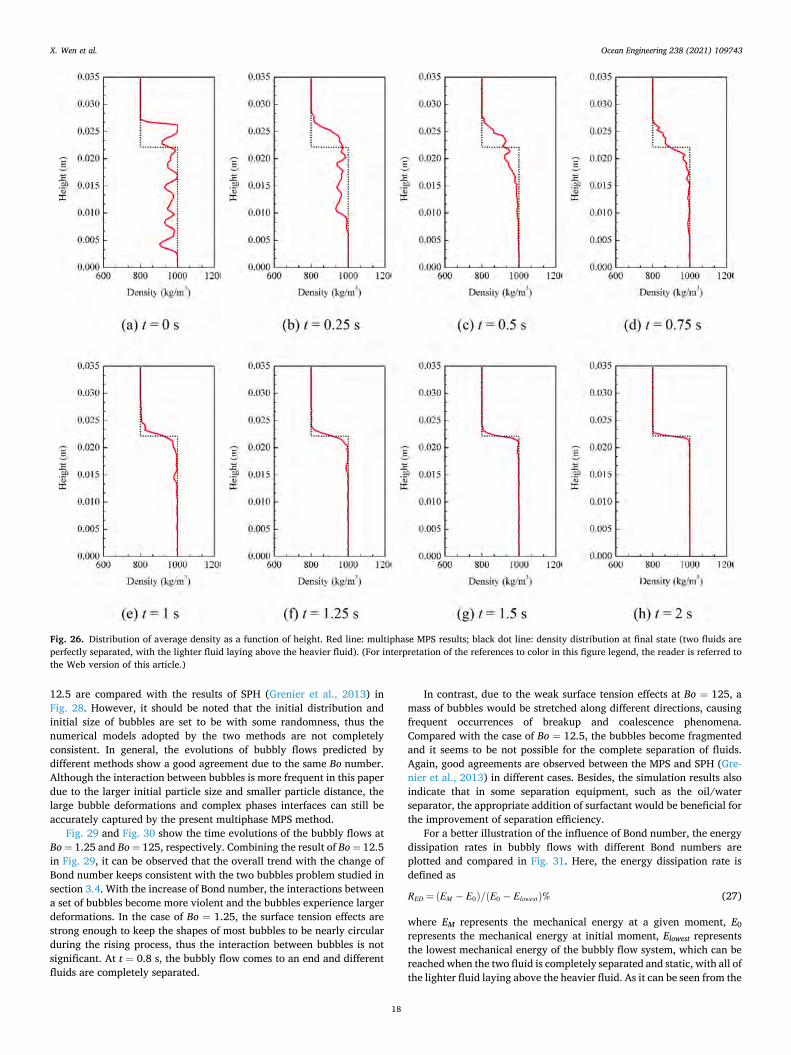
Time evolution of the bubbly flow at Bo = 12.5 is presented in Fig. 25. Because the container is sufficiently narrow and the distribution of bubbles is compact, the interactions between bubbles can be frequently observed and are quite violent in the present case. The breaking and coalescence of different bubbles occur continuously, resulting in very complex interfaces. Moreover, when the bubbles rise and pass through the phase interface, some of the heavier fluids are attached on the bubbles and also enter into the upper layer, which then turn into a mass of droplets and make the interface between the upper and lower layers more complex. As time goes on, the heavier and lighter fluids are gradually separated under the influence of gravity, and finally reach to a relatively steady state. Fig. 26 shows the distribution of fluid density along the vertical direction. It can be seen that the sharpness of spatial density variations becomes clear at t = 2 s.
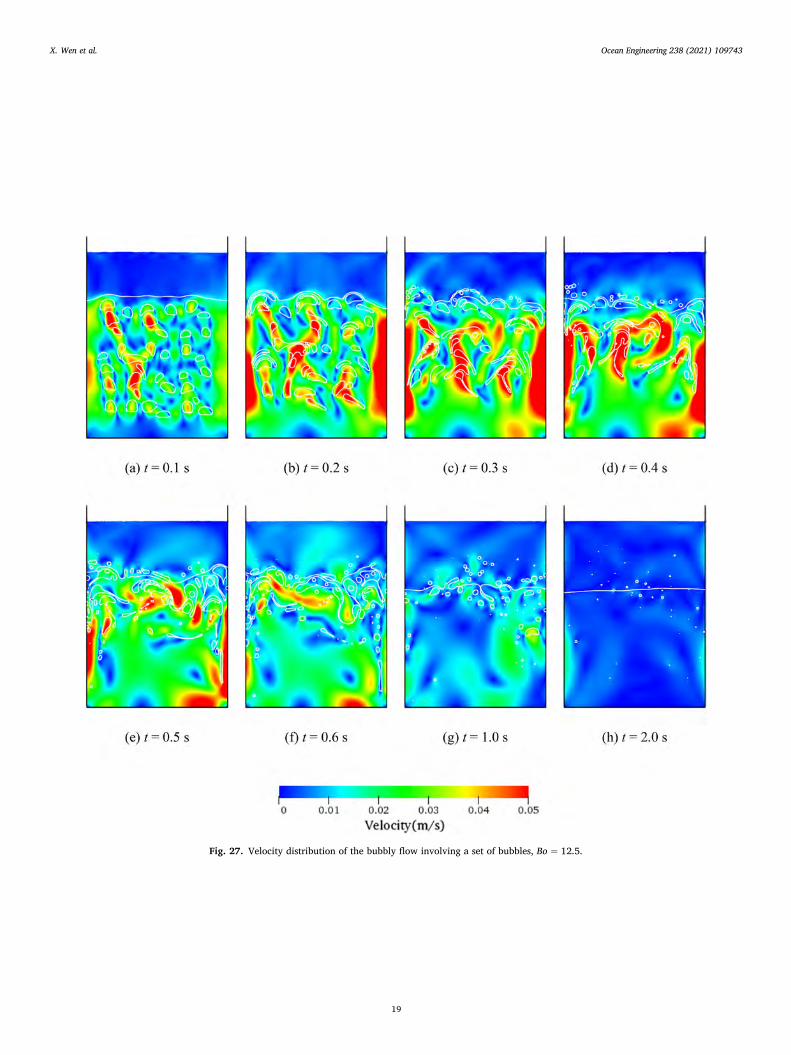
Fig. 27 shows the velocity distribution of the bubbly flow involving a set of bubbles at Bo = 12.5. From the figures, it can be seen that due to the influence of bubble rising motion, the velocities of bubbles as well as surrounding fluid increase rapidly after the beginning of simulation. At the same time, the fluid near two sidewalls moves downward to sup-plement the space originally occupied by bubbles, which also causes an obvious increase in the velocity field. During the bubble rising process, a massive of bubbles are accelerated by wake flows of the upper bubbles, similar with the interaction between two bubbles observed in the pre-vious section. Especially, in the region where the bubbles are densely distributed at the initial moment, a significantly larger velocity field can be observed in the vertical direction due to the chasing of bubbles. Therefor, the movement of bubbles become more violent in this region, resulting in the large bubble deformations and complex interfaces.
For validation purpose, the MPS snapshots of bubbly flows at Bo =
Fig. 24. Initial configuration for simulations of violent interactions between a set of bubbles.
X. Wen et al.
Ocean Engineering 238 (2021) 109743
17
Fig. 25. Time evolution of bubbly flow involving a set of bubbles, Bo = 12.5.
X. Wen et al.
Ocean Engineering 238 (2021) 109743
18
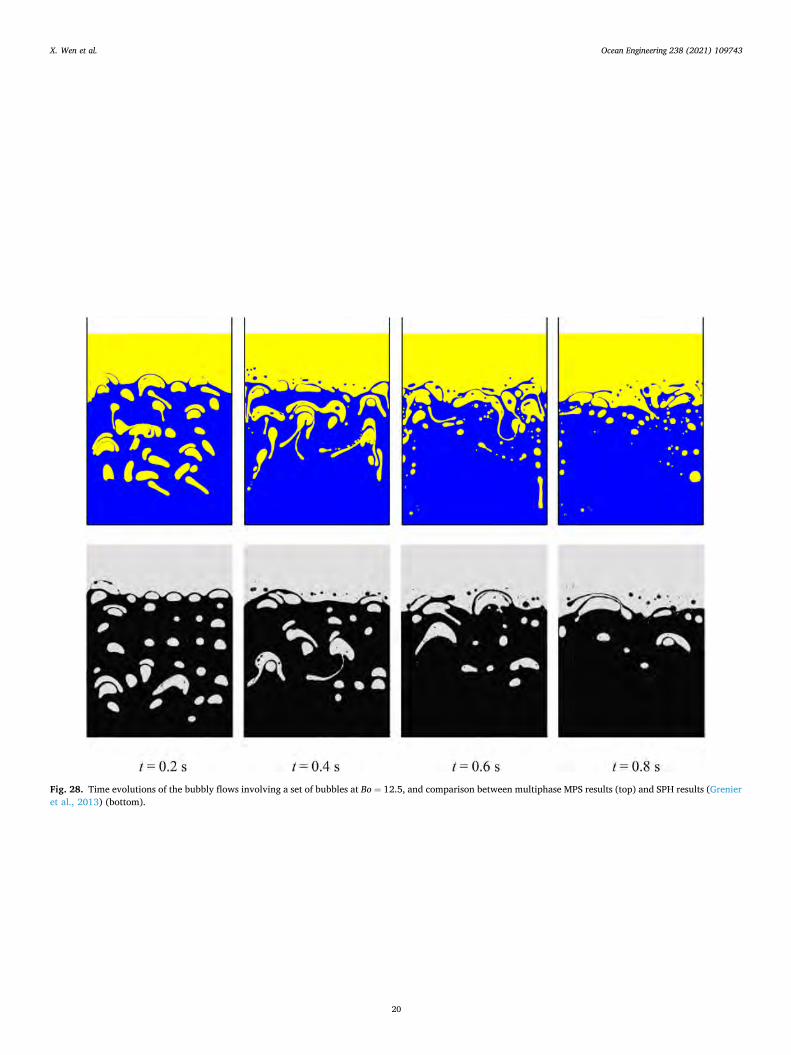
12.5 are compared with the results of SPH (Grenier et al., 2013) in Fig. 28. However, it should be noted that the initial distribution and initial size of bubbles are set to be with some randomness, thus the numerical models adopted by the two methods are not completely consistent. In general, the evolutions of bubbly flows predicted by different methods show a good agreement due to the same Bo number. Although the interaction between bubbles is more frequent in this paper due to the larger initial particle size and smaller particle distance, the large bubble deformations and complex phases interfaces can still be accurately captured by the present multiphase MPS method.
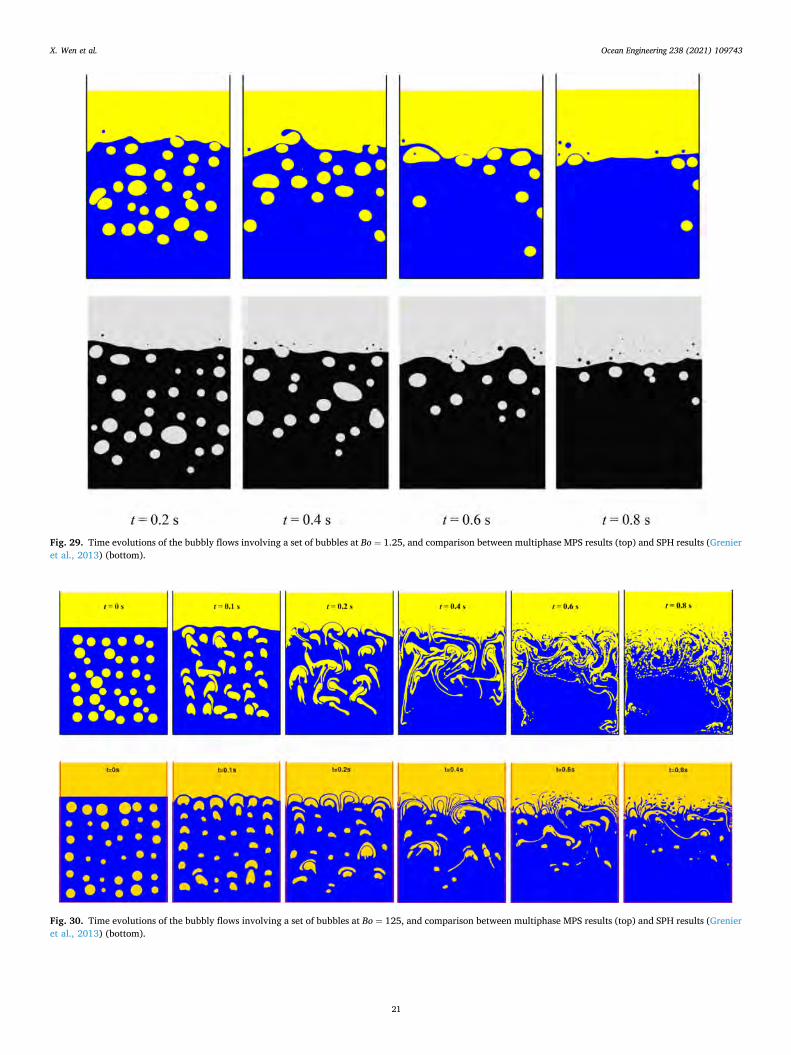
Fig. 29 and Fig. 30 show the time evolutions of the bubbly flows at Bo = 1.25 and Bo = 125, respectively. Combining the result of Bo = 12.5 in Fig. 29, it can be observed that the overall trend with the change of Bond number keeps consistent with the two bubbles problem studied in section 3.4. With the increase of Bond number, the interactions between a set of bubbles become more violent and the bubbles experience larger deformations. In the case of Bo = 1.25, the surface tension effects are strong enough to keep the shapes of most bubbles to be nearly circular during the rising process, thus the interaction between bubbles is not significant. At t = 0.8 s, the bubbly flow comes to an end and different fluids are completely separated.
In contrast, due to the weak surface tension effects at Bo = 125, a mass of bubbles would be stretched along different directions, causing frequent occurrences of breakup and coalescence phenomena. Compared with the case of Bo = 12.5, the bubbles become fragmented and it seems to be not possible for the complete separation of fluids. Again, good agreements are observed between the MPS and SPH (Gre-nier et al., 2013) in different cases. Besides, the simulation results also indicate that in some separation equipment, such as the oil/water separator, the appropriate addition of surfactant would be beneficial for the improvement of separation efficiency.
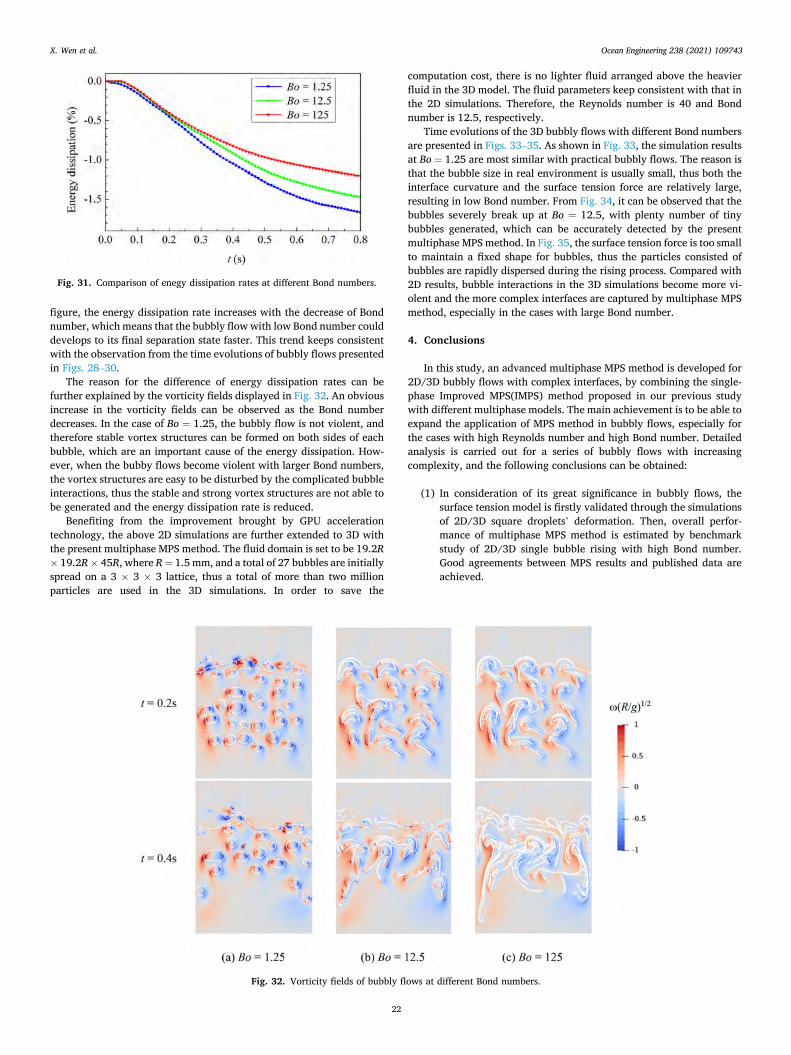
For a better illustration of the influence of Bond number, the energy dissipation rates in bubbly flows with different Bond numbers are plotted and compared in Fig. 31. Here, the energy dissipation rate is defined as
RED =(EM − E0)/(E0 − Elowest)% (27)
where EM represents the mechanical energy at a given moment, E0 represents the mechanical energy at initial moment, Elowest represents the lowest mechanical energy of the bubbly flow system, which can be reached when the two fluid is completely separated and static, with all of the lighter fluid laying above the heavier fluid. As it can be seen from the
Fig. 26. Distribution of average density as a function of height. Red line: multiphase MPS results; black dot line: density distribution at final state (two fluids are perfectly separated, with the lighter fluid laying above the heavier fluid). (For interpretation of the references to color in this figure legend, the reader is referred to the Web version of this article.)
X. Wen et al.
Ocean Engineering 238 (2021) 109743
19
Fig. 27. Velocity distribution of the bubbly flow involving a set of bubbles, Bo = 12.5.
X. Wen et al.
Ocean Engineering 238 (2021) 109743
20
Fig. 28. Time evolutions of the bubbly flows involving a set of bubbles at Bo = 12.5, and comparison between multiphase MPS results (top) and SPH results (Grenier et al., 2013) (bottom).
X. Wen et al.
Ocean Engineering 238 (2021) 109743
21
Fig. 29. Time evolutions of the bubbly flows involving a set of bubbles at Bo = 1.25, and comparison between multiphase MPS results (top) and SPH results (Grenier et al., 2013) (bottom).
Fig. 30. Time evolutions of the bubbly flows involving a set of bubbles at Bo = 125, and comparison between multiphase MPS results (top) and SPH results (Grenier et al., 2013) (bottom).
X. Wen et al.
Ocean Engineering 238 (2021) 109743
22
figure, the energy dissipation rate increases with the decrease of Bond number, which means that the bubbly flow with low Bond number could develops to its final separation state faster. This trend keeps consistent with the observation from the time evolutions of bubbly flows presented in Figs. 28–30.
The reason for the difference of energy dissipation rates can be further explained by the vorticity fields displayed in Fig. 32. An obvious increase in the vorticity fields can be observed as the Bond number decreases. In the case of Bo = 1.25, the bubbly flow is not violent, and therefore stable vortex structures can be formed on both sides of each bubble, which are an important cause of the energy dissipation. How-ever, when the bubby flows become violent with larger Bond numbers, the vortex structures are easy to be disturbed by the complicated bubble interactions, thus the stable and strong vortex structures are not able to be generated and the energy dissipation rate is reduced.
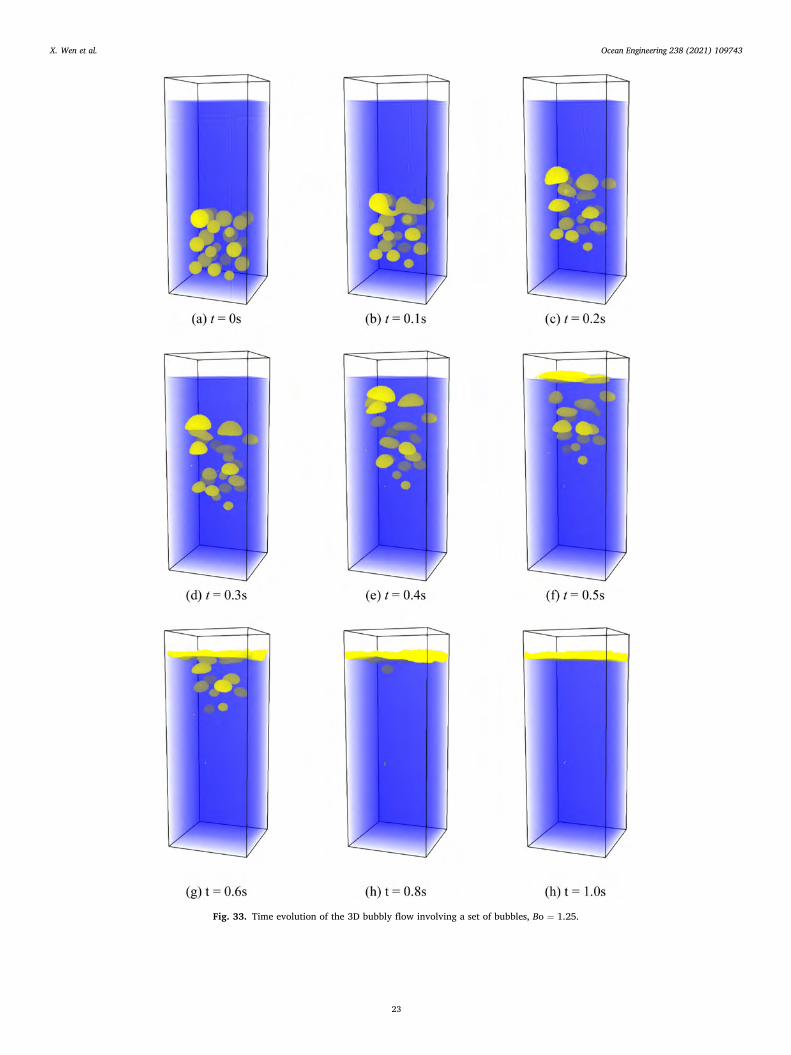
Benefiting from the improvement brought by GPU acceleration technology, the above 2D simulations are further extended to 3D with the present multiphase MPS method. The fluid domain is set to be 19.2R × 19.2R × 45R, where R = 1.5 mm, and a total of 27 bubbles are initially spread on a 3 × 3 × 3 lattice, thus a total of more than two million particles are used in the 3D simulations. In order to save the
computation cost, there is no lighter fluid arranged above the heavier fluid in the 3D model. The fluid parameters keep consistent with that in the 2D simulations. Therefore, the Reynolds number is 40 and Bond number is 12.5, respectively.
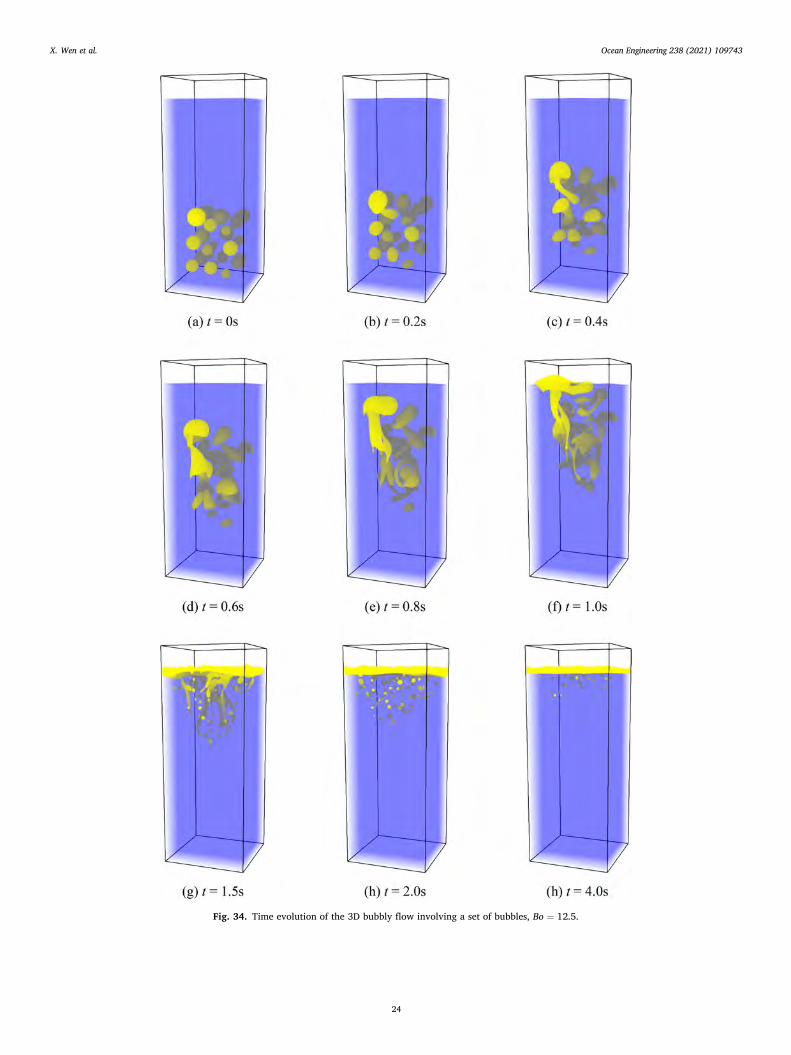
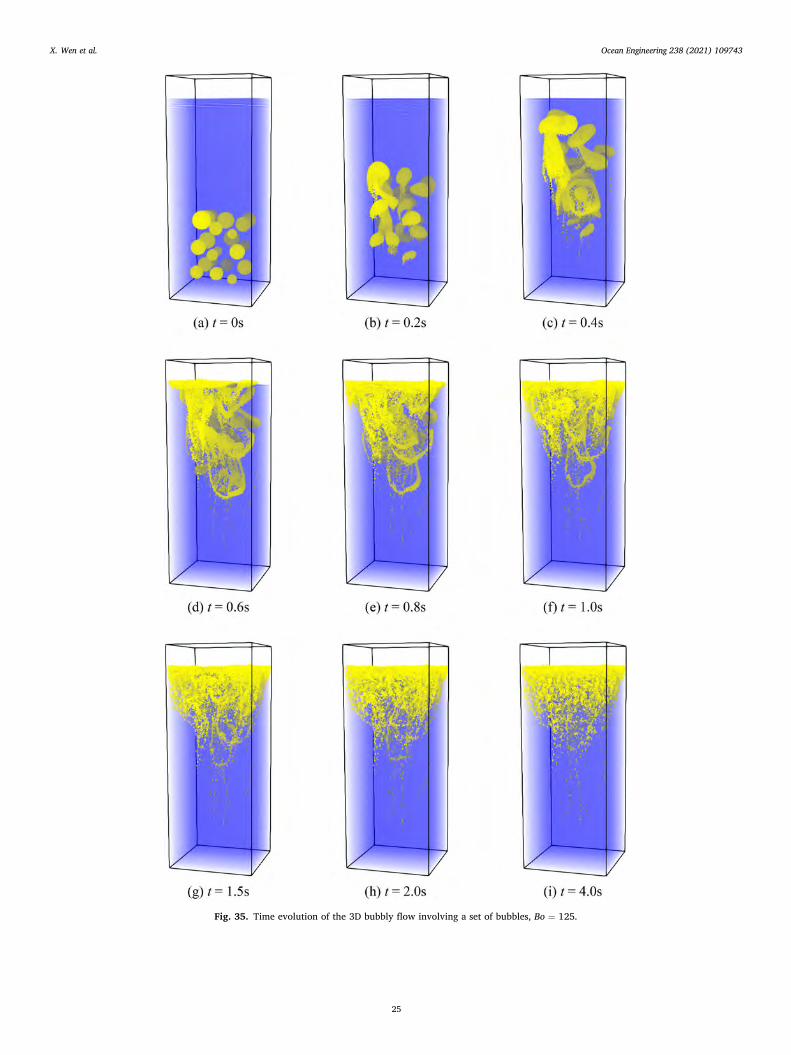
Time evolutions of the 3D bubbly flows with different Bond numbers are presented in Figs. 33–35. As shown in Fig. 33, the simulation results at Bo = 1.25 are most similar with practical bubbly flows. The reason is that the bubble size in real environment is usually small, thus both the interface curvature and the surface tension force are relatively large, resulting in low Bond number. From Fig. 34, it can be observed that the bubbles severely break up at Bo = 12.5, with plenty number of tiny bubbles generated, which can be accurately detected by the present multiphase MPS method. In Fig. 35, the surface tension force is too small to maintain a fixed shape for bubbles, thus the particles consisted of bubbles are rapidly dispersed during the rising process. Compared with 2D results, bubble interactions in the 3D simulations become more vi-olent and the more complex interfaces are captured by multiphase MPS method, especially in the cases with large Bond number.
4. Conclusions
In this study, an advanced multiphase MPS method is developed for 2D/3D bubbly flows with complex interfaces, by combining the single- phase Improved MPS(IMPS) method proposed in our previous study with different multiphase models. The main achievement is to be able to expand the application of MPS method in bubbly flows, especially for the cases with high Reynolds number and high Bond number. Detailed analysis is carried out for a series of bubbly flows with increasing complexity, and the following conclusions can be obtained:
(1) In consideration of its great significance in bubbly flows, the surface tension model is firstly validated through the simulations of 2D/3D square droplets’ deformation. Then, overall perfor-mance of multiphase MPS method is estimated by benchmark study of 2D/3D single bubble rising with high Bond number. Good agreements between MPS results and published data are achieved.
Fig. 31. Comparison of enegy dissipation rates at different Bond numbers.
Fig. 32. Vorticity fields of bubbly flows at different Bond numbers.
X. Wen et al.
Ocean Engineering 238 (2021) 109743
23
Fig. 33. Time evolution of the 3D bubbly flow involving a set of bubbles, Bo = 1.25.
X. Wen et al.
Ocean Engineering 238 (2021) 109743
24
Fig. 34. Time evolution of the 3D bubbly flow involving a set of bubbles, Bo = 12.5.
X. Wen et al.
Ocean Engineering 238 (2021) 109743
25
Fig. 35. Time evolution of the 3D bubbly flow involving a set of bubbles, Bo = 125.
X. Wen et al.
Ocean Engineering 238 (2021) 109743
26
(2) The single bubble rising with high Reynolds number is further simulated. Due to the much stronger inertia force compared with surface tension force, the large deformation and violent breaking of bubble are observed, which can still be accurately captured by multiphase MPS method. Besides, convergence is obtained to the experimental and SPH results.
(3) The co-axial coalescence of two bubbles is studied and it is found that the buoyant motion of the lower bubble would be speeded up by the wake flows, resulting in the collision and coalescence of bubbles. The interfaces captured by multiphase MPS method show a good agreement with the results of Level Set and SPH. According to the simulation results with different Bond numbers, it can be concluded that the interaction of bubbles is intensified with the increase of Bond number.
(4) The violent interactions between a set of bubbles are studied, in which frequent breaking and coalescence of bubbles are observed. Benefiting from its Lagrangian characteristic, the multiphase MPS method is able to reproduce the complicated phenomena in bubbly flows and achieve a good agreement with SPH results. As the Bond number increases, the bubbles experi-ence larger deformations, and the energy dissipation rate is slowed down due to the less formations of vortex structures on both sides of each bubble. Finally, the large-scale 3D simulations with more than two million particles are performed for this case, which are close to the practical bubbly flows.
In summary, the multiphase MPS method developed in this paper shows high stability and accuracy for bubbly flows with complex in-terfaces. However, it has not yet reached the standard for the real bubbly flows in industrial process and future work is necessary focusing on further improvement of computational efficiency. Meanwhile, it is important to develop and introduce the phase change model into the multiphase MPS method, to solve its weakness in the modeling of air diffusion phenomena. We should also note that the MPS particles are equidistantly distributed at the initial moment, causing slight sawtooth shape of the bubble. In consideration of some level of sensitivity to the initial particle distribution, more advanced pre-processing techniques are required in the future.
CRediT authorship contribution statement
Xiao Wen: Data curation, Writing – original draft, Visualization, Investigation, Software, Validation. Weiwen Zhao: Software, Data curation, Visualization, Investigation, Validation. Decheng Wan: Su-pervision, Conceptualization, Methodology, Investigation, Writing – review & editing.
Declaration of competing interest
The authors declare that they have no known competing financial interests or personal relationships that could have appeared to influence the work reported in this paper.
Acknowledgement
This work is supported by the National Key Research and Develop-ment Program of China (2019YFB1704200 and 2019YFC0312400), the National Natural Science Foundation of China (51879159), to which the authors are most grateful.
References
Abbaszadeh, M., Alishahi, M.M., Emdad, H., 2020. Experimental investigations on the bubbly wake of a transom stern model using optical laser beam scattering characteristics. Appl. Ocean Res. 104, 102380.
Abbaszadeh, M., Alishahi, M.M., Emdad, H., 2021. A new bubbly flow detection and quantification procedure based on optical laser-beam scattering behavior. Meas. Sci. Technol. 32, 025202.
Adelsberger, J., Esser, P., Griebel, M., Groß, S., Klitz, M., Rüttgers, A., 2014. 3D incompressible two-phase flow benchmark computations for rising droplets. Proceedings of the 11th World Congress on Computational Mechanics. WCCM XI, Barcelona, Spain, pp. 5274–5285.
Annaland, M.V., Deen, N.G., Kuipers, J.A.M., 2005. Numerical simulation of gas bubbles behaviour using a three-dimensional volume of fluid method. Chem. Eng. Sci. 60, 2999–3011.
Brackbill, J.U., Kothe, D.B., Zemach, C., 1992. A continuum method for modeling surface tension. J. Comput. Phys. 100, 335–354.
Chen, W., Xu, H.L., Kong, W.Y., Yang, F.Q., 2020. Study on three-phase flow characteristics of natural gas hydrate pipeline transmission. Ocean Eng. 214, 107727.
Chen, X., Wan, D.C., 2019a. GPU accelerated MPS method for large-scale 3-D violent free surface flows. Ocean Eng. 171, 677–694.
Chen, X., Wan, D.C., 2019b. Numerical simulation of three-dimensional violent free surface flows by GPU-based MPS method. Int. J. Comput. Methods 16 (4), 1–20.
Chow, A.D., Rogers, B.D., Lind, S.J., Stansby, P.K., 2018. Incompressible SPH (ISPH) with fast Poisson solver on a GPU. Comput. Phys. Commun. 226, 81–103.
Colagrossi, A., Landrini, M., 2003. Numerical simulation of interfacial flows by smoothed particle hydrodynamics. J. Comput. Phys. 191, 448–475.
Crespo, A.J.C., Domínguez, J.M., Barreiro, A., Gomez-Gesteira, M., Rogers, B.D., 2011. GPUs, a new tool of acceleration in CFD: efficiency and reliability on smoothed particle hydrodynamics methods. PloS One 6 (6), e20685.
Croce, R., Griebel, M., Schweitzer, M.A., 2010. Numerical simulation of bubble and droplet deformation by a level set approach with surface tension in three dimensions. Int. J. Numer. Methods Fluid. 62, 963–993.
Duan, G., Koshizuka, S., Chen, B., 2015. A contoured continuum surface force model for particle methods. J. Comput. Phys. 298, 280–304.
Duan, G., Koshizuka, S., Chen, B., Xiang, H., 2017. Stable multiphase moving particle semi-implicit method for incompressible interfacial flow. Comput. Methods Appl. Mech. Eng. 318, 636–666.
Gingold, R.A., Monaghan, J.J., 1977. Smoothed particle hydrodynamics: theory and application to non-spherical stars. Mon. Not. Roy. Astron. Soc. 191, 375–389.
Grenier, N., Le Touze, D., Colagrossi, A., Antuono, M., Colicchio, G., 2013. Viscous bubbly flows simulation with an interface SPH model. Ocean Eng. 69, 88–102.
Hori, C., Gotoh, H., Ikari, H., Khayyer, A., 2011. GPU-acceleration for moving particle semi-implicit method. Comput. Fluids 51, 174–183.
Hysing, S., Turek, S., Kuzmin, D., Parolini, N., Burman, E., Ganesan, S., Tobiska, L., 2008. Quantitative benchmark computations of two-dimensional bubble dynamics. Int. J. Numer. Methods Fluid. 60, 1259–1288.
Khayyer, A., Gotoh, H., 2008. Development of CMPS method for accurate water-surface tracking in breaking waves. Coast Eng. J. 50 (2), 179–207.
Khayyer, A., Gotoh, H., 2016. A multiphase compressible-incompressible particle method for water slamming. Int. J. Offshore Polar 26, 20–25.
Klaseboer, E., Hung, K.C., Wang, C., Wang, C.W., Khoo, B.C., Boyce, P., Debono, S., Charlier, H., 2005. Experimental and numerical investigation of the dynamics of an underwater explosion bubble near a resilient/rigid structure. J. Fluid Mech. 537, 387–413.
Koshizuka, S., Oka, Y., 1996. Moving-particle semi-implicit method for fragmentation of incompressible fluid. Nucl. Sci. Eng. 123, 421–434.
Koshizuka, S., Nobe, A., Oka, Y., 1998. Numerical analysis of breaking waves using the moving particle semi-implicit method. Int. J. Numer. Methods Fluid. 26, 751–769.
Lee, B.H., Park, J.C., Kim, M.H., Hwang, S.C., 2011a. Step-by-step improvement of MPS method in simulating violent free-surface motions and impact-loads. Comput. Methods Appl. Mech. Eng. 200, 1113–1125.
Lee, B.H., Park, J.C., Kim, M.H., Hwang, S.C., 2011b. Moving particle simulation for mitigation of sloshing impact loads using surface floaters. Comput. Model. Eng. Sci. 75, 89–112.
Lucy, L.B., 1977. A numerical approach to the testing of the fission hypothesis. Astron. J. 82, 1013–1024.
Ma, X.J., Zhao, X., Huang, B., Fu, X.Y., Wang, G.Y., 2020. On study of non-spherical bubble collapse near a rigid boundary. J. Hydrodyn. 32 (3), 523–535.
Massoud, E.Z., Xiao, Q., El-Gamal, H.A., 2020. Numerical study of an individual Taylor bubble drifting through stagnant liquid in an inclined pipe. Ocean Eng. 195, 106648.
Murai, Y., Sakamaki, H., Kumagai, I., Park, H.J., Tasaka, Y., 2020. Mechanism and performance of a hydrofoil bubble generator utilized for bubbly drag reduction ships. Ocean Eng. 216, 108085.
Pan, K.L., Chen, Z.J., 2014. Simulation of bubble dynamics in a microchannel using a front-tracking method. Comput. Math. Appl. 67, 290–306.
Shakibaeinia, A., Jin, Y., 2012. MPS mesh-free particle method for multiphase flow. Comput. Methods Appl. Mech. Eng. 229–232, 13–26.
Sun, P.N., Li, Y.B., Ming, F.R., 2015. Numerical simulation on the motion characteristics of freely rising bubbles using smoothed particle hydrodynamics method. Acta Phys. Sin. 64, 174701.
Tanaka, M., Masunaga, T., 2010. Stabilization and smoothing of pressure in MPS method by quasi-compressibility. J. Comput. Phys. 229, 4279–4290.
Tang, Z.Y., Zhang, Y.L., Wan, D.C., 2016. Numerical simulation of 3-D free surface flows by overlapping MPS. J. Hydrodyn. 28, 306–312.
Tian, Z.L., Zhang, A.M., Liu, Y.L., Tao, L.B., 2021. A new 3-D multi-fluid model with the application in bubble dynamics using the adaptive mesh refinement. Ocean Eng. 230, 108989.
Trevorrow, M.V., Vagle, S., Farmer, D.M., 1994. Acoustical measurements of microbubbles within ship wakes. J. Acoust. Soc. Am. 95, 1922–1930.
X. Wen et al.
Ocean Engineering 238 (2021) 109743
27
Walters, J.K., Davidson, J.F., 1962. The initial motion of a gas bubble formed in an inviscid liquid Part 1. The two-dimensional bubble. J. Fluid Mech. 12, 408–416.
Wu, C., Ding, H., Han, L., 2018. The development and test of a sensor for measurement of the working level of gas–liquid two-phase flow in a coalbed methane wellbore annulus. Sensors 18, 579.
Xie, F.Z., Zhao, W.W., Wan, D.C., 2020. CFD simulations of three-dimensional violent sloshing flows in tanks based on MPS and GPU. J. Hydrodyn. 32 (4), 672–683.
Yu, J., Liu, G.Z., Wang, J., Wang, H.K., 2021. An effective method for modeling the load of bubble jet in underwater explosion near the wall. Ocean Eng. 220, 108408.
Zhang, A.M., Sun, P.N., Ming, F.R., 2015. An SPH modeling of bubble rising and coalescing in three dimensions. Comput. Methods Appl. Mech. Eng. 294, 189–209.
Zhang, J., Liu, J., 2020. Numerical investigation of frictional drag reduction with an air layer concept on the hull of a ship. J. Hydrodyn. 32 (3), 591–604.
Zhao, X.D., Liang, S.X., Sun, Z.C., Zhao, X.Z., Sun, J.W., Liu, Z.B., 2017. A GPU accelerated finite volume coastal ocean model. J. Hydrodyn. 29 (4), 679–690.
Zhang, X.S., Wang, J.H., Wan, D.C., 2021. Euler-Lagrange study of bubble breakup and coalescence in a turbulent boundary layer for bubble drag reduction. Phys. Fluids 33, 037105.
Zhang, Y.L., Wan, D.C., 2017. Numerical study of interactions between waves and free rolling body by IMPS method. Comput. Fluids 155, 124–133.
Zhang, Y.L., Wan, D.C., 2018. MPS-FEM coupled method for sloshing flows in an elastic tank. Ocean Eng. 152, 416–427.
Zhang, Y.X., Wan, D.C., 2012. Numerical simulation of liquid sloshing in low-filling tank by MPS. J. Hydrodyn. 27 (1), 100–107.
Zhang, Y.X., Wan, D.C., Hino, T., 2014. Comparative study of MPS method and level-set method for sloshing flows. J. Hydrodyn. 26, 577–585.
Zhu, X.S., Cheng, L., Lu, L., Teng, B., 2011. Implementation of the moving particle semi- implicit method on GPU. Sci. China Phys. Mech. Astron. 54, 523–532.
X. Wen et al.