a model of cultu re in trading agents
TRANSCRIPT

See discussions, stats, and author profiles for this publication at: https://www.researchgate.net/publication/302199604
A Model of Culture in Trading Agents
Chapter · January 2013
DOI: 10.1007/978-94-007-5574-1_4
CITATIONS
0READS
93
3 authors, including:
Some of the authors of this publication are also working on these related projects:
PhD Farming Innovation Systems View project
negotiation support systems View project
Gert Jan Hofstede
Wageningen University & Research
210 PUBLICATIONS 7,592 CITATIONS
SEE PROFILE
Catholijn M. Jonker
Delft University of Technology
542 PUBLICATIONS 6,325 CITATIONS
SEE PROFILE
All content following this page was uploaded by Catholijn M. Jonker on 04 June 2016.
The user has requested enhancement of the downloaded file.

A Model of Culture in Trading Agents
Gert Jan Hofstede, Catholijn M. Jonker, and Tim Verwaart
Abstract Geert Hofstede’s five-dimensional framework is widely used in socialsciences and management science to characterize cultures. It has been suggested tobuild culturally consistent agent characters based on his framework. This chapterstresses the relevance of culture and trust for trade, substantiates why a dimensionalmodel offers a good basis for cultural differentiation of agents, and presents anapproach to apply Hofstede’s model to develop culturally differentiated agents. Theapproach is based on knowledge acquisition on a dimension-by-dimension basisand a computational method to integrate the acquired knowledge. The approach hasbeen applied to a multi-agent simulation of a trade game. It is instantiated for theprocesses of partner selection, negotiation, and the interaction between deceit andtrust in trade.
Keywords Cultural dimensions • Trust • Trade • Multi-agent simulation
1 Introduction
Great differences in personality may exist between people. On the other hand,all people around the world have their human nature in common. Human natureincludes life in society. One can observe groups of people, on scales ranging from
G.J. Hofstede (�)Social Sciences, Wageningen University, Hollandseweg 1, 6706 KN Wageningen, TheNetherlandse-mail: [email protected]
C.M. JonkerInteractive Intelligence Group, Delft University of Technology, Mekelweg 4, 2624 PS, Delfte-mail: [email protected]
T. VerwaartLEI Wageningen UR, Alexanderveld 5, 2585 DB den Haag, The Netherlandse-mail: [email protected]
K. Sycara et al. (eds.), Models for Intercultural Collaboration and Negotiation,Advances in Group Decision and Negotiation 6, DOI 10.1007/978-94-007-5574-1 4,© Springer ScienceCBusiness Media Dordrecht 2013
67

68 G.J. Hofstede et al.
clans to nations, living together and having common behaviors that distinguish themfrom other groups.
Hofstede (2001, p. 9) defines culture as “the collective programming of the mindthat distinguishes one group or category of people from another”. This implies thatculture is not an attribute of individual people, unlike personality. It is an attributeof a group that manifests itself through the behaviors of its members.
A shared understanding of the world is essential for social life. From earlychildhood on the cultural meaning systems are anchored in the minds of people andpermanently reinforced and extended by joint activities with other group members.Kashima (2009) concludes that the joint activities members of a culture engage in“are in fact the very activities that get their society and culture going. They produceand reproduce the social relationships and cultural resources that enabled thesejoint activities to begin with” (Kashima).
Groups share value systems and practices – Hofstede refers to rituals, heroes,and symbols as practices. These are transferred from generation to generation. Thepractices are the observable characteristics of a culture. Over time and under theinfluence of contacts with other cultures, practices may change far more easily thanthe value systems that constitute the core of a culture (Hofstede, 2001).
The present work focuses on the way culture influences trade. The relevanceof cultural conflict in trade grows with the current trend of globalization. In atrading situation, culture of the trader manifests itself in four ways. First, culturefilters observation. It determines the salience of clues about the acceptability oftrade partners and their proposals. Second, culture sets norms for what constitutesan appropriate partner or offer. Third, it sets expectations for the context of thetransaction, e.g. the enforceability of regulations and the possible sanctions in caseof breach of the rules. Fourth, it sets norms for the kind of action that is appropriategiven the other three and, in particular, the difference between the actual and thedesired situation.
One of the most prominent, problematic, issues in trade that depend on cultureis trust between trade partners (Hofstede, 2006; Hofstede, Spaans, Schepers,Trienekens, & Beulens, 2004). Trust is the aspect of trade where lack of commonground pre-eminently manifests itself. Trust is an important issue in trade, becauseof the information asymmetries between suppliers and customers, which becomemore salient in longer supply chains, and because of the inevitable incompletenessof contracts (Williamson, 1985, 1998). Many definitions have been given for trust.For the present work a pragmatic definition is used. Customer’s trust in a particularsupplier is defined as the customer’s estimate of the probability that the supplier willdeliver as agreed, even if the supplier has the incentive and the opportunity to defect.
Agent-based modeling offers new opportunities to study trust and culture intrade. Agent-based modeling enables the study of emergent phenomena at anaggregated level that originate from the behaviors and interactions of individuals.As such it provides an analogue to culture: culture has no other representation thanin the minds of its members. Culture is a form of collective intelligence, physicallyrepresented in the brains of individuals, grounded during the common activitieswhere its observable properties emerge. Trade is such a common activity.

A Model of Culture in Trading Agents 69
Agent-based models can be applied as a research tool in combination withsimulation gaming (Tykhonov, Jonker, Meijer, & Verwaart, 2008). Observations ingaming simulations can lead to theorizing about the decision models of participants.These models can be implemented in the multi-agent simulation, in order to validatethat the hypothetical models lead to the behavior that was observed in the gamingsimulation.
The context of the agent-based model presented in the present chapter is theTRUST & TRACING (T&T) game. In runs of this gaming simulation, considerabledifferences in outcomes are observed across cultures. These observations werethe reason to develop this model. Meijer (2009) discusses the validity of thegaming simulation, according to validation aspects as defined by Raser (1969):psychological reality, structural validity, process validity, and predictive validity.The T&T game is an abstract game, not representing or predicting the performanceof an actual instance of a real world supply chain. It offers process validity in alaboratory environment, based on psychological reality.
This chapter is structured as follows. The first sections to follow are devoted torelated work, including the T&T game, the modeling approach, and the researchquestions. Then Hofstede’s dimensions of culture and their hypothetical effects onthe processes in the T&T game are discussed. The last three sections present anintegrated model of the five dimensions’ joint effect, examples of simulation results,and the conclusion of this work.
2 Related Work
There is a wealth of literature on trade and culture that so far has not been consideredin formalized models of trade. In agent-based economics, individual traders aremodeled as intelligent agents cooperating in an artificial trade environment. Theagents are modeled to mimic authentic human behavior as closely as possible. Inrecent papers the differences between such agents are no longer solely attributedto differences in their individual economic situations. Aspects such as personalityand attitude are considered as well, see, e.g. (Jager & Mosler, 2007). Withoutconsidering such aspects, the simulations will not correspond to reality. Withrespect to formalizing the important influence of cultural background on trade,we only found a few papers. These papers study trade at the macro-level, e.g.,(Konya, 2006). That paper presents an equilibrium analysis on the amount countriesinvest in learning another language and culture and the size and welfare of thosecountries. Another example is (Bala & Long, 2005). That paper presents a formalmodel of the influence of trade on culture, i.e., the reverse direction of influenceas studied in the current chapter. Other literature also uses macro-level models,such as the gravity model to study the correlation between culture and trade(Guo, 2004).
Kersten (2002) urges the necessity of cultural adaptation of e-Business systemsand proposes an architecture that adapts both business logic and user interface. The

70 G.J. Hofstede et al.
rationale for adapting systems to user’s cultures is given by Kersten, Koszegi, andVetschera (2002), who report significant differences in expectations, perception ofthe opponent, negotiation process, and outcomes of electronic negotiations acrosscultures. However, no actual implementations of models of culture in e-Businesswere found. Blanchard and Frasson (2005) report an application of Hofstede’sdimensions in a model to adapt e-Learning systems to the user’s culture. Recentresearch on cultural modeling in agents mostly focus on Embodied ConversationalAgents (ECA), including non-verbal behavior like facial expressions, gestures,posture, gazing, and silence in conversations (Payr & Trappl, 2004; Rehm, Nishida,Andre, & Nakano, 2008). CUBE-G (Rehm et al., 2008) is based on Hofstede’sdimensions and focuses on modeling into virtual characters the processes of firstmeeting, negotiation, and interaction in case of status difference.
All models discussed so far have in common that they model culture with thepurpose to support human decision making or to improve human-computer inter-action. The purpose of the model proposed in the present chapter is to realisticallysimulate emergent behavior in multi-agent based simulations for research in thesocial sciences. The aspects of ECA are of less relevance in this context. Agentbehavior may be modeled in a more stylized way. An approach that does so for thepurpose of multi-agent simulations is that of Silverman et al. (2007) and Silverman,Johns, Cornwell, and O’Brien (2006). They model agents as a composition ofbiological, personal (personality, culture, emotions), social (relations, trust), andcognitive (decision) modules, completed with modules for perception, memory,and expression. Their approach is a generic structure for modeling the influenceof culture on agent behavior – along with factors like stress, emotion, trust, andpersonality – through Performance Moderator Functions (PMF). It differs from ourapproach in that it is an environment to implement validated models of culturallydifferentiated behavior, while our approach aims to develop and validate suchmodels.
The model presented in this chapter is based on the TRUST & TRACING(T&T) game (Meijer, 2009), a research tool designed to study human behavior incommodity supply chains and networks. The focus of study is on trust in statedquality of commodities. The game is played by a group of 12 up to 25 persons thatplay roles of producers, middlemen, retailers, or consumers. The goal of producers,middlemen and retailers is to maximize profit. The consumers’ goal is to maximizesatisfaction. Each player receives (artificial) money. Producers receive envelopesrepresenting lots of commodities. Each lot is of a certain type of product and ofeither low or high quality. High quality products give more satisfaction points thanlow quality products. A ticket covered in the envelope (so it is not visible) representsquality. The producers know the quality. Other players have to trust the qualitystatement of their suppliers, or request a product trace at the cost of some moneyand some damage to the relations with their suppliers. The game leader acts as atracing agency and can on request and at the cost of a fee determine product quality.In case of deception the game leader will trace transactions and punish deceiverswith a fine and public disgrace.

A Model of Culture in Trading Agents 71
3 Modeling Approach
One must lean on social sciences literature to model culture. Two main streamsof research can be distinguished. First, there is the anthropological approach of“thick description”, in which specific cultures are studied by detailed and closeobservation of behaviors during an extensive time-span. Examples are the works ofLevi-Strauss (1992) and Geertz (1973). Second, there is the comparative approachthat tries to identify dimensions on which different cultures can be ordered, aimingto develop a classification system in which cultures can be typed by a small numberof qualifications. Examples are the models of culture by Hofstede (2001), Schwarz(2009), Trompenaars (1993) and GLOBE (House, Hanges, Javidan, Dorfman, &Gupta, 2004). The approach of that type of research is to characterize cultures bytheir indices on a limited number of dimensions. The dimensions and the indices ofcultures are typically created by factor analyzing massive surveys with standardizedquestionnaires in many countries. The value of such dimensions largely dependson the questionnaires used in combination with the sets of respondents that arerequired. Questionnaire studies will be more reliable predictors of behavior if theyare about the desired (for self) than if they are about the desirable (for everyone), andalso if they are asked to a broad range of types of respondents as opposed to just onetype (e.g., students or managers). The resulting models provide a linear ordering ofcultures along each dimension, where implicit norms are hypothesized to be strongeror weaker according to the index on the dimension. As authors of dimensionalmodels stress, these same implicit norms carry over to all relationships in society. Inall social situations, they act as filters on perception and on action range. This meansthat there are no specific values for activity x, e.g. ‘trade values’, in a dimensionalmodel. It also means that a dimensional model is suited for modeling any processthat involves social intercourse, including trade and its sub-activities.
Cultural descriptions of the first type provide rich details about values, norms,symbols, beliefs, rituals, social structure, behavioral patterns, etc., in a particularculture. These will prove very useful for facsimile modeling of specific socialsystems. The model proposed in the present chapter aims to compare the influence ofa great diversity of cultures in the standardized environment of a gaming simulationwhich is by itself an abstraction of social life. For that purpose we need to positthe model at an impartial distance from any single culture. A dimensional modelof culture is more suited than a collection of incommensurable rich descriptions.Dimensional models are culture-level abstractions. They do not depict individuals,but average group characteristics, and therefore the agents in our simulation will beiconic for a culture, not specific for any individual.
The work of Hofstede (2001) focuses on differences between national cultures,particularly on differences in value systems across nations. The computationalmodels of the effects of culture proposed in this chapter are based on that work.Although other dimensional models of culture could certainly be used for similarpurposes, Hofstede’s framework was chosen over possible other candidates (suchas Hall, 1976; House et al., 2004; Schwarz, 2009; Trompenaars, 1993) for various

72 G.J. Hofstede et al.
reasons. First, Hofstede’s work is parsimonious and accessible, with only fivedimensions1 compared to GLOBE’s 18, and with its 1–100 scales. Second, ithas a wide scope, compared to Trompenaars’, whose dimensions are statisticallycorrelated and can be described as aspects of only individualism and power distance(Smith, Dugan, & Trompenaars, 1996) or Hall who focused on the dimensionof individualism (low-context communication) versus collectivism (high-contextcommunication). Those models miss out on issues related to gender roles, anxietyand Confucian values. Third, it has the greatest empirical base of these studies,with a well-matched sample of 117,000 respondents to the original study plushundreds of replications during a quarter century that validate the model (Kirkman,Lowe, & Gibson, 2006; Schimmack, Oishi, & Diener, 2005). Fourth, it is the mostwidely used. It has survived fashions and hasty storms of criticism (Smith, 2006;Sondergaard, 1994). Fifth and most important, it shows continued predictive valuefor many societal phenomena (Hofstede, 2001; Smith, 2002).
For the endeavor documented in this chapter, not only a model of culture isessential, but also a model of trade. A process model comprising six main processeswas elaborated, where possible based on validated models reported in social scienceor artificial intelligence literature. The six main processes are:
1. trade goal selection (e.g., buy or sell), based on agent role and stock position2. partner selection, based on the model of Weisbuch, Kirman, and Herreiner (2000)3. negotiation, based the ABMP architecture (Jonker & Treur, 2001)4. delivery, truthfully or untruthfully according to results from social psychology5. acceptance of deliveries, and decision to trust or trace, based on dynamic trust6. belief updates and trust dynamics (Jonker & Treur, 1999)
Having decided on a model of trade and a dimensional model of culture,the next step was to model the interaction between the two models. The effectsof culture were modeled on a dimension-by-dimension basis, using a classicalexpert systems knowledge acquisition approach: literature study, expert interviews,formalization and verification of the model, and face validation of results. Theresults of the dimension-by-dimension analysis are described in separate papersper dimension (Hofstede, Jonker, Meijer, & Verwaart, 2006; Hofstede, Jonker,& Verwaart, 2008a; Hofstede, Jonker, & Verwaart, 2008b; Hofstede, Jonker, &Verwaart, 2008c; Hofstede, Jonker, & Verwaart, 2009a). An overview is given inthis chapter in Sect. 5.
Subsequently, the models for the individual dimensions were integrated ona process-by-process basis, except for the trade goal selection, which is notmodeled to depend on culture. The resulting culturally adapted decision modelsof the agents are described in separate papers (Hofstede, Jonker, & Verwaart,2009b, 2010a, 2010b), as is the computational approach to integration of the
1A sixth dimension ‘Indulgence versus Restraint’ was added in 2010 (Hofstede, Hofstede &Minkov (2010), after completion of the present model.

A Model of Culture in Trading Agents 73
dimension-by-dimension expertise (Hofstede, Jonker, & Verwaart, 2011). Sec-tion 5.6 presents an overview of the process models and the effects of culture.
The integration into an all-singing, all-dancing model has been verified througha meta-modeling based sensitivity analysis (Burgers, Hofstede, Jonker, & Verwaart,2010).
The model has been implemented in the CORMAS multi-agent environment.2
4 Research Questions
This work aims to differentiate the behavior of artificial agents that simulate aspectsof human behavior, as if the agents had a cultural background. Two assumptionsunderlie this attempt. The first is that it is possible to define models of agentsthat share universal, globally valid, properties with human behavior at least in theselected processes of trade. The second is that it is possible to formalize expertiseabout how culture differentiates these models.
To give an example of the first assumption: to a Western mind negotiation maywell be perceived as a sequence of alternating explicit proposals, but would anothermodel fit better to practices in other parts of the world? In this research we do notattempt to answer this kind of questions. We assume that social science literaturecan provide the modeler with a set of theories of human behavior that have universalcoverage for the domain of study and that may have parameters that may be differentbetween cultures.
The main hypothesis of this work is related to the second assumption. Thishypothesis is that a composition of universal models of human decision makingin a particular domain and a dimensional model of culture can simulate believabledifferentiation of behavior across cultures. With believable we mean that thebehavior simulated by the agents can pass face validation by experts in the culturaldifferentiation in the domain of application.
The main research question “how can a model be formulated that adapts universaldecision functions to culture according to a theory about the dimensions of culture”entails the following, more specific questions.
• Given a universal model of human behavior in some domain, can the modelof culture’s effects be formulated, following an expert systems knowledgeacquisition approach?
• Having formulated the knowledge about the effects of culture on model para-meters per dimension, how can a believable model of their joint effect beformulated?
2http://cormas.cirad.fr/indexeng.htm

74 G.J. Hofstede et al.
• How can the sensitivity of such a model be assessed for variation of culturaldimension indices, relational configurations regarding power and group mem-bership, and universal model parameters?
• Can such a model be applied to fulfill its function as a social sciences researchinstrument in combination with simulation gaming? This function comprises(Meijer & Verwaart, 2005):
– Validation of models of behavior induced from game observations– Testing of hypotheses about dynamics of aggregated results in relation to
parameter changes in individual behavior– Test design: selection of useful configurations for games with humans
The questions are answered in the context of the T&T game, by applyingHofstede’s dimensional theory of culture to three universal domain models, forpartner selection, negotiation, and the interaction between deceit and trust.
5 Hofstede’s Dimensions and Their Effects on Trade
Hypothetical differences in behavior can be formulated for traders from differentcultures on the basis of the works Hofstede (2001) and Hofstede, Hofstede,and Minkov (2010) and observations in the T&T game (Meijer, 2009). Whilein reality, individual behaviors are co-determined by historical, contextual andpersonality factors, these can be abstracted away in the present study of trends ofbehavior in groups of people. Before creating an integrated model, the behavioraltendency associated with each dimension will be reviewed. The dimensions inHofstede’s model, to be discussed in the following subsections, are masculinityversus femininity, individualism versus collectivism, power distance, uncertaintyavoidance, and long-term versus short-term orientation. Each of the dimensions isbriefly characterized and expected distinctions between the extremes are specified,based on the work of Hofstede and expert consultations.
5.1 Masculinity Versus Femininity
In masculine societies people are expected to place value on measurable perfor-mance criteria such as size, speed and quantity. Big is beautiful. Money is good.Rich people are admired. Life is conceptualized as a series of contests and winningis paramount while losing is a disaster. Implicit trust is low; if you get cheated it isyour own fault and you are a loser. If you do good, you do it in the large. If youcommit crimes, they are large, not petty ones.
Feminine societies are the opposite. Winners are at risk of awakening feelingsof jealousy. Small is beautiful, implicit trust is high, and cheaters are looked downupon. Yet small-scale cheating occurs a lot because society is permissive and, inthe case of small misdemeanors, forgiving. Penalties are mild. Good intentions aremore important than good performance.

A Model of Culture in Trading Agents 75
Table 1 Expected behavioral distinctions between traders in the T&T game havingmasculine versus feminine cultural backgrounds
Masculine Feminine
Deal with anyone Build relationshipsRapid deals, as many goods as possible Take time to negotiate, accept small dealsBe a tough negotiator Show mutual willingness to accommodateCheat and expect to be deceived TrustShow off with highly valuable goods Purchase for practical useTrace and enforce delivery to contract Avoid notorious deceivers
Sources: Hofstede (2001), and expert consultations
The meaning of trust across cultures is related to the dimension of masculinityversus femininity. In fact, the statement ‘Most people can be trusted’ was one of theconstituents of the dimension in Hofstede’s original research. In feminine cultures,people agree with it more. Since then, many others have investigated the variationsof the meaning of the concept across cultures. See e.g. Hofstede et al. (2004) fora discussion of the dynamics of trust and transparency across cultures. Hofstede(2006) distinguishes intrinsic trust from enforceable trust. Intrinsic trust is trust thataccepts vulnerability, while enforceable trust is trust in good performance that isbacked up by the option of rewarding and punishing the trustee. To sum it up in asimplified way: the former is what people mean by trust in feminine cultures, andthe latter is what people mean by trust in masculine cultures.
Table 1 summarizes expected distinctions reported by Hofstede et al. (2006).
5.2 Individualism Versus Collectivism
The variation in basic group size and cohesion between societies has been shownby sociologists, e.g., in the distinction between Gemeinschaft (community) andGesellschaft (society) that Tonnies introduced as early as 1887 (Tonnies, 1963).In a Gemeinschaft, people share everything, both material and immaterial, whereasin a Gesellschaft, private property and other individual-centered institutions arepossible. This variation has been confirmed by social-psychological cross-nationalstudies of practices or values. Triandis (1995) and Hofstede (2001) speak of thedistinction between individualism and collectivism. Minkov (2007) showed thatthe individualist-collectivist continuum is visible in World Values Survey data (henames it universalism versus exclusionism). This dimension has become the mainingredient of theories about cross-cultural business, e.g., in the work of Trompenaars(1993) who posits a number of dimensions of culture that were shown by Smith et al.(1996) to be correlated with individualism versus collectivism. The relevance of thisdimension to the management literature lies in the fact that Anglo countries are atthe extreme individualistic end of the scale, so business partners from almost anycountry are bound to have more collectivistic cultures.
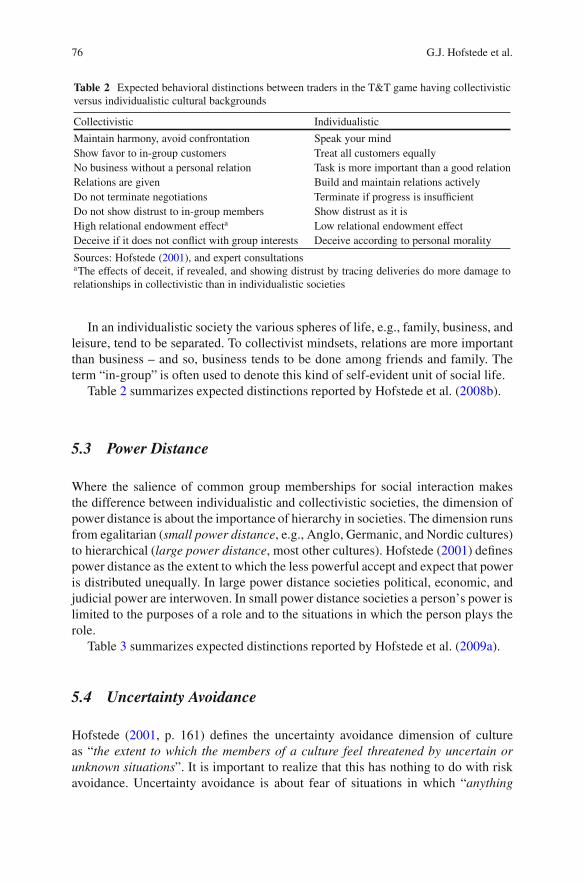
76 G.J. Hofstede et al.
Table 2 Expected behavioral distinctions between traders in the T&T game having collectivisticversus individualistic cultural backgrounds
Collectivistic Individualistic
Maintain harmony, avoid confrontation Speak your mindShow favor to in-group customers Treat all customers equallyNo business without a personal relation Task is more important than a good relationRelations are given Build and maintain relations activelyDo not terminate negotiations Terminate if progress is insufficientDo not show distrust to in-group members Show distrust as it isHigh relational endowment effecta Low relational endowment effectDeceive if it does not conflict with group interests Deceive according to personal morality
Sources: Hofstede (2001), and expert consultationsaThe effects of deceit, if revealed, and showing distrust by tracing deliveries do more damage torelationships in collectivistic than in individualistic societies
In an individualistic society the various spheres of life, e.g., family, business, andleisure, tend to be separated. To collectivist mindsets, relations are more importantthan business – and so, business tends to be done among friends and family. Theterm “in-group” is often used to denote this kind of self-evident unit of social life.
Table 2 summarizes expected distinctions reported by Hofstede et al. (2008b).
5.3 Power Distance
Where the salience of common group memberships for social interaction makesthe difference between individualistic and collectivistic societies, the dimension ofpower distance is about the importance of hierarchy in societies. The dimension runsfrom egalitarian (small power distance, e.g., Anglo, Germanic, and Nordic cultures)to hierarchical (large power distance, most other cultures). Hofstede (2001) definespower distance as the extent to which the less powerful accept and expect that poweris distributed unequally. In large power distance societies political, economic, andjudicial power are interwoven. In small power distance societies a person’s power islimited to the purposes of a role and to the situations in which the person plays therole.
Table 3 summarizes expected distinctions reported by Hofstede et al. (2009a).
5.4 Uncertainty Avoidance
Hofstede (2001, p. 161) defines the uncertainty avoidance dimension of cultureas “the extent to which the members of a culture feel threatened by uncertain orunknown situations”. It is important to realize that this has nothing to do with riskavoidance. Uncertainty avoidance is about fear of situations in which “anything

A Model of Culture in Trading Agents 77
Table 3 Expected behavioral distinctions between traders in the T&T game having hierarchicalversus egalitarian cultural backgrounds
Large power distance (hierarchical) Small power distance (egalitarian)
Might is right No privileges and status symbolsFormal speech; acknowledgement Talk freely in any contextDictate, obey NegotiateNegotiate only in case of equal powerPrefer equal status partners Treat all (potential) business partners equallyAvoid more powerful business partners, but
show favor when unavoidableBe patient and conceding with powerful partnersBe careful not to deceive more powerful
partnersDo not show distrust to more powerful partnersNo need to distrust less powerful partnersTrade products of quality according to status
Sources: Hofstede (2001), and expert consultations
can happen and one has no idea what” : : : “Uncertainty-avoiding cultures shunambiguous situations. People in such cultures look for structure in their organiza-tions, institutions, and relationships, which makes events clearly interpretable andpredictable. Paradoxically, they are often prepared to engage in risky behavior inorder to reduce ambiguities – such as starting a fight with a potential opponentrather than sitting back and waiting” (Hofstede, p. 148).
People from highly uncertainty avoiding societies or groups do not tolerateambiguity as to who is a member of their group. They tend to have strict moralcriteria as to who fits in: adherents of the same religious subgroup, perhaps, orpeople from the same region, people with the same profession or status, peoplewho speak their language, people of their gender, or similar clear-cut criteria. Sincepeople from such societies do not easily engage in interactions with others who donot share their most salient group characteristics, trade will often be a within-groupactivity. Within-group contacts are charged with tokens of loyalty, often throughshared ritual that is needed to counteract the stress that people experience.
Societies or groups that are uncertainty tolerant are easy travelers, and willengage in novel activities without needing much time to adjust. Their socialinteractions tend to be laid-back and they will strike up trade relations withforeigners if the opportunity presents itself.
Table 4 summarizes expected distinctions reported by Hofstede et al. (2008a).
5.5 Long-Term Versus Short-Term Orientation
Behaving as a good, upstanding member of the group is at the core of the lives ofall beings that live in social groups (Wilson, 2007). Human beings are intensely

78 G.J. Hofstede et al.
Table 4 Expected behavioral distinctions between traders in the T&T game having uncertaintytolerant versus uncertainty avoiding cultural backgrounds
Uncertainty tolerant Uncertainty avoiding
Suppression of emotions Expression of emotions; strong emotions whendeceit is revealed
Willingness to take unknown risks Only known risks are takenOpenness to innovations Distrust, strong endowment effectTolerance of diversity Avoid strangersComfortable with ambiguity and chaos Need for clarity and structureAppeal of novelty and convenience Appeal of purity, high qualityRelaxed negotiation style Impatient, time is moneyFrequency of deceit depends on relationships Low deceit threshold toward strangers
Sources: Hofstede (2001), and expert consultations
social and they exemplify the point very well. Ensuring the successful functioningof our social groups is a basic requirement for survival. We spend up to 20 yearsbeing taught how to act as virtuous members of society. But how to be virtuous? Itturns out that different societies have found different answers to that question. Theissue of whether the sources of virtue are to be found in the past and present, orin the future, is one of the basic dimensions of culture found by Hofstede (2001).This fifth dimension, called ‘long-term versus short-term orientation’ by Hofstede,is very important for trade. Its strong correlation with economic growth across 39countries in the period 1970–2000 testifies to its relevance for trade (Hofstede &Hofstede, 2005, p. 223).
Hofstede (2001, p. 359) gives the following definition of the LTO-dimension:“Long Term Orientation stands for the fostering of virtues oriented towards futurerewards, in particular, perseverance and thrift. Its opposite pole, Short TermOrientation, stands for the fostering of virtues related to the past and the present,in particular, respect for tradition, preservation of ‘face’, and fulfilling socialobligations”. Long-term orientation is correlated with self-effacement. This wasfound by Minkov (2007) in a meta-analysis of data from the World Values Survey.The individual thinks of itself as a small element within the continuity of life. Hence,learning and developing one’s capacities is more important than winning a particulargame, or obtaining a particular result. In contrast, short-term orientation correlateswith self-enhancing values in which being successful in a game is a desirable thingthat will improve one’s reputation.
Table 5 summarizes expected distinctions reported by Hofstede et al. (2008c).
5.6 The Joint Effects of Hofstede’s Dimensions
The preceding subsections describe how agent behavior in trade is expected tovary across cultures along a single dimension. This approach enables knowledgeacquisition. An expert can explain the effects of individual dimensions, but cannotoversee the consequences of varying the indices simultaneously. As was shown

A Model of Culture in Trading Agents 79
Table 5 Expected behavioral distinctions between traders in the T&T game having short-termversus long-term oriented cultural backgrounds
Short-term oriented Long-term oriented
Immediate gratification of needs expected Deferred gratification of needs acceptedShort-term virtues taught: social consumption Long-term virtues taught: frugality, perseveranceSpending, top quality demanded, impatient Saving, investing, patientThe transaction bottom line, quick profits Building a strong market positionShow off, by trading with high status partners Invest in long-term relations
Sources: Hofstede (2001), and expert consultations
by Hofstede et al. (2006, 2008a, 2008b, 2008c, 2009a), the expertise laid downin narrative form can be formalized into production rules that work in two ways:modify (i.e. either increase or decrease) the values of parameters in decisionfunctions and modify the relevance of some decision functions.
The formal rules can be implemented in agents. In multi-agent simulations resultscan be generated for different values of the particular cultural index and for differentrelational configurations (status differences, different in-groups, differences ininitial trust etc.). These results can be used for verification of the implementation ofthe rules, for face validation of results, and even for educational purposes. However,to simulate actual national cultures, all dimensions must be taken into accountsimultaneously. A computational approach to this integration has been developed(Hofstede et al., 2011). This approach, like the models of the individual dimensions,is based on the adaptation of default parameter values in decision models. Theadaptation is made on the basis of the values of “cultural factors”. Some dimensionsadapt the perceived relevance of relational attributes, such as group membership(in-group versus out-group), status difference, and trust. Cultural factors combinedimension scores and relational attributes (see Table 10 at the end of this chapter).The integrated effect of culture on agent behavior can be modeled as a function hthat maps a vector of cultural factors Ef and a vector of default values of modelparameters Ex to a vector of culturally adjusted parameters Ex0:
h� Ef ; Ex
�D Ex0: (1)
The hypothesis of this work entails that, given the set of decision functions, adimensional theory of culture can be used (a) to identify the cultural factors to betaken into account and (b) to define the mapping h. If this is possible, the agentmodeling can benefit from vast bodies of social sciences literature that describe thedifferentiation of many behaviors along the dimensions of the cultural model.
The computational integration approach is based on the following assump-tions.
1. Given that dimensional models of culture aim to provide for each dimension alinear ordering of the strength of phenomena associated with that dimension, theeffect of each cultural factor may be modeled as a strictly monotonic function rijk
that adapts the i-th parameter to the k-th factor associated with the j-th dimension.

80 G.J. Hofstede et al.
rijk can be seen as a member of a set of functions that can be indexed by the labelsof cultural factors and parameters as arguments.
2. As long as there is no further evidence, a first order approach can be taken, i.e.,let rijk adjust xi proportionally to fjk from its default value in the direction of theextreme values "C
ijk > xi and "�ijk < xi , with "C
ijk and "�ijk universal, i.e. not
dependent on culture, for a particular domain.3. The interaction between decision function parameters does not depend on
culture. This assumes that a decision model can be formulated in such a waythat any parameter can be modified for culture without taking the values of theother parameters into account. This is not a very restrictive assumption. Forinstance if a decision function �.xi ; xi 0/ requires parameters xi < xi 0 , theparameters cannot independently be modified, but they can after substitution:�.xi ; xi 0/ D �.xi ; xi C xi 00/ D �0.xi ; xi 00/ with xi 00 > 0.
4. The joint decreasing and the joint increasing effect of cultural dimensions cancompensate for each other. This expertise is confirmed by expert statements, e.g.(in cultures with high power distance) “The powerful dictate the conditions. Theless powerful have to accept. In feminine or collectivist cultures the powerfulmay exercise restraint, : : : ”.
5. For the increasing and for the decreasing effects, the effect with maximalinfluence is dominant: effects in the same direction do not reinforce each other.According to expert knowledge, if several factors influence a parameter in equaldirection, it is sufficient for one to be maximal in order to sort maximal effect(disjunctive factor influence, see e.g. “feminine or collectivist” under 4. above).
6. Cultural factors working in the same direction do not reinforce each other. Forinstance, in Table 2 three factors are identified to have increasing effect on deceitthreshold db. If two of the factors have effect 0.5 and one has effect 0.2, their jointeffect is 0.5; not 0.4 (the average) or another linear combination (see 5. above);not 0.8 (probabilistic) or another product combination.
Under these assumptions, the mapping h can be written as a set of functions gi,one function for each parameter (Hofstede et al., 2011):
gi
� Ef ; xi
�Dxi C � O"C
i � xi
�max
˚fjkjljk 2LC
i
� C �O"�i � xi
�max
˚fjkjljk 2 L�
i
�:
(2)
The inputs to this equation are the (domain-dependent) default, minimal andmaximal values of the parameter, and the actual values fjk of the cultural factorslabeled ljk. The cultural factors are identified in the dimension-by-dimensionknowledge acquisition. Li
C stands for the set of cultural factors indicated to haveincreasing effect on xi and Li
� stands for the set indicated to have decreasing effect.In order to apply this approach, one needs models for the decisions that the agents
make in the simulated processes. The following subsections propose models for thetrade processes of partner selection and negotiation in the pre-contract phase oftransactions, and deceit and trust in the post-contract or delivery phase.
A Model of Culture in Trading Agents 81
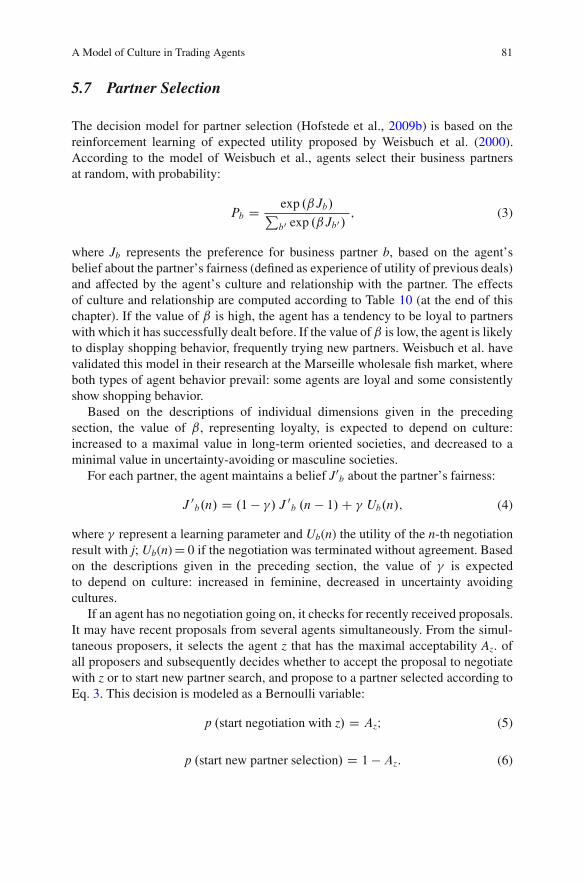
5.7 Partner Selection
The decision model for partner selection (Hofstede et al., 2009b) is based on thereinforcement learning of expected utility proposed by Weisbuch et al. (2000).According to the model of Weisbuch et al., agents select their business partnersat random, with probability:
Pb D exp .ˇJb/Pb0 exp .ˇJb0/
; (3)
where Jb represents the preference for business partner b, based on the agent’sbelief about the partner’s fairness (defined as experience of utility of previous deals)and affected by the agent’s culture and relationship with the partner. The effectsof culture and relationship are computed according to Table 10 (at the end of thischapter). If the value of ˇ is high, the agent has a tendency to be loyal to partnerswith which it has successfully dealt before. If the value of ˇ is low, the agent is likelyto display shopping behavior, frequently trying new partners. Weisbuch et al. havevalidated this model in their research at the Marseille wholesale fish market, whereboth types of agent behavior prevail: some agents are loyal and some consistentlyshow shopping behavior.
Based on the descriptions of individual dimensions given in the precedingsection, the value of ˇ, representing loyalty, is expected to depend on culture:increased to a maximal value in long-term oriented societies, and decreased to aminimal value in uncertainty-avoiding or masculine societies.
For each partner, the agent maintains a belief J0b about the partner’s fairness:
J 0b.n/ D .1 � �/ J 0
b .n � 1/ C � Ub.n/; (4)
where � represent a learning parameter and Ub(n) the utility of the n-th negotiationresult with j; Ub(n) D 0 if the negotiation was terminated without agreement. Basedon the descriptions given in the preceding section, the value of � is expectedto depend on culture: increased in feminine, decreased in uncertainty avoidingcultures.
If an agent has no negotiation going on, it checks for recently received proposals.It may have recent proposals from several agents simultaneously. From the simul-taneous proposers, it selects the agent z that has the maximal acceptability Az. ofall proposers and subsequently decides whether to accept the proposal to negotiatewith z or to start new partner search, and propose to a partner selected according toEq. 3. This decision is modeled as a Bernoulli variable:
p .start negotiation with z/ D AzI (5)
p .start new partner selection/ D 1 � Az: (6)

82 G.J. Hofstede et al.
AcceptabilityAb of an agent b is set equal to Jb, but for agents from hierarchicalsocieties the value is modified to express that agents having that cultural backgroundare inclined to accept a higher-ranked proposer even if they do not prefer the partner.
Table 10 (at the end of this chapter) summarizes the cultural factors taken intoaccount to modify the parameters and the variables of the partner selection process,applying Eq. 2 and using appropriate settings for the default, minimal, and maximalvalues of these parameters and variables.
5.8 Negotiation
The negotiation process (Hofstede et al., 2010a) is modeled according to the ABMParchitecture (Jonker & Treur, 2001). The similarity of ABMP to human negotiationshas been validated (Bosse, Jonker, & Treur, 2004). The ABMP process is anexchange of bids, starting with a bid by one of the partners. The agents evaluatebids using a utility function.
The agent model uses the utility function proposed by Tykhonov et al. (2008):
U D wvalueV C wqual Q C wriskR; (7)
with 0 � wvalue � 1, 0 � wqual � 1, 0 � wrisk � 1, and wvalue C wqual C wrisk D 1. Theterms of this function represent the economic value of the transaction and theeffects of agent’s quality preference and risk avoidance, respectively. For a furtherspecification of the computation of the utility function’s terms, we refer to Hofstedeet al. (2010a).
ABMP is a multi-attribute concession strategy. An agent prepares a bid thatis a utility concession to its previous bid. In the present simulation, the agentprepares the first bid by composing an attribute configuration according to its qualitypreference and risk attitude. After the price is set according to the agent’s beliefabout the market price range for the product (a seller sets the price at the maximalvalue, a buyer at the minimal value), the utility U1 of the first bid to be made iscomputed. In subsequent bids the partners make concessions with respect to theutility of their bid.
Concession factor � and negotiation speed � are the parameters that govern theconcession making. Concession factor �, 0 < � < 1, is the fraction of the openingbid’s utility that the agent is willing to give in during the negotiation. It determinesthe minimum utility that is acceptable to an agent, also called the reservation value:
Umin D .1 � �/ U1; (8)
where Umin represent the reservation value, and U1 the opening bid’s utility.Negotiation speed �, 0 < � < 1, is the fraction of difference between the agent’s
previous bid and the minimum utility that an agent uses to determine the targetutility of its next bid:

A Model of Culture in Trading Agents 83
UnC1 D Umin C .1 � �/ .Un � Umin/ ; (9)
where Umin represent the reservation value, and U1 the opening bid’s utility. In thecurrent simulation a bid is composed by changing the attribute values at random andsetting the price to yield the target utility.
After calculation of the utility of a partner’s bid and the target utility of its ownnext bid, the agent decides whether to accept partners bid or not, governed by theutility gap parameter !.
Acceptable utility gap ! is the maximal difference between own target utility andlast partner’s bid’s utility for which an agent will accept partner’s bid.
If the target utility minus the partner’s last bid’s utility is greater than theacceptable utility gap, the agent does not accept and has to decide about its nextaction. It can terminate the negotiation for several reasons. First, partner’s bid maybe interpreted as unrealistic if its utility is too far below the minimum utility. Second,an agent may be dissatisfied by the progress in partner’s bids. Third, there may beno more room for a substantial change of attributes to make a bid with the targetutility. In the latter case the agent terminates the negotiation. In the first two casesthe probability that the agent terminates the negotiation depends on the impatienceparameter �, 0 < � < 1 . The agent terminates the negotiation with probability � ifpartners bid is considered unrealistic, i.e. less than (1��)Umin, or partner makesinsufficient concessions, i.e. less than (1�Umin)� over the last three rounds.
The weight factors in the utility function and the ABMP parameters dependon the negotiation domain and on culture. Table 10 (at the end of this chapter)summarizes the effects of culture for the negotiation process. Equation 2 can beapplied to modify the values of weights and parameters, given default, minimal andmaximal values for a domain, e.g. the purchase of a supercomputer by a universityor transactions in a wholesale food market.
5.9 Opportunism and Trust
For a simulation of human trust and deceit, a strictly rational model is not sufficient(Hofstede et al., 2010b). In intelligent agent research, much attention has beenpaid to trust. Little research has been published about the simulation of deceit.Some authors modeled deceit as a rational strategy to gain advantage in competitivesituations (Castelfranchi, Falcone, & De Rosis, 2001; Ward & Hexmoor, 2003).A strictly rational approach of deceit neglects the emotional impact that deceit has,not only on the deceived, but also on the deceivers. Feelings of guilt and shameresult from deceiving and the extent to which these feelings prevail differs acrosscultures (Triandis et al., 2001). People have emotional thresholds for deceit thatcannot be explained from rational evaluation of cost and benefit, but that are basedon morality and cooperative attitudes (Boles, Croson, & Murnighan, 2000; Steinel& De Dreu, 2004; Wirtz & Kum, 2004). Once deceived, people react to an extent

84 G.J. Hofstede et al.
that goes beyond rationality (Boles et al., 2000), especially when they are pro-socialrather than selfish (Steinel & De Dreu, 2004). In human decision making a modelbased on fair trade prevails over a model of opportunistic betrayal (Olekalns &Smith, 2009). In addition to psychological factors, rational economic motives can begiven for the human inclination to cooperative behavior (Hwang & Burgers, 1999).
The decision to deceive depends on opportunity, motive, and attitude. A supplierhas an opportunity to deceive if a high quality product has to be delivered andthe customer did not require a certificate. A supplier has a motive to deceive ifan extra profit can be gained by deceiving, for instance if the customer negotiateda guarantee and the supplier expects the customer to trust the delivery. Whether asupplier actually deceives when opportunity and motive are present, depends on thesupplier’s threshold toward deceit. The threshold depends on the supplier’s moralityand may be reinforced by recent penalties or the relationship with the customer. Foragents in the TRUST & TRACING game, Hofstede et al. (2010b) model the decisionto deceive as a Bernoulli variable with probability of deceit
p .deceit/ D q .1 � c/ mb .1 � db/; (10)
where q represents the quality agreed in the current contract (q D 1 for high quality;q D 0 for low quality or no opportunity); c D 1 if certification has been agreed (noopportunity); c D 0 otherwise; mb represents the supplier’s motive or rationale todeceive customer b (mb D 1 if the supplier expects an extra profit from deceit;mb D 0 otherwise); db represents on the interval [0, 1] seller’s threshold for deceittoward customer b, where db D 1 represents perfect truthfulness. db is influenced byseller’s personal traits and values (like risk aversion and morality), power and grouprelations, and seller’s estimate of customer’s benevolence, i.e., seller’s trust that thecustomer will accept deliveries without tracing. A more detailed description of thedeceit model is given by Hofstede et al. (2010b).
Trust and distrust develop during social interactions. The only sources ofinformation that can be taken into account in the simulation of the Trust andTracing game are negotiation outcomes and tracing reports, which are relevantin reality as well. Every successful negotiation resulting in a transaction willstrengthen partners’ trust in each other. However, customers can decide to tracea delivery and this can have its effects on mutual trust. First, if tracing revealsdeceit, the customer’s trust in the seller will be reduced. Second, the fine and thereputational damage resulting from revealed deceit will reinforce the supplier’shonesty. However, reinforced honesty will decay in the course of time. Third, thesupplier delivering truthfully may be offended by tracing. To maintain a goodrelation, customers may exercise restraint to trace. Tracing will always reduce thesupplier’s belief about customer’s benevolence. The following dynamics have tobe modeled:
• development of trust and benevolence belief by successful negotiations;• for customers: reduction of trust in case of revealed deceit;• for suppliers: reinforcement of honesty in case of revealed deceit;

A Model of Culture in Trading Agents 85
• for suppliers: decay of reinforced honesty to a base level;• for suppliers: reduction of benevolence belief in case of tracing.
Jonker and Treur (1999) develop a classification of trust dynamics. The mostrealistic type for trading situations is slow positive – fast negative: it takes a series ofpositive experiences to develop trust, but trust can be destroyed by a single betrayal.A consumer’s trust in supplier b after the n-th experience is updated as:
tb.n/ D tb .n � 1/ C uC .1 � tb .n � 1// if nthexperience is positive;
tb.n/ D tb .n � 1/ � u�tb .n � 1/ if nthexperience is negative;tb.n/ D tb .n � 1/ if nthexperience is neither positive
nor negative; (11)
with 0 < uC < u� < 1, where tb D 1 represents complete trust and tb D 0 representscomplete distrust; a successful negotiation counts as a positive experience; a tracingreport revealing deceit counts as negative; all other experiences are consideredneither negative nor positive with respect to trust.
A supplier’s belief about a customer’s benevolence is updated by the samemechanism. A successful negotiation counts as a positive experience. Tracing countsas a negative experience for a supplier, whether it reveals deceit or not. An additionaleffect of revealed deceit on the supplier’s part is that supplier’s current honesty H(n)(a personal trait, representing the inclination to deliver truthfully) is reinforced to 1,representing maximal honesty. H will subsequently decay to a base value Hmin oneach interaction, whether it is successful or not, with a decay factor '.
H.n/ D Hmin C '.H.n � 1/ � Hmin/; with 0 < Hmin < 1 and 0 < ' < 1:
(12)
Trust developed according to Eq. 11 represents an internal state of mind, a beliefabout a partner. It can be seen as a subjective probability that a partner will notdefect even if motive and opportunity are present. According to Castelfranchi andFalcone (1998) trust exists as a state of mind, as a decision, and as a social behavior.Because of the repercussions distrust may have as a social behavior, the decision totrust does not necessarily correspond to trust as a state of mind. The inclination totrust depends on cultural factors. The decision to trust or to trace is modeled in thesimulation as a Bernoulli variable, with
p.trace/ D T 0; (13)
p.trace/ D 1 � T 0; (14)
where the culturally adapted inclination to trace T0 is computed by applying Eq. 2on the base value of T D q (1 � c) (1 � tb), using Table 10. Table 10 (at the end ofthis chapter) summarizes culture’s effects on the variables related to trust, deceit,and tracing.

86 G.J. Hofstede et al.
6 Simulation Examples
This section presents some simulation results. The first example confirms thatthe model is sensitive to culture and offers face validation at extreme values ofHofstede’s indices. The second example illustrates that model outputs are moresensitive to common group membership for agents configured with Japanesesettings than for USA settings. Then, sensitivity analysis results are presented toconfirm that in different cultures, different rules for agent behavior are relevant. Thelast example validates the feasibility of the model as a research instrument to beused in combination with gaming simulation, aiming to improve models of agentbehavior. It uses results of games played in the Netherlands and the USA.
The simulation results should not be interpreted as to give exact quantitativevalues. The results illustrate stylized facts, such as “common group membershipis more relevant in Japan than it is in the USA”.
Table 6 presents aggregated outputs of games simulated in an environment wherethe agents can select a trade partner, negotiate, deceive or deliver truthfully, andupdate their beliefs. The results show that the ease with which agents reach anagreement, the frequency of negotiation failure, and the quality level depend onculture in a believable way. Table 7 displays the parameter values used.
Much of the literature on cultural difference focuses on individualism ver-sus collectivism and the associated phenomena such as direct versus indirectcommunication styles. Common group membership determines social relations in
Table 6 Average results of simulated negotiations for cultural stereotypes, with the value for theparticular dimension set to either 0.1 or 0.9 and the values for the other dimensions set to 0.5
Culture type ConditionsNumber oftransactions
% Failednegotiations % Top quality
Large power distance All high status 44 57 97
All low status 50 60 0
Customer higher 77 45 98
Supplier higher 4 92 0
Small power distance 72 49 2
Uncertainty avoiding Similar partners 29 71 76
Different partners 27 73 87
Uncertainty tolerant 49 58 1
Individualistic 66 50 1
Collectivistic In-group partners 117 13 61
Out-group partners 39 65 0
Masculine 36 71 80
Feminine 61 45 0
Long-term oriented 55 52 0
Short-term oriented Equal status 24 72 95
Diverse status 57 47 91
Data source: Hofstede et al. (2010a)8 suppliers; 8 customers; 10 runs of 200 time steps for each configuration; parameter values as inTable 7

A Model of Culture in Trading Agents 87
Table 7 Parameter valuesused in the simulation runs
Type of value wq0 wr
0 � � ! �
Default value 0.1 0.1 0.7 0.2 0.02 0.3Maximal value 0.5 0.5 1 0.5 0.1 1.0Minimal value 0 0 0 0 0 0.1
wq0 quality preference, wr
0 risk aversion, � concessionfactor, � negotiation speed, ! acceptable utility gap, �
impatience
Fig. 1 Simulation results with different settings of group distance between suppliers and cus-tomers (Data source: Hofstede et al., 2010a)
Fig. 2 Simulation results with different settings of group distance between Japanese suppliers andUSA customers vice versa (Data source: Hofstede et al., 2010a)
collectivistic societies. Group membership is known to be very relevant in Japan(e.g., Hall, 1976). The cultures of Japan and the USA differ considerably onindividualism versus collectivism, but also on other indices (Hofstede, 2001):
– Japan: PDI* D 0.54, IDV* D 0.46, MAS* D 0.95, UAI* D 0.92, LTO* D 0.80;– USA: PDI* D 0.40, IDV* D 0.91, MAS* D 0.62, UAI* D 0.46, LTO* D 0.29.
It is interesting to see if the influence of group membership emerges in simula-tions, in spite of the differences on other dimensions. Figure 1 presents simulationresults for Japan and USA, with parameter settings as in Table 7. For the “Japanese”agents, group membership considerably influences the success of negotiations andthe trust required for trading high quality products.
Trade may run less smoothly between different cultures. Figure 2 presentssimulated results of trade between Japanese and USA agents. The results show thatfor USA traders in Japan it pays to invest in personal relations in order to reduce

88 G.J. Hofstede et al.
group distance. Overcoming distrust is hard for USA traders acting as suppliers toJapanese agents. This phenomenon is not associated with the difference on the IDVindex, but with UAI and LTO.
The example of Japanese versus USA traders indicates that the salience ofparameters may be different across cultures, in combination with trade roles.Burgers et al. (2010) present results of Monte Carlo based sensitivity analysesfor the model proposed in the present chapter. Different outputs (e.g., number oftransactions, number of certificates) are sensitive to different parameters. Table 8displays contributions to variance of the number of transactions in a game. The tablepresents a mean value and shows that considerable differences between countriesprevail. It should be noted that the values presented in Table 8 have no actualmeaning for simulations results, but they indicate that it depends on culture whichparameters should be given most attention to calibrate the model.
The remaining part of this section presents an example of a tour through theresearch cycle where a model based on theory is implemented in the multi-agentsimulation, multi-agent simulation data is validated against gaming simulationobservations, validation fails, theory and the model are adapted, the multi-agentsimulation is adapted, and new simulation outputs are validated against the observa-tions and are found to support the adapted theory. The example supports the validityof the multi-agent simulation as a research instrument in combination with gamingsimulation. The example has been reported by Hofstede et al. (2010b).
The following hypotheses, to be tested against simulation results, can beformulated from observations in the TRUST & TRACING game (Meijer, 2009).
1. Average quality of products traded in games played in the USA is higher than inthe Netherlands.
2. Certification ratio (i.e., the fraction of high quality transactions where a certificatewas negotiated) is higher in the USA than in the Netherlands.
3. Defection ratio (i.e., the frequency of deceit in uncertified high quality deliveries)is higher in the USA than in the Netherlands.
4. Tracing ratio (i.e., the fraction of uncertified high quality deliveries for which atrace is requested after delivery) is higher in the USA than in the Netherlands.
To test these hypotheses, 310 simulations were run, with cultural indices for theUSA and the Netherlands taken from Hofstede (2001):
– Netherlands: PDI* D 0.38, IDV* D 0.80, MAS* D 0.14, UAI* D 0.53,LTO* D 0.44;
– USA: PDI* D 0.40, IDV* D 0.91, MAS* D 0.62, UAI* D 0.46, LTO* D 0.29.
The other agent parameters are randomly generated for each run pair.Analysis of the results confirmed hypotheses 1, 3, and 4, but did not confirm
hypothesis 2. The certification ratio as defined in hypothesis 2 was approximatelyequal for the USA and The Netherlands. In these simulations the negotiationmodel reported in Hofstede et al. (2010a) is applied. According to that model,customers do not take a differentiation of certification cost between themselvesand suppliers into account. This difference was found to be an important factor

A Model of Culture in Trading Agents 89
Tab
le8
Mea
nto
pm
argi
nalv
aria
nce
valu
es(o
f62
coun
trie
s)an
dda
tafo
rth
eco
untr
ies
that
have
the
max
imum
TM
Vsc
ore
for
apa
ram
eter
Nat
iona
lcul
ture
Gro
updi
stan
ceM
ean
stat
usIn
itia
ltru
stPa
rtne
rpr
ef.
Con
ces.
fact
orN
egot
.spe
edQ
uali
typr
ef.
Ris
kav
oid
Mea
n(n
D62
)4:1
1:0
3:4
1:8
24:8
30:2
0:5
1:6
Indo
nesi
a16:9
0:1
0:2
0:0
11:6
40:9
0:0
0:0
Mor
occo
0:7
8:7
3:3
4:7
17:5
37:9
0:0
0:0
Hun
gary
0:0
0:0
11:5
1:9
37:6
1:4
2:4
11:5
Uru
guay
4:9
1:7
8:5
5:5
23:4
24:1
0:0
0:0
Net
herl
ands
0:7
0:0
1:6
0:3
46:2
28:8
0:0
2:1
Iran
1:3
3:1
0:9
0:4
10:3
56:2
0:6
0:0
Aus
tria
0:0
0:0
3:8
2:6
27:1
11:5
4:8
6:9
Japa
n0:5
0:0
8:3
1:6
30:8
0:9
0:1
15:8
Sour
ce:B
urge
rset
al.(
2010
)

90 G.J. Hofstede et al.
Table 9 Test data for 310 run pairs for USA and NL
Average of 310 runs USA NL Test stat.a Samplea Probabilitya
Number of transactions 72 61 219 302 < 0.001Quality ratio 0.37 0.15 277 285 < 0.001Certification ratio 0.48 0.41 191 281 < 0.001Defection ratio 0.25 0.13 128 154 < 0.001Tracing ratio 0.40 0.07 169 177 < 0.001
Source: Hofstede et al. (2010b)aTest statistic, effective sample size, and two-sided probability level for Sign test
in the gaming simulations in the USA. The negotiation model was modified to taketracing fee differences and probability to trace into account. The original equationfor customers’ risk in an uncertified deal is:
rcustomer D .1 � c/.1 � tb/q: (15)
The modified equation is
rcustomer D .1 � c/.1 � tb/q C T 0�customer ; (16)
with �customer representing customers’ tracing fee.The simulation was repeated after replacing Eq. 15 with Eq. 16 and setting the
tracing fee equal to 0.2 for suppliers and 0.3 for customers. Table 9 summarizesthe results. The simulation results confirm hypotheses 1 through 4. Differences arefound to be significant for all variables, with p < 0.001 according to the Sign test.This example illustrates how the combination of multi-agent simulation and gamingsimulation can improve models of culturally differentiated agent behavior.
7 Conclusion
De Rosis, Pelachaud, & Poggi (2004) suggested to apply Hofstede’s theory to buildculturally consistent agent characters. The research presented in this chapter showshow this can be done. It shows that rules for cultural differentiation of universalmodels of aspects of human behavior can be formulated, following an expertsystems knowledge acquisition approach. Working on a dimension-by-dimensionbasis reduces the complexity to a level where a domain expert can specify therules and verify the results. Doing this for more dimensions simultaneously is toocomplex for an expert. Furthermore, this chapter proposes an approach to integratethe rules for individual dimensions into a joint effect, resulting in believable culturaldifferentiation of agent behavior. This approach has been applied to three domainsin trade: partner selection, negotiation, and the interaction between trust and deceit.The resulting agent models have been applied in a multi-agent simulation.

A Model of Culture in Trading Agents 91
A meta-modeling approach for sensitivity analysis of the simulation modelhas been developed (Burgers et al., 2010). Sensitivity analysis indicates that theoutcomes and sensitivity for parameters in the universal models strongly dependon the cultural settings. It is found to be necessary to perform sensitivity analysis tostatistics at the aggregated level as well to statistics of individual agent performance.However, the method for sensitivity analysis at the individual level needs furtherdevelopment (Burgers et al.).
Face validity of the results for the extreme cultural situations – called “SyntheticCultures” by Hofstede and Pedersen (1999) – indicates that the approach proposedin the present chapter is feasible for the development of agents which can be usedfor training purposes and educational simulations. Application of this model in, forinstance, affective agents as it has been suggested by De Rosis et al. (2004) wouldrequire further validation.
A model as described in this chapter is what Gilbert (2008) has called a middlerange model. Gilbert asserts that the generic nature of such a model means thatit is not possible to compare its behavior with any observable instance in the realworld. Having found some instance where the model reproduces stylized facts thatresemble real world or gaming observations, cannot serve as a general validation anddoes not guarantee the correctness of predictions made for other cultural situations.Validation of this type of model is an ongoing process. Confidence that the modelcan predict the effects of culture in new situations grows according to the number ofcases where its outputs correspond with those of gaming simulations or other data.
The pragmatic validation of the model – for its use in combination with gamingsimulation as a research tool for the social sciences – is also an ongoing process.The example given in the preceding section of this chapter supports the usabilityof the model for hypothesis testing and positively answers the research question“Can such a model be applied to fulfill its function as a social sciences researchinstrument in combination with simulation gaming?”. In cases where the modeldoes not correspond with data from games or other sources, these results can beused to improve the model and support the advancement of science.
Culture research is an ongoing process as well. The first version of Hofstede‘smodel was defined in four dimensions. The dimension of long-term versus short-term orientation was discovered in a separate research program carried out inChina, with questions devised by people with Asian mindsets. Hofstede’s modelhas recently been extended with the dimension of “Indulgence versus Restraint”found by Minkov (2007) using World Value Survey data, and included in Hofstedeet al. (2010). To include this new dimension into the agent model would require theacquisition and formalization of expert knowledge, as it has been performed for theother dimensions, eventually resulting in the representation of extra cultural factorsand their effects in Table 10 (appendix).
Extensions of the width of modeled behavior are also to be considered, andmight increase the simulation’s validity. For instance, an important component notincluded in the present work but possibly very influential in real trade networks iscontagion of behavior through imitation and social learning by means of a reputationmechanism.

92 G.J. Hofstede et al.
App
endi
x
Tab
le10
Incr
easi
ng(C
)an
dde
crea
sing
(�)
effe
cts
ofre
leva
ntcu
ltur
alfa
ctor
spe
rde
cisi
onfu
ncti
onva
riab
le
Part
ner
sele
ctio
nN
egot
iati
onD
ecei
tand
trus
t
Dim
ensi
onin
dex
Cul
ture
and
rela
tion
alch
arac
teri
stic
sC
ultu
ralf
acto
raˇ
�J b
Ab
wq
wr
��
!�
d bT
u �u C
PDI
Lar
gepo
wer
dist
ance
PD
I*
Self
stat
ushi
ghP
DI*
s aC
Self
stat
uslo
wP
DI*
(1�s
a)
–W
ith
high
erra
nked
part
ner
max
f0,P
DI*
(sb–s
a)g
–C
CC
C–
C–
Wit
hlo
wer
rank
edpa
rtne
rm
axf0,
PD
I*(s
a–s
b)g
––
–U
AI
Unc
erta
inty
avoi
ding
UA
I*–
CC
CC
–W
ith
stra
nger
UA
I*�D b
–C
–C
Unc
erta
inty
tole
rant
1–U
AI*
–ID
VIn
divi
dual
isti
cID
V*
Wit
htr
uste
dpa
rtne
rID
V*t b
CC
olle
ctiv
isti
c(1
–ID
V*)
CW
ith
in-g
roup
part
ner
(1–I
DV
*)(
1–D
b)
CC
––
Wit
hou
t-gr
oup
part
ner
(1–I
DV
*)D
bC
––
MA
SM
ascu
line
(com
peti
tive)
MA
S*–
CC
CC
–C
–Fe
min
ine
(coo
pera
tive)
1–M
AS*
C–
––
–W
ith
trus
ted
part
ner
(1–M
AS*
)tb
CLT
OL
ong-
term
orie
nted
LTO
*C
––
C–
CW
ith
trus
ted
part
ner
LTO
*t b
CSh
ort-
term
orie
nted
(1–L
TO*)
CW
ith
wel
l-re
spec
ted
part
ners
(1–L
TO*)s
bC
–C
–C
–W
ith
othe
rpa
rtne
rs(1
–LT
O*)(
1–s b
)–
Hof
sted
eet
al.(
2009
b,20
10a,
2010
b)a PD
I*,U
AI*
,ID
V*,M
AS*
,and
LTO
*re
pres
ent
Hof
sted
e’s
indi
cess
ath
eag
ent’
sst
atus
,sb
part
ner’
sst
atus
,Db
grou
pdi
stan
ce,t
btr
ust;
alli
n[0
,1]

A Model of Culture in Trading Agents 93
References
Bala, V., & Long, N. V. (2005). International trade and cultural diversity with preference selection.European Journal of Political Economy, 21, 143–162.
Blanchard, E. G. M., & Frasson, C. (2005). Making intelligent tutoring systems culturally aware.In The International Conference on Artificial Intelligence, ICAI’05, Vol. 2. pp. 644–649.Las Vegas, Nevada: CSREA Press.
Boles, T. L., Croson, R. T. A., & Murnighan, J. K. (2000). Deception and retribution in repeatedultimatum bargaining. Organizational Behavior and Human Decision Processes, 83, 235–259.
Burgers, S. L. G. E., Hofstede, G. J., Jonker, C. M., & Verwaart, T. (2010). Sensitivity analysis of anagent-based model of culture’s consequences for trade. In M. LiCalzi et al. (Eds.), Progress inartificial economics. Lecture Notes in Economics and Mathematical Systems, Vol. 645, pp. 253–264. Heidelberg, Berlin: Springer-Verlag.
Castelfranchi, C., & Falcone, R. (1998). Principles of trust for MAS: Cognitive anatomy, socialimportance and quantification. In Proceedings of ICMAS’98, pp. 72–79. AAAI Press, Paris.
Castelfranchi, C., Falcone, R., & De Rosis, F. (2001). Deceiving in GOLEM. In C. Castelfranchi &Y. H. Tan (Eds.), Trust and deception in virtual societies. Dordrecht, The Netherlands: Kluwer.
de Rosis, F., Pelachaud, C., & Poggi, I. (2004). Transcultural believability in embodied agents. InS. Payr & R. Trappl (Eds.), Agent culture. Mahwah, NJ: Lawrence Erlbaum Associates.
Geertz, C. (1973). The interpretation of cultures. New York: Basic Books.Gilbert, N. (2008). Agent-based models. Los Angeles: Sage.Guo, R. (2004). How culture influences foreign trade: Evidence from the U.S. and China. Journal
of Socio-Economics, 33, 785–812.Hall, E. T. (1976). Beyond culture. Garden City, NY: Anchor.Hofstede, G. (2001). Culture’s consequences (2nd ed.). Thousand Oaks, CA: Sage.Hofstede, G. J. (2006). Intrinsic and enforceable trust: A research agenda. In Proceedings of the
99th European Seminar of the EAAE. Bonn, Germany: Universitat Bonn-ILB Press.Hofstede, G., & Hofstede, G. J. (2005). Cultures and organizations: Software of the mind (2nd ed.).
New York: McGraw-Hill.Hofstede, G., Hofstede, G. J., & Minkov, M. (2010). Cultures and organizations: Software of the
mind (3rd ed.). New York: McGraw-Hill.Hofstede, G. J., Jonker, C. M., & Verwaart, T. (2008a). Modeling culture in trade: Uncertainty
avoidance. In 2008 Agent-Directed Simulation Symposium (ADSS’08). San Diego, CA: SCS.Hofstede, G. J., Jonker, C. M., & Verwaart, T. (2008b). Individualism and collectivism in trade
agents. In N. T. Nguyen et al. (Eds.), IEA/AIE 2008 (LNAI 5027), pp. 492–501. Heidelberg,Germany: Springer.
Hofstede, G. J., Jonker, C. M., & Verwaart, T. (2008c). Long-term orientation in trade. InK. Schredelseker & F. Hauser (Eds.), Complexity and artificial markets, Lecture Notes inEconomics and Mathematical Systems 614, pp. 107–118. Heidelberg, Germany: Springer.
Hofstede, G. J., Jonker, C. M., & Verwaart, T. (2009a). Modeling power distance in trade. In N.David & J. S. Sichman (Eds.), MABS 2008 (LNAI 5269), pp. 1–16. Heidelberg, Germany:Springer.
Hofstede, G. J., Jonker, C. M., & Verwaart, T. (2009b). Simulation of effects of culture ontrade partner selection. In C. Hernandez et al. (Eds.), Artificial economics. Lecture Notes inEconomics and Mathematical Systems 631, pp. 257–268. Heidelberg, Germany: Springer.
Hofstede, G. J., Jonker, C. M., & Verwaart, T. (2010a). Cultural differentiation of negotiatingagents. Group Decision and Negotiation. doi:10.1007/s10726-010-9190-x.
Hofstede, G. J., Jonker, C. M., & Verwaart, T. (2010b). A cross-cultural multi-agent model ofopportunism in trade. In N. T. Nguyen & R. Kowalczyk (Eds.), Transactions on computationalcollective intelligence II (LNCS 6450), pp. 24–45. Heidelberg, Germany: Springer.
Hofstede, G. J., Jonker, C. M., & Verwaart, T. (2011). Computational modeling of culture’sconsequences. In T. Bosse et al. (Eds.), MABS 2010 (LNAI 6532), pp. 136–151. Heidelberg,Germany: Springer.

94 G.J. Hofstede et al.
Hofstede, G., & McCrae, R. R. (2004). Personality and culture revisited: Linking traits anddimensions of culture. Cross-Cultural Research, 38, 52–88.
Hofstede, G. J., & Pedersen, P. B. (1999). Synthetic cultures: Intercultural learning throughsimulation gaming. Simulation & Gaming, 30, 415–440.
Hofstede, G. J., Pedersen, P. B., & Hofstede, G. (2002). Exploring culture. Yarmouth, ME:Intercultural Press.
Hofstede, G. J., Spaans, L., Schepers, H., Trienekens, J., & Beulens, A. (2004). Hide or confide:The dilemma of transparency. ‘s-Gravenhage, The Netherlands: Reed Business Information.
House, R. J., Hanges, P. J., Javidan, M., Dorfman, P. W., & Gupta, V. (2004). Leadership cultureand organizations: The GLOBE study of 62 societies. Thousand Oaks, CA: Sage.
Hwang, P., & Burgers, W. P. (1999). Apprehension and temptation: The forces against cooperation.Journal of Conflict Resolution, 43, 117–130.
Jager, W., & Mosler, H. J. (2007). Simulating human behavior for understanding and managingenvironmental dilemmas. Journal of Social Issues, 63(1), 97–116.
Jennings, N. R., Sierra, C., Sonenberg, L., & Tambe, M. (Eds.) (2004). Proceedings of the thirdinternational joint conference on autonomous agents and multi-agent systems, AAMAS’04(pp. 672–679). New York: IEEE Computer Society Press.
Jonker, C. M., & Treur, J. (1999). Formal analysis of models for the dynamics of trust based onexperiences. In F. J. Garijo & M. Boman (Eds.), MAAMAW’99 (LNCS 1647), pp. 221–232.Heidelberg, Germany: Springer.
Jonker, C. M., & Treur, J. (2001). An agent architecture for multi-attribute negotiation. In B. Nebel(Ed.), Proceedings of the 17th international joint conference on AI, IJCAI’01, pp. 1195–1201.Seattle, Washington, Morgan Kaufman.
Kashima, Y. (2009). Culture comparison and culture priming: A critical analysis. In R. S. Wyer,C.-Y. Chiu, & Y.-Y. Hong (Eds.), Understanding culture. New York: Psychology Press.
Kersten, G. E. (2002). Do E-business systems have culture and should they have one? InProceedings of the 10th European Conference on Information Systems, ECIS 2002, pp. 1237–1248. Gdansk, Poland.
Kersten, G. E., Koszegi, S. T., & Vetschera, R. (2002). The effects of culture in anonymousnegotiations: Experiment in four countries. In Proceedings of the 35th HICSS, pp. 27. BigIsland, HI.
Kirkman, B. R., Lowe, K. B., & Gibson, C. B. (2006). A quarter century of culture’s consequences:A review of empirical research incorporating Hofstede’s cultural values framework. Journal ofInternational Business Studies, 37, 285–320.
Klein Woolthuis, R., Hillebrand, B., & Nooteboom, B. (2005). Trust, contract and relationshipdevelopment. Organization Studies, 26, 813–840.
Konya, I. (2006). Modeling cultural barriers in international trade. Review of InternationalEconomics, 14(3), 494–507.
Levi-Strauss, C. (1992). Tristes Tropiques. New York: Penguin Books. (Originally in French, 1955)Meijer, S. (2009). The organisation of transactions: Studying supply networked using gaming
simulation. Dissertation, Wageningen University, Wageningen.Meijer, S., & Verwaart, T. (2005). Feasibility of multi-agent simulation for the trust-and-tracing
game. In M. Ali & F. Esposito (Eds.), IEA/AIE 2005 (LNAI 3533), pp. 145–154. Heidelberg,Germany: Springer.
Minkov, M. (2007). What makes us different and similar: A new interpretation of the world valuessurvey and other cross-cultural data. Sofia, Bulgaria: Klasika I Stil.
Modelling trade and trust across cultures. In Stølen, K., Winsborough, W. H., Martinelli, F.,Massacci, F. (Eds.) (2006, May 16–19). Proceedings of the 4th International Conference onTrust Management, iTrust 2006. Pisa, Italy. Proceedings, Series: Lecture Notes in ComputerScience (Vol. 3986, pp. 120–134).
Olekalns, M., & Smith, P. L. (2009). Mutually dependent: Trust, affect and the use of deception innegotiation. Journal of Business Ethics, 85, 347–365.
Payr, S., & Trappl, R. (2004). Agent culture; human-agent interaction in a multicultural world.Mahwah, NJ: Lawrence Erlbaum Associates.

A Model of Culture in Trading Agents 95
Raser, J. C. (1969). Simulations and society: An exploration of scientific gaming. Boston, MA:Allyn & Bacon.
Rehm, M., Andre, E., Bee, N., Endrass, B., Wissner, M., Nakano, Y. I., et al. (2007). The CUBE-Gapproach – Coaching culture-specific nonverbal behavior by virtual agents. In Proceedings ofthe 38th conference of the international simulation and gaming association, Nijmegen, TheNetherlands.
Rehm, M., Nishida, T., Andre, E., & Nakano, Y. I. (2008). Culture-specific first meeting encountersbetween virtual agents. In IVA 2008 (LNCS 5208). Heidelberg, Germany: Springer.
Schimmack, U., Oishi, S., & Diener, E. (2005). Individualism: A valid and important dimension ofcultural differences between nations. Personality and Social Psychology Review, 9, 17–31.
Schwarz, S. H. (2009). Culture matters: National value cultures, sources, and consequences. In R.S. Wyer et al. (Eds.), Understanding culture. New York: Psychology Press.
Silverman, B. G., Bharathy, G., Johns, M., Eidelson, R. J., Smith, T. E., & Nye, B. (2007).Sociocultural games for training and analysis. IEEE Transactions on Systems, Man, andCybernetics, Part A, 37, 1113–1130.
Silverman, B. G., Johns, M., Cornwell, J., & O’Brien, K. (2006). Human behavior models foragents in simulators and games: Part I: Enabling science with PMFserv. Presence, 15, 139–162.
Smith, P. B. (2002). Culture’s consequences: Something old and something new. Human Relations,55, 119–135.
Smith, P. B. (2006). When elephants fight, the grass gets trampled: The GLOBE and Hofstedeprojects. Journal of International Business Studies, 37, 915–921.
Smith, P. B., Dugan, F., & Trompenaars, F. (1996). National culture and the values of organizationalemployees: A dimensional analysis across 43 nations. Journal of Cross-Cultural Psychology,27, 231–246.
Sondergaard, M. (1994). Hofstede’s consequences: A study of reviews, citations and replications.Organization Studies, 15, 447–456.
Steinel, W., & De Dreu, K. W. (2004). Social motives and strategic misrepresentation in socialdecision making. Journal of Personality and Social Psychology, 86, 419–434.
Tonnies, F. (1963). Community and society. New York: Harper & Row. (Original pub. 1887)Triandis, H. C. (1995). Individualism and collectivism. Boulder, MA: Westview.Triandis, H.C., Carnevale, P., Gelfand, M., Robert, C., Arzu Wasti, S., Probst, T. (2001). Culture
and deception in business negotiations: A multilevel analysis. International Journal of CrossCultural Management, 1, 73–90.
Trompenaars, F. (1993). Riding the waves of culture. London: Nicholas Brealy.Tykhonov, D., Jonker, C., Meijer, S., & Verwaart, T. (2008). Agent-based simulation of the trust
and tracing game for supply chains and networks. Journal of Artificial Societies and SocialSimulation, 11(3), 1.
Ward, D., & Hexmoor, H. (2003). Towards deception in agents. In Proceedings of AAMAS 2003,pp. 1154–1155. Melbourne, Australia.
Weisbuch, G., Kirman, A., & Herreiner, D. (2000). Market organisation and trading relationships.Economic Journal, 110, 411–436.
Williamson, O. E. (1985). The economic institutions of capitalism. New York: Free Press.Williamson, O. E. (1998). Transaction cost economics: How it works; where it is headed. De
Economist, 146, 23–58.Wilson, D. S. (2007). Evolution for everyone. New York: Delacorte Press.Wirtz, J., & Kum, D. (2004). Consumer cheating on service guarantees. Journal of the Academy of
Marketing Science, 32(2), 159–175.
View publication statsView publication stats