a method to track rotational motion for use in single ... · a method to track rotational motion...
TRANSCRIPT

REVIEW OF SCIENTIFIC INSTRUMENTS 82, 103707 (2011)
A method to track rotational motion for use in single-molecule biophysicsJan Lipfert,a) Jacob J. W. Kerssemakers,a) Maylon Rojer, and Nynke H. Dekkerb)
Department of Bionanoscience, Kavli Institute of Nanoscience, Delft University of Technology,Lorentzweg 1, 2628 CJ Delft, The Netherlands
(Received 21 July 2011; accepted 21 September 2011; published online 25 October 2011)
The double helical nature of DNA links many cellular processes such as DNA replication, transcrip-tion, and repair to rotational motion and the accumulation of torsional strain. Magnetic tweezers(MTs) are a single-molecule technique that enables the application of precisely calibrated stretchingforces to nucleic acid tethers and to control their rotational motion. However, conventional magnetictweezers do not directly monitor rotation or measure torque. Here, we describe a method to directlymeasure rotational motion of particles in MT. The method relies on attaching small, non-magneticbeads to the magnetic beads to act as fiducial markers for rotational tracking. CCD images of the beadsare analyzed with a tracking algorithm specifically designed to minimize crosstalk between transla-tional and rotational motion: first, the in-plane center position of the magnetic bead is determined witha kernel-based tracker, while subsequently the height and rotation angle of the bead are determinedvia correlation-based algorithms. Evaluation of the tracking algorithm using both simulated imagesand recorded images of surface-immobilized beads demonstrates a rotational resolution of 0.1◦, whilemaintaining a translational resolution of 1–2 nm. Example traces of the rotational fluctuations exhib-ited by DNA-tethered beads confined in magnetic potentials of varying stiffness demonstrate therobustness of the method and the potential for simultaneous tracking of multiple beads. Our rota-tion tracking algorithm enables the extension of MTs to magnetic torque tweezers (MTT) to directlymeasure the torque in single molecules. In addition, we envision uses of the algorithm in a range ofbiophysical measurements, including further extensions of MT, tethered particle motion, and opticaltrapping measurements. © 2011 American Institute of Physics. [doi:10.1063/1.3650461]
I. INTRODUCTION
Magnetic tweezers (MTs) are a powerful single-moleculetechnique to study the physical properties, dynamics, and in-teractions of biological macromolecules.1–4 MT assays haveprovided unique insights into the function and dynamics ofbiological macromolecules. Examples include studies of theproperties of bare DNA,5, 6 RNA,7 and of enzymes that acton DNA or RNA, such as topoisomerases,8 helicases,4, 9 andpolymerases.10
In a typical configuration (Fig. 1(a)), a DNA or RNAmolecule is attached at one end to the surface of a flow celland at the other end to a superparamagnetic bead that is ma-nipulated by external magnetic fields.2, 11, 12 Conventional MTimplementations typically track the x, y, and z positions oftethered superparamagnetic particles from analysis of CCDimages. The applied stretching force can be calibrated by an-alyzing the fluctuations in the x and y positions.5, 12, 13 In addi-tion, magnetic tweezers allow rotation of the tethered particlesby rotating the magnetic fields. A sufficient amount of twistwill trigger torsional buckling and the subsequent formationof plectonemic supercoils.5, 11
Recently, several approaches have been developed totrack the rotation angle in MT measurements in addition to thebead’s position. Rotational tracking is useful for the study ofrotary motion in biological processes, e.g., molecular motion
a)J. Lipfert and J. J. W. Kerssemakers contributed equally to this work.b)Author to whom correspondence should be addressed. Electronic mail:
that results in DNA over- or underwinding. In addition, anal-ysis of the angular fluctuations allows for the measurement oftorque.14–16 Several rotational tracking methods rely on fluo-rescence excitation and detection;17, 18 some require the use ofinternal modification of the DNA tether18 or specially nano-fabricated particles.14
Here we describe in detail a method to track the x, y, andz positions and the rotation angle that is designed for its sim-plicity, staying close to the approach that has become standardin MT experiments. Our strategy is based on attaching small,non-magnetic beads that act as fiducial markers to larger mag-netic beads. For the (x, y)-position tracking of these mag-netic beads, we minimize the influence of the fiducial markerby using a kernel-based tracker that achieves spatial filteringon circularly symmetric patterns. Next, the angular coordi-nate is determined by transforming the marked-bead imagesfrom Cartesian (x, y) to polar coordinates (r, θ ) and using acorrelation-based tracking routine to determine the rotationangle. The z-position, i.e., the beads’ height, is tracked em-ploying a cross-correlation tracker based on look-up tablesrecorded at different focal planes.19 We note that the algo-rithm that we introduce for angular tracking is fully compat-ible with simultaneous x, y, and z tracking: analysis of out-of-focus images of the marked beads using the kernel-basedtracker permits x, y, and z tracking with an accuracy compara-ble to conventional MT measurements employing unmarkedbeads.
We have recently demonstrated the use of such a track-ing algorithm to enable straightforward torque measurementson DNA and nucleo-protein filaments15 in magnetic torque
0034-6748/2011/82(10)/103707/11/$30.00 © 2011 American Institute of Physics82, 103707-1

103707-2 Lipfert et al. Rev. Sci. Instrum. 82, 103707 (2011)
(a)
(b)
(c)
Imagestack
(x,y)- tracking
(x,y)-tracking
Angular tracking
z-tracking
[x,y,z, ]θ
θ
x
z
y
[x,y]
[x,y]
FIG. 1. (Color online) Schematic of magnetic tweezers rotation measure-ments and overview of the tracking algorithm. (a) Experimental setup forimaging transverse, vertical, and rotational motion of a tethered magneticbead with a smaller fiducial marker bead attached. (b) Flowchart of position(x, y, z) and rotation (θ ) tracking of bead motion via microscope images.(c) Use of circular kernel patterns for transverse (x, y)-position tracking andspatial filtering. Cross-correlation of bead images with the kernel patternscreates correlation maps with separated maxima for the main bead and thefiducial bead. Using out of focus images (lower panels) causes the main beadmaximum to dominate the correlation pattern, thus effectively eliminatingdisturbances in the determination of the main bead’s symmetry center by thefiducial bead.
tweezers (MTT). Given the presence of an appropriately cho-sen magnetic field configuration, such MTT maintain the ad-vantages of conventional MT, namely, a large force range, ab-sence of radiation damage, the ability to precisely calibratestretching forces, and facile implementation, while in additionpermitting measurements of the torque stored in biologicalmolecules. In addition to its use in magnetic tweezers mea-surements, we expect that this tracking algorithm can find ap-plication in tethered particle motion measurements20 and inoptical tweezers measurements, especially as the latter relyincreasingly on camera-based tracking.21
II. METHODS AND MATERIALS
A. Magnetic tweezers experimental configuration
Our MT setup employed a custom-built inverted mi-croscope with a 100× oil immersion objective (Olym-
pus ACH, 1.25 N.A.), a piezo-driven microscope objec-tive nanofocusing/scanning device (Physik Instrumente, PI-FOC P-721.CDQ), a CCD camera (Pulnix TM_6710-CL)to capture images, parallel-light LED illumination, a mo-torized stage to control the height of the magnets abovethe flow cell (Physik Instrumente M-126.PD), and a mo-tor to control the magnets’ rotation (Physik Instrumente, C-150). Flow cells were constructed from glass microscopecover slips with double-layer parafilm spacers and a nitro-cellulose (0.1% wt./vol. in amyl acetate) coated bottom sur-face. A syringe pump (Cole-Parmer) was used for buffer ex-change in the flow cell. The setup is controlled by a DellPrecision T5400 workstation (Dell) and software customwritten in Labview 8.6. Further details of this setup werereported previously.3, 12, 15, 22 Experiments used either a con-ventional magnet configuration (referred to as “conventionalMT”) with a pair of 5 mm × 5 mm × 5 mm magnets(Supermagnete, W-05-N50-G) in horizontal configurationwith an iron yoke12 or a cylindrical permanent magnet witha central aperture (Supermagnete, R-06-02-02-G) and an at-tached side magnet (Supermagnete, S-04-07-N) in the ge-ometry described previously15(referred to as “MTT”). CCDimages are either analyzed in real time or recorded at fre-quencies up to 100 Hz. The tracking software is imple-mented in Labview 8.6 and is available from the authors uponrequest.
B. Beads, DNA constructs, and buffer conditions
Experiments were carried out in phosphate bufferedsaline (PBS; 137 mM NaCl, 2.7 mM KCl, 10 mM phosphatebuffer, pH 7.4; Sigma) supplemented with 100 μg/ml BSA,0.1% Tween, and 5 mM sodium azide (PBS+). Prior tothe measurements, 1.5 μm radius non-magnetic latex beads(Life Sciences) were aspecifically attached to the bottomsurface of the flow cell by incubation in phosphate bufferedsaline (PBS; Sigma) buffer for 30 min to act as referencebeads. In addition, the bottom surface was functionalizedby incubation with 100 μg/ml anti-digoxigenin (Roche)in PBS for 30 min, to provide for DNA attachment, andpassivated by incubation for 30 min with 2 mg/ml bovineserum albumin (BSA; Sigma). Experiments with tetheredbeads employed 7.9 kbp DNA constructs15 ligated at the endsto ≈600 bp DNA PCR fragments that were functionalizedwith multiple biotin and digoxigenin groups, respectively.The DNA molecules were first attached to streptavidin-coated1.4 μm radius superparamagnetic M270 beads (Invitrogen)by incubation in PBS buffer for 30–60 min. Subsequently,the DNA tethered superparamagnetic beads were incubatedin the flow cell for 30 min in PBS buffer to allow forDNA attachment to the anti-digoxigenin coated surface.Unattached beads were removed by flushing with PBS+buffer. Finally, biotin-labeled 0.5 μm radius Fluospheremicrospheres (Invitrogen) were stochastically attachedto the M270 superparamagnetic beads to act as fiducialmarkers by incubation in the flow cell for 30–60 min inPBS+ buffer.
103707-3 Lipfert et al. Rev. Sci. Instrum. 82, 103707 (2011)
III. TRACKING ALGORITHMS
A. Overview of the tracking protocol
Our tracking protocol is designed to follow the x, y, and zpositions and rotation angle θ about the z-axis of tethered su-perparamagnetic beads from CCD images. In typical exper-iments, the tether consists of double-stranded DNA bearingmultiple attachment points at both ends (Fig. 1(a)). We attachsmall, non-magnetic, marker beads to the larger superpara-magnetic beads to provide well-visible fiducial markers thatfacilitate rotational tracking (Fig. 1(a); Sec. II).
The use of small fiducial marker beads is convenientand is motivated by the following considerations. While inprinciple intrinsic irregularities in the magnetic beads them-selves can be employed for rotational tracking,23 in prac-tice the superparamagnetic beads typically employed in MTmeasurements show only very minor deviations from spher-ical symmetry, making this approach less robust. This isparticularly so in the case of the out-of-focus images ad-vantageously employed for z-tracking.19, 24 Another relatedapproach to rotational tracking is the use of dumbbells ofequally sized beads.16, 20, 25 Using dumbbells is less robustthan using smaller fiducial marker beads if simultaneous z-tracking over a significant focal range is required. In addition,if both beads of the dumbbell are magnetic, the analysis ofthe stretching force and the tether geometry is complicatedcompared to single-magnetic bead tethers.
A flow-chart diagramming the main steps in our trackingprocedure is shown in Fig. 1(b). Our general strategy is to firstdetermine the in-plane position (x, y) of the tethered mag-netic bead. To reliably find the (x, y)-position of the bead, atracking protocol is needed that is minimally disturbed by thefiducial marker. We found that a tracker based on convolutionwith kernel images that exhibit periodic radial ring patternsfilters out the perturbative effect of the fiducial marker (seeSec. III B). Using the tracked (x, y)-position, both the in-plane rotation angle (θ ) and the relative out-of-plane position(z) can be tracked using separate tracking modules (seeSec. III C, and Sec. III D).
B. Tracking of the transverse position (x, y)
Our kernel-based (x, y)-tracking is performed as fol-lows. From camera-acquired microscope images, regions-of-interest (ROIs) of size N × N pixels are selected, each con-sisting of an approximately centered defocused bead. Thisbead image is separately convoluted with three N × N pixel-sized kernel images displaying similar centered ring-shapedpatterns (Fig. 1(c)). The ring pattern of successive kernel im-ages is shifted by one third of a period. The kernel imagesK(r) are numerically generated using:
K(r) = K0 · e−r/r0 · sin
(r
λ+ 2πp
3
), (1)
where K0 is a proportionality constant, r is the distance fromthe image center, r0 is a decay length, λ is the fringe spacing(these last three quantities are all in units of pixel size), and pruns from 1 to 3. Typical values for the parameters used in thetracking algorithm are given in Table I. To efficiently com-
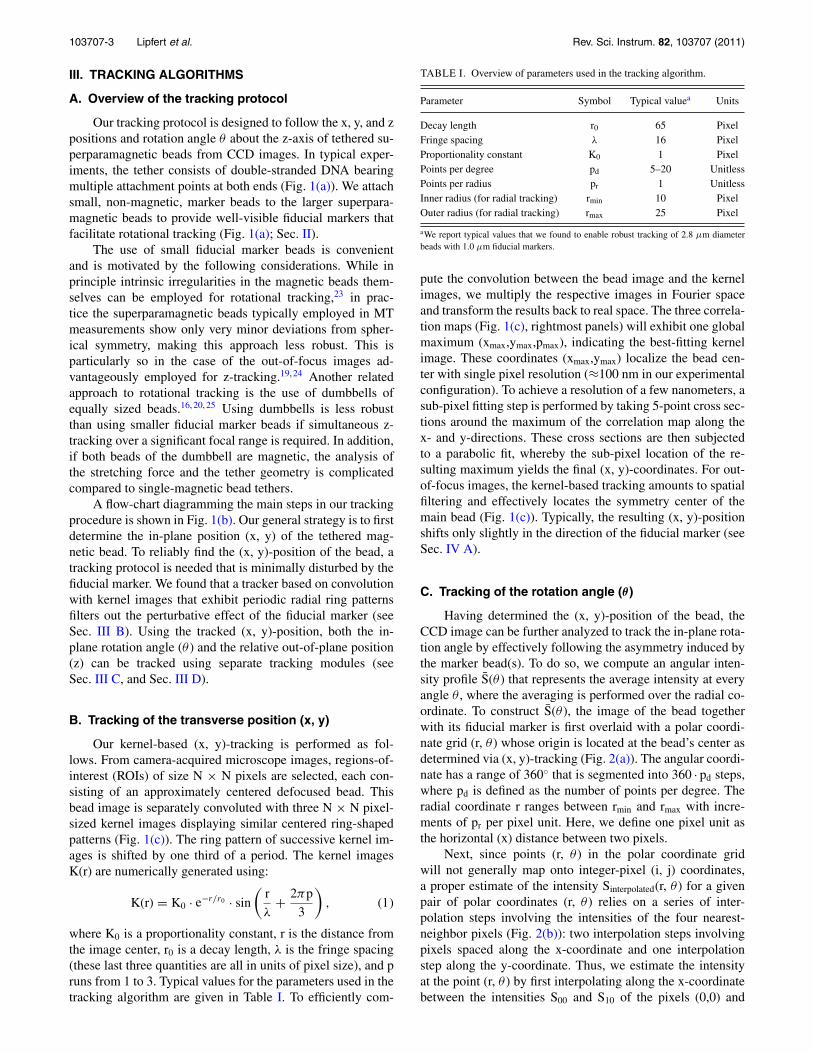
TABLE I. Overview of parameters used in the tracking algorithm.
Parameter Symbol Typical valuea Units
Decay length r0 65 PixelFringe spacing λ 16 PixelProportionality constant K0 1 PixelPoints per degree pd 5–20 UnitlessPoints per radius pr 1 UnitlessInner radius (for radial tracking) rmin 10 PixelOuter radius (for radial tracking) rmax 25 Pixel
aWe report typical values that we found to enable robust tracking of 2.8 μm diameterbeads with 1.0 μm fiducial markers.
pute the convolution between the bead image and the kernelimages, we multiply the respective images in Fourier spaceand transform the results back to real space. The three correla-tion maps (Fig. 1(c), rightmost panels) will exhibit one globalmaximum (xmax,ymax,pmax), indicating the best-fitting kernelimage. These coordinates (xmax,ymax) localize the bead cen-ter with single pixel resolution (≈100 nm in our experimentalconfiguration). To achieve a resolution of a few nanometers, asub-pixel fitting step is performed by taking 5-point cross sec-tions around the maximum of the correlation map along thex- and y-directions. These cross sections are then subjectedto a parabolic fit, whereby the sub-pixel location of the re-sulting maximum yields the final (x, y)-coordinates. For out-of-focus images, the kernel-based tracking amounts to spatialfiltering and effectively locates the symmetry center of themain bead (Fig. 1(c)). Typically, the resulting (x, y)-positionshifts only slightly in the direction of the fiducial marker (seeSec. IV A).
C. Tracking of the rotation angle (θ )
Having determined the (x, y)-position of the bead, theCCD image can be further analyzed to track the in-plane rota-tion angle by effectively following the asymmetry induced bythe marker bead(s). To do so, we compute an angular inten-sity profile S̄(θ ) that represents the average intensity at everyangle θ , where the averaging is performed over the radial co-ordinate. To construct S̄(θ ), the image of the bead togetherwith its fiducial marker is first overlaid with a polar coordi-nate grid (r, θ ) whose origin is located at the bead’s center asdetermined via (x, y)-tracking (Fig. 2(a)). The angular coordi-nate has a range of 360◦ that is segmented into 360 · pd steps,where pd is defined as the number of points per degree. Theradial coordinate r ranges between rmin and rmax with incre-ments of pr per pixel unit. Here, we define one pixel unit asthe horizontal (x) distance between two pixels.
Next, since points (r, θ ) in the polar coordinate gridwill not generally map onto integer-pixel (i, j) coordinates,a proper estimate of the intensity Sinterpolated(r, θ ) for a givenpair of polar coordinates (r, θ ) relies on a series of inter-polation steps involving the intensities of the four nearest-neighbor pixels (Fig. 2(b)): two interpolation steps involvingpixels spaced along the x-coordinate and one interpolationstep along the y-coordinate. Thus, we estimate the intensityat the point (r, θ ) by first interpolating along the x-coordinatebetween the intensities S00 and S10 of the pixels (0,0) and

103707-4 Lipfert et al. Rev. Sci. Instrum. 82, 103707 (2011)
200 201 202
0 120 240 3600
1 0 120 240 360
-8
0
8
(a)pd
(d)
r
(e)(b) θδi
δj
pr
rmin
rmax
Angle (degrees)
1.0
Co
rrel
atio
n
0.998
Sig
nal
(a.
u.)
(c) S01 Supper
Sinterpola ted
Slower
S11
S00 S10
FIG. 2. (Color online) Image analysis for rotational tracking. (a) Image of abead carrying a fiducial marker, cropped to the area that is employed for therotational tracking. A bead-centered polar grid is overlayed. (b–c) Schematiccloseup on individual pixels illustrating the interpolation step used to trans-form the pixel intensities of four neighboring pixels S00, S10, S01, S11 into aninterpolated intensity value in polar coordinates Sinterpolated. (b) Pixel intensi-ties are shown in grey scale and the pixel centers S00, . . . , S11 are indicated bydots, the position of the interpolated intensity is indicated by a cross. (c) Thepixel intensities are indicated by the height of the wireframe bars. (d) Radial-polar map of the selected image, i.e., pixel intensities of the image in (a) con-verted to polar (r, θ ) coordinates. (e) Analysis of the one-dimensional angularimage signature to determine an angular position. (Upper panel) Summingof radial intensities from panel (d) yields an angular signature S̄(θ ) (darkercurve). The mirror image of the radial signature is shown as the lighter curve.(Middle panel) Cross-correlation curve of the radial signature with its mir-ror image. (Lower panel) Closeup on the global maximum of the correlationcurve and schematic of sub-pixel interpolation step to yield a final angularposition.
(1,0):
Slower = S00 +(
S10 − S00
L
)δi , (2)
where L is the distance between these two pixels (in pixelunits, L equals 1) and δi is the value of the x-projection of thepoint (r, θ ) relative to the “left-most” pair of pixels (0,0) and(0,1) located nearest to the y-axis. The value of Slower is showngraphically in Fig. 2(c). Analogously, we perform a secondinterpolation along the x-coordinate using the intensities ofthe two pixels (0,1) and (1,1) to yield Supper (Fig. 2(c)). Wethen perform an similar interpolation along the y-coordinateusing Supper, Slower, and δj (the value of the y-projection of thepoint (r, θ ) relative to the “bottom” pair of pixels (0,0) and(1,0)) to yield a best estimate for Sinterpolated(r, θ ) (Fig. 2(c)):
Sinterpolated(r, θ ) = Slower +(
Supper − Slower
L
)δj. (3)
Using this two-dimensional interpolation, we generate a“unfolded” polar map (Fig. 2(d)). Summing this polar mapover the radial coordinate r then yields the desired one-
dimensional angular intensity profile S̄(θ ) (Fig. 2(e), upperpanel, red curve). As expected, S̄(θ ) exhibits the largest am-plitude variations in the angular region in which the smallmarker bead is located (Fig. 2(e), upper panel).
The angular position of the small marker bead cannow be computed by performing a one-dimensional crosscorrelation of S̄(θ ) with its own mirror image S̄(360 − θ )(Fig. 2(e), upper panel). The corresponding correlation curveexhibits a pronounced maximum that is readily detected(Fig. 2(e), central panel). Note that a center-symmetricpattern, for example, a marker located in the center of theunfolded pattern midway between 0◦ and 360◦ as in Fig. 2(d),would yield a correlation peak centered at 0◦. To simplifythe subsequent fitting (see below), the curve halves areswapped such that the resulting correlation peak centers at180◦ instead. Any deviation from a center-symmetric patternmoves the correlation peak away from this defined mid-point.We note that the maximum in the correlation curve shiftstwice as fast as any imposed rotation, yielding tracked anglesthat exhibit a periodicity of π (as opposed to the correct2π ). Additionally, we note that our correlation algorithmdoes not make any use of previously tracked positions, whichimproves its robustness.
Analogously to the (x, y)-tracking procedure describedabove, the precise location of the correlation maximumis determined by a 5-point parabolic fit (Fig. 2(e), lowerpanel). The resulting angular coordinate is scaled by pd/2 toyield an angle in degrees. The expected half-turn periodicity(see above) is corrected a posteriori by removing angularjumps with values sufficiently close to π . Straightforwarddiscrimination between instantaneous phase jumps andphysical signal features is justified as the time response alongthe rotational axis of the bead-tether construct is typicallysignificantly lower than the time interval between successiveacquisition frames.
D. Tracking of the height (z)
The last component in the tracking algorithm involvestracking of the height z of the tethered magnetic bead abovethe surface. Height tracking is performed by monitoringthe changes in the defocused ring pattern when the imagedbead shifts in height relative to the focal plane. To do so, weemploy averaged radial intensity profiles S̄(r). To constructthe S̄(r) profiles, we first define a radial axis r emanatingfrom the previously determined center position (x, y). Thisradial axis is then segmented into bins that typically havea size equal to one pixel unit. To obtain the average radialintensities, we first loop through all pixels (i, j) of the imageand obtain two arrays: one of total pixel intensities SSUM(r)per radial bin, and one of total pixel counts N(r) per radialbin. By combining these two radial arrays, a radial profilecan be computed according to:
S̄(r) = SSUM(r)
N(r). (4)
As in the case of the computation of the one-dimensionalangular intensity profile S̄(θ ), proper computation of the

103707-5 Lipfert et al. Rev. Sci. Instrum. 82, 103707 (2011)
intensities S̄(r) benefits from interpolation. We note that theradius associated with a pixel located at coordinate index(i, j) is ri j = √
(x − xi j )2 + (y − yi j )2, where (xij,yij) are theassociated pixel coordinates and (x, y) represent the previ-ously determined center position of the bead pattern. Whilefor the purposes of computing SSUM(r) and N(r) this radiuscould simply be rounded to the nearest bin value, such round-ing causes strong discretization effects in the final trackingresults (data not shown). Therefore, we instead partition thepixel intensity Sij between the two nearest radial bins rlower
and rupper, again relying on a simple interpolation scheme:SSUM(rlower) is increased by (rupper − rij)/(rupper − rlower) · Sij,and the associated count N(rlower) is increased by a “fractionalcount” equal to (rupper − rij)/(rupper − rlower). The values ofSSUM(rupper) and N(rupper) are similarly computed. Here, thesuffixes “lower” and “upper” refer to the nearest bins withlower and higher radii compared to the radius rij, respectively.After processing all image pixels and in this manner fillingboth radial arrays, we compute the average radial intensityaccording to Eq. (4).
For each tethered magnetic bead, a stack of such radialsignatures is recorded as a function of relative focus heightby displacing the objective in fixed z-increments at the startof an experiment, resulting in a look-up-table (LUT). To trackthe z-coordinate during measurements of tethered magneticbeads, the summed squared difference of an instantaneous ra-dial signature S̄(r) and each row of the LUT results in an errorsignal:
ε(z) = 1
N
∑r
[LUT(z, r) − S̄(r)]2. (5)
The minimum of the function in Eq. (5) designates thefocal plane that best fits the actual image. Analogously to theprocedures employed in tracking (x, y) and θ , a more pre-cise, sub-plane height estimate is obtained by fitting a 5-pointparabolic fit to this error signal.19
IV. RESULTS
A. Evaluation of the tracking algorithmsusing simulated images
To evaluate the performance of our position and angulartracking algorithms, we first test them on simulated bead im-ages and then on experimental data. To evaluate the trackerrelative to an exact reference, we generated artificial bead im-ages closely resembling those obtained via bright-field mi-croscopy. As the positional and angular coordinates of suchsimulated bead images are known exactly, both tracking preci-sion and accuracy can be evaluated as the difference betweensimulated positions and tracked results. Since our primary in-terest is rotational tracking, we focus on a non-translating,purely rotating pattern for which we evaluate the tracked ro-tational coordinate as well as the x-position. The evaluation isperformed in the presence of varying degrees of added noiseto simulate the effects of camera noise.
To simulate bead images that have both an overall patternand a fiducial marker location that closely resembles experi-mentally observed images (Fig. 1), we assign the main beada radius of Rmain and the smaller fiducial bead a radius Rfid
(a)
(c)
(d)
(e)
S/N=6 S/N=14 S/N=73
Radial position
Look-up tableRmain
(x,y)
δfz
Side view
0 180 360
0.0
0.2
0 180 360
0.0
0.2
0 180 360
0.0
0.2
0 180 360
0.00
0.02
0.04
S/N=6S/N=14S/N=73
S/N=6S/N=14S/N=73
Hei
gh
t (z
)
Angle (degrees)Angle (degrees)
Angle (degrees)Angle (degrees)B
ias
(deg
rees
)
Sca
tter
(d
egre
es)
Sca
tter
(p
ixel
s)
Bia
s (p
ixel
s)
Rotation bias Rotation scatter
Translation scatterTranslation bias
Rfid
(b)
FIG. 3. (Color online) Evaluation of the tracker performance using simulatedimages. (a) Simulation geometry, with a main and a fiducial bead, includingthe relative position in the focal plane. (b) Radial fringe pattern as a functionof height, i.e., the artificial look-up-table for the simulated images. (c) Sim-ulated images for three different signal-to-noise levels. (d) Bias (left panel)and scatter (right panel) in the rotation angle for tracking results comparedto preset pattern positions for the three signal-to-noise noise levels shown inpanel (c). (e) Analogous plots for the tracking bias (left panel) and scatter(right panel) in the x-position.
(attached at a vertical angle φ; Fig. 3(a)). For both beads, wegenerate separate patterns defocused from each geometricalcenter according to:
S(i, j) = A ·(
Rmain or fid
Rmain
)3
· sin
(2π
r − f0
λ
)· e
−(r−f0)k0
·(
1 − e−(r−f0)
5λ
), (6)
where r is the respective distance from the main or fiducialbead center, A is a proportionality constant, and the ratio ofthe cubed radii (i.e., the scattering volume) is used to scale theintensity of the bead images. Additionally, the parameters λ
and k0 are representative values for the fringe spacing and thepattern decay length, and f0 indicates the position of the fo-cal plane (thus introducing a simple expanding fringe patternupon defocusing; Fig. 3(b)). Patterns generated in this mannerare superimposed on an image containing a background inten-sity B as well as a Gaussian-distributed noise with a standarddeviation of σ per pixel. For comparison with experimental

103707-6 Lipfert et al. Rev. Sci. Instrum. 82, 103707 (2011)
TABLE II. Overview of parameters used to generate the artificial imageemployed for testing the tracking algorithm.
Parameter Symbol Typical value Units
Image size . . . 140 PixelImage depth . . . 255 Grey levelBackground level B 100 Grey levelNoise level σ 0–50 Grey levelProportionality constant A 75 UnitlessMain bead radius Rmain 20 PixelFiducial bead radius Rfid 15 PixelFiducial bead vertical attachment angle φ 45 DegreesDefocus f0 1–100 UnitlessFringe spacing λ 15 PixelPattern decay k0 45 Pixel
images, we define an empirical signal-to-noise ratio SNe:
SNe =√
S2range − 2
. (7)
We take the range of the image intensity Srange as a mea-sure for signal level, and we estimate a 95% confidence inter-val for the noise via the standard deviation of the intensityat the image’s edges. Using this approach, we find that typicalexperimental 8-bit images exhibit a SNe ratio of between 20and 40 (Figs. 1 and 3(c)).
We next applied our tracking algorithm to series of simu-lated images and compared the results with the exactly knowninput positions (Table II and Figs. 3(d) and 3(e)). The differ-ence between input and tracked positions yields the trackingerror per image. In general, a tracking error consists of twocomponents: the accuracy, i.e., the systematic deviation or“bias” and the precision or “scatter,” i.e., the statistical varia-tion due to noise in the images. The latter is simply evaluatedfor a given pattern position by a series of images that differonly in the statistical noise added. For such a series, the aver-age deviation from the input positions yields the bias, whilethe standard deviation yields the scatter. By performing step-wise position changes, bias and scatter can thus be systemati-cally evaluated for any type of motion.
We evaluated the bias and scatter for simple rotationalmotion in the absence of translation, using three represen-tative noise levels (Fig. 3(c)). We first evaluated the biaserror (Figs. 3(d) and 3(e), left panels) and the scatter error(Figs. 3(d) and 3(e), right panels) for the angular coordinate.We observe a maximum structural deviation from the correctangle of approximately 0.2◦ (Fig. 3(d), left panel) and we ob-serve a 0.1◦ scatter at a S/N ratio of 14 (Fig. 3(d), right panel),which is at the lower range of experimental values. We repeatthe evaluation of the bias error (Fig. 3(e), left panel) and thescatter error (Fig. 3(e), right panel) for the x-coordinate. Asmotion in the x-direction was absent in the simulation, thisanalysis reports on the crosstalk between angular and transla-tional motion axes. The translational axes exhibit a non-zeroscatter of a few hundredths of a pixel, which amountsto a few nanometers in comparable experimental images(Fig. 3(e), right panel). The magnitude of the translational
scatter appears fairly independent of the type of motion per-formed, as can be expected since it stems mainly from cameranoise. For the bias, we observe a deviation in the apparent x-position of at most ∼0.2 pixels (Fig. 3(e), left panel; identicalresults are obtained for the y-coordinate). This confirms thatthe presence of the marker does not strongly bias the positiontracking, and that only very slight crosstalk exists betweenthe angular and translational coordinates. Indeed, this level ofbias corresponds to a few tens of nm given typical magnifi-cations and camera pixel sizes and is to be expected from theresidual perturbation of the pattern associated with a fiducialmarker. We note in many experimental situations only integernumber of magnet turns are considered: if the resultingnumber of bead rotations are also nearly integer, the biasin both position and angle is negligible. Overall, the resultsfor simulated images indicate that our tracking algorithm issufficiently robust against the perturbation introduced by thefiducial marker beads and achieves a precision of ∼0.1◦ and∼1–2 nm for realistic S/N ratios.
B. Experimental results for surface-immobilizedbeads
To establish the performance of our tracking protocolunder experimental conditions, we recorded times traceof CCD images in our magnetic tweezers setup. First, werecorded traces of fixed beads, stuck aspecifically to theflow cell surface (Fig. 4). Tracking fixed beads providesa good way to evaluate the realistic experimental track-ing precision as the expected position and angular signalare constant.26–28 Any apparent motion will include bothinaccuracies of the tracking algorithm and other experi-mental errors, such as mechanical drift, optical aberrations,possible residual motion of the beads, etc. To stay closeto the experimental situation typical of measurements forDNA-tethered beads, we select a pair of fixed beads thatis identical to those used for tethered bead measurements,comprising of a 3.0 μm diameter polystyrene reference beadand a 2.8 μm diameter superparamagnetic bead carrying a1.0 μm diameter fiducial marker bead. Series of CCD imageswere recorded at 30 Hz at different focus settings, withthe bead pair in focus (Fig. 4(a)), ∼2.5 μm below focus(Fig. 4(b)), ∼4.5 μm below focus (Fig. 4(c)), and ∼7.5 μmbelow focus (Fig. 4(d)). Representative images of the “signal”bead carrying a fiducial marker at the corresponding focus set-tings are shown as insets in Fig. 4. The x, y, and z-positions areobtained by subtracting the reference bead position from theposition of the “signal” bead. Importantly, to test the robust-ness of the algorithm, all traces were tracked with the samesettings for the tracking algorithm (Table I). The observedfluctuations in the (x, y, z)-positions are approximately Gaus-sian (Figs. 4(a)–4(d), histograms in the right panels) and thestandard deviations of the fluctuations provide a measure forthe precision of the tracker. For beads positioned 2.5–7.5 μmbelow focus, we find similar precision in x, y, and z with σ x
≈ σ y ≈ σ z ≈ 1.5 nm. If the beads are in focus, the precisiondeteriorates, in particular for the z-tracking (Fig. 4(a)). Thisis to be expected, since the z-tracking relies on the diffractionring pattern, which is much less pronounced if the beads are
103707-7 Lipfert et al. Rev. Sci. Instrum. 82, 103707 (2011)
(b)
(a) (c)
0 10 20 30
0
50
100
150
200
250
Time (s)
x, y
, z
(nm
)
0 50 100Counts
0 10 20 30−0.4−0.2
00.20.4
An
gle
(d
egre
e)
0 200
0 10 20 30
0
10
20
Time (s)
x, y
, z
(nm
)
0 200Counts
Time (s) Counts
0 10 20 30−0.4−0.2
00.20.4
An
gle
(d
egre
e)
0 200Time (s) Counts
0 10 20 30
0
10
20
Time (s)
x, y
, z
(nm
)
0 200Counts
0 10 20 30−0.4−0.2
00.20.4
An
gle
(d
egre
e)
0 200Time (s) Counts
0 10 20 30
0
10
20
Time (s)
x, y
, z
(nm
)
0 200Counts
0 10 20 30−0.4−0.2
00.20.4
An
gle
(d
egre
e)
0 200Time (s) Counts
(d)
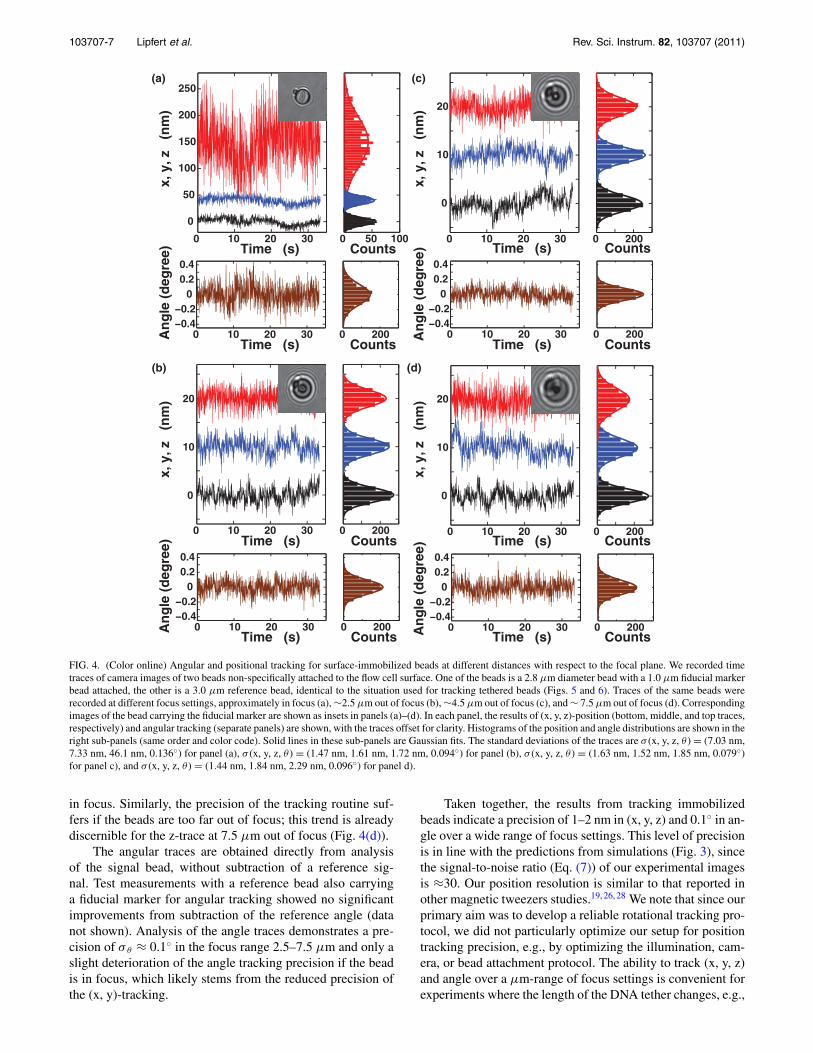
FIG. 4. (Color online) Angular and positional tracking for surface-immobilized beads at different distances with respect to the focal plane. We recorded timetraces of camera images of two beads non-specifically attached to the flow cell surface. One of the beads is a 2.8 μm diameter bead with a 1.0 μm fiducial markerbead attached, the other is a 3.0 μm reference bead, identical to the situation used for tracking tethered beads (Figs. 5 and 6). Traces of the same beads wererecorded at different focus settings, approximately in focus (a), ∼2.5 μm out of focus (b), ∼4.5 μm out of focus (c), and ∼ 7.5 μm out of focus (d). Correspondingimages of the bead carrying the fiducial marker are shown as insets in panels (a)–(d). In each panel, the results of (x, y, z)-position (bottom, middle, and top traces,respectively) and angular tracking (separate panels) are shown, with the traces offset for clarity. Histograms of the position and angle distributions are shown in theright sub-panels (same order and color code). Solid lines in these sub-panels are Gaussian fits. The standard deviations of the traces are σ (x, y, z, θ ) = (7.03 nm,7.33 nm, 46.1 nm, 0.136◦) for panel (a), σ (x, y, z, θ ) = (1.47 nm, 1.61 nm, 1.72 nm, 0.094◦) for panel (b), σ (x, y, z, θ ) = (1.63 nm, 1.52 nm, 1.85 nm, 0.079◦)for panel c), and σ (x, y, z, θ ) = (1.44 nm, 1.84 nm, 2.29 nm, 0.096◦) for panel d).
in focus. Similarly, the precision of the tracking routine suf-fers if the beads are too far out of focus; this trend is alreadydiscernible for the z-trace at 7.5 μm out of focus (Fig. 4(d)).
The angular traces are obtained directly from analysisof the signal bead, without subtraction of a reference sig-nal. Test measurements with a reference bead also carryinga fiducial marker for angular tracking showed no significantimprovements from subtraction of the reference angle (datanot shown). Analysis of the angle traces demonstrates a pre-cision of σ θ ≈ 0.1◦ in the focus range 2.5–7.5 μm and only aslight deterioration of the angle tracking precision if the beadis in focus, which likely stems from the reduced precision ofthe (x, y)-tracking.
Taken together, the results from tracking immobilizedbeads indicate a precision of 1–2 nm in (x, y, z) and 0.1◦ in an-gle over a wide range of focus settings. This level of precisionis in line with the predictions from simulations (Fig. 3), sincethe signal-to-noise ratio (Eq. (7)) of our experimental imagesis ≈30. Our position resolution is similar to that reported inother magnetic tweezers studies.19, 26, 28 We note that since ourprimary aim was to develop a reliable rotational tracking pro-tocol, we did not particularly optimize our setup for positiontracking precision, e.g., by optimizing the illumination, cam-era, or bead attachment protocol. The ability to track (x, y, z)and angle over a μm-range of focus settings is convenient forexperiments where the length of the DNA tether changes, e.g.,
103707-8 Lipfert et al. Rev. Sci. Instrum. 82, 103707 (2011)
if the stretching force is adjusted or if the DNA is supercoiledduring the experiment, processes that will typically give riseto ∼μm changes in tether length and therefore bead height.
C. Experimental results for tethered beadsand multi-bead tracking
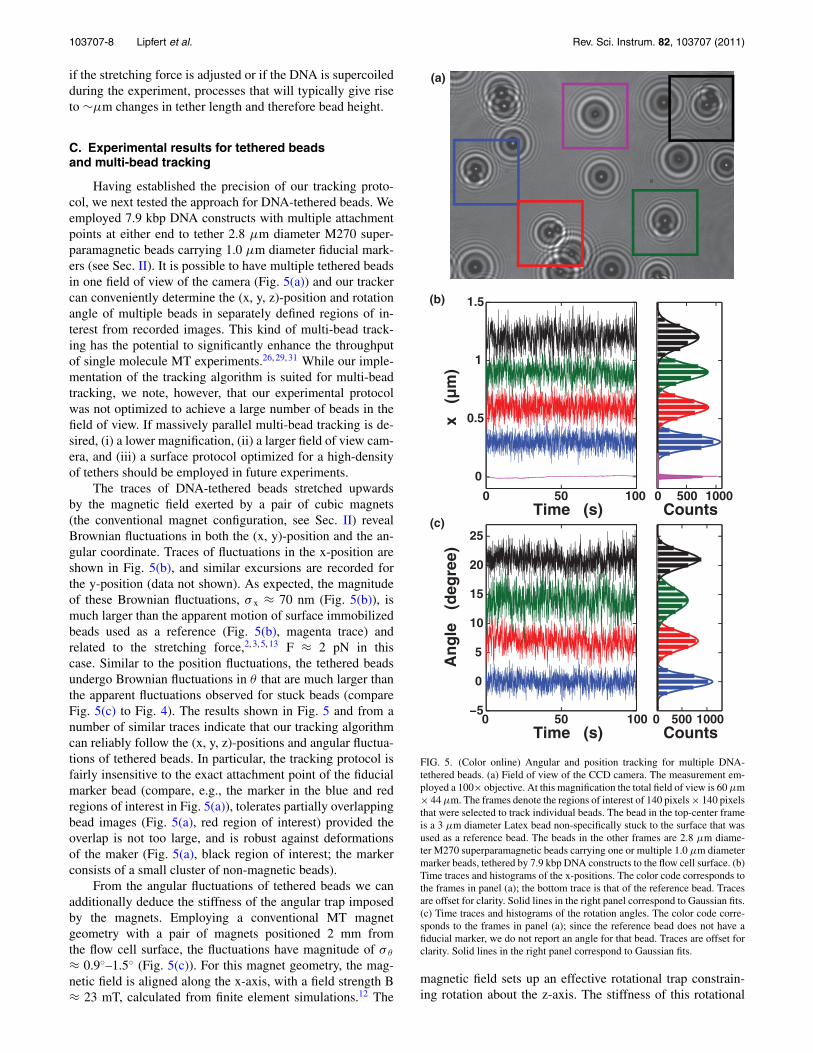
Having established the precision of our tracking proto-col, we next tested the approach for DNA-tethered beads. Weemployed 7.9 kbp DNA constructs with multiple attachmentpoints at either end to tether 2.8 μm diameter M270 super-paramagnetic beads carrying 1.0 μm diameter fiducial mark-ers (see Sec. II). It is possible to have multiple tethered beadsin one field of view of the camera (Fig. 5(a)) and our trackercan conveniently determine the (x, y, z)-position and rotationangle of multiple beads in separately defined regions of in-terest from recorded images. This kind of multi-bead track-ing has the potential to significantly enhance the throughputof single molecule MT experiments.26, 29, 31 While our imple-mentation of the tracking algorithm is suited for multi-beadtracking, we note, however, that our experimental protocolwas not optimized to achieve a large number of beads in thefield of view. If massively parallel multi-bead tracking is de-sired, (i) a lower magnification, (ii) a larger field of view cam-era, and (iii) a surface protocol optimized for a high-densityof tethers should be employed in future experiments.
The traces of DNA-tethered beads stretched upwardsby the magnetic field exerted by a pair of cubic magnets(the conventional magnet configuration, see Sec. II) revealBrownian fluctuations in both the (x, y)-position and the an-gular coordinate. Traces of fluctuations in the x-position areshown in Fig. 5(b), and similar excursions are recorded forthe y-position (data not shown). As expected, the magnitudeof these Brownian fluctuations, σ x ≈ 70 nm (Fig. 5(b)), ismuch larger than the apparent motion of surface immobilizedbeads used as a reference (Fig. 5(b), magenta trace) andrelated to the stretching force,2, 3, 5, 13 F ≈ 2 pN in thiscase. Similar to the position fluctuations, the tethered beadsundergo Brownian fluctuations in θ that are much larger thanthe apparent fluctuations observed for stuck beads (compareFig. 5(c) to Fig. 4). The results shown in Fig. 5 and from anumber of similar traces indicate that our tracking algorithmcan reliably follow the (x, y, z)-positions and angular fluctua-tions of tethered beads. In particular, the tracking protocol isfairly insensitive to the exact attachment point of the fiducialmarker bead (compare, e.g., the marker in the blue and redregions of interest in Fig. 5(a)), tolerates partially overlappingbead images (Fig. 5(a), red region of interest) provided theoverlap is not too large, and is robust against deformationsof the maker (Fig. 5(a), black region of interest; the markerconsists of a small cluster of non-magnetic beads).
From the angular fluctuations of tethered beads we canadditionally deduce the stiffness of the angular trap imposedby the magnets. Employing a conventional MT magnetgeometry with a pair of magnets positioned 2 mm fromthe flow cell surface, the fluctuations have magnitude of σ θ
≈ 0.9◦–1.5◦ (Fig. 5(c)). For this magnet geometry, the mag-netic field is aligned along the x-axis, with a field strength B≈ 23 mT, calculated from finite element simulations.12 The
(b)
(a)
(c)
0 50 100−5
0
5
10
15
20
25
Time (s)
An
gle
(d
egre
e)
0 500 1000Counts
0 50 100
0
0.5
1
1.5
Time (s)
x (
µm
)
0 500 1000Counts
FIG. 5. (Color online) Angular and position tracking for multiple DNA-tethered beads. (a) Field of view of the CCD camera. The measurement em-ployed a 100× objective. At this magnification the total field of view is 60 μm× 44 μm. The frames denote the regions of interest of 140 pixels × 140 pixelsthat were selected to track individual beads. The bead in the top-center frameis a 3 μm diameter Latex bead non-specifically stuck to the surface that wasused as a reference bead. The beads in the other frames are 2.8 μm diame-ter M270 superparamagnetic beads carrying one or multiple 1.0 μm diametermarker beads, tethered by 7.9 kbp DNA constructs to the flow cell surface. (b)Time traces and histograms of the x-positions. The color code corresponds tothe frames in panel (a); the bottom trace is that of the reference bead. Tracesare offset for clarity. Solid lines in the right panel correspond to Gaussian fits.(c) Time traces and histograms of the rotation angles. The color code corre-sponds to the frames in panel (a); since the reference bead does not have afiducial marker, we do not report an angle for that bead. Traces are offset forclarity. Solid lines in the right panel correspond to Gaussian fits.
magnetic field sets up an effective rotational trap constrain-ing rotation about the z-axis. The stiffness of this rotational

103707-9 Lipfert et al. Rev. Sci. Instrum. 82, 103707 (2011)
trap kθ can be determined from the variance of the rotationalfluctuations σ 2
θ :
kθ = kBT
σ 2θ
, (8)
where kB is the Boltzmann constant and T is the absolute tem-perature. Fluctuations with σ θ ≈ 1◦ correspond to a torsionaltrap stiffness kθ ≈ 13 pN μm/rad. Our measurement for M270beads can be compared to two measurements for M280 beadsreported in the literature. Klaue and Seidel report a value of kθ
≈ 20 pN μm/rad at a field strength similar to our experimentfrom an indirect measurement analyzing the z-fluctuations.28
Janssen et al. propose a simple model for the rotationaltrap stiffness assuming a permanent component of the mag-netization m0, where kθ = m0B. These authors find m0
≈ 10−15 A m2 for M280 beads.23 Their linear model implieskθ ≈ 23 pN μm/rad at B ≈ 23 mT, in reasonable agreementwith the measurement from the z-fluctuations by Klaue andSeidel and within a factor of 2–4 of our measurements onM270 beads, suggesting that the M270 beads used in our ex-periments have a similar, yet somewhat smaller preferred axiscompared to M280 beads.
D. Tracking bead rotation and the torsionalresponse of DNA
Finally, we demonstrate the capability of our trackingprotocol to accurately follow rotating beads and to detectshifts in angular distributions that enable the direct measure-ment of torque. DNA-tethered beads can be rotated about thez-axis by rotating the permanent magnets of either conven-tional MT or MTT. Figure 6(a) shows an example trace ofthe tracked rotation angle of a 2.8 μm diameter M270 beadcarrying a 1.0 μm diameter fiducial marker bead in the MTT.Initially, the magnets are static and the bead undergoes ther-mal fluctuations around its equilibrium angle position. Sub-sequently, the magnets are rotated counterclockwise (corre-sponding to positive rotation angle) by 10 turns. The rotationis readily discerned in the CCD images (Fig. 6(a), top in-set) and accurately followed by the angular tracking protocol(Fig. 6(a), blue trace between ∼100 and 200 s). After com-pleting 10 turns, another plateau of thermal rotational fluc-tuation is recorded (Fig. 6(a), right inset). Subsequently, themagnets are rotated by 10 turns in the opposite (clockwise)direction, returning the tethered bead to its initial rotationalstate.
Systematically rotating the tether bead counterclockwise(clockwise) will overwind (underwind) the DNA tether, pro-vided that the molecule is fully double-stranded and attachedby multiple attachment points at both ends. Over- and un-derwinding DNA molecules in this fashion leads to the ac-cumulation of torsional strain after a number of rotations.Due to this accumulation of torsional strain, over- or under-wound molecules exert a restoring torque τDNA on the bead.The restoring torque can be measured by observing shifts inthe mean angle position of the plateaus, 〈θ–θ0〉, and calibrat-ing the trap stiffness of the magnetic trap kθ from thermal
0 100 200 300 400 5000
2
4
6
8
10
Time (s)
An
gle
(tu
rns)
110 1200
1
123456
200 300
10
10.05
0 50 100
−2
0
2
An
gle
(d
egre
es)
0 300Time (s) Counts
0 50 100
−20
−10
0
10
20
An
gle
(d
egre
es)
0 500Time (s) Counts
(a)
(b)
(c)
1 2 3 4 5 6
FIG. 6. (Color online) Angle tracking of DNA-tethered beads to detect beadrotation and torque. (a) Angle trace of a DNA tethered bead manipulated inthe magnetic torque tweezers. Initially, the bead undergoes equilibrium fluc-tuations; at ∼110 s, the magnets are rotated 10 turns at 0.1 Hz. The rotation ofthe bead is followed by the angular tracking algorithm. The left inset showsa closeup of the angle trace during the first full turn. Selected frames aremarked in the trace and numbered; the corresponding camera images of thebead are shown in the inset on top. After the initial 10 turns, a plateau ofangular fluctuation at the new position is recorded. The right inset shows acloseup of the angular fluctuations around 10 turns. At ∼350 s, the magnetsare rotated in the opposite direction and the bead returns to its initial equi-librium angle position. (b) Angle fluctuation of a DNA-tethered bead held inconventional magnetic tweezers. Trace for a torsionally relaxed molecule at N= 0 turns (dark trace and histogram) and after introducing N = 40 turns (lighttrace and histogram). The solid lines in the right panel are Gaussian fits to thedata. Due to the large stiffness of the angular trap in the conventional mag-netic tweezers configuration systematic changes in the equilibrium angle aredifficult or impossible to detect. (c) Angle fluctuation of a DNA-tethered beadheld in magnetic torque tweezers. Trace for a torsionally relaxed molecule atN = 0 turns (dark trace and histogram) and after introducing N = 40 turns(light trace and histogram). The solid lines in the right panel are Gaussianfits to the data. The restoring torque exerted by the DNA molecule leads to areadily detectable change in the angle distribution.
fluctuations (Eq. (8)):
τDNA = −kθ 〈θ − θ0〉. (9)

103707-10 Lipfert et al. Rev. Sci. Instrum. 82, 103707 (2011)
The challenge is to reliable detect the changes in equi-librium angle for biologically relevant torques (see, e.g., Cro-quette and coworkers for an overview16). As an illustrativeexample, we consider DNA under a stretching force of F ≈ 2pN, a biologically relevant force and typical situation in mag-netic tweezers experiments. If overwound at a stretching forceof 2 pN, DNA will initially accumulate torsional strain andeventually undergo a buckling transition and form plectone-mic supercoils. The critical buckling torque is ≈20 pN nm,which is the maximum torque signal expected under theseconditions.
In a conventional MT geometry at F ≈ 2 pN, the equilib-rium fluctuations have a width of σ θ ≈ 0.9◦, correspondingto a trap stiffness of 16 600 pN nm/rad (Fig. 6(b)). Conse-quently, the shift in equilibrium angle expected for a torqueof 20 pN nm is 0.0012 rad or 0.07◦, which is smaller thanour angular resolution. Comparing traces of angular fluctua-tions at n = 0 turns (i.e., torsionally relaxed DNA) and at n= 40 turns (which is just past the buckling transition for our7.9 kbp DNA construct), it is impossible to reliably detectthe systematic changes due to the restoring torque exerted bythe DNA in the conventional MT configuration (Fig. 6(b)). Ingeneral, random scatter in the mean angle by a few tenths ofa degree will correspond to torques of ∼100 pN nm for con-ventional MT, larger than the characteristic torques exerted byDNA.15
In contrast, magnets in the MTT configuration providea much softer angular trap than the conventional MT. Con-sidering again an example traces for a 7.9 kbp DNA con-struct at F ≈ 2 pN, the width of the equilibrium fluctuationsin the MTT is σ θ ≈ 7◦, corresponding to a trap stiffness of≈ 270 pN nm/rad (Fig. 6(c)). As a consequence, the restor-ing torque exerted by the DNA after n = 40 turns is read-ily detectable as a systematic shift of angular equilibriumposition compared to the n = 0 measurement (Fig. 6(c)).In general, torques in the range of 1–10 pN nm give riseto shifts ≥1◦ in MTT measurements, enabling the reliablydetection of biologically relevant torques using our trackingalgorithm.15
V. CONCLUSIONS
We present a tracking protocol that allows us to deter-mine the (x, y, z)-position and rotation angle for beads in MTexperiments from analysis of CCD camera images. Evalua-tion of the tracking accuracy using both simulated imagesand experimental data indicates an accuracy of ∼1–2 nm in(x, y, z) and 0.1◦ in angle. The (x, y, z)-resolution is compa-rable to conventional magnetic tweezers measurements,24, 26
despite the presence of the fiducial marker bead employed forangular tracking. The angular resolution of 0.1◦ is approxi-mately that expected from a simple position resolution argu-ment: two points separated by ≈1900 nm (corresponding toa 0.5 μm radius marker beads attached to a 1.4 μm radiusmagnetic bead) that can be localized to within ≈2 nm suggestan angular uncertainty of ∼2 nm × 2 nm/1900 nm ≈ 0.002rad ≈ 0.1◦. This simple order-of-magnitude argument is notspecific to the details of our tracking algorithm; it generallysuggests that it is unlikely for any angular tracking algorithm
to yield significantly better resolution than 0.1◦, without usingmuch larger fiducial markers than our current implementationfor the tracking.
The angular resolution of our algorithm enables themeasurements of biologically relevant torques in a MTTscheme,15 while maintaining the essentially capabilities ofconventional MT, in particular (x, y, z) and force res-olution. The development of implementations of torquetweezers14–16, 18, 30 is a recent and exciting development thathas great potential in a range of biological applications. A par-ticular promising direction is the implementation of massivelyparallel tracking approaches that monitor tens to hundreds ofbeads simultaneously. Our tracker is intrinsically multi-beadtracking enabled, the challenges ahead are mostly in optimiz-ing the imaging system and surface functionalization to beable to routinely track large number of beads. In addition, thetracking protocol described here is likely to be useful not onlyin MTT applications, but for other biophysical measurementsas well, for example, in tethered particle motion or for thetracking of only approximately spherical particles.
ACKNOWLEDGMENTS
We thank Marijn van Loenhout, Iwijn De Vlaminck, Johnvan Noort, Xander Janssen, Leo van IJzendoorn, and MennoPrins for stimulating discussions, Tessa Jager for help withmeasurements, Jelle van der Does, Dimitri Roos, and JaapBeekman for help with the instrumentation, and SusanneHage and Serge Donkers for providing the DNA constructs.This work was supported by Delft University of Technologyand by the Netherlands Organisation for Scientific Research(NWO).
1T. Strick, J. Allemand, V. Croquette, and D. Bensimon, Prog. Biophys. Mol.Biol. 74(1–2), 115 (2000).
2K. C. Neuman and A. Nagy, Nat. Methods 5(6), 491 (2008).3I. D. Vilfan, J. Lipfert, D. A. Koster, S. G. Lemay, and N. H. Dekker, inHandbook of Single-Molecule Biophysics, edited by P. Hinterdorfer andA. van Oijen (Springer, New York, 2009).
4M. Manosas, A. Meglio, M. M. Spiering, F. Ding, S. J. Benkovic,F. X. Barre, O. A. Saleh, J. F. Allemand, D. Bensimon, and V. Croquette,Methods Enzymol. 475, 297 (2010).
5T. R. Strick, J. F. Allemand, D. Bensimon, A. Bensimon, and V. Croquette,Science 271(5257), 1835 (1996).
6T. R. Strick, V. Croquette, and D. Bensimon, Proc. Natl. Acad. Sci. U.S.A.95(18), 10579 (1998); J. F. Allemand, D. Bensimon, R. Lavery, and V.Croquette, ibid. 95(24), 14152 (1998); A. Crut, P. A. Nair, D. A. Koster,S. Shuman, and N. H. Dekker, ibid. 105(19), 6894 (2008); O. A. Saleh,D. B. McIntosh, P. Pincus, and N. Ribeck, Phys. Rev. Lett. 102(6), 068301(2009).
7J. A. Abels, F. Moreno-Herrero, T. van der Heijden, C. Dekker, andN. H. Dekker, Biophys. J. 88(4), 2737 (2005).
8T. R. Strick, V. Croquette, and D. Bensimon, Nature 404(6780), 901 (2000);D. A. Koster, V. Croquette, C. Dekker, S. Shuman, and N. H. Dekker, ibid.434(7033), 671 (2005).
9T. Lionnet, M. M. Spiering, S. J. Benkovic, D. Bensimon, and V. Croquette,Proc. Natl. Acad. Sci. U.S.A. 104(50), 19790 (2007).
10B. Maier, D. Bensimon, and V. Croquette, Proc. Natl. Acad. Sci. U.S.A.97(22), 12002 (2000); A. Revyakin, C. Liu, R. H. Ebright, and T. R. Strick,Science 314(5802), 1139 (2006).
11T. R. Strick, M. N. Dessinges, G. Charvin, N. H. Dekker, J. F. Allemand,D. Bensimon, and V. Croquette, Reports Progress Phys. 66(1), 1 (2003).
12J. Lipfert, X. Hao, and N. H. Dekker, Biophys. J. 96(12), 5040 (2009).13A. te Velthuis, J. W. J. Kerssemakers, J. Lipfert, and N. H. Dekker, Biophys.
J. 99(4), 1292 (2010).

103707-11 Lipfert et al. Rev. Sci. Instrum. 82, 103707 (2011)
14A. Celedon, I. M. Nodelman, B. Wildt, R. Dewan, P. Searson, D. Wirtz,G. D. Bowman, and S. X. Sun, Nano Lett. 9(4), 1720 (2009).
15J. Lipfert, J. W. Kerssemakers, T. Jager, and N. H. Dekker, Nat. Methods7(12), 977 (2010).
16F. Mosconi, J. F. Allemand, and V. Croquette, Rev. Sci. Instrum. 82(3), 12(2011).
17Y. Harada, O. Ohara, A. Takatsuki, H. Itoh, N. Shimamoto, and K.Kinosita, Jr., Nature 409(6816), 113 (2001); H. Arata, A. Dupont, J. Mine-Hattab, L. Disseau, A. Renodon-Corniere, M. Takahashi, J. L. Viovy, andG. Cappello, Proc. Natl. Acad. Sci. U.S.A. 106(46), 19239 (2009).
18Z. Bryant, M. D. Stone, J. Gore, S. B. Smith, N. R. Cozzarelli, and C.Bustamante, Nature 424(6946), 338 (2003); J. Gore, Z. Bryant,M. D. Stone, M. Nollmann, N. R. Cozzarelli, and C. Bustamante, ibid.439(7072), 100 (2006).
19C. Gosse and V. Croquette, Biophys. J. 82(6), 3314 (2002).20M. Hayashi and Y. Harada, Nucleic Acids Res. 35(19), e125 (2007).21W. P. Wong and K. Halvorsen, Opt. Express 14(25), 12517 (2006); Opt.
Lett 34(3), 277 (2009); O. Otto, F. Czerwinski, J. L. Gornall, G. Stober,L. B. Oddershede, R. Seidel, and U. F. Keyser, Opt. Express 18(22), 22722(2010).
22J. Lipfert, D. A. Koster, I. D. Vilfan, S. Hage, and N. H. Dekker, MethodsMol. Biol. 582, 71 (2009).
23X. J. Janssen, A. J. Schellekens, K. van Ommering, L. J. van Ijzendoorn,and M. W. Prins, Biosens. Bioelectron. 24(7), 1937 (2009).
24T. Strick, Ph.D. thesis, University of Paris VI, 1999.25T. Pilizota, T. Bilyard, F. Bai, M. Futai, H. Hosokawa, and R. M. Berry,
Biophys. J. 93(1), 264 (2007).26N. Ribeck and O. A. Saleh, Rev. Sci. Instrum. 79(9), 094301
(2008).27K. Kim and O. A. Saleh, Nucleic Acids Res. 37(20), e136 (2009).28D. Klaue and R. Seidel, Phys. Rev. Lett. 102(2), 028302 (2009).29C. Danilowicz, D. Greenfield, and M. Prentiss, Anal. Chem. 77(10),
3023 (2005); K. Halvorsen and W. P. Wong, Biophys. J. 98(11), L53(2010).
30A. La Porta and M. D. Wang, Phys Rev Lett 92(19), 190801 (2004);S. Forth, C. Deufel, M. Y. Sheinin, B. Daniels, J. P. Sethna, andM. D. Wang, Phys. Rev. Lett. 100(14), 148301 (2008).
31M. van Loenhout, J. W. J. Kerssemakers, I. De Vlaminck, and C. Dekker,“Bias-free tracking of spherical particles, enabling nanometer resolution atlow magnification” (submitted).