a method to rescale experimental data with dependence on q2 for dvcs process
TRANSCRIPT

Accepted Manuscript
A method to rescale experimental data with dependence on Q 2 for DVCSprocess
Giacinto Ciappetta
PII: S2211-3797(14)00022-9DOI: http://dx.doi.org/10.1016/j.rinp.2014.05.006Reference: RINP 111
To appear in: Results in Physics
Please cite this article as: Ciappetta, G., A method to rescale experimental data with dependence on Q 2 for DVCSprocess, Results in Physics (2014), doi: http://dx.doi.org/10.1016/j.rinp.2014.05.006
This is a PDF file of an unedited manuscript that has been accepted for publication. As a service to our customerswe are providing this early version of the manuscript. The manuscript will undergo copyediting, typesetting, andreview of the resulting proof before it is published in its final form. Please note that during the production processerrors may be discovered which could affect the content, and all legal disclaimers that apply to the journal pertain.

A method to rescale experimental data with
dependence on Q2 for DVCS process
Giacinto CiappettaDepartment of Physics, University of CalabriaIstituto Nazionale di Fisica Nucleare, Gruppo collegato di CosenzaI-87036 Rende, Cosenza, Italy
E-mail: [email protected]
Abstract. We analyze the procedure for rescaling the DVCS cross section data collected withdifferent invariant mass, W , of the virtual photon - proton system. We suggest a method whichmakes the rescaling more functional to conduct statistical analysis on overall data. The studycan be applied to rescale data collected with different photon virtuality Q2. We also show adependence on Q2 for the δ parameter used to describe the cross section as a function of W .
DVCS; Rescaling
1. IntroductionThe models used to interpret the Deeply Virtual Compton Scattering (DVCS) process arecompared with an overall set of experimental results. This is obtained from several data setscollected at different energies. As shown in Fig. 1, the DVCS is the diffractive scattering of avirtual photon (γ∗) off a proton (p), i.e. γ∗p −→ γp where γ denotes the outgoing photon. Theintegrated cross section can be reported [1] as a simple function:
σ(Q2,W ) ∝ W δ ×(
1Q2
)n
, (1)
where W is the invariant mass of the γ∗p system and Q2 is the virtuality of the photon. δand n are parameters obtained from fits to experimental data, by keeping fixed respectivelythe Q2-value or the W -value. The cross section as a function of Q2, or W , is measured byH1 and ZEUS experiments [1, 2]. The overall set of experimental results is determined by aprocedure consisting in rescaling the values of the raw data measured at different energies. Thisis possible by applying some factors that are used also for the error analysis. As example, theZEUS Collaboration [2] data, taken at W = 89 GeV and Q2 = 9.6 GeV2, were rescaled to the H1Collaboration [1] data, taken at W = 82 GeV and Q2 = 8GeV2, with δ and n respectively fixedto values 0.75 and 1.54 [3]. In this case, the procedure for rescaling depends on the definitionof appropriate normalization factors, which are indicated hereafter with ε. In particular, ε
Q2
represents the normalization factor when we consider the cross section, σ(W ), as a function ofW with fixed Q2; εW represents the normalization factor when considering the cross section,
σ(Q2), as a function of Q2 with fixed W . Using the Eq. (1) we have
σr(W ) =σs(Q2
s,W )σdr(Q2
dr,W )σdr(W ) =
(Q2dr)
ndr
(Q2s)ns
σdr(W ) , (2)
σr(Q2) =σs(Q2,Ws)
σdr(Q2,Wdr)σr(Q2) =
(Ws)δs
(Wdr)δdrσr(Q2) , (3)
where the subscripts “dr”, “s” and “r” respectively denote the data to be rescaled, those consi-dered in scale and the rescaled data. The previous relations allow us to obtain the followingformulas:
εQ2 =
(Q2dr)
ndr
(Q2s)ns
, (4)
εW =(Ws)δs
(Wdr)δdr. (5)
In the “standard” procedure the equalities δdr = δs = δ and ndr = ns = n are considered valid[3], whereby the normalization factor ε
Q2 , for σdr(W ) → σr(W ), is given by the ratio between(Q2
dr)n and (Q2
s)n and the normalization factor εW , for σdr(Q2) → σr(Q2), is given by the ratio
between (Ws)δ and (Wdr)δ. Considering δ = 0.77 and n = 1.54 [1], the ZEUS measurements arerescaled to the Q2 and W values of the H1 measurements through following expressions:
σr(W ) = εQ2 σdr(W ) ' 1.3242σdr(W ) , (6)
σr(Q2) = εW σdr(Q2) ' 0.9389σdr(Q2) . (7)
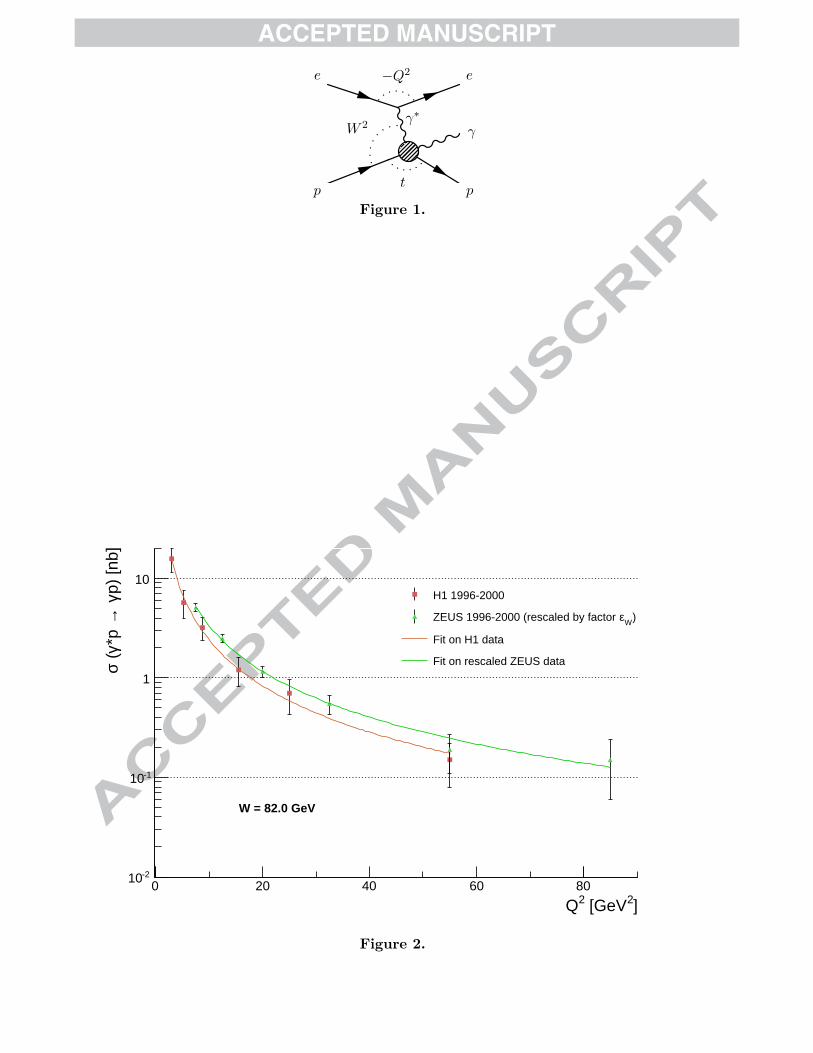
As shown in Fig. 2, where we illustrate the effect of the procedure for rescaling the cross sectionas function of Q2, the rescaled ZEUS data are roughly moved over the H1 data. To highlightthis feature, we fit lines to data in order to catch the general trend of the two data series whichallows us to compare the trends of two data sets.
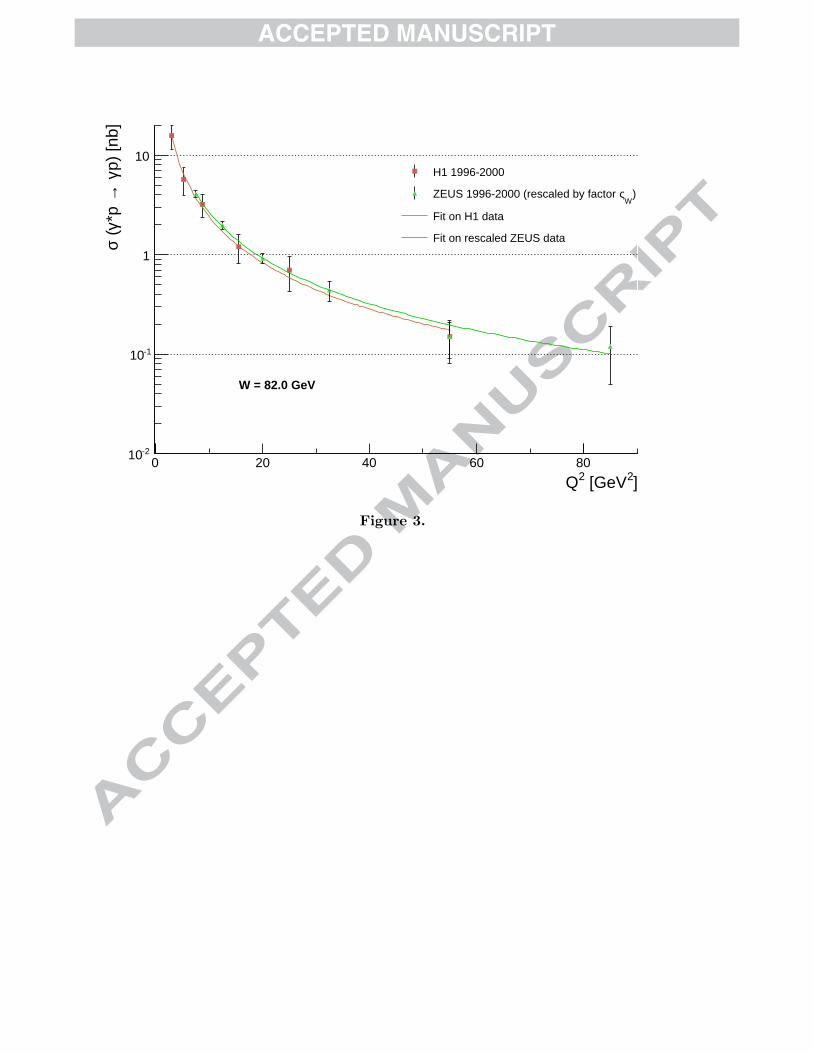
2. New procedureThe analysis of the two fits shown in Fig. 2 evidences that the rescaled ZEUS data tend toremain higher than those of H1; therefore it seems that the “standard” procedure describedabove does not rescale the ZEUS experimental data to those of H1. In particular, data pointsfor Q2 = 55 GeV2 are not superimposed, although they are consistent within the error bars.Indeed, we would expect that, after rescaling, the data will be superimposed when they refer tothe same value of Q2. In this regard, we might consider an alternative rescaling procedure bynormalizing the ZEUS data to those of H1 and using the following normalization factor:
ςW =σs(Q2 = 55 GeV2)σdr(Q2 = 55 GeV2)
=0.150.20
=34
, (8)
where 0.15 and 0.20 are the cross section values measured by ZEUS and H1 experiments at thesame value of Q2. Fig. 3 shows the ZEUS data rescaled according to Eq. (8). As the previousfigures show, the changing of normalization factor has given a better approximation of rescaledZEUS data to those of H1. However, Fig. 3 shows clearly that it is not possible to conductstatistical analysis on overall data. In the current study we suggest that the rescaling procedureshould be based on a a comparison of the trend determined by fit to the rescaled ZEUS data withthe trend determined by fit to the H1 data, i.e. the characteristic parameters of both fits musthave similar values since the fitting curves must be proximate. This observation is physically
correct because the process is the same for both Collaborations, although the data are collectedat different Q2 and W values. In effect, if the ZEUS and H1 data were taken at the same energies,we would expect similar values for the characteristic parameters of the fits. This considerationis the basis of any rescaling procedure. Also to avoid experimenter’s bias, we suggest to considerthe trend of the fits to the data rather than data points itself. Therefore it is necessary toredefine another normalization factor, which we indicate with ζW . The latter can be determinedby varying the value of ςW until there is sound agreement on characteristic parameters of fits, aspreviously highlighted. So we find ζW = 0.67, value for which the parameters of fits describe thesame curve as the Fig. 4 shows. In this case, the fit on overall data gives a n-value compatiblewith that obtained by the H1 Collaboration, i.e. n = 1.54± 0.09± 0.04 [1], where the first erroris statistical, the second systematic.
3. New normalization factor for fixed WAdopting the following power-type function
σ(Q2) = a× [1/Q2
]n (9)
and by performing a fit on H1 data, we have1 as = 83.47 ± 10.96 and ns = 1.54 ± 0.06, withreduced chi-square χ2/d.o.f. = 0.15; these parameters are compatible with those calculatedby performing a fit on the rescaled ZEUS data using ζW factor: aζ
W= 80.99 ± 8.71 and
nr = 1.53 ± 0.04, with χ2/d.o.f. = 0.26. Furthermore, if we use the factor εW for the rescalingprocedure, the fit on rescaled ZEUS data gives aε
W= 113.50± 12.21, which is inconsistent with
as. Hence we must introduce the factor ζW and reject the standard procedure. It’s possible tomove from εW to ζW by applying the following formula:
ζW =aζ
W
aεW
εW ≡ ΞW εW , (10)
where we introduce the factor ΞW . This one may show a W dependence which could not beconsidered taking only the factor εW . The value of ΞW is found from Eq. (10):
ΞW =ζW
εW
' 0.71 . (11)
We might ask if ΞW can be determined using the ratio between the W energies with which theH1 and ZEUS Collaborations have performed their measurements. Actually this event happenswhen we raise the ratio to the fourth power:
ΞW '(
Ws
Wdr
)4
=(
8289
)4
= 0.72 . (12)
Hence, in order to make the rescaling procedure more efficient in statistical terms, it is necessaryto replace εW with the following normalization factor:
ε′W'
(Ws
Wdr
)4+δ
=(
8289
)4+δ
= 0.6766 , (13)
where we use δ = 0.77 [1]. Since the ε′W
value is approximately equal to ζW , the curve in Fig. 4represents approximately the fit of the power function to ZEUS data rescaled by the ε
′W
factor. Ifwe fit the overall data using the function of Eq. 9, we obtain a = 84.21±9.06 and n = 1.54±0.04,with χ2/d.o.f. = 0.26; these parameters are clearly compatible with those obtained by the fit tothe H1 data.1 The statistical analyses conducted here were performed using the program OriginPro [4].

4. Method for rescaling the DVCS data collected at different energiesIntroducing the following function
P(Q,W ) = W 4+δ ×(
1Q2
)n
, (14)
Eq. (1) can be written as
σ(Q2,W ) ∝ 1W 4
P(Q,W ) , (15)
whereby, according the rescaling procedure here proposed, we have to carry out the ratio betweenthe quantities Ps and Pdr:
σr(W ) =Ps(Qs,W )Pdr(Qdr,W )
σdr(W ) , (16)
σr(Q2) =Ps(Q, Ws)Pdr(Q, Wdr)
σdr(Q2) . (17)
In general, the differential cross section for the DVCS process, dσ/dt, can be expressed at highenergies [5] as
dσ
dt=
116π s2
|M|2 , (18)
where the variable t, represented in Fig. 1, is the square of the four-momentum transferred atthe proton vertex, s is the squared centre-of-mass energy of the incoming system, i.e. s = W 2,and M is the DVCS amplitude. If the W dependence of the integrated cross section
∫(dσ/dt) dt
is the same, over the relevant W domain, as the W dependence of the differential cross section2
dσ/dt for t = 〈t〉, then the cross section can be expressed, as indicated in Eq. 15, in termsof W−4. These considerations suggest that the function P is proportional to the integratedsquared modulus of the DVCS amplitude. Therefore, according the Eq. 16 and Eq. 17, theZEUS measurements can be rescaled to the values of the H1 measurements by performing theratio between the integrated squared modula of scattering amplitudes of the process studied inH1 and ZEUS experiments. In this manner it is interesting to note that the rescaling proceduredepends essentially on the scattering amplitudes and that these latter contain all the informationabout the dynamics of the process.
5. Dependence of δ parameter on Q2
In Table 1 we have collected the δ-values calculated by ZEUS and H1 experiments [1, 2, 7, 8].Taking into account that several values are not within the error bars of other values, we considerthe possibility of treating the δ-parameter as function of Q2, contrary to indications in literaturewhich state that δ is independent of Q2 within the errors [8]. All the functions used to fit dataof Table 1 exhibit a similar trend3 especially for low values of Q2. In Fig. 5 two fits are shown:one is logarithmic-type, another one is power-type. The logarithmic-type curve is given by thefollowing equation:
δ(Q2) = δ0 − δ1 ln(Q2 + δ2) , (19)
where δ0 = 0.5421 ± 0.0768, δ1 = −0.0857 ± 0.0389 and δ2 = −2.1511 ± 0.5414, withχ2/d.o.f. = 0.2497; the power-type curve is given by the following equation:
δ(Q2) = δ′[1− (Q2)−δp
], (20)
2 See footnote 14 of Ref. [6].3 Through OriginPro 8 [4] we identified 23 functions able to fit the experimental data of Table 1 with a reducedchi-square value ranging from ∼ 0.2 to ∼ 0.6. The idea is to show that δ is dependent on Q2; nevertheless, it isnot the main interested to statistically analyze the data, but to check, even watching, whether the dependence isactual.
where δ′ = 0.8232± 0.0887 and δp = 0.9137± 0.2455, with χ2/d.o.f. = 0.2051. Since δ is treatedas a function of Q2, we have that the factor ε
′W
depends on Q2:
ε′W
=(
Ws
Wdr
)4+δ(Q2)
. (21)
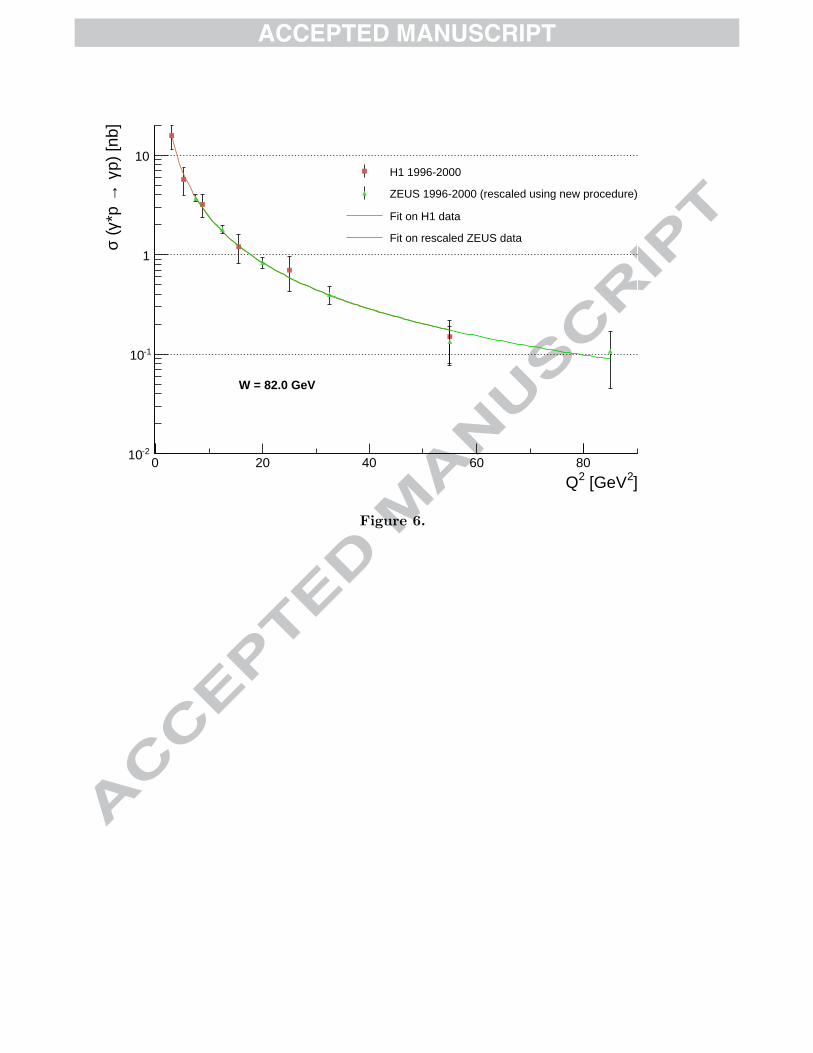
Figure 6 shows the trend determined by fit to the ZEUS data, which are rescaled by using Eq. (21)and Eq. (19). This trend is superimposed to that determined by fit to the H1 data. In effect, byperforming a fit to the rescaled ZEUS data, we have ar = 83.74±8.99 and nr = 1.54±0.04, withχ2/d.o.f. = 0.26; these parameters are compatible with as and ns obtained by performing a fitto the H1 data. It is interesting to note that the trends overlap although the visible dependenceof δ on Q2 has introduced a dependence of ε
′W
on Q2 in an independent manner with respect tothe rescaling analysis conducted in Sec. 3. Clearly, the growth, at low Q2, and the flattening,at high Q2, of δ do not fundamentally modify the rescaling procedure proposed in this paper.
6. ConclusionThrough the analysis conducted here, it appears that at fixed W the ZEUS data [2] may berescaled to H1 ones [1] by using ε
′W
, i.e. by applying Eq. (21) where the δ-parameter is dependenton Q2. The Eq. (15) shows that the new rescaling procedure is consistent with the theoreticalframework, as mentioned in Sec. 4. Therefore, the procedure may be implemented to find asuitable formula to rescale the data taken at different Q2. Then it will be useful to consider δ asa function of Q2, in order to better define its behavior. The results obtained by the adoption ofthe new rescaling procedures will be collected and used in future works, where we will presenta phenomenological model of the DVCS process.
AcknowledgementsThe results here presented were discussed at the earlier stage of this contribution with R. Fiorewho is gratefully acknowledged. Thanks are due to G. Nicastro and V. Pingitore for the helpin preparation of the manuscript. Special thanks to A. Papa for his invaluable advice andencouragement. The autor is grateful to his family for moral and financial support during thiswork.
References[1] A. Aktas, et al., Measurement of deeply virtual Compton scattering at HERA, Eur. Phys. J. C 44 (2005)
1–11. arXiv:hep-ex/0505061, doi:10.1140/epjc/s2005-02345-3.[2] S. Chekanov, et al., Measurement of deeply virtual Compton scattering at HERA, Phys. Lett. B 573 (2003)
46–62. arXiv:hep-ex/0305028, doi:10.1016/j.physletb.2003.08.048.[3] V. Guzey, M. V. Polyakov, Dual parameterization of generalized parton distributions and description of DVCS
data, Eur. Phys. J. C 46 (2006) 151–156. arXiv:hep-ph/0507183, doi:10.1140/epjc/s2006-02491-0.[4] OriginLab Corporation, Northampton, MA 01060 USA.
URL http://originlab.com/
[5] V. Barone, E. Predazzi, High-energy particle diffraction, Berlin, Germany: Springer (2002) 407 p.[6] C. Adloff, et al., Elastic electroproduction of rho mesons at HERA, Eur. Phys. J. C 13 (2000) 371–396.
arXiv:hep-ex/9902019, doi:10.1007/s100520050703.[7] S. Chekanov, et al., A measurement of the Q2, W and t dependences of deeply virtual Compton scattering at
HERA, JHEP 05 (2009) 108. arXiv:hep-ex/0812.2517, doi:10.1088/1126-6708/2009/05/108.[8] F. D. Aaron, et al., Deeply Virtual Compton Scattering and its Beam Charge Asymmetry in e±p Collisions
at HERA, Phys. Lett. B 681 (2009) 391–399. arXiv:hep-ex/0907.5289, doi:10.1016/j.physletb.2009.10.035.

Table 1. δ-values collected by various Collaborations. Only some measurements present twokinds of errors; in these cases, the first are statistical errors and the second ones are systematic.
Q2 [GeV2] δ Reference2.4 0.44± 0.19 ZEUS 1999-2000 [7]3.2 0.52± 0.09 ZEUS 1999-2000 [7]4 0.69± 0.32± 0.17 H1 1996-1997 [1]
6.2 0.75± 0.17 ZEUS 1996-2000 [7]8 0.81± 0.34± 0.22 H1 1999-2000 [1]8 0.61± 0.10± 0.15 H1 2004-2007 [8]
9.6 0.75± 0.15+0.08−0.06 ZEUS 1996-2000 [2]
9.9 0.84± 0.18 ZEUS 1996-2000 [7]15.5 0.61± 0.13± 0.13 H1 2004-2007 [8]18 0.76± 0.22 ZEUS 1996-2000 [7]25 0.90± 0.36± 0.27 H1 2004-2007 [8]
Figure CaptionsFigure 1Diagram illustrating the DVCS. The process is accessed through the reaction ep −→ eγp[1, 2, 7, 8].
Figure 2DVCS cross section σ(γ∗p −→ γp) as function of Q2 for W = 82GeV (|t| < 1.0GeV2, wheret is the four momentum transfer squared at the proton vertex). The error bars represent thestatistical and systematic uncertainties added in quadrature. The experimental data collectedby the ZEUS Collaboration [2] have been rescaled to those collected by the H1 Collaboration[1] using Eq. (7), where εW ' 0.9389.
Figure 3DVCS cross section σ(γ∗p −→ γp) as function of Q2 for W = 82 GeV (|t| < 1.0 GeV2). Theerror bars represent the statistical and systematic uncertainties added in quadrature. Theexperimental data collected by the ZEUS Collaboration [2] have been rescaled to those collectedby the H1 Collaboration [1] using the normalization factor ςW = 3/4 = 0.75 determined byEq. (8).
Figure 4DVCS cross section σ(γ∗p −→ γp) as function of Q2 for W = 82 GeV (|t| < 1.0 GeV2). Theerror bars represent the statistical and systematic uncertainties added in quadrature. Theexperimental data collected by the ZEUS Collaboration [2] have been rescaled to those collectedby the H1 Collaboration [1] using the normalization factor ζW = 0.67 determined in Sec. 2.
Figure 5δ parameter as a function of Q2. The experimental values are given in Table 1. Two fits areshown. The dotted lines indicate the error bands.
Figure 6DVCS cross section σ(γ∗p −→ γp) as function of Q2 for W = 82 GeV (|t| < 1.0 GeV2). Theerror bars represent the statistical and systematic uncertainties added in quadrature. Theexperimental data collected by the ZEUS Collaboration [2] have been rescaled to those collectedby the H1 Collaboration [1] using Equations (21) and (19).
−Q2
γ∗W 2
tp
e
p
γ
e
Figure 1.
]2 [GeV2Q0 20 40 60 80
p) [n
b]γ
→*p
γ
(σ
-210
-110
1
10
W = 82.0 GeV
H1 1996-2000
)WεZEUS 1996-2000 (rescaled by factor
Fit on H1 data
Fit on rescaled ZEUS data
Figure 2.
]2 [GeV2Q0 20 40 60 80
p) [n
b]γ
→*p
γ
(σ
-210
-110
1
10
W = 82.0 GeV
H1 1996-2000
)W
ςZEUS 1996-2000 (rescaled by factor
Fit on H1 data
Fit on rescaled ZEUS data
Figure 3.

]2 [GeV2Q0 20 40 60 80
p) [n
b]γ
→*p
γ
(σ
-210
-110
1
10
W = 82.0 GeV
H1 1996-2000
)W
ζZEUS 1996-2000 (rescaled by factor
Fit on H1 data
Fit on rescaled ZEUS data
Figure 4.

]2 [GeV2Q5 10 15 20 25
)2(Qδ
0.5
1
ZEUS 1999-2000
ZEUS 1996-2000
H1 1996-2000
H1 2004-2007
Fit logarithmic-type
Fit power-type
Figure 5.
]2 [GeV2Q0 20 40 60 80
p) [n
b]γ
→*p
γ
(σ
-210
-110
1
10
W = 82.0 GeV
H1 1996-2000
ZEUS 1996-2000 (rescaled using new procedure)
Fit on H1 data
Fit on rescaled ZEUS data
Figure 6.